


Features
- 6 Unique slides
- Fully editable and easy to edit in Microsoft Powerpoint, Keynote and Google Slides
- 16:9 widescreen layout
- Clean and professional designs
- Export to JPG, PDF or send by email


Do you have any questions?
Recommend


6 slides
Security Systems Infographic
Security systems refer to a combination of hardware and software designed to protect individuals, properties, and assets from various threats and unauthorized access. This infographic template provides an overview of different types of security systems and their components used to safeguard people, property, and data. The infographic aims to simplify complex information about security systems and present it in a visually engaging and easy-to-understand format. This template includes relevant statistics, trends, or case studies related to security breaches and the effectiveness of security systems.


6 slides
Training Jobs Infographics
Explore the dynamic field of Training Jobs with our customizable infographic template. This template is fully compatible with popular presentation software like PowerPoint, Keynote, and Google Slides, allowing you to effortlessly tailor it to highlight specific training job opportunities and information. The Training Jobs infographic template offers a versatile platform for presenting job trends, qualifications, and opportunities within the training industry. Whether you're an HR professional, a job seeker, or involved in talent development, this template provides a user-friendly canvas to create engaging presentations and informative materials. Elevate your understanding of Training Jobs with this SEO-optimized infographic template, designed for clarity and ease of use. Customize it to showcase job roles, required skills, and industry insights, helping both job seekers and employers navigate the training job landscape effectively. Start crafting your personalized infographic today to excel in the world of training employment!


7 slides
Training Program Infographic Presentation
A Training Infographic is a visual representation of information related to a training program or course. This template is a way to present information in a fun and engaging way, and to help learners understand key concepts and skills covered in the training. This template include diagrams, charts, and many training illustrations. It also includes text that explain the main ideas and objectives of the training, and any specific learning outcomes. The purpose of this training Infographic is to help learners engage with the content of the training and to retain information more effectively.


6 slides
Wireless Connectivity with 5G Benefits Presentation
Unlock the power of next-gen wireless connectivity with this sleek, signal-inspired infographic. Ideal for showcasing 5G benefits, this layout visualizes five key advantages in a clear, modern design. Perfect for tech briefings, strategic updates, or educational overviews. Fully compatible with PowerPoint, Keynote, and Google Slides for easy customization.


21 slides
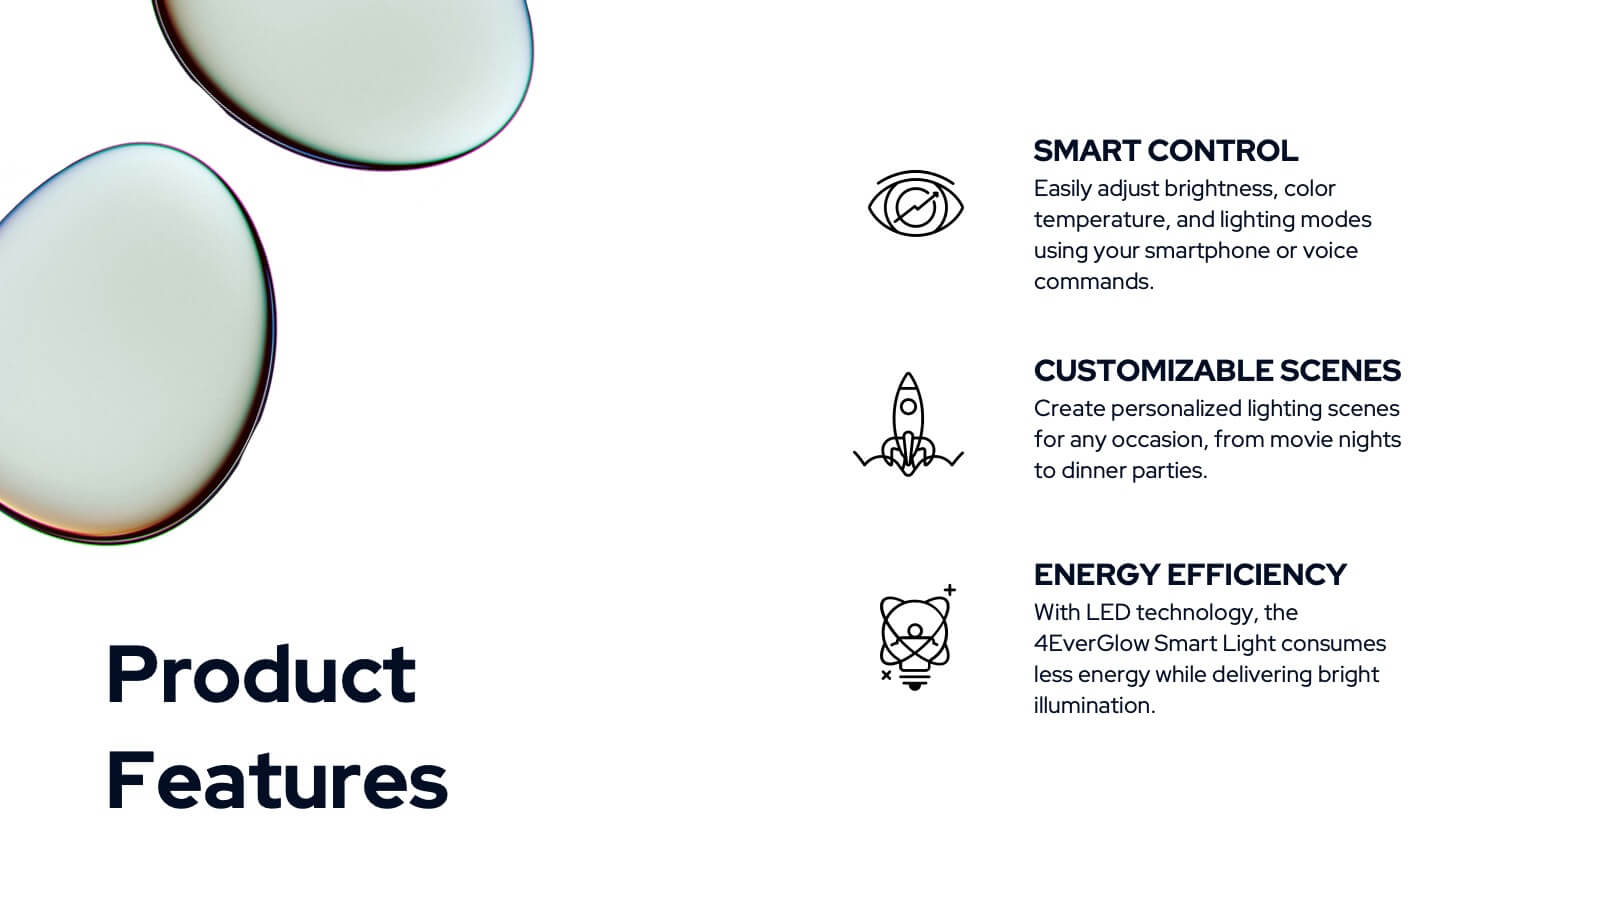
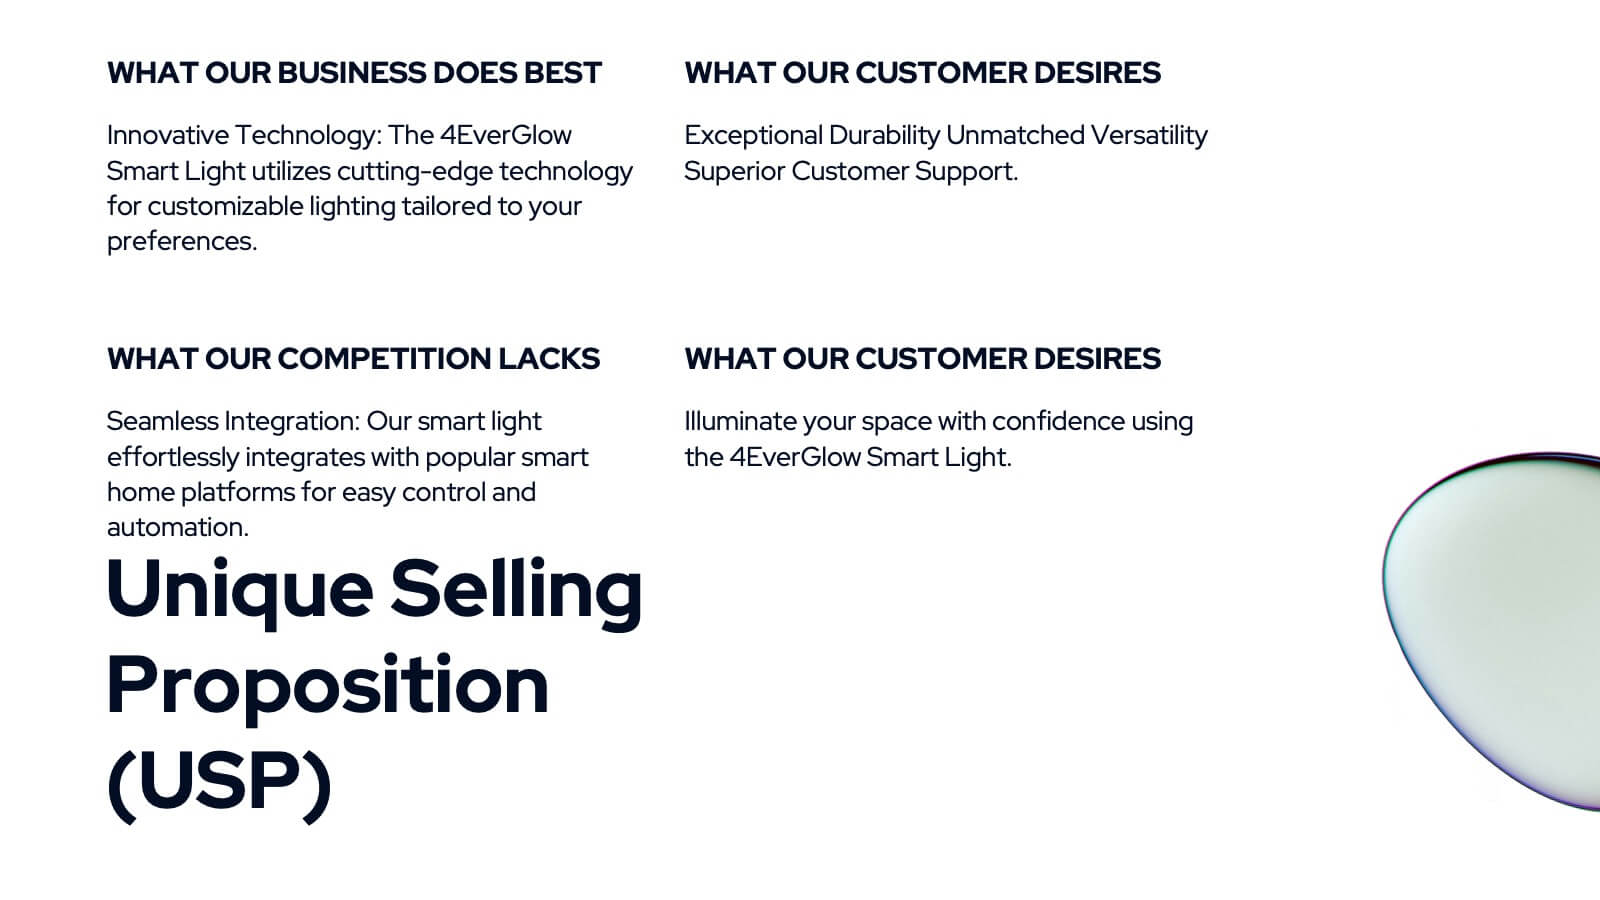
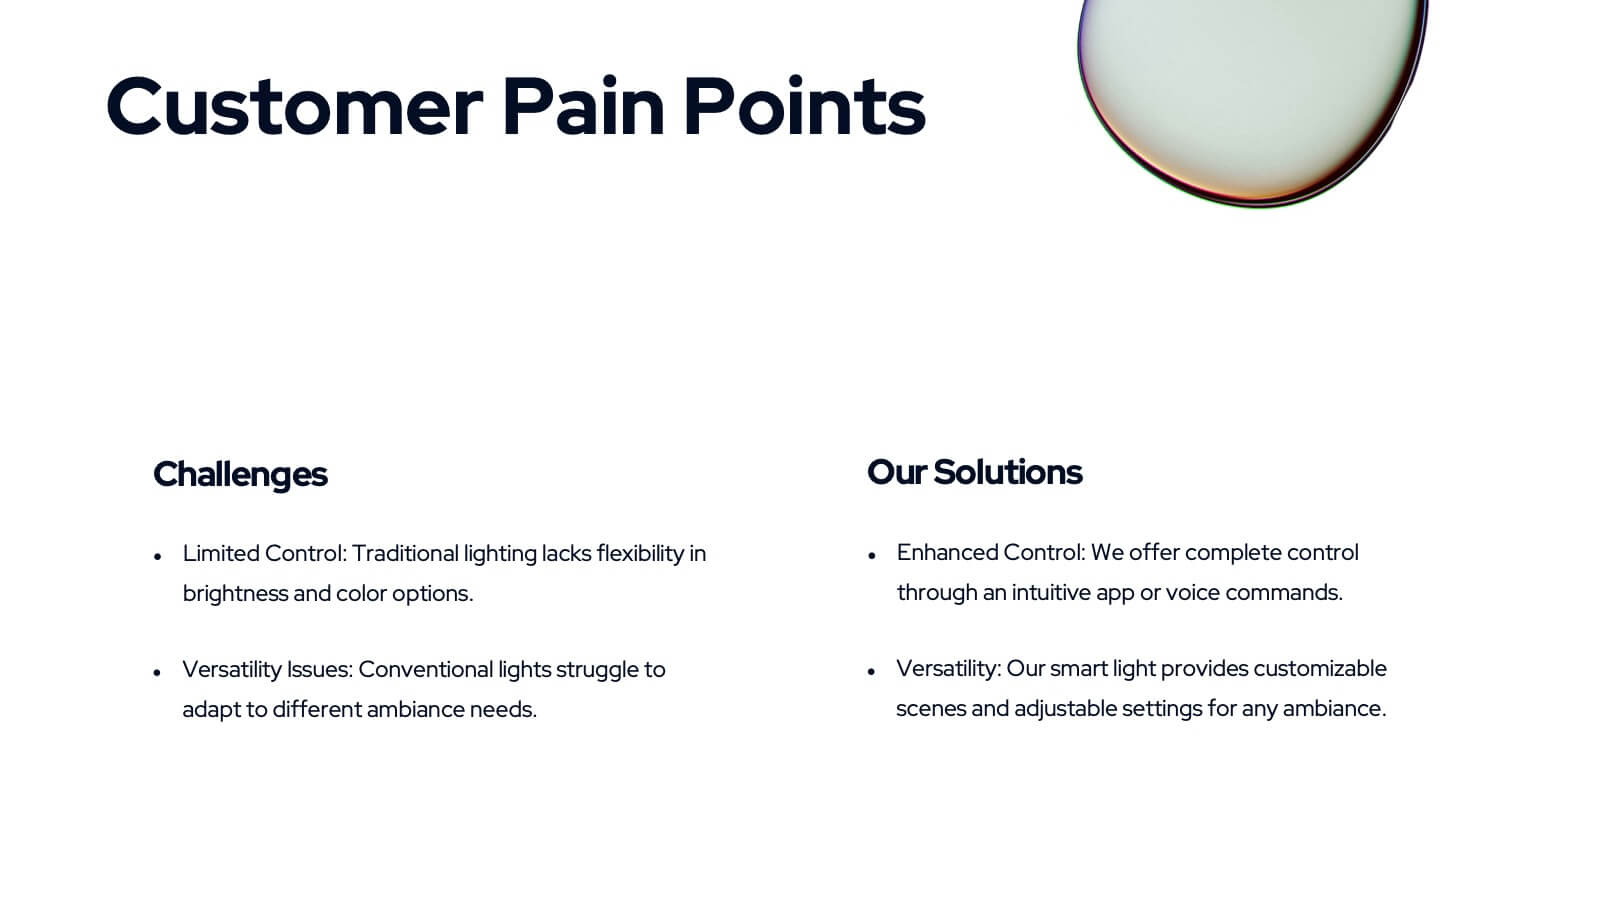
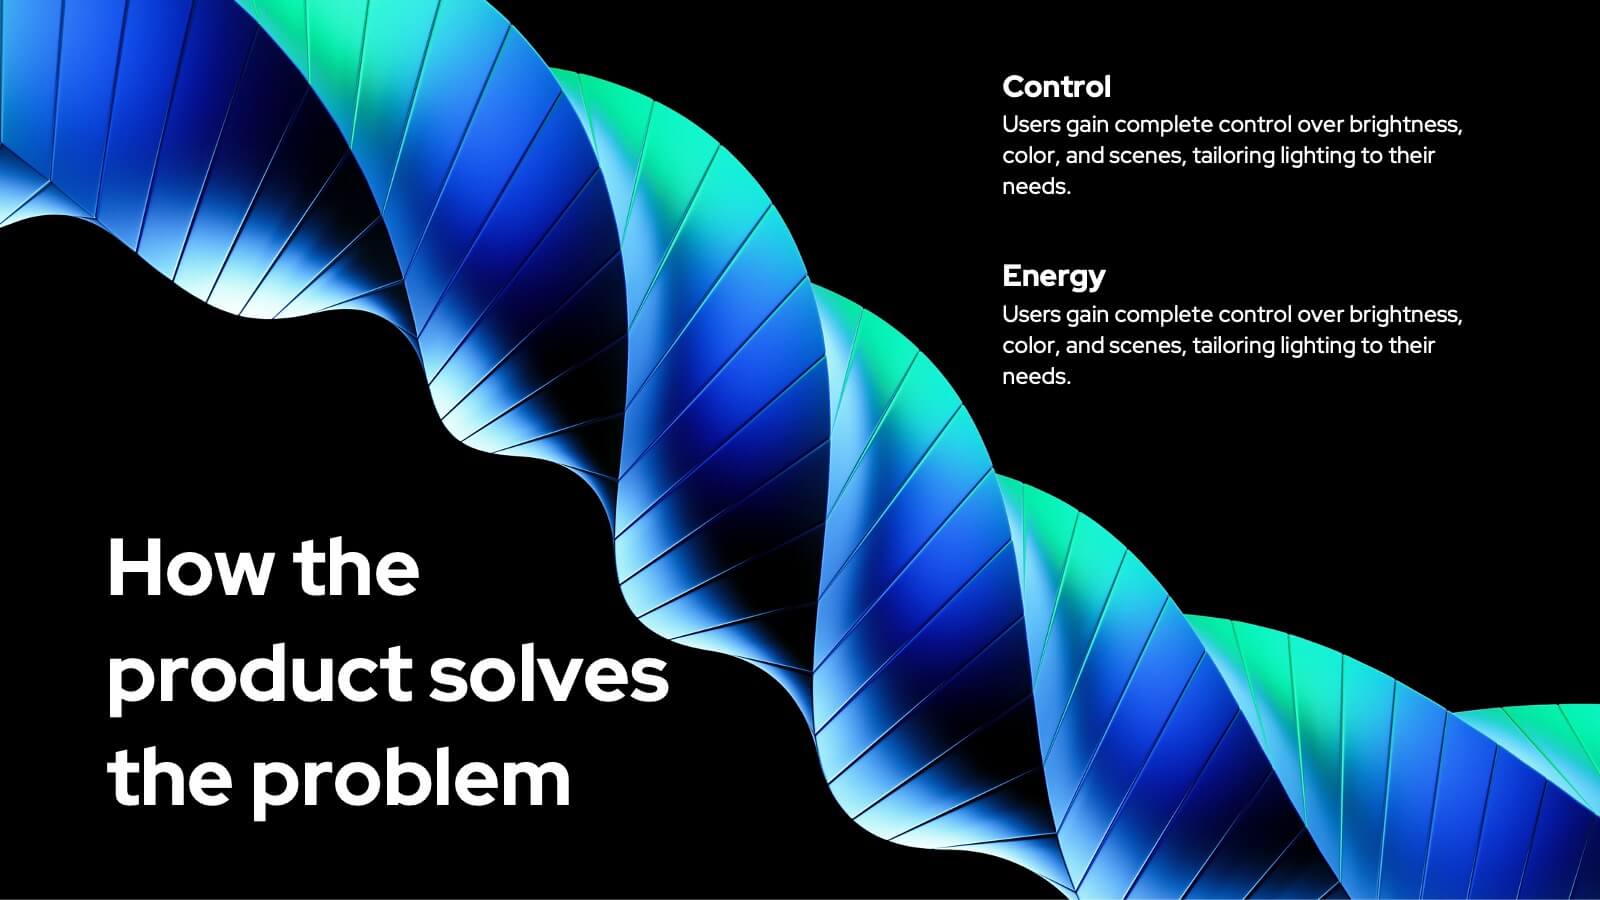
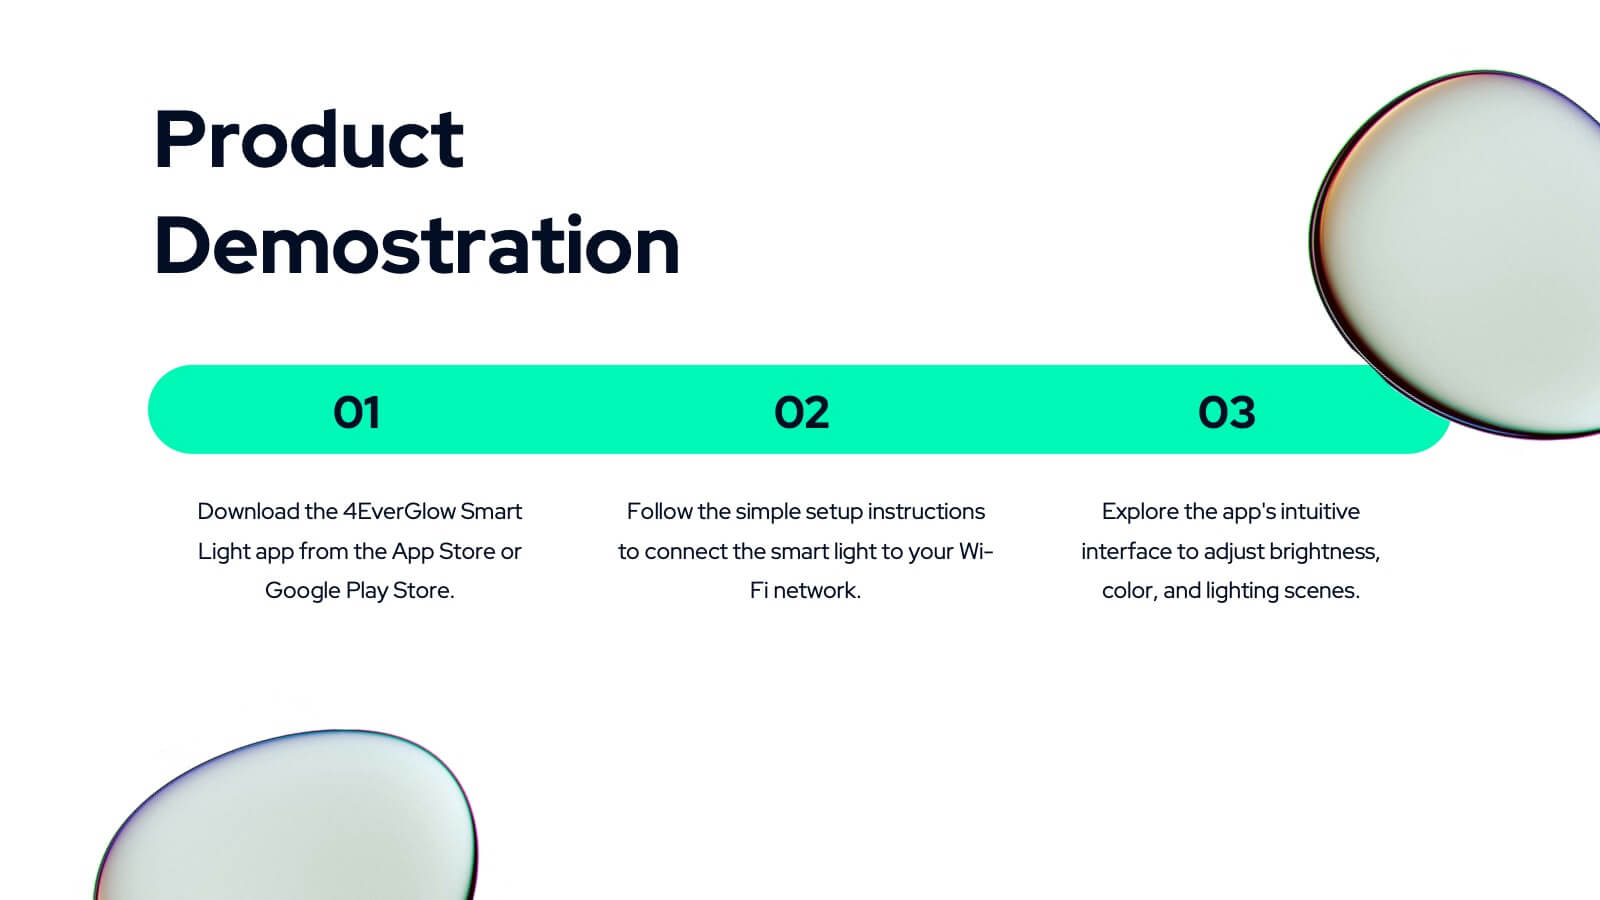
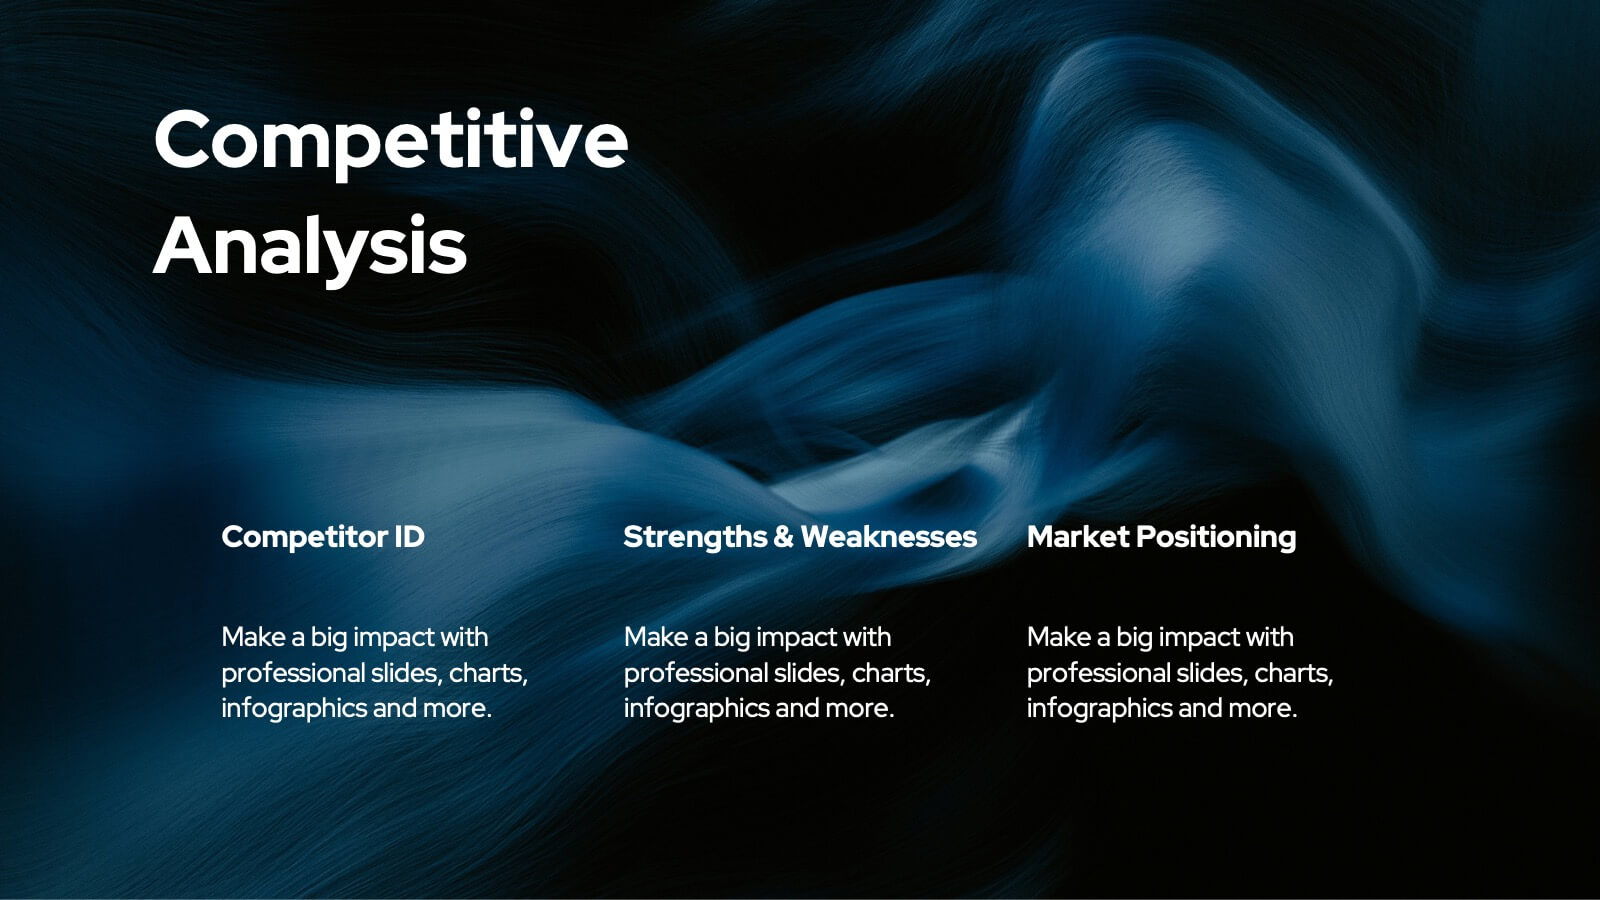
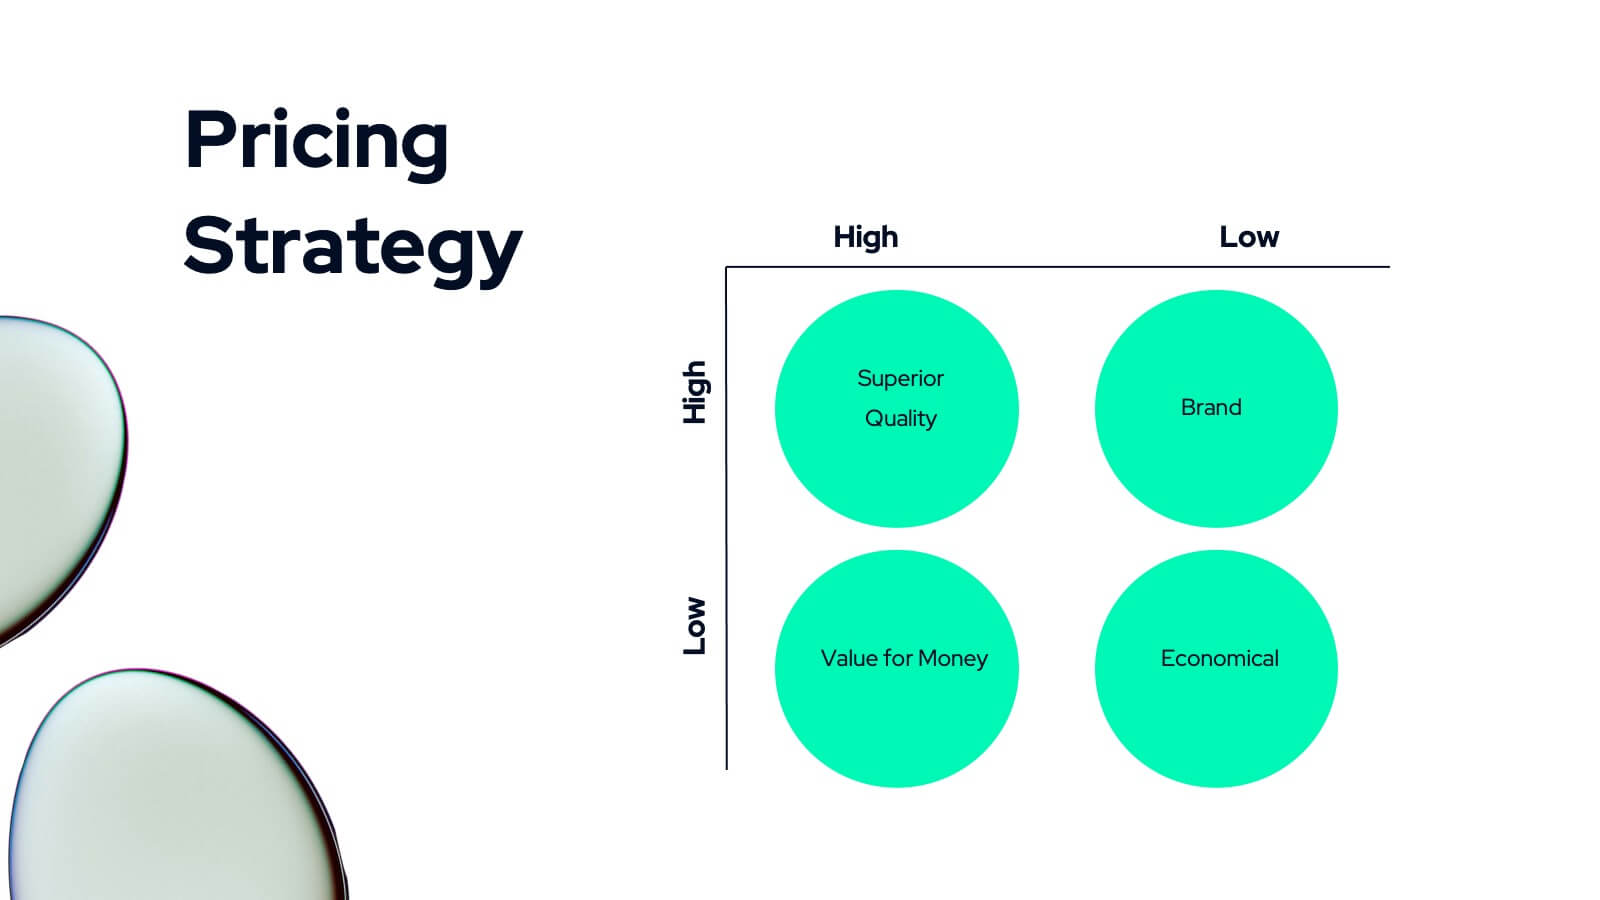
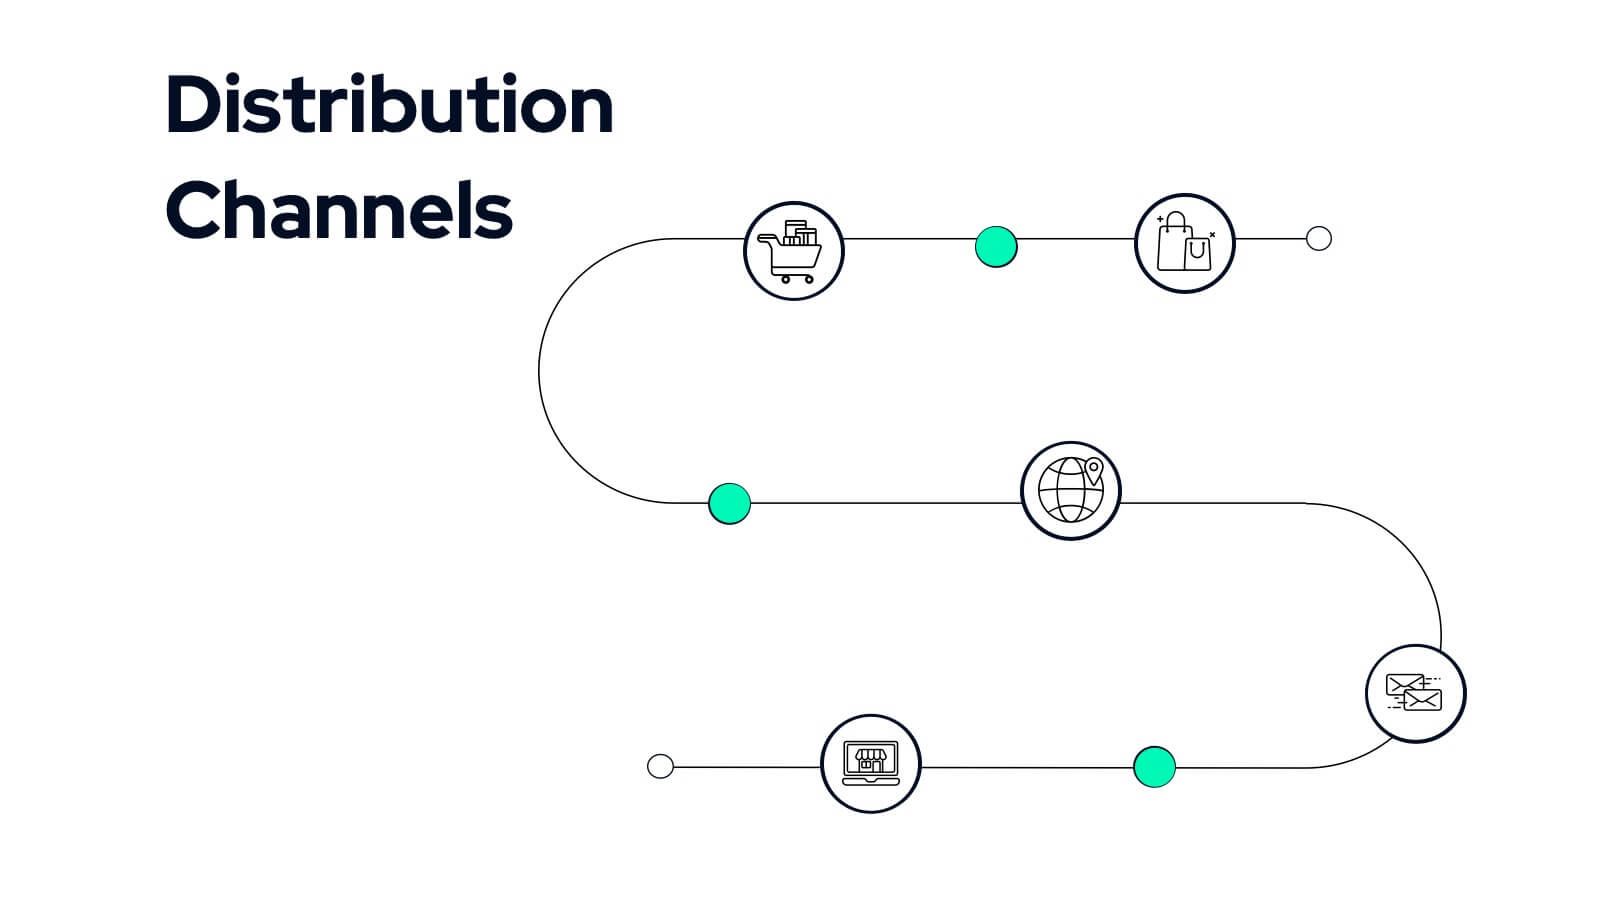
Selkie New Product Proposal Presentation
Dive into your next big idea with this sleek, Selkie-inspired presentation template, designed for presenting a new product proposal! Highlight key features, market opportunities, and potential growth in a visually captivating format that flows effortlessly. Engage your audience and make an impact. Compatible with PowerPoint, Keynote, and Google Slides for easy customization.


5 slides
Travel Planning and Destination Guide Presentation
Highlight your itinerary or destination comparisons with this suitcase-stacked infographic slide. Each luggage icon aligns with a percentage label and text box, helping you present travel data, tips, or packing categories in an engaging and visually organized way. Perfect for travel agencies, bloggers, and vacation planners. Fully editable in PowerPoint, Keynote, and Google Slides.


7 slides
Time Management Strategies Infographic Presentation
Time management is the process of planning, organizing, and allocating time effectively to achieve specific goals and objectives. This simple and professional template shows you the basics of time management. It uses a combination of bullet points, tables and illustrations to give you the information you need in a practical form. Use this presentation as a step-by-step guide on how you can become more efficient at managing daily business tasks. This infographic template is designed to help you manage your time and prioritize your actions by highlighting the different aspects of a task.


7 slides
Veterinary Hospital Infographic
A veterinary hospital, is a medical facility that provides healthcare services to animals, primarily focusing on the diagnosis, treatment, and prevention of illnesses and injuries in pets and other animals. This vibrant and heartwarming infographic template brings to life the journey of our beloved pets through the lens of a caring veterinary hospital. Compatible with Powerpoint, Keynote, and Google Slides. This template celebrates the love, care, and healing that happens every day at veterinary hospitals. This infographic is a haven where wagging tails and purring hearts find comfort and a reason to smile.


20 slides
Dreamlet Marketing Proposal Presentation
Deliver a persuasive marketing proposal with this sleek and modern presentation template. It covers essential topics such as industry trends, social media strategies, influencer marketing, and customer experience, helping you make a strong impact. Perfect for agencies and businesses alike. Compatible with PowerPoint, Keynote, and Google Slides for easy customization.


4 slides
Investor Business Plan One-Pager Presentation
Present your startup vision with clarity using this Investor Business Plan One-Pager. Designed to outline key milestones, growth projections, and funding goals, it’s perfect for pitch decks and investor briefs. Visually dynamic and fully customizable, this one-slide format works seamlessly in PowerPoint, Keynote, and Google Slides—ideal for entrepreneurs and startups.


5 slides
5 Module Online Training Content Presentation
Kick off your training session with a clean, engaging visual that maps out each module in a clear, easy-to-follow flow. This presentation helps you organize lessons, outline learning goals, and guide learners through a structured digital program. Fully compatible with PowerPoint, Keynote, and Google Slides.


23 slides
Twilora Business Plan Presentation
Present your business strategy with a comprehensive and visually engaging template designed to impress stakeholders and investors. This template covers key elements of a business plan, including company background, market opportunities, business objectives, and key milestones. Showcase your product offerings, target audience, and competitive advantages through clear, professional visuals and data-driven charts. Highlight your financial performance, investment opportunities, and operational plans with precision and clarity. Tailor the design to reflect your brand's identity and goals. Fully compatible with PowerPoint, Google Slides, and Keynote, this versatile template is perfect for startups, established businesses, and entrepreneurs aiming to present a strong and compelling business case.


26 slides
Beginner's Guide to Investing Presentation
This presentation template is a fantastic starting point for anyone looking to dive into the world of investing. Designed with clarity and accessibility in mind, it caters specifically to beginners eager to understand the fundamentals of investment strategies and options. The template introduces users to the basics of stocks, bonds, and other investment vehicles, using easy-to-understand language and clear, informative visuals. The content is laid out in a logical sequence, beginning with basic concepts and gradually progressing to more complex investment ideas and strategies. Slides are enriched with diagrams, charts, and comparison tables that break down financial data and trends in a digestible format. Key investment terms are explained through engaging infographics that make learning both interactive and effective. To ensure a broad usability range, the template is fully compatible with popular presentation platforms such as PowerPoint, Google Slides, and Keynote. This compatibility allows users to easily adapt and present the information across different devices and settings, making it an invaluable tool for personal education or group training sessions in various learning environments.


6 slides
Design Thinking 5-Stage Model Presentation
Turn creativity into structured innovation with a clean, circular layout that guides your audience through each phase of problem-solving and ideation. Ideal for workshops, strategy sessions, or innovation pitches, this presentation makes complex processes easy to follow. Fully compatible with PowerPoint, Keynote, and Google Slides for seamless editing.


26 slides
Innovative Business Strategies Presentation
Maximize your business's potential with our Innovative Business Strategies presentation template. This versatile template is a game-changer, compatible with PowerPoint, Keynote, and Google Slides, ensuring seamless integration into any platform you prefer. Crafted to propel your presentations to the next level, it is perfect for entrepreneurs, startups, and corporations aiming to showcase their strategic vision with clarity and impact. The Innovative Business Strategies template includes a variety of slides designed to present complex business strategies in a straightforward, digestible format. It features a clean, professional design that helps convey your message effectively, making it easier for your audience to grasp and remember key points. With customizable graphics and easy-to-edit layouts, you can tailor each slide to fit your brand's unique identity and strategic goals. Whether you're presenting to stakeholders, team members, or at a conference, this template provides the tools you need to communicate your business strategy with confidence. Boost your presentation's visibility and make it the go-to resource for individuals seeking a clear and engaging way to learn about innovative business strategies.


6 slides
Medical Technologies Infographics
Explore the forefront of medical technology with this informative and sleek infographic template, tailored for professionals and students in the medical field. This template effectively presents key advancements and projects in medical technology, using a modern and clear design that is easy to follow. The slides are organized to detail different aspects of technology in healthcare, such as innovation in patient care, technological integration into existing systems, and future trends in the industry. Each section uses vibrant graphics and concise text to highlight important data and statistics, ensuring the information is both accessible and engaging. The color scheme is professionally chosen to represent trust and clarity, utilizing shades of blue and red to differentiate topics effectively. This not only enhances readability but also aligns with the themes of healthcare and technology. This template is a perfect tool for presenting at conferences, in educational settings, or during professional meetings where understanding the impact of technology on healthcare is crucial. It helps to convey complex information in a structured and visually appealing manner, making it an invaluable resource for anyone involved in the health technology sector.


26 slides
Sustainable Business Practices Presentation
Present your eco-friendly business approach with this straightforward template that reflects your commitment to sustainability. It's decked with leafy designs and organic textures that naturally convey your green message. From showcasing your leadership to illustrating growth with intuitive graphs, the template makes it simple to share your vision. Perfect for any platform, like PowerPoint or Google Slides, it’s designed to help you communicate big ideas, like reducing carbon footprints or embracing renewable resources, in a way that’s easy for everyone to grasp. Let this template be the backdrop as you chart a course for a sustainable future, making complex concepts like ‘green initiatives’ and ‘sustainable practices’ clear and actionable.