


Features
- 27 Unique Slides
- Fully editable and easy to edit in Microsoft Powerpoint, Keynote and Google Slides
- 16:9 widescreen layout
- Clean and professional designs
- Export to JPG, PDF or send by email


Do you have any questions?
Recommend


5 slides
Business Meeting Agenda and Planning Presentation
Make every meeting count with this clean and professional agenda timeline. Featuring five circular stages connected in a fluid path, this layout is ideal for breaking down meeting objectives, planning steps, or stakeholder discussions. Fully customizable and compatible with PowerPoint, Keynote, and Google Slides.


10 slides
Customer Survey Feedback Insights Presentation
Highlight key takeaways from your reviews with the Customer Survey Feedback Insights Presentation. This sleek layout uses a vertical timeline with icons and star ratings to present customer input clearly and professionally. Ideal for showcasing survey results, testimonials, or product improvement insights. Fully editable in Canva, PowerPoint, Google Slides, and Keynote.


5 slides
Milestones Timeline Presentation
The "Milestones Timeline Presentation" template is designed to illustrate the chronological development of a project or event. It's an effective visual tool that aligns milestones along a straightforward horizontal pathway, enhancing clarity and focus on important dates and goals. Each milestone is marked with distinct icons and titles, making it easy to convey progress and upcoming objectives. This template is particularly useful for project managers, team leaders, and educators who need to communicate key phases and achievements in a temporal context. It serves as an invaluable asset for meetings, reports, or educational materials, ensuring that each milestone is clearly highlighted and easily understood.


4 slides
Idea Validation and Business Feasibility Presentation
Clarify your strategy with the Idea Validation and Business Feasibility Presentation. This layout uses a sleek, linear flow anchored by a central lightbulb icon to guide your audience through three key checkpoints—validation, feasibility, and readiness. Each step is color-coded and icon-marked to enhance clarity. Fully editable in PowerPoint, Canva, Google Slides, and Keynote.


6 slides
Touchpoint-Based Customer Journey Map Presentation
Visualize each stage of the user experience with this Touchpoint-Based Customer Journey Map presentation. Perfect for tracking interactions across the customer lifecycle—from awareness to loyalty—this layout helps pinpoint strengths and gaps at every phase. Clean columns and color-coded touchpoints ensure quick analysis. Fully compatible with PowerPoint, Canva, and Google Slides.


23 slides
Quest Qualitative Research Findings Presentation
This dynamic and sleek research template presents qualitative findings with style and clarity. Dive into research objectives, data collection, key findings, and future directions, all showcased with a minimalist black-and-white design. Perfect for impactful presentations, this template is compatible with PowerPoint, Keynote, and Google Slides, making it versatile for any audience!


22 slides
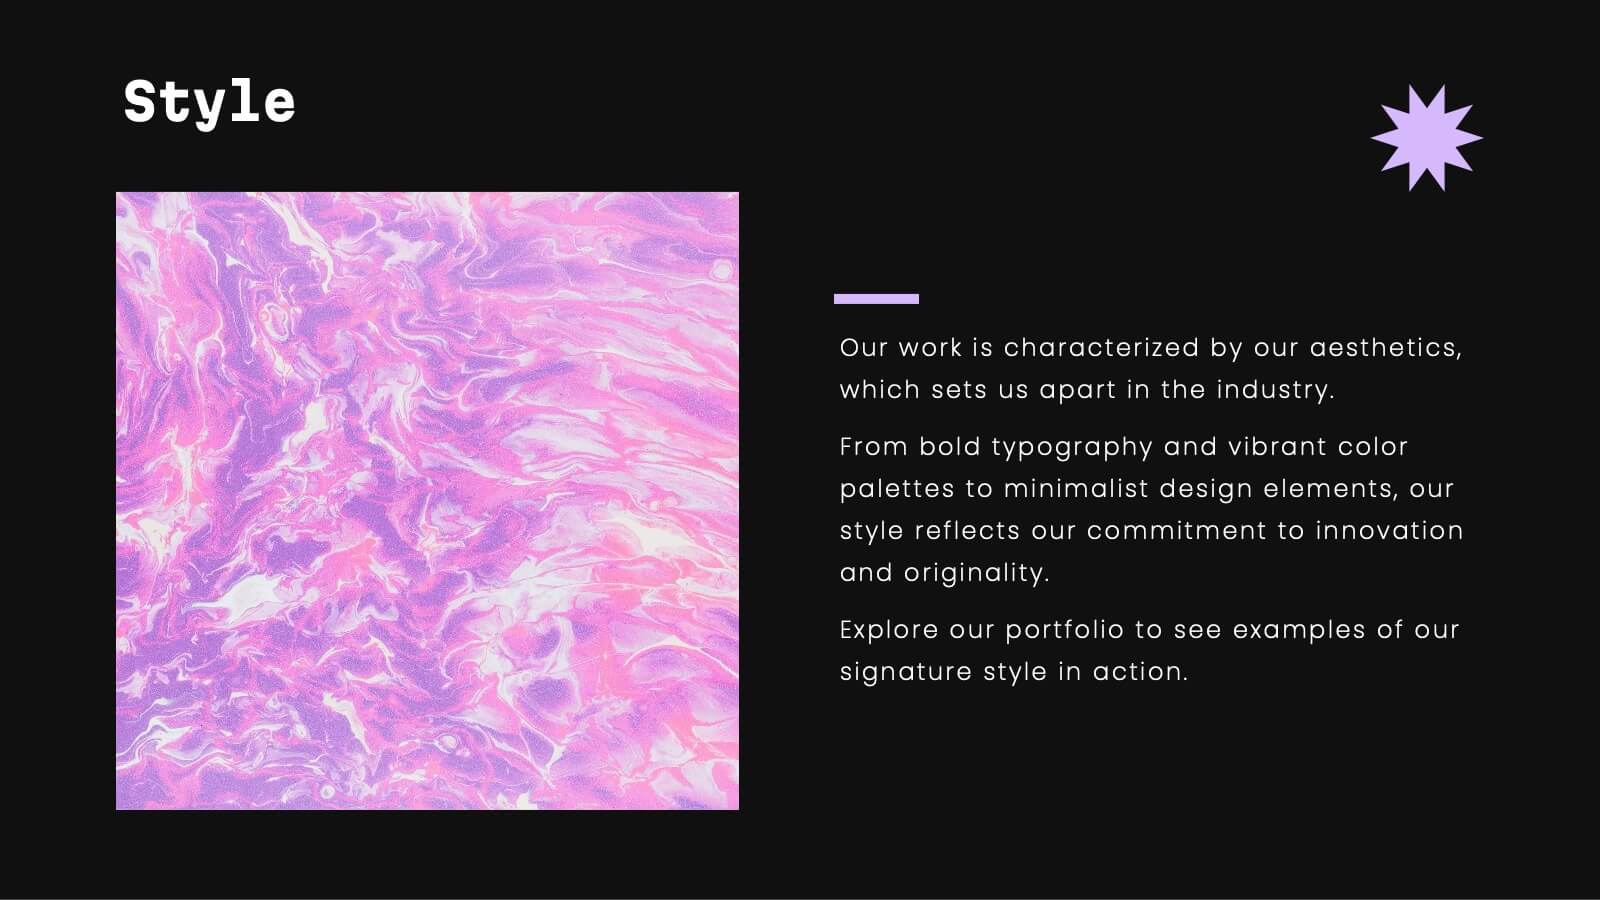
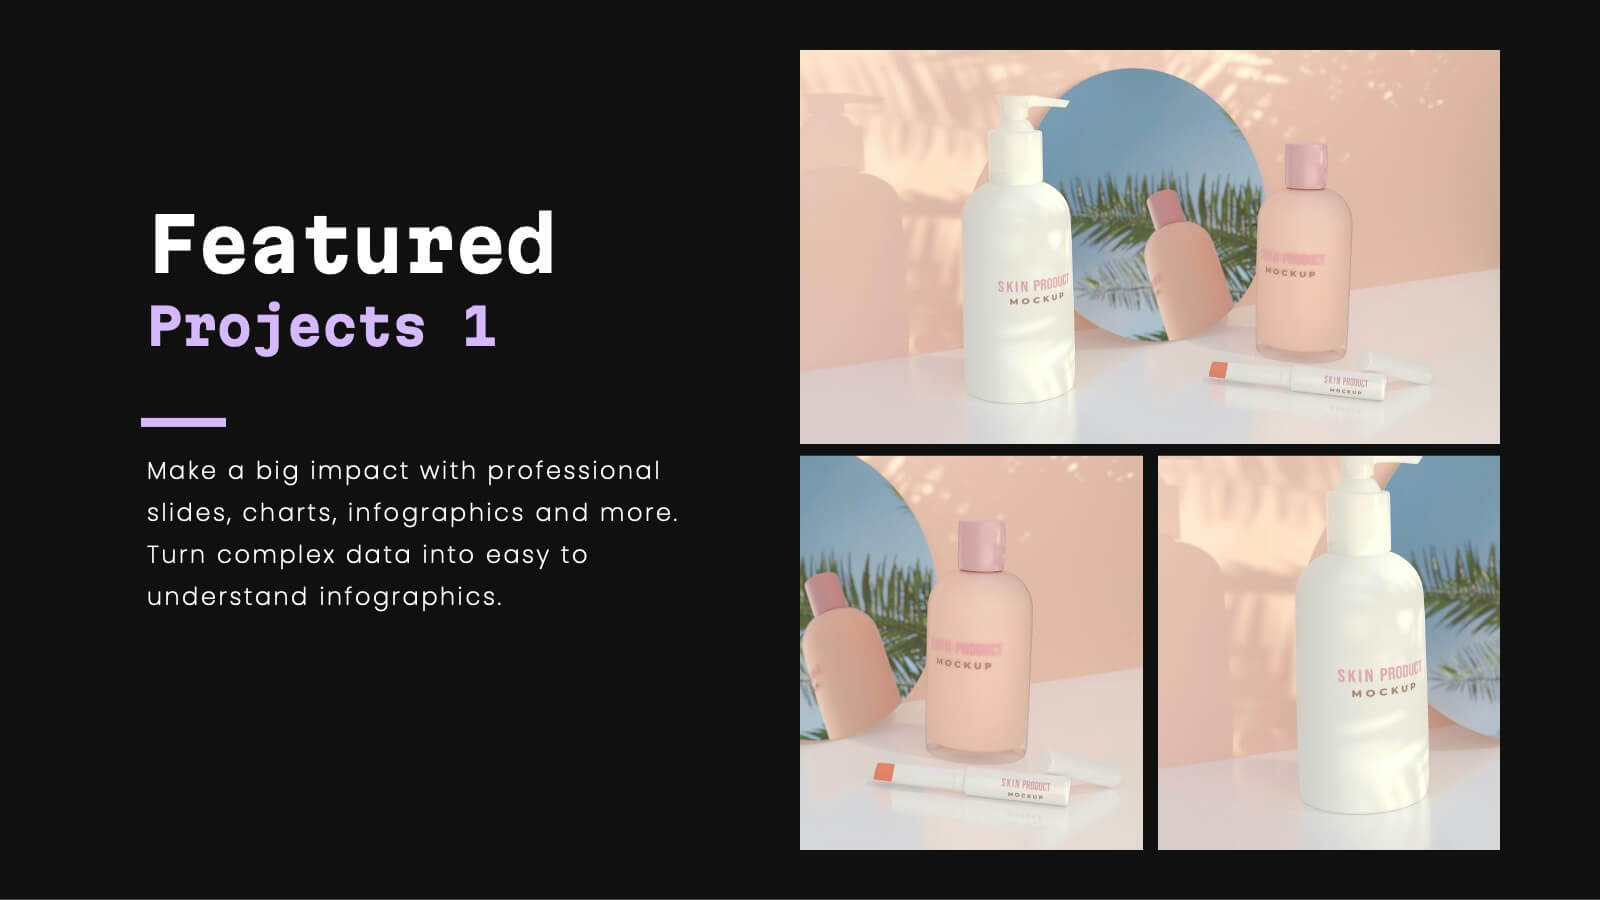
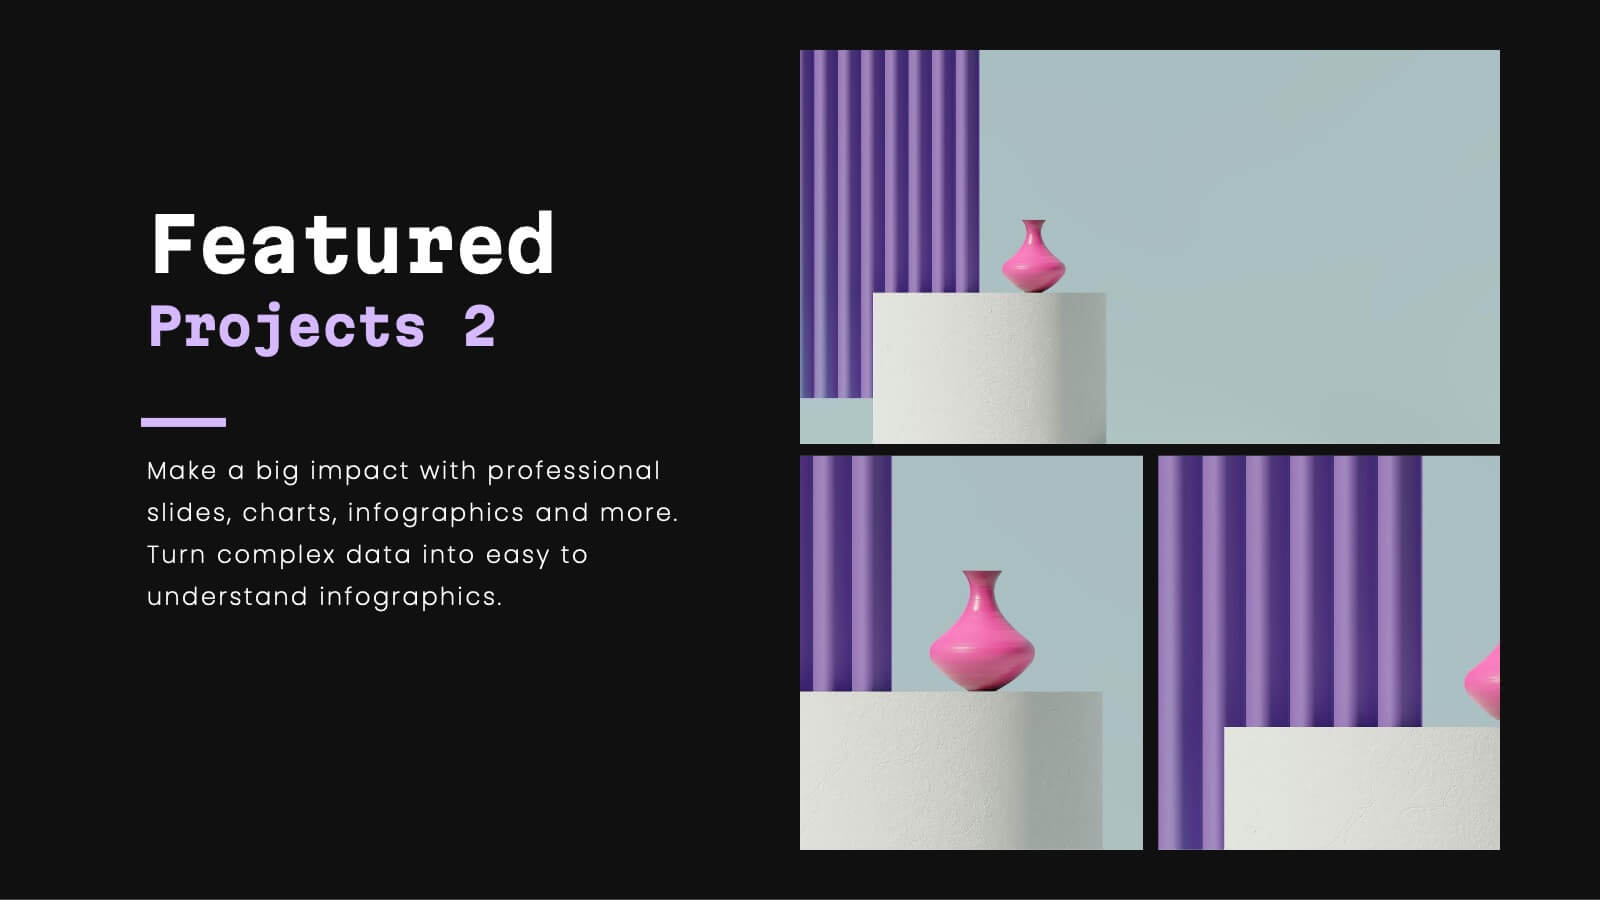
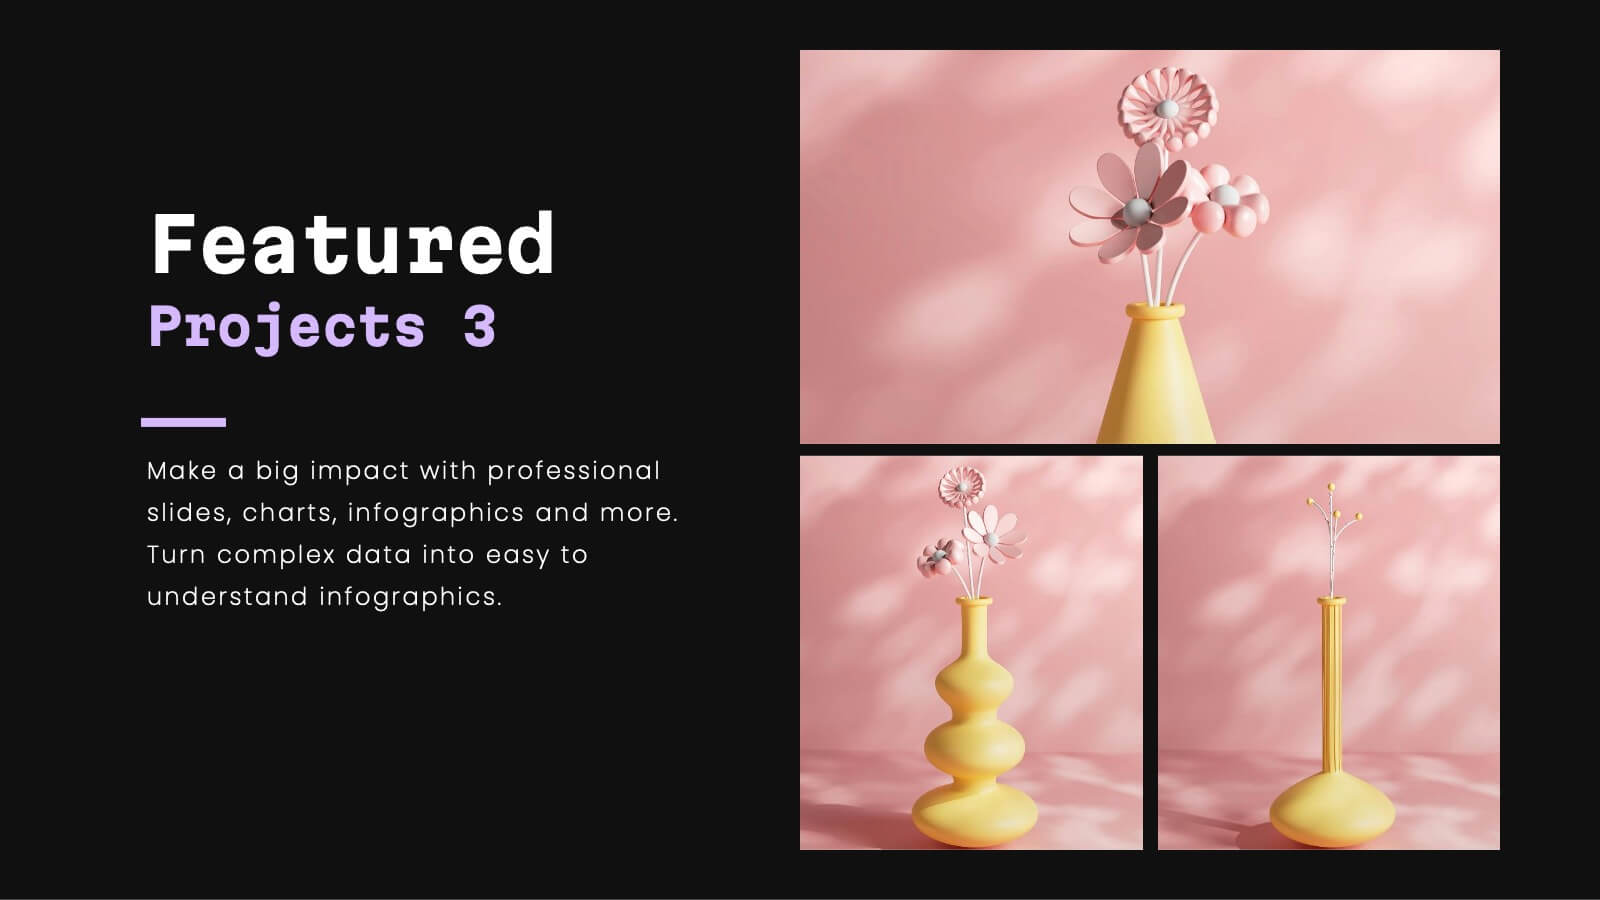
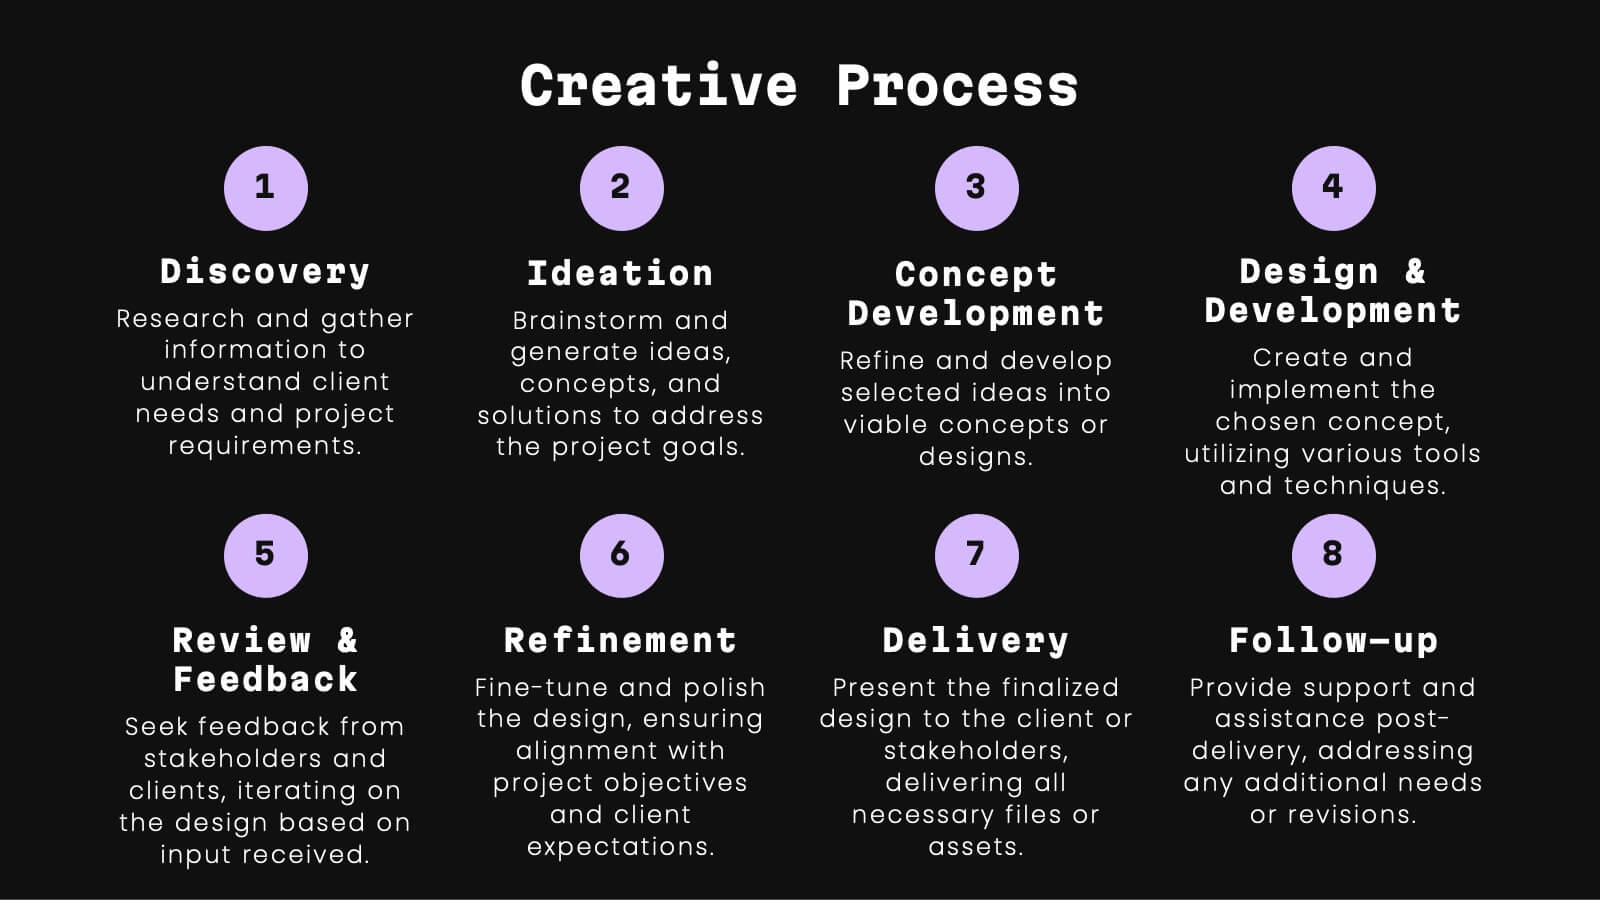
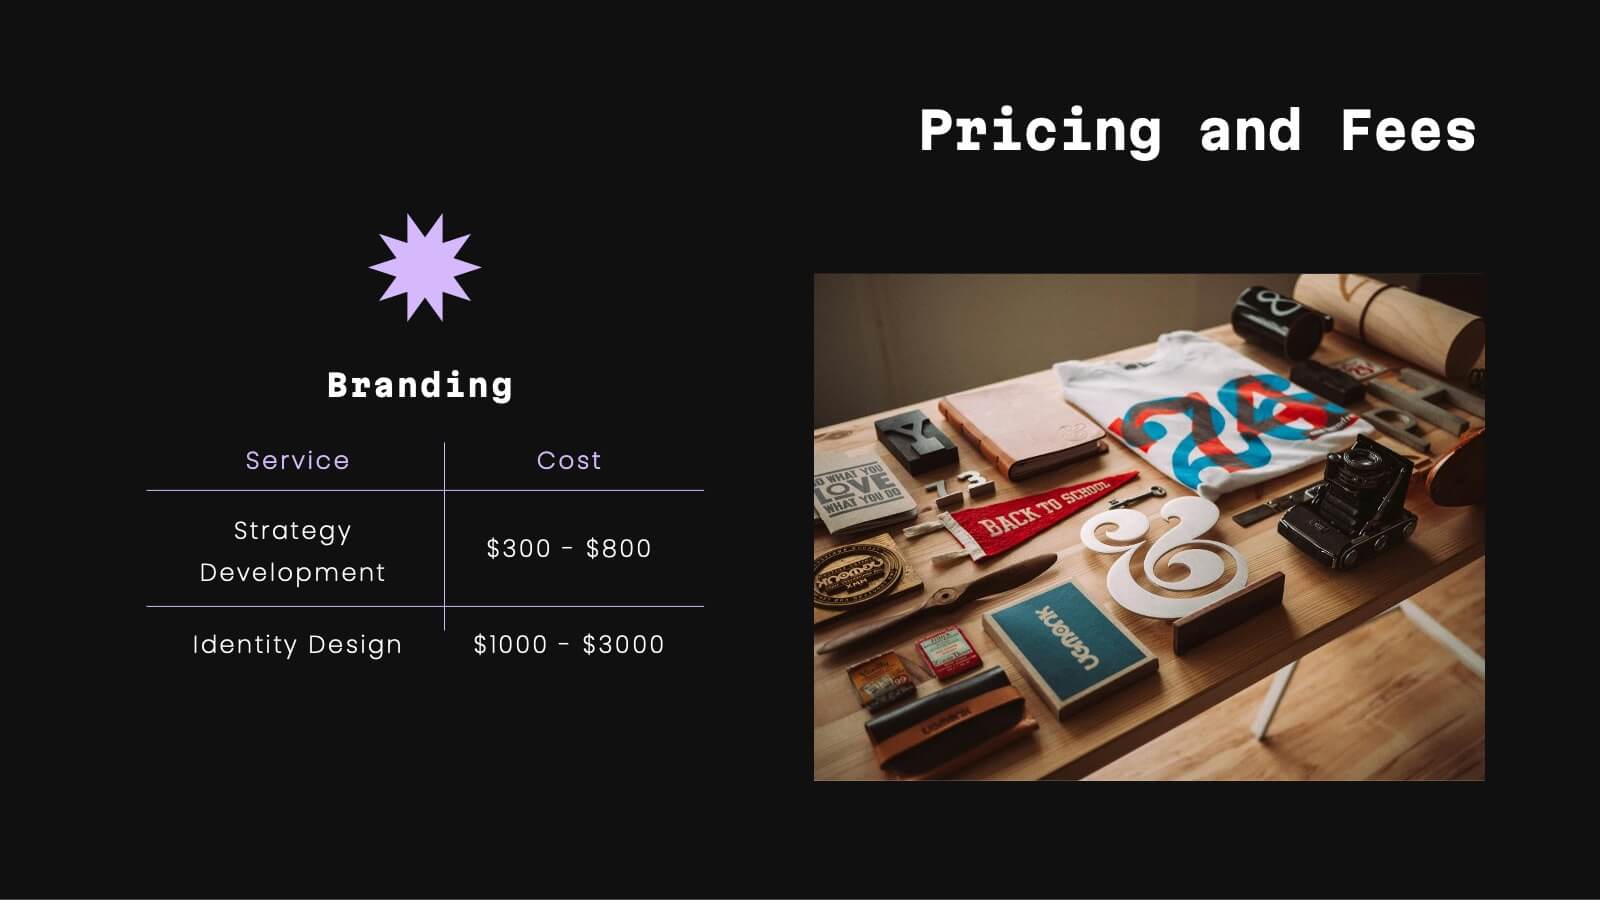
Celeste Professional Portfolio Showcase Presentation
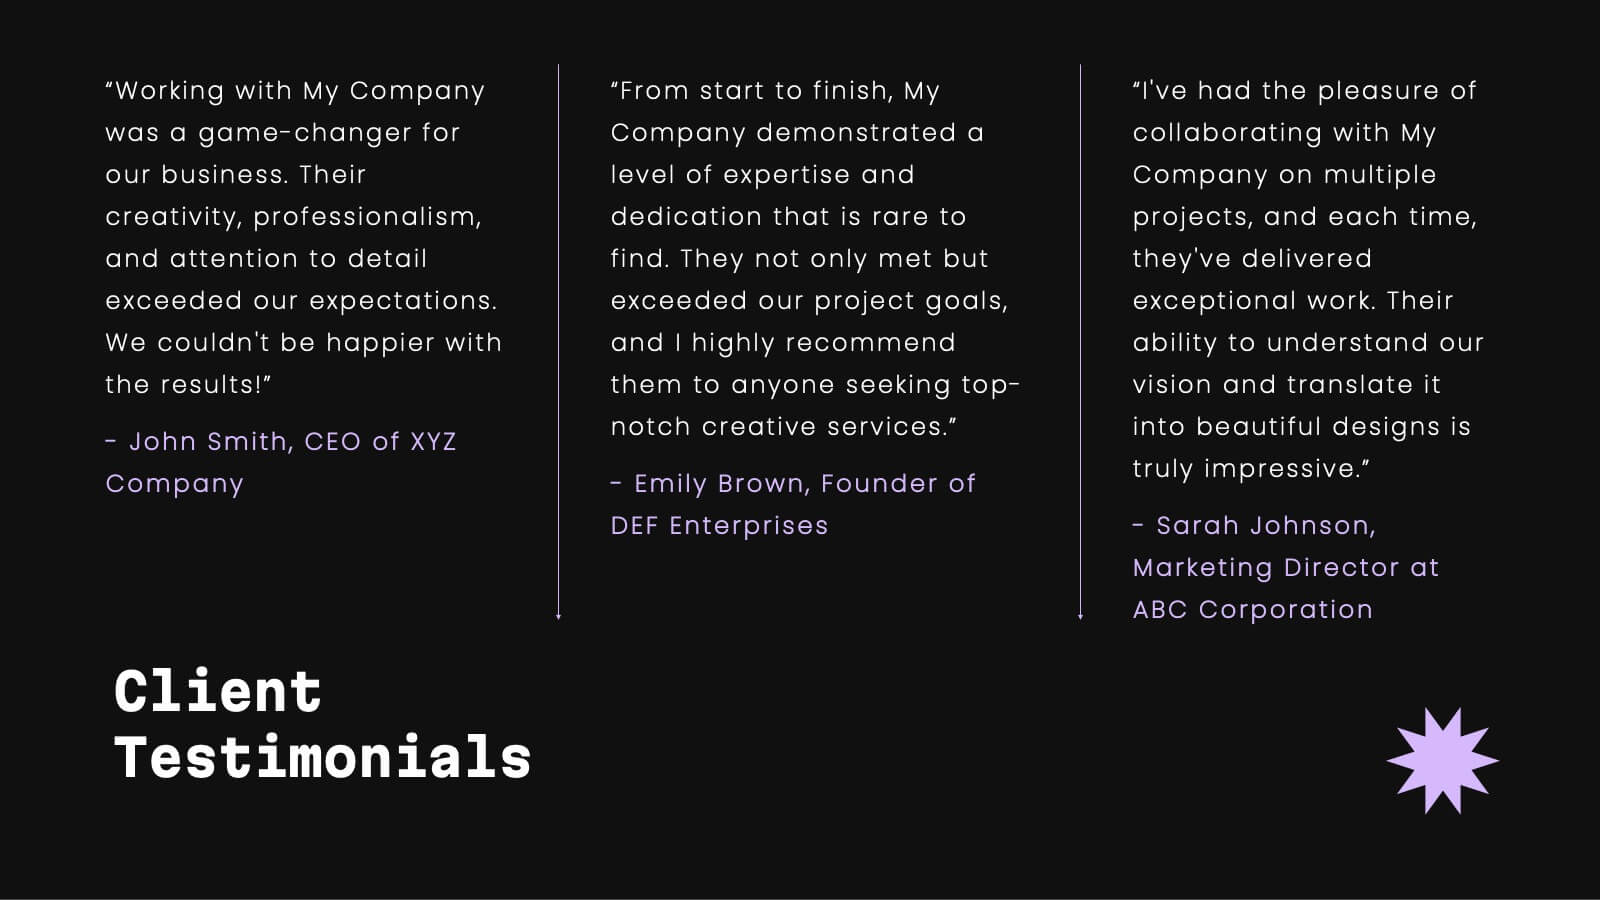
Impress with style using this sophisticated portfolio presentation template. Perfect for showcasing featured projects, creative processes, and client testimonials, this template enhances the visual appeal of your work. Its modern, dark-themed design ensures your content stands out, making a lasting impression. Compatible with PowerPoint, Keynote, and Google Slides, it's versatile for any platform.


22 slides
Bona Advertising Agency Proposal Presentation
Present your agency’s vision with confidence using this sleek advertising proposal template. It covers everything from market analysis and strategy development to campaign execution and client testimonials. Ideal for securing new partnerships, it’s compatible with PowerPoint, Keynote, and Google Slides for a polished, professional presentation.


6 slides
Mission and Values Overview Presentation
Your company's purpose deserves a visually stunning story! This infographic presentation template helps you clearly outline core values and mission statements with an engaging, structured design. Ideal for business strategy meetings, corporate presentations, and branding discussions, it keeps your content professional and impactful. Fully customizable and compatible with PowerPoint, Keynote, and Google Slides.


6 slides
Targeted Segment Analysis and Mapping Presentation
Highlight your market focus with the Targeted Segment Analysis and Mapping Presentation. This circular layout is perfect for breaking down five audience segments, using subtle icons and visual emphasis for clarity. Ideal for marketers, strategists, and business analysts presenting niche targeting. Fully editable in Canva, PowerPoint, Keynote, and Google Slides.


21 slides
Illusia Artist Portfolio Template Presentation
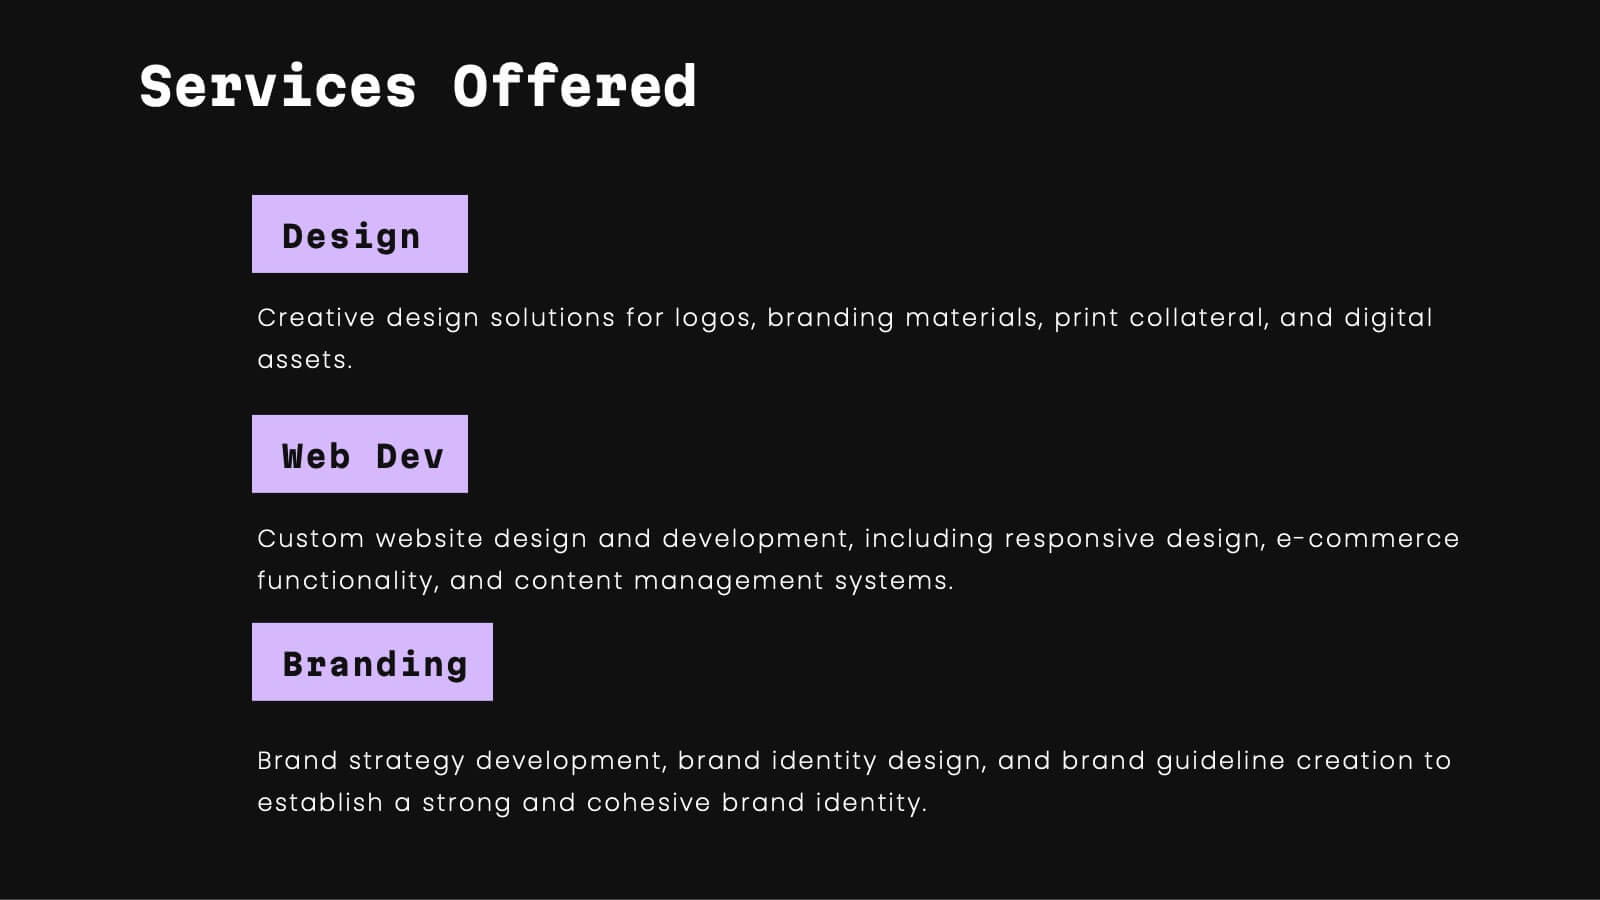
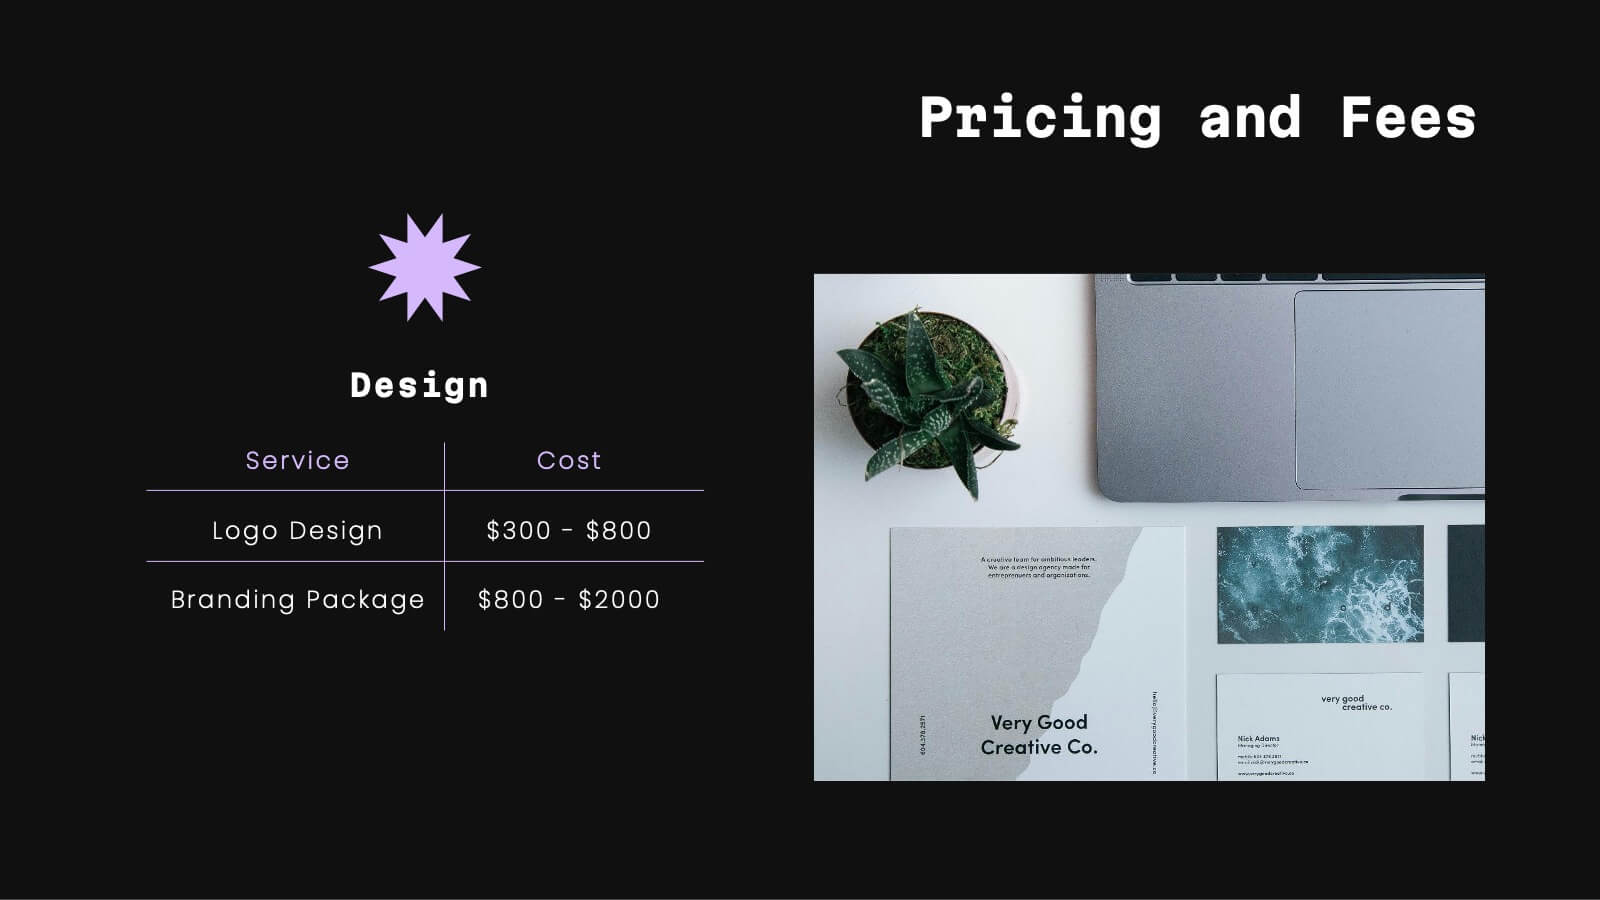
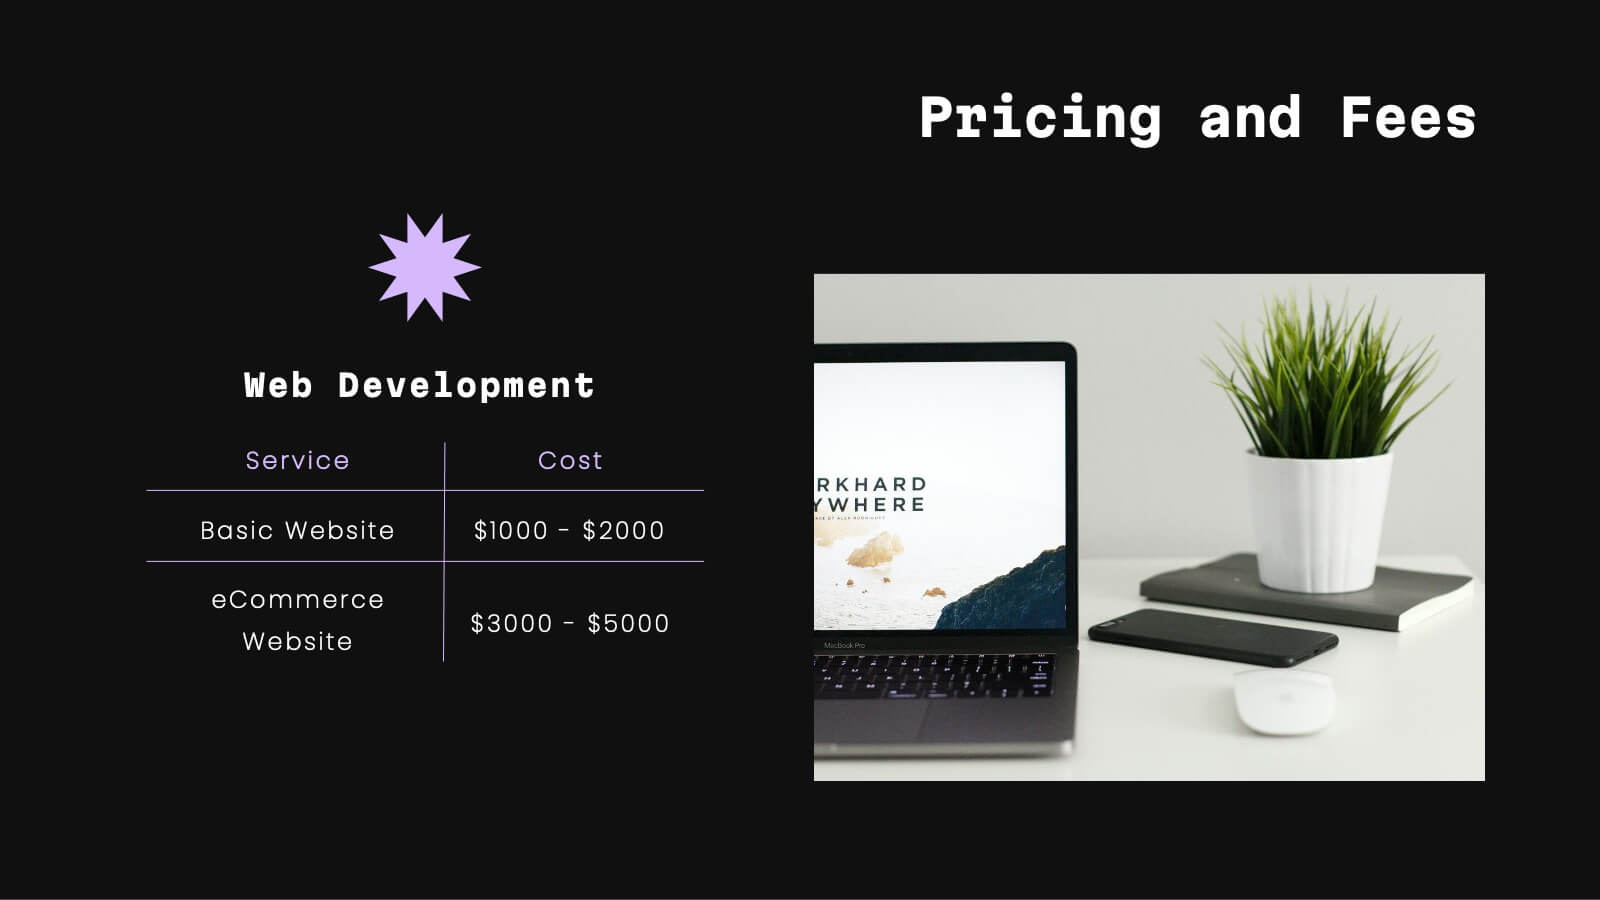
Make your creative work shine with this vibrant and versatile portfolio presentation template. Designed for artists, designers, and creative professionals, this template enables you to showcase your projects, philosophy, and achievements in a visually captivating way. Present your journey with slides that cover an introduction, portfolio overview, creative process, and collaborations. Highlight your unique style and philosophy while featuring key projects with dynamic layouts. Share your accolades, services offered, pricing details, and client testimonials to build trust and credibility. Fully customizable and compatible with PowerPoint, Google Slides, and Keynote, this template offers effortless editing to align with your branding and personal style. Perfect for portfolio reviews, client meetings, or showcasing your work online, this template is designed to make a bold, professional impression.


8 slides
Leadership Training Workshop Presentation
Boost your team's leadership skills with our 'Leadership Training Workshop' template, perfect for structuring dynamic and effective training sessions. Designed to focus on core leadership competencies, this template supports organizations in cultivating influential leaders. It's fully compatible with PowerPoint, Keynote, and Google Slides, facilitating a seamless integration into your training curriculum.


4 slides
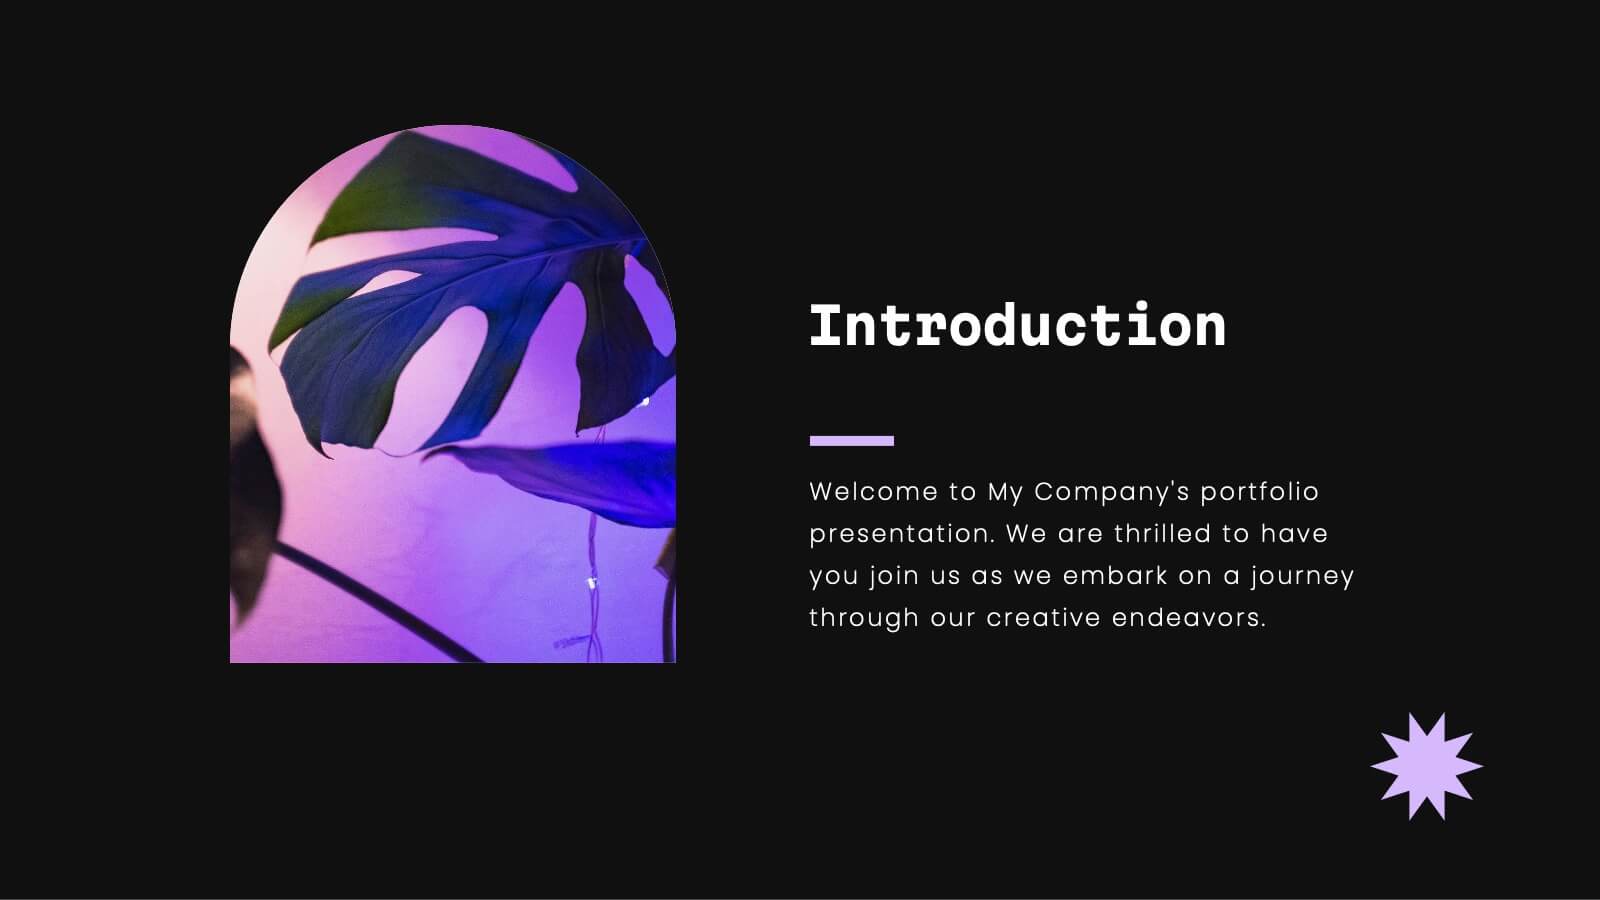
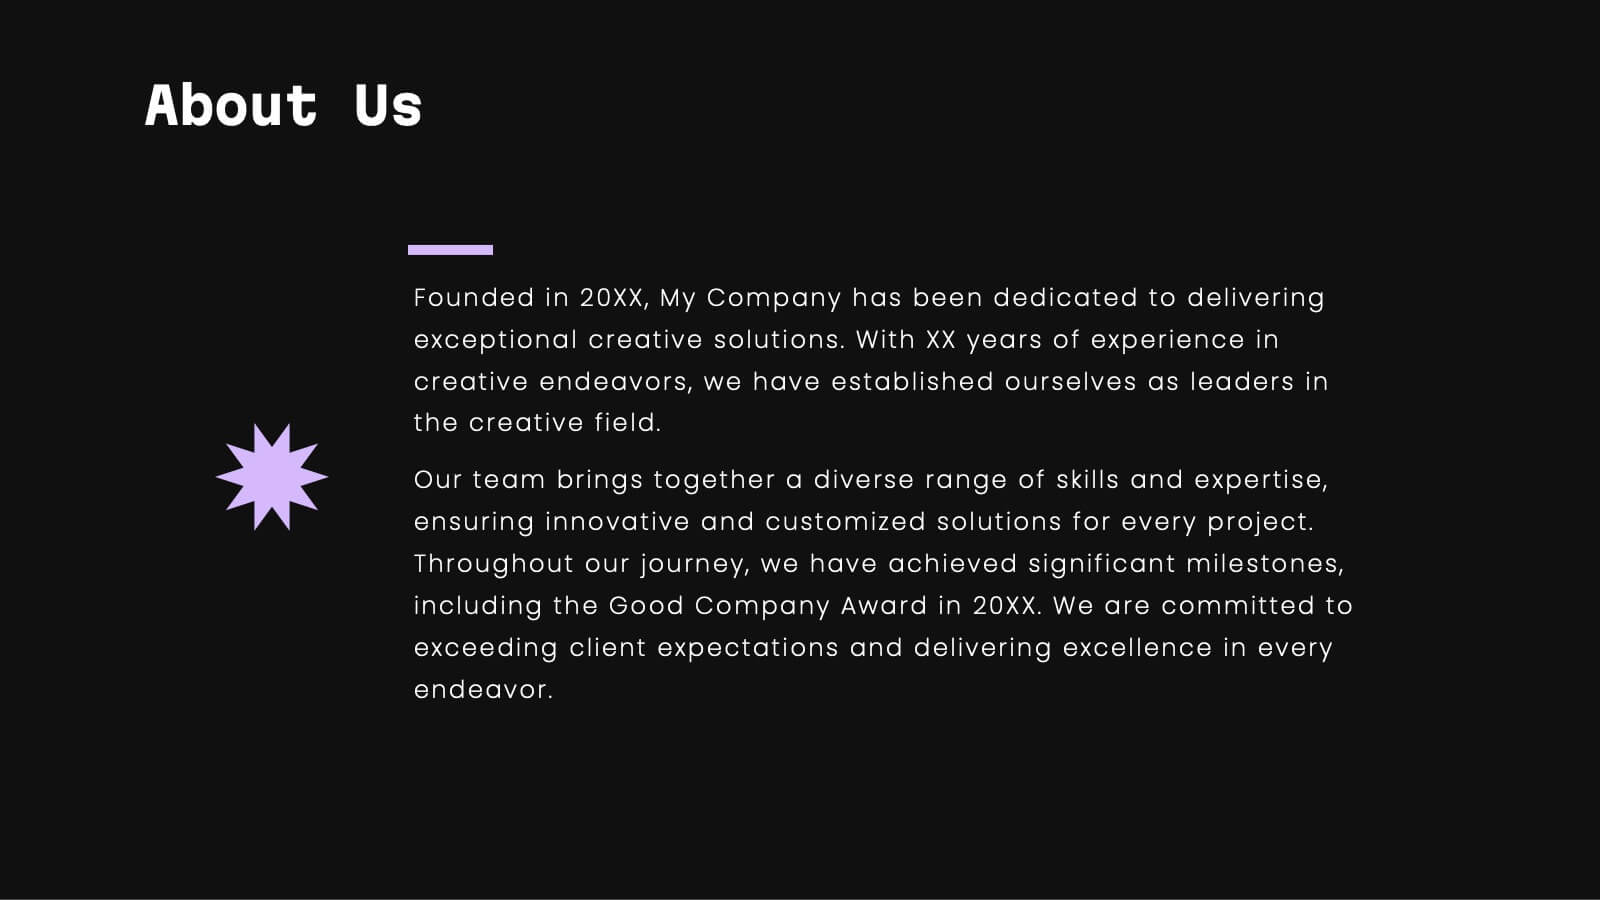
Welcome and About Us Introduction Presentation
Start strong with the Welcome and About Us Introduction Presentation, designed to deliver a polished, professional first impression. This clean layout features bold typography and geometric side visuals, perfect for introducing your company, brand values, or strategic vision. Easily customize the content to suit corporate profiles, startup decks, or team intros. Compatible with Canva, PowerPoint, Google Slides, and Keynote.


6 slides
Business Process Checklist Overview Presentation
Simplify your workflow presentations with the Business Process Checklist Overview Presentation. This circular layout is ideal for outlining five sequential or cyclical steps in a business process, featuring icon-labeled checkpoints and editable titles. Each step is visually marked with subtle checkmarks, making it perfect for status tracking, task progression, or implementation plans. Clean, professional, and fully customizable in PowerPoint, Keynote, and Google Slides.


21 slides
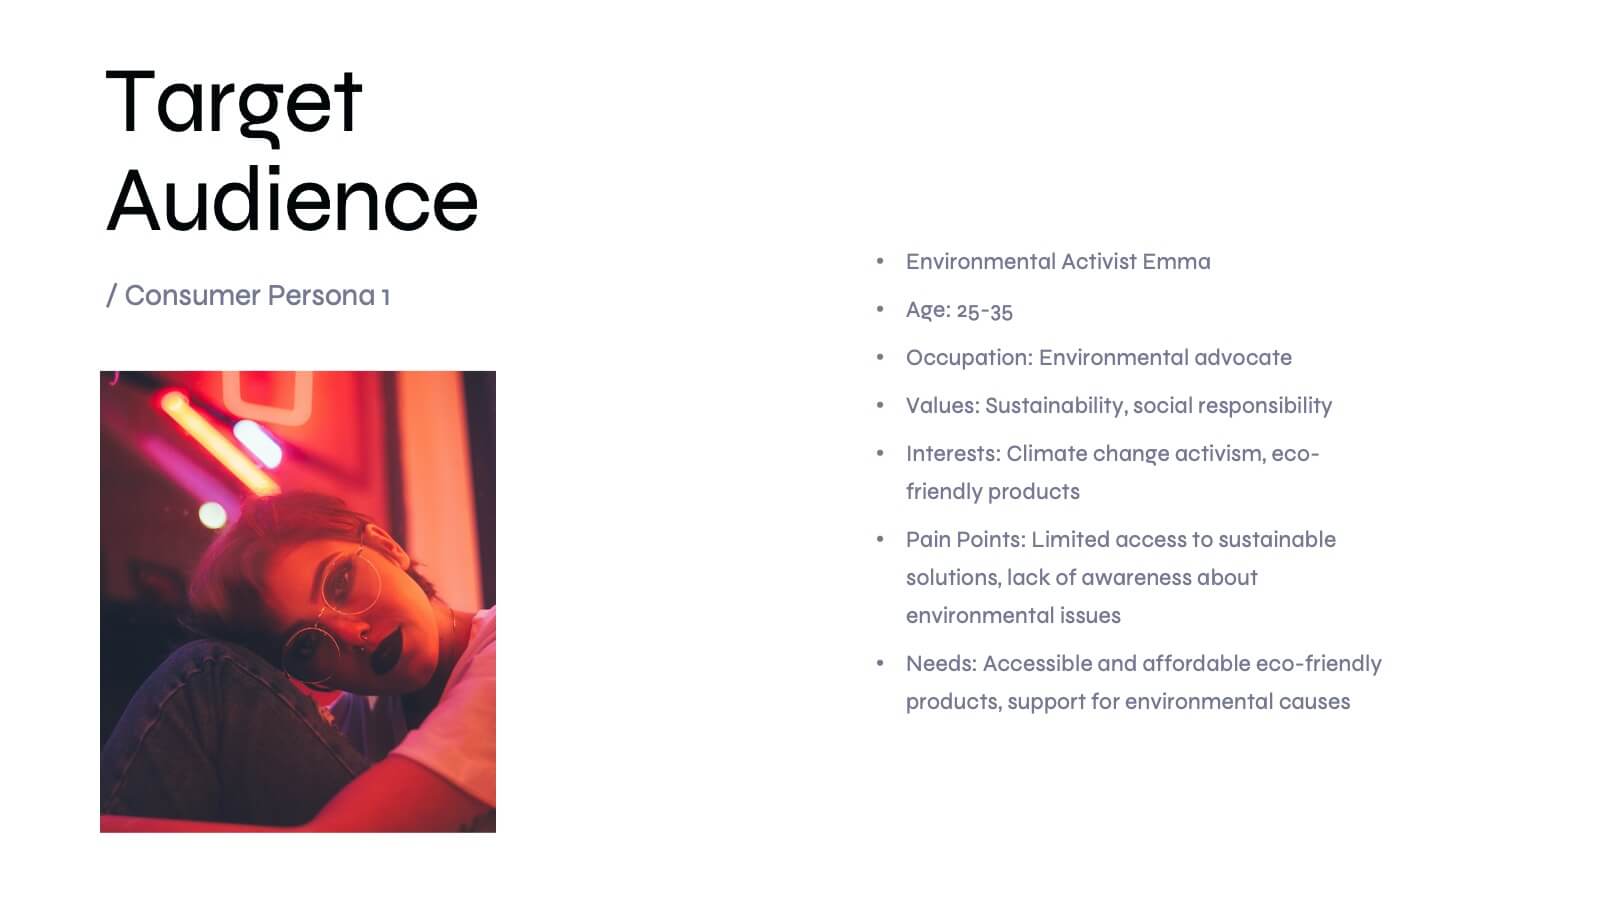
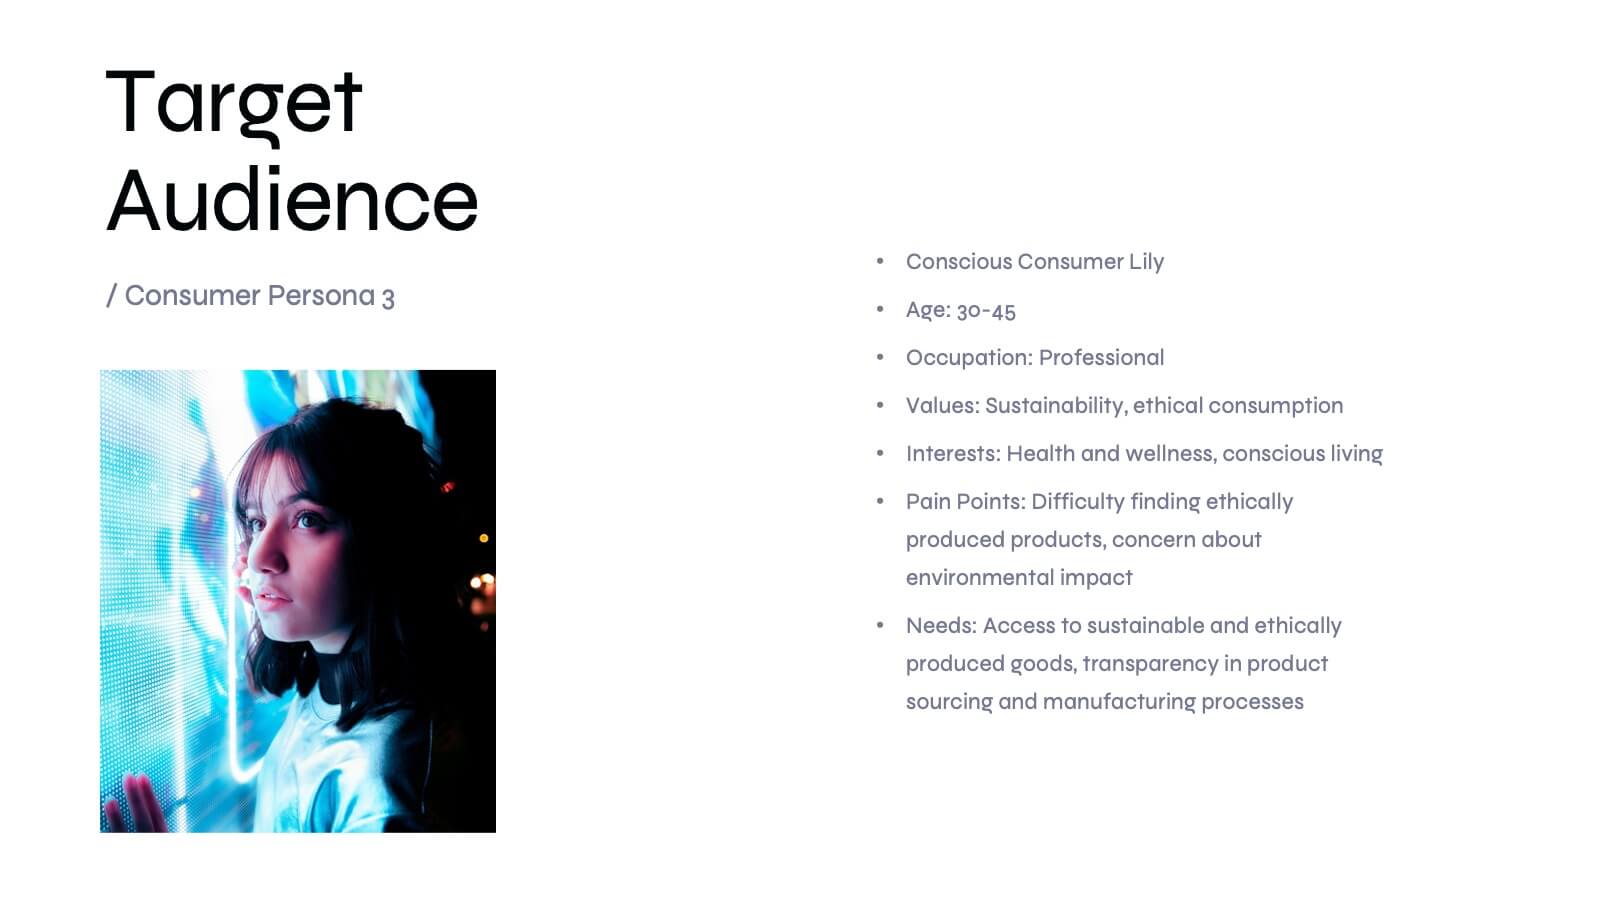
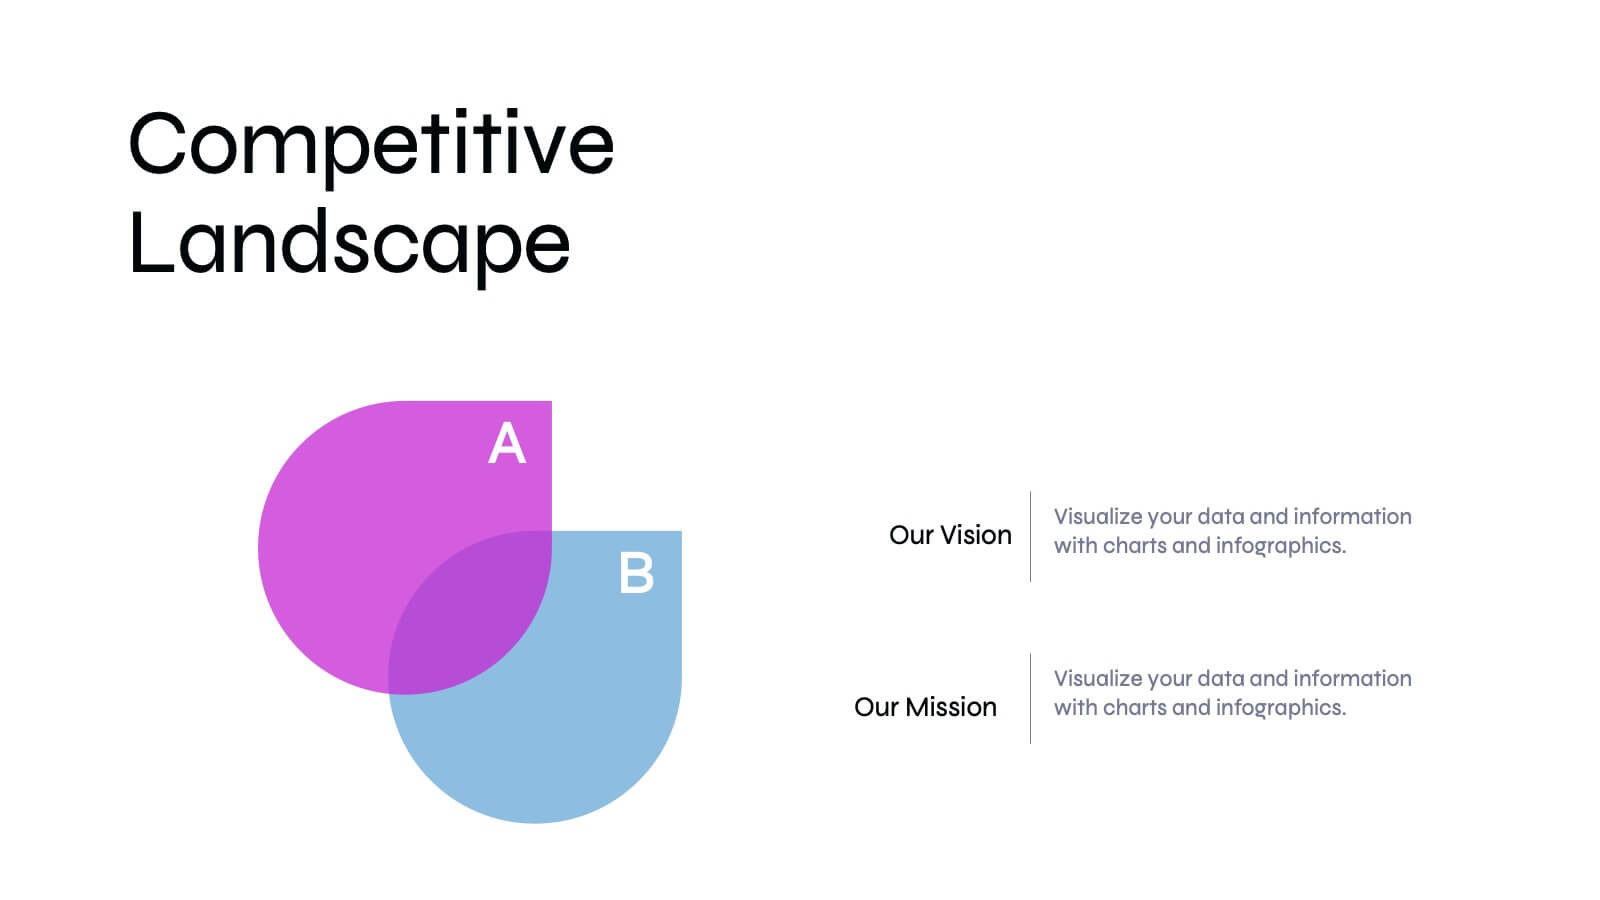
Techne Strategic Planning Report Presentation
Streamline your strategic planning process with this meticulously crafted presentation template, designed for professionals seeking clarity and structure. Featuring slides dedicated to market trends, SWOT analysis, target audience profiling, and competitive insights, this template ensures your strategy is well-rounded and impactful. The clean and modern design accommodates sections for defining objectives, key challenges, and resource allocation, allowing your team to focus on actionable solutions. Performance metrics and risk management slides help you track progress and address uncertainties effectively. Whether presenting to stakeholders or internal teams, this tool simplifies complex data into easily digestible visuals. Fully editable and compatible with PowerPoint, Google Slides, and Keynote, this template provides the flexibility to adapt to various needs. Perfect for organizations aiming to communicate strategic initiatives and actionable plans with precision and professionalism. Take your strategic planning reports to the next level with this essential template.


6 slides
PESTEL Framework Business
Simplify your strategic analysis with this clean and colorful PESTEL presentation. Perfect for breaking down Political, Economic, Sociocultural, Technological, Environmental, and Legal factors. Each segment uses bold icons and color coding to guide your audience through external influences. Easily customizable in PowerPoint, Keynote, and Google Slides.


6 slides
Business Calendar and Monthly Overview Presentation
Bring structure to your chaos with a bold and colorful visual planner! This easy-to-use layout helps track tasks, deadlines, or projects across multiple months in one glance. Ideal for team coordination or solo planning. Fully editable and compatible with PowerPoint, Keynote, and Google Slides for seamless calendar-based presentations.