


Features
- 4 Unique slides
- Fully editable and easy to edit in Microsoft Powerpoint, Keynote and Google Slides
- 16:9 widescreen layout
- Clean and professional designs
- Export to JPG, PDF or send by email


Do you have any questions?
Recommend


22 slides
Metaphor Advertising Agency Proposal Presentation
The Advertising Agency Proposal Presentation Template offers a polished structure to present your agency's expertise. With slides covering mission, case studies, services, and market analysis, it’s designed to leave a lasting impression. Perfect for securing new clients, it’s fully editable and works seamlessly with PowerPoint, Keynote, and Google Slides.


6 slides
Creating Effective Buyer Persona Strategies Presentation
Present your audience research with clarity using this buyer persona strategy slide. Designed with a radial layout of five icons leading to a central profile, this template helps communicate key traits, behaviors, and preferences. Ideal for marketing teams, branding workshops, and product strategy sessions. Easily customizable in PowerPoint, Keynote, and Google Slides.


7 slides
Behavior Iceberg Infographic
Delve deep into human behavior with our behavior iceberg infographic. Set against a serene white backdrop, the design is brought to life with various shades of blue, mimicking the depths of an iceberg and symbolizing the visible and hidden aspects of behavior. Enhanced with fluid infographics, evocative icons, and adaptable image placeholders, this template portrays the tip of observable behavior while revealing the underlying thoughts, beliefs, and emotions submerged beneath. Precision-crafted for Powerpoint, Keynote, or Google Slides. Ideal for psychologists, counselors, HR professionals, or educators aiming to comprehend and address underlying issues.


5 slides
USA Economy Infographics
The U.S. economy has a significant impact on the global economy and serves as a benchmark for economic performance. These vertical infographics are the perfect tool to present your key facts, statistics, and trends to help the audience understand the economic landscape of the country. The visually appealing design included, coupled with concise and relevant information, helps to effectively communicate the complexities of the economy. Whether used for educational purposes or as a reference tool, these templates provides a comprehensive overview of the USA economy and its key components. Fully compatible with Powerpoint, Keynote, and Google Slides.


6 slides
3D Shapes Infographic
3D shapes, also known as three-dimensional shapes or solids, are geometric figures that have three dimensions: length, width, and height (or depth). This Infographic visually explains various three-dimensional geometric shapes, their properties, and real-world applications. With this template you can summarize the benefits of the 3D Shapes in simplifying the understanding of complex shapes and encouraging practical applications in various fields. This infographic is the perfect study aid for students preparing for geometry exams. This is fully customizable and compatible with Powerpoint, Keynote, and Google Slides.


6 slides
Innovative Idea Pitching Guide Presentation
Present your ideas with clarity using the Innovative Idea Pitching Guide Presentation. This dynamic five-step circular flow design is perfect for showcasing pitch stages, idea development, or startup concepts. Each section includes icons and text blocks to clearly explain key points, keeping your message organized and impactful. Fully editable in Canva, PowerPoint, Keynote, and Google Slides.


2 slides
Digital Mockup Screens for Apps Presentation
Showcase your app in action with the Digital Mockup Screens for Apps Presentation. This bold and modern slide layout centers your mobile UI on colorful abstract shapes, drawing attention to your product. Ideal for startup demos, app features, or UI/UX portfolios. Fully editable in PowerPoint, Keynote, Canva, and Google Slides.


8 slides
Directional Diagram with Progress Arrows Presentation
Showcase milestones, track development, or visualize progress with the Directional Diagram with Progress Arrows Presentation. This modern layout features arrow-based steps, making it ideal for roadmaps, process stages, or timeline breakdowns. Customize labels, icons, and colors to suit your message. Fully editable in PowerPoint, Google Slides, and Canva.


7 slides
Side-by-Side Feature Comparison Presentation
Clearly showcase differences across multiple categories with this Side-by-Side Feature Comparison Presentation. Designed with a visual grid system and bold colors, it's perfect for highlighting product or service variations at a glance. Fully customizable in PowerPoint, Keynote, and Google Slides.


21 slides
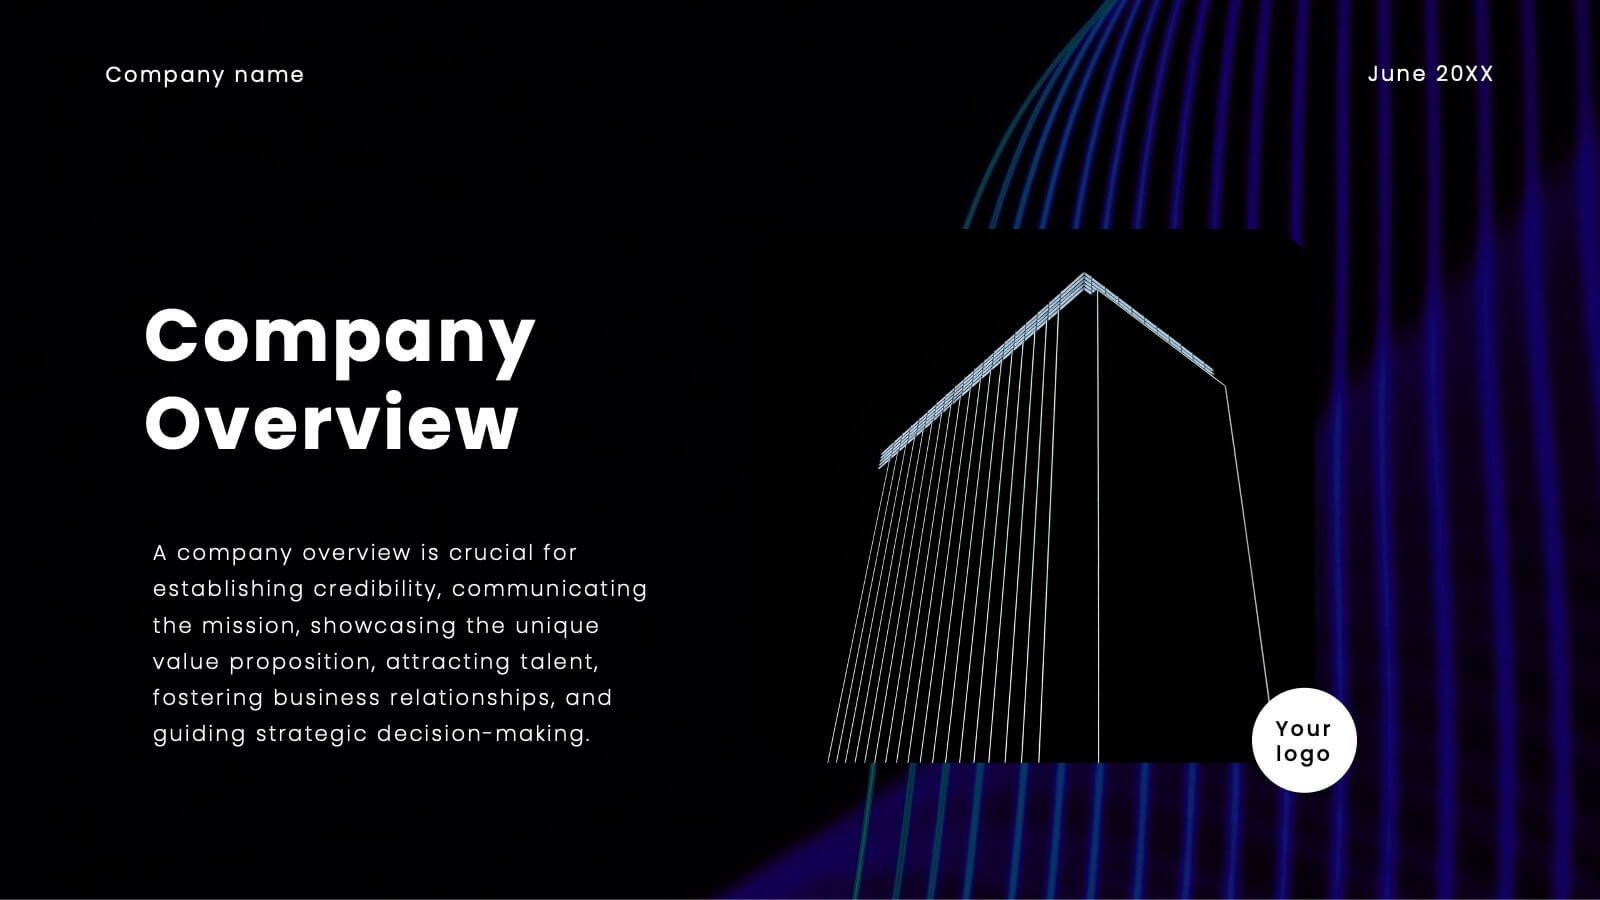
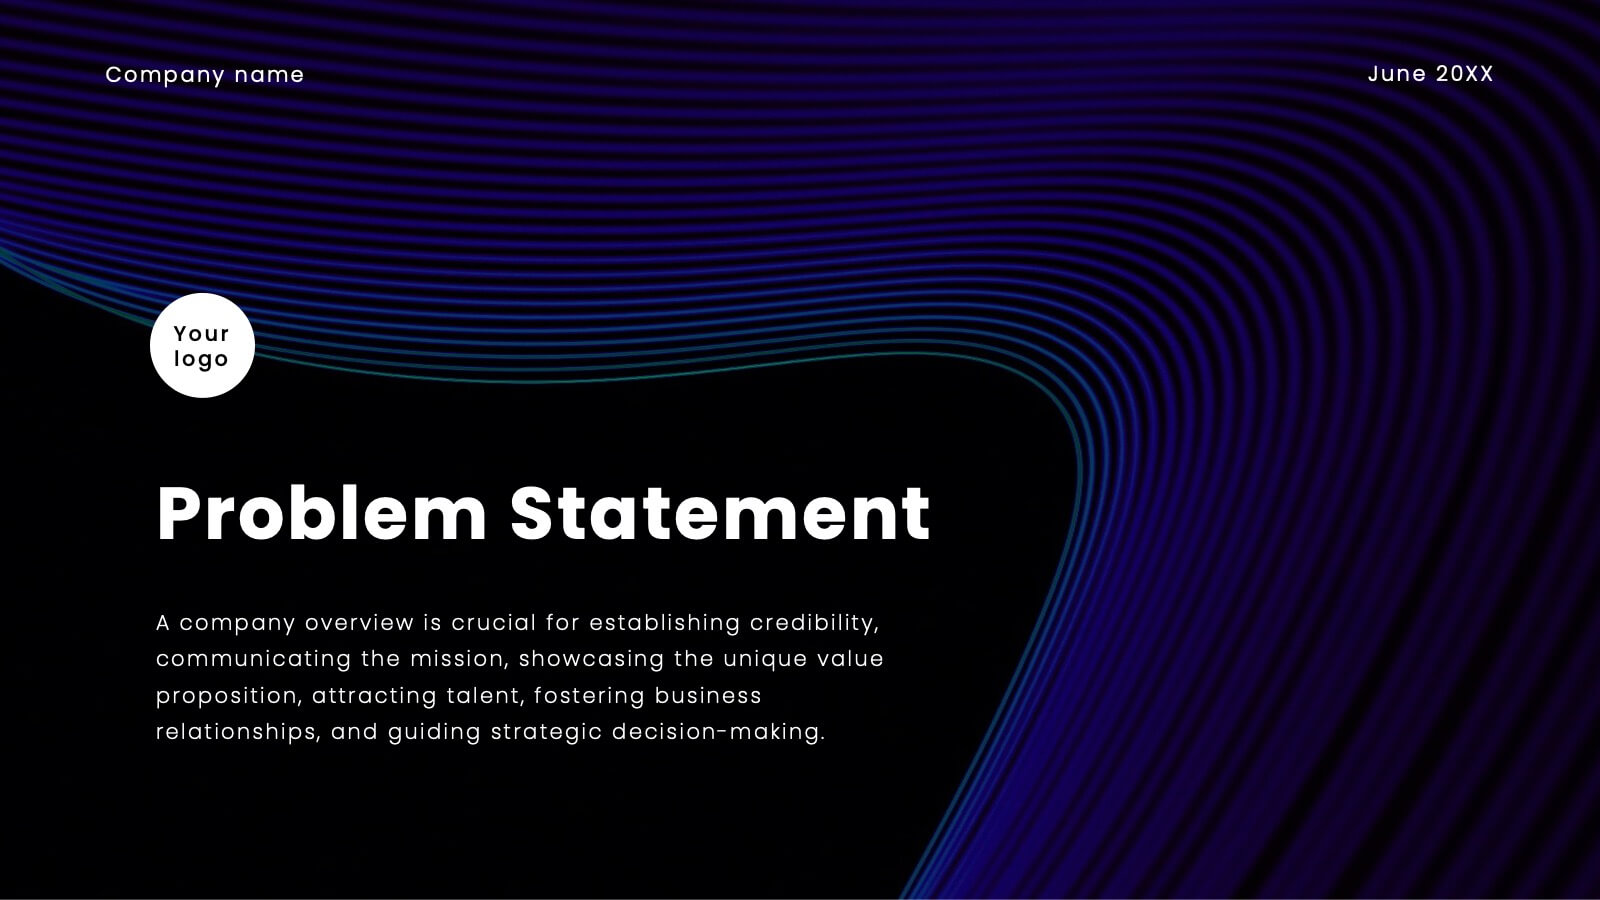
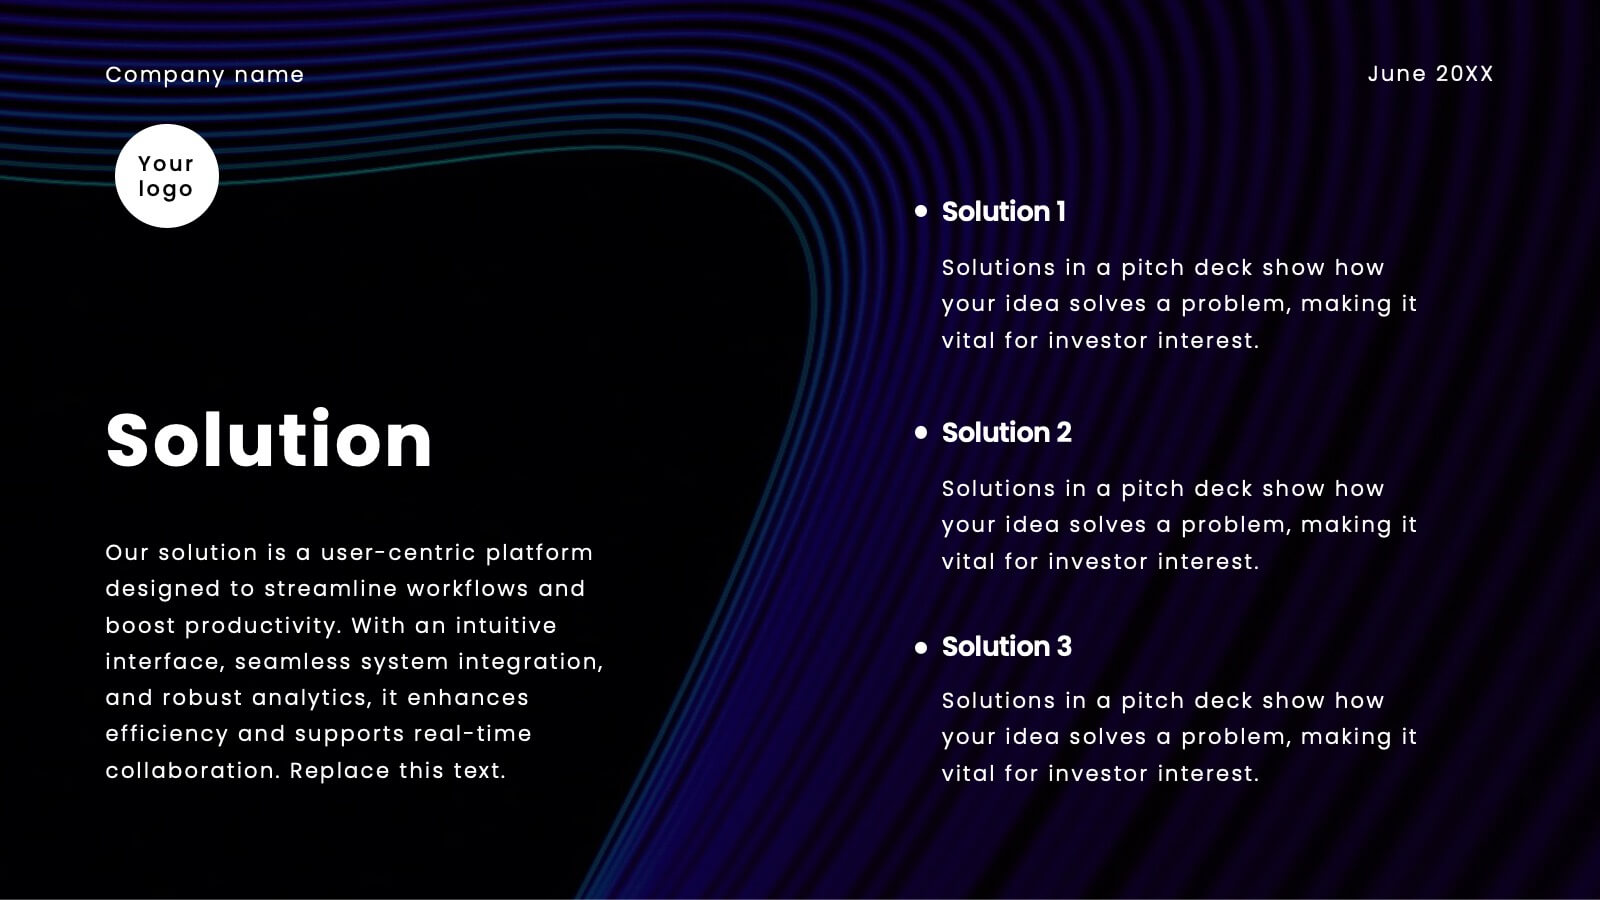
Apollo Sales Pitch Deck Template Presentation
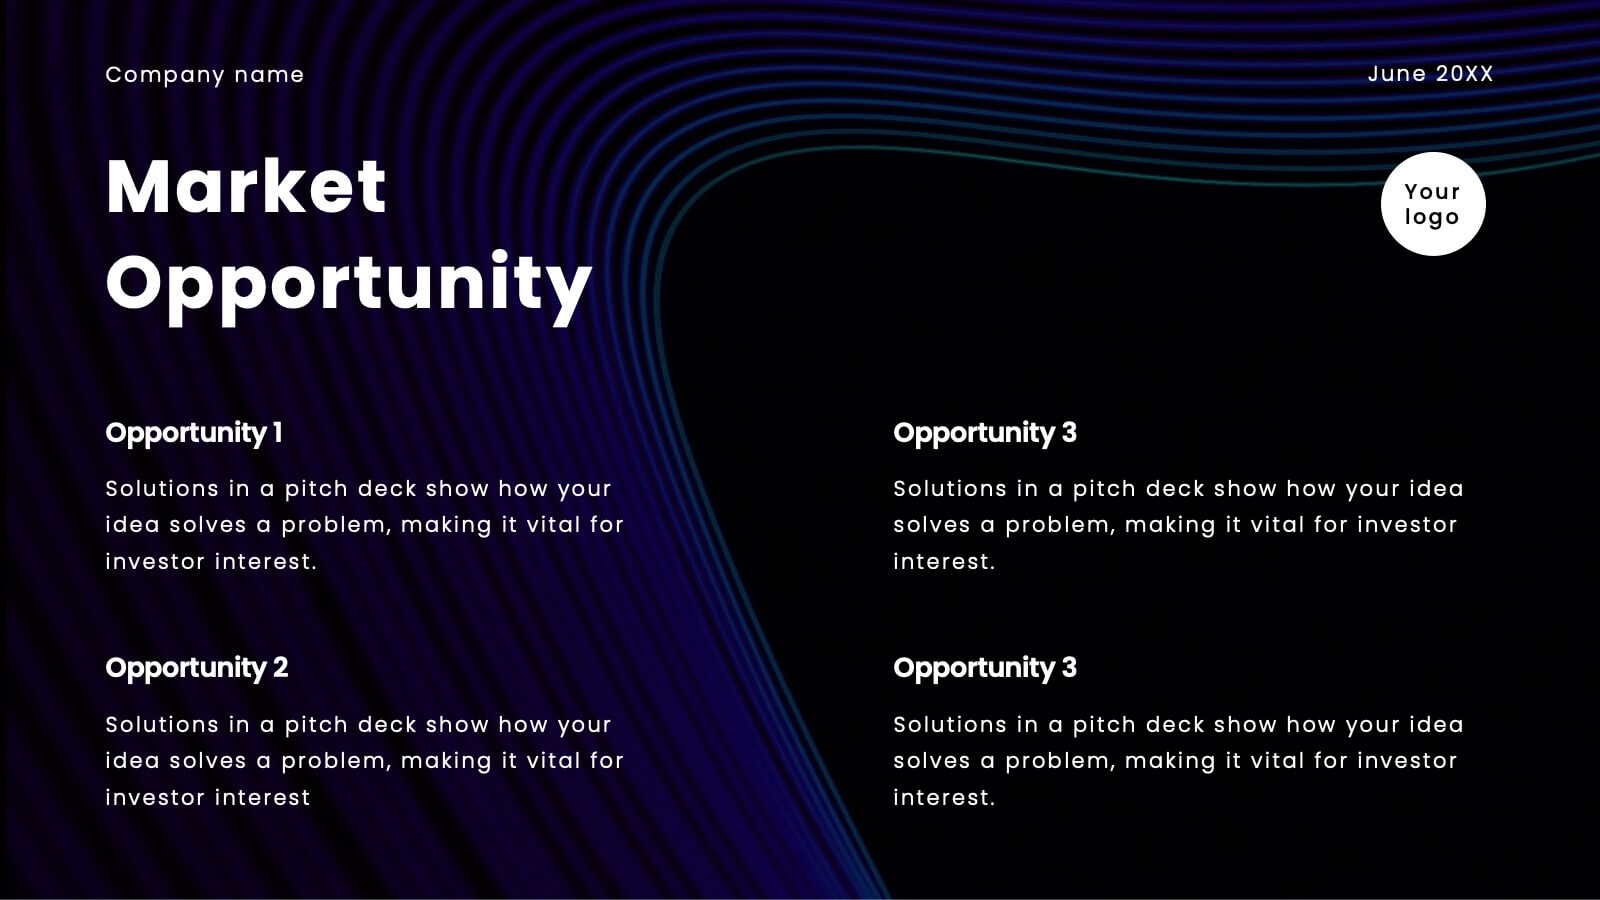
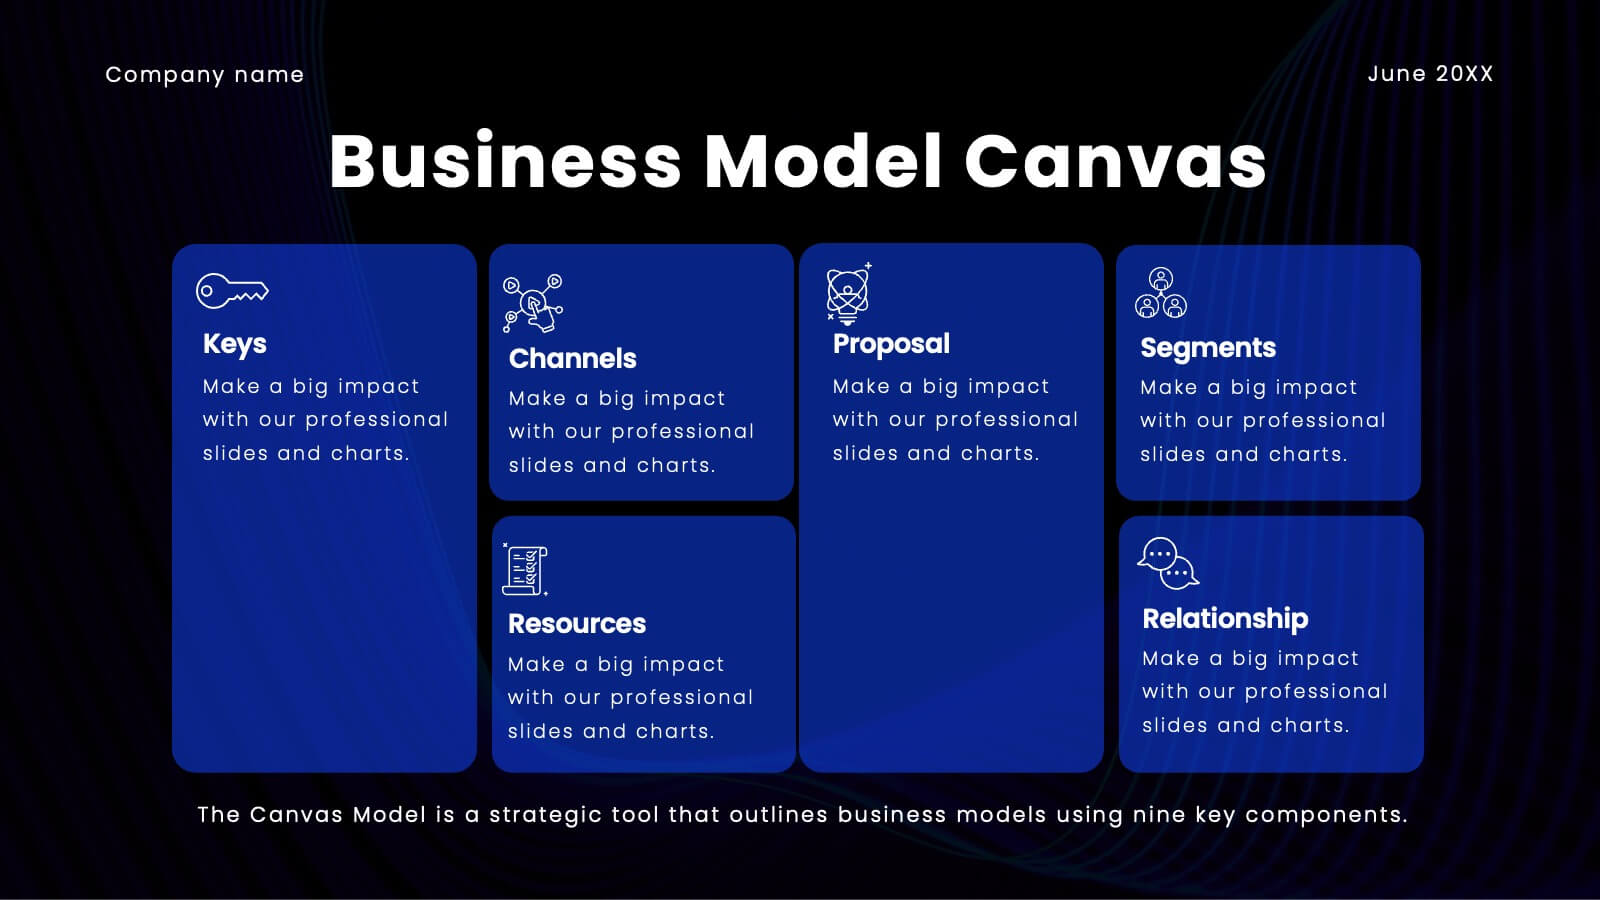
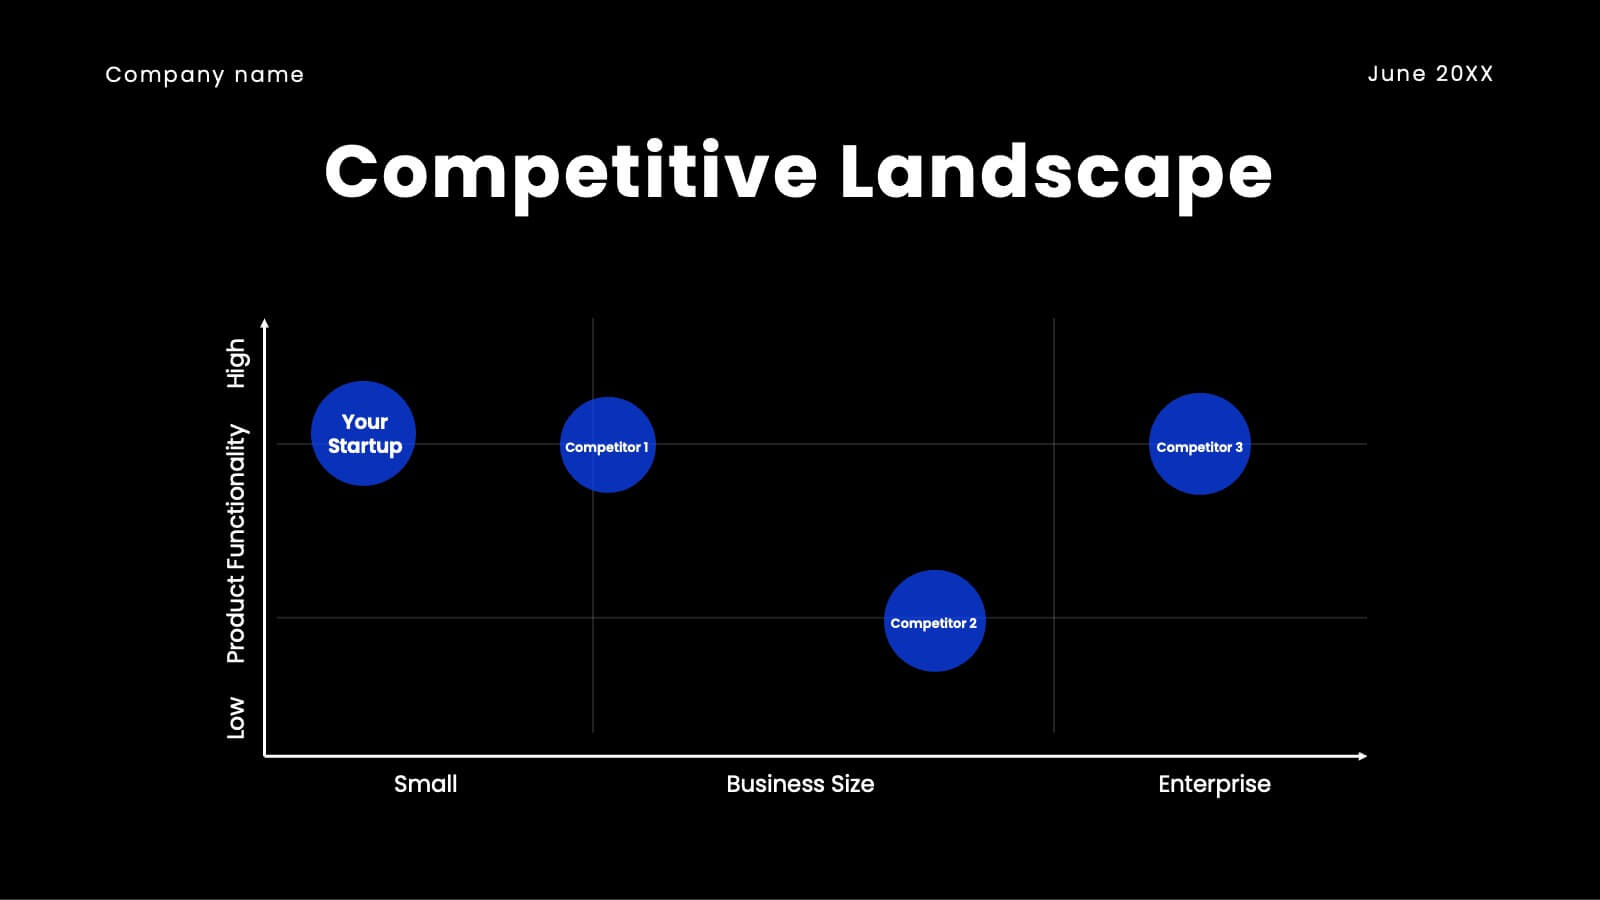
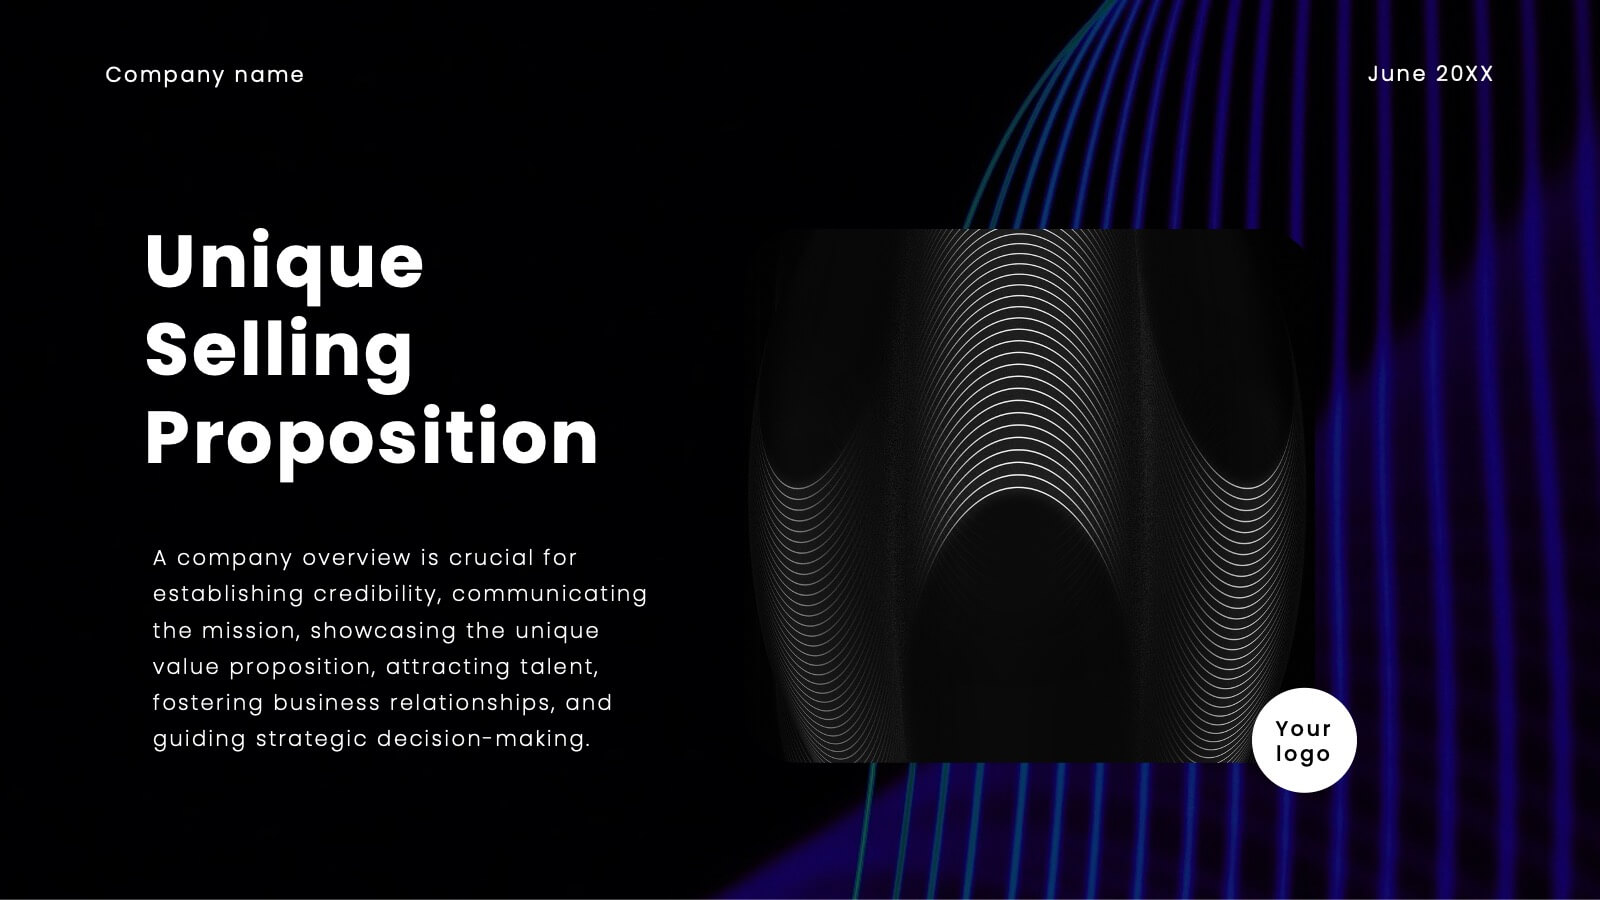
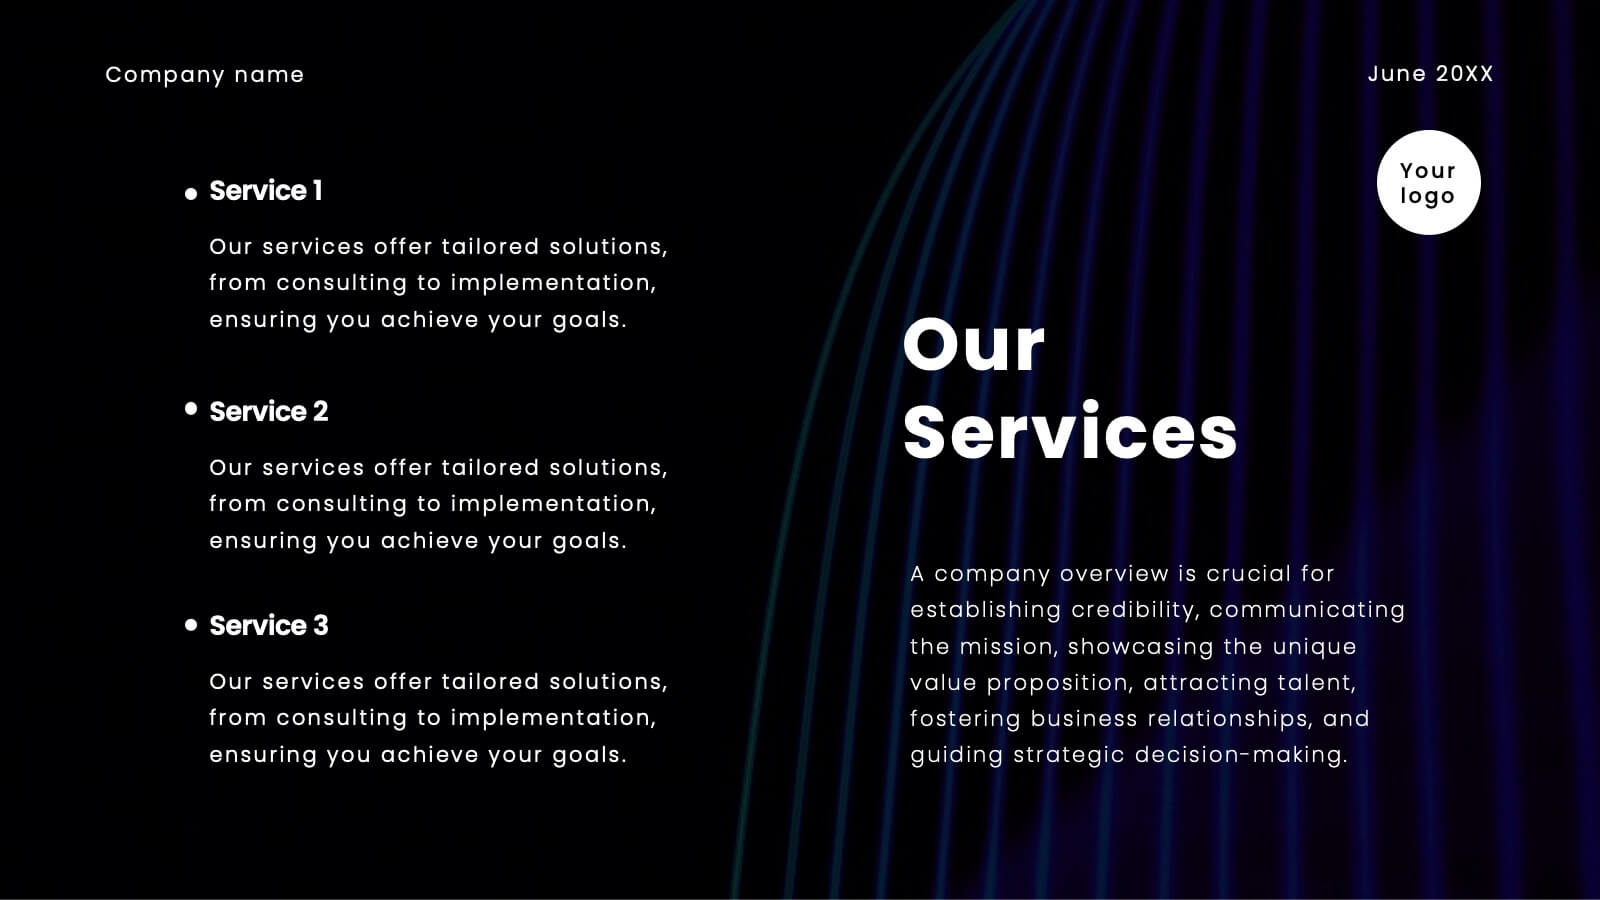
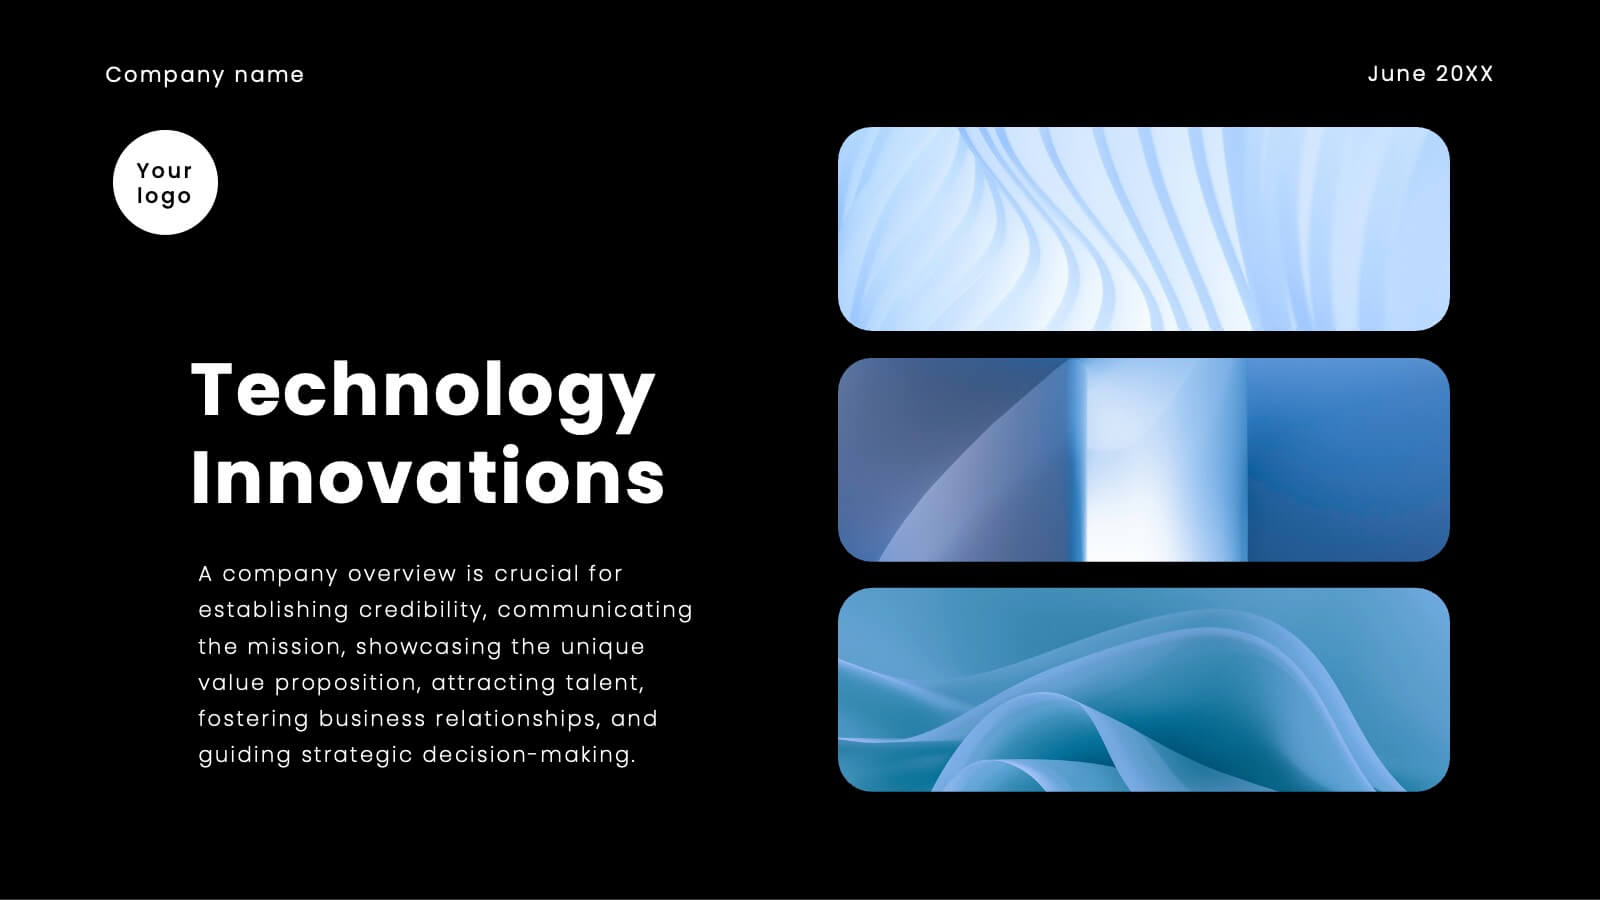
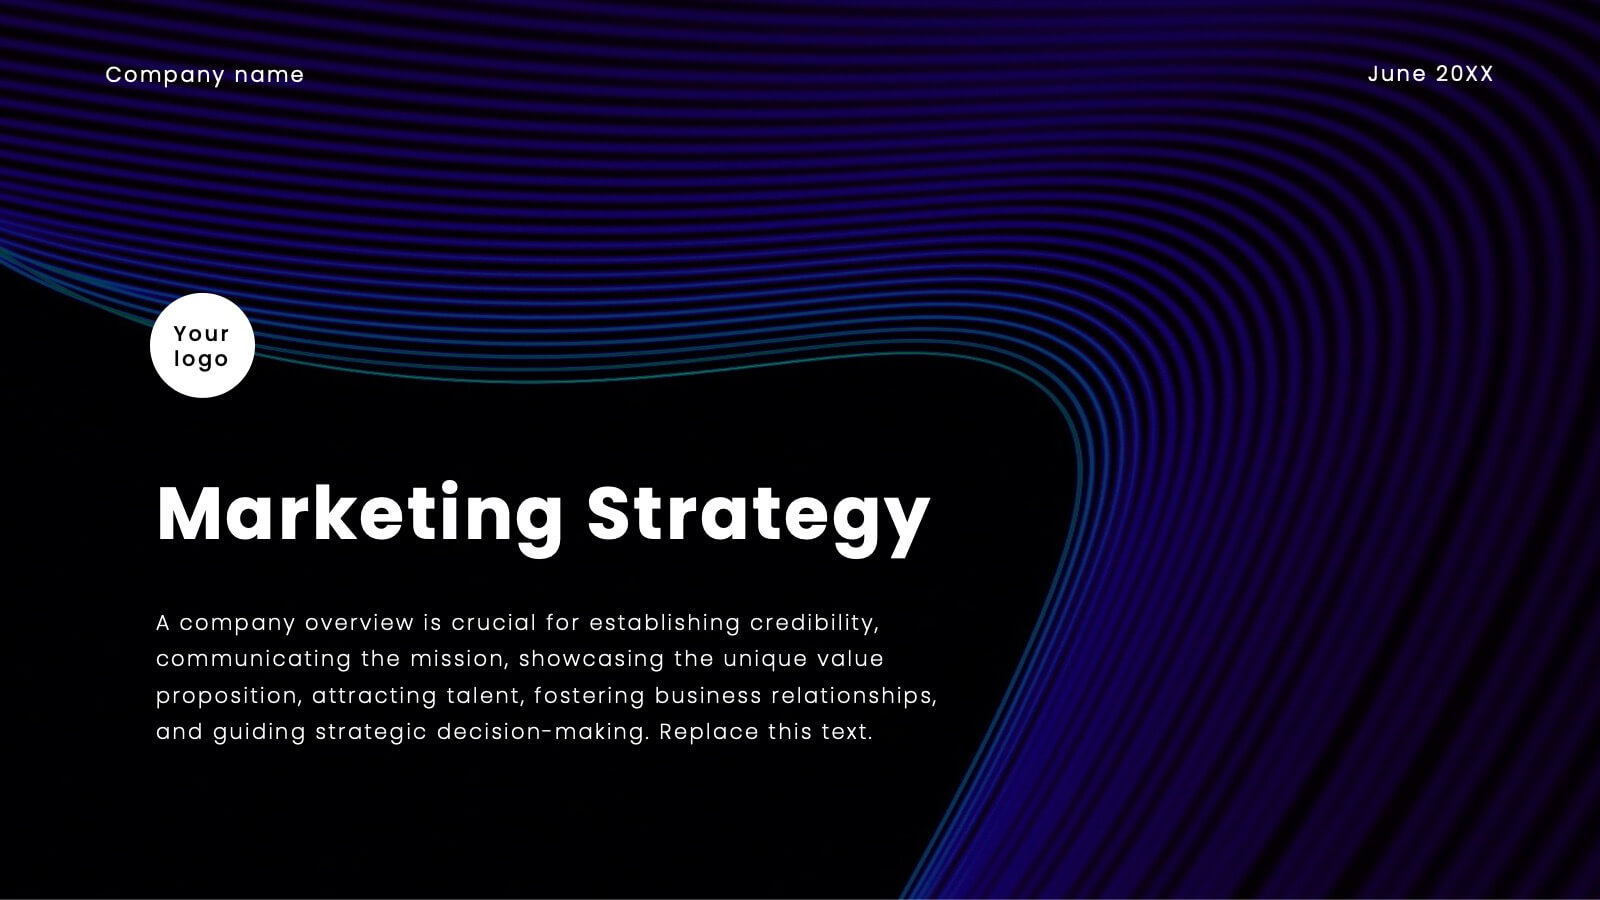
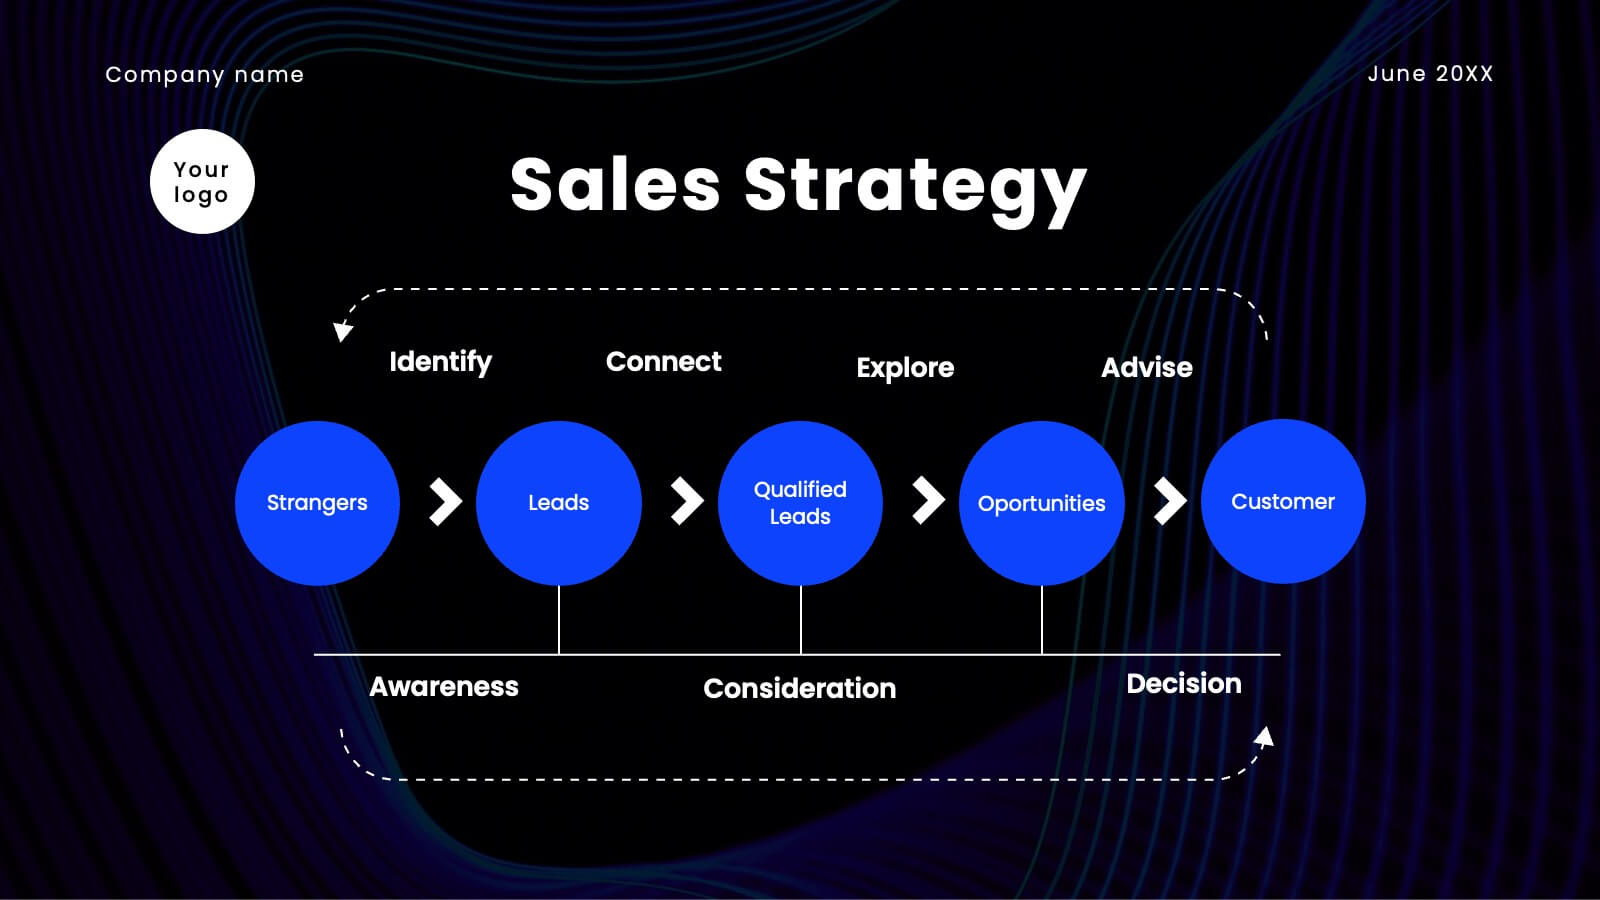
Create an impressive sales pitch with this sophisticated template. Highlight your company overview, problem statement, solutions, and market opportunities. Showcase your unique selling proposition and marketing strategy. Ideal for PowerPoint, Keynote, and Google Slides.


7 slides
Business Timeline Infographics
A business timeline is a graphical or chronological representation that illustrates significant events, milestones, or activities within a business or project over a specific period. Embark on a visual voyage through your business's evolution with our business timeline infographic template. Fully customizable and compatible with Powerpoint, Keynote, and Google Slides. This vibrant and informative template is your canvas to fully narrate compellingly. Our timeline infographic is more than a timeline; it's a visual testament to your business's resilience, growth, and future potential!


7 slides
Time Management Infographic Presentation Template
Time management skills are important in all aspects of life, not just work. Mastering time management allows you to get everything that you want out of your day. This time management template is the perfect tool to help you stay productive. Keep track of tasks, create a schedule and organize time where you need it most. Use this template to build a database of your weekly tasks, daily activities and recurring tasks that can be easily structured in a clock view. This time management template Is compatible with Powerpoint, Keynote, and Google Slides, so you can use it on any device.


4 slides
Big Data Analytics Business
Simplify data complexity with this layered stack diagram designed for big data workflows and insights. Ideal for IT professionals, analytics teams, and consultants, it visually represents data input, processing, and output stages. Fully editable in PowerPoint, Keynote, and Google Slides for flexible customization.


8 slides
Corporate Mission Purpose Slide
Wave your flag of purpose with this bold, banner-inspired layout—ideal for communicating your corporate mission, core principles, and company values. Each section gives space to articulate what drives your business forward in a visually unified way. Fully compatible with PowerPoint, Keynote, and Google Slides.


22 slides
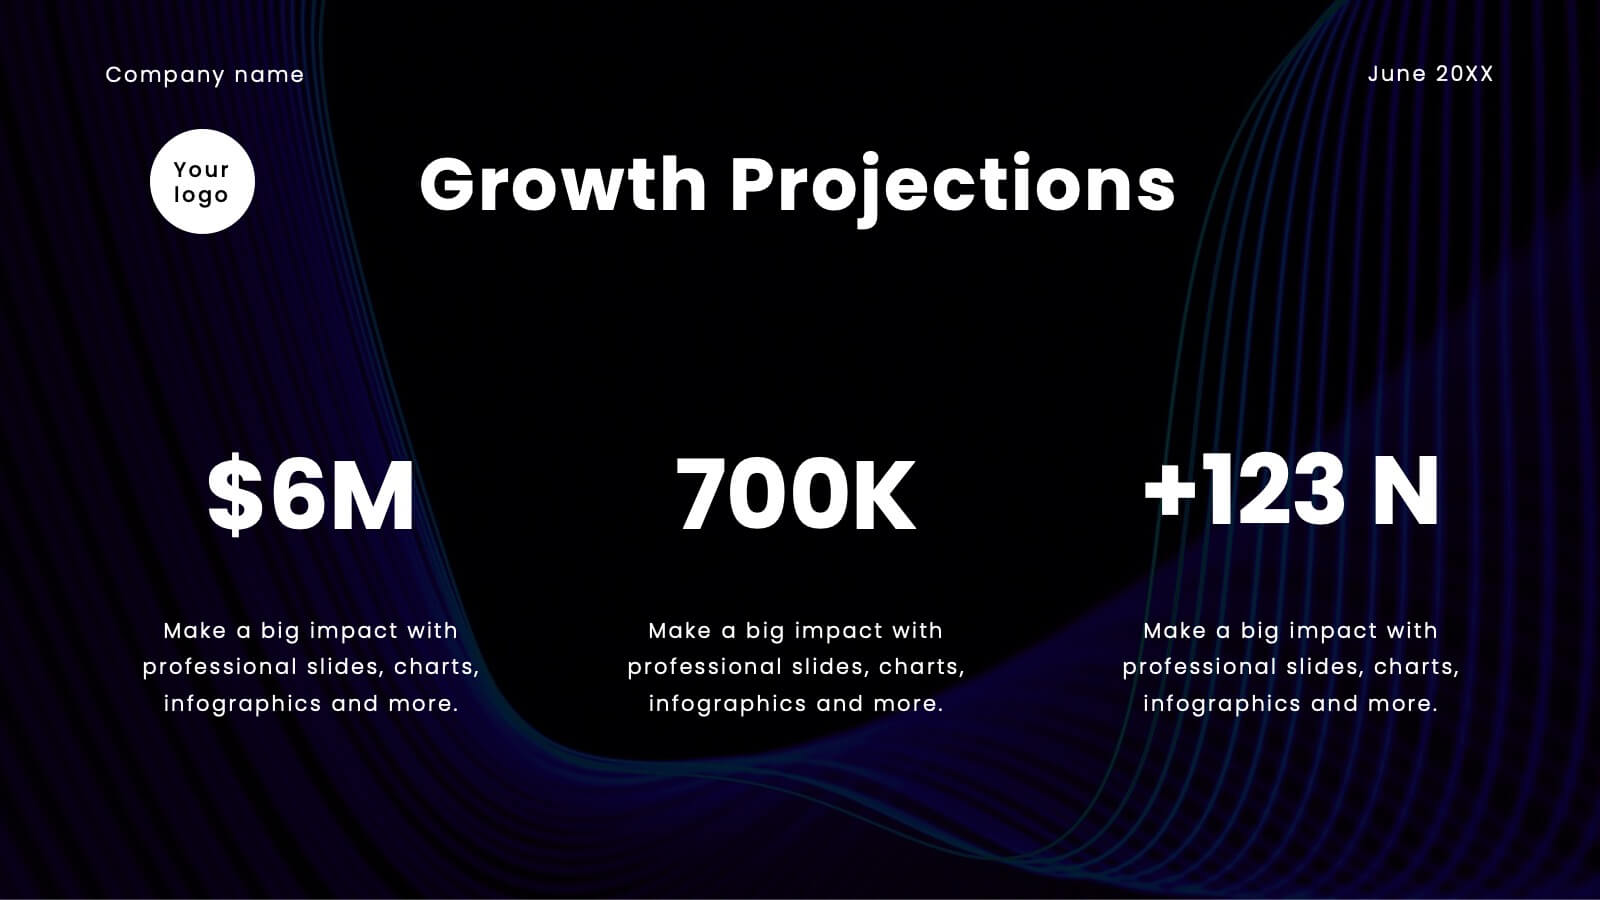
Jolt Business Idea Pitch Deck Presentation
Prepare to electrify your audience with a pitch deck that’s nothing short of spectacular! This high-impact template is designed to captivate, engage, and persuade your stakeholders with every slide. It’s more than just a presentation; it’s your gateway to showcasing your company’s unique value proposition, innovative solutions, and future growth potential in a way that’s visually stunning and incredibly compelling. From the moment you unveil your company overview to the final slide on financials and funding requirements, this template ensures your pitch is memorable, powerful, and impossible to ignore. The sleek, modern design highlights your strategic vision, competitive advantages, and market opportunities, making a bold statement that you’re ready to lead the future. Compatible with PowerPoint, Keynote, and Google Slides, this pitch deck template is your ultimate tool for turning heads and securing buy-in from investors, partners, and clients alike!


6 slides
Business People Partner Infographics
Our "Business People Partner" infographic template is a modern and dynamic tool designed for PowerPoint, Keynote, and Google Slides. This template is particularly useful for HR professionals, business consultants, and team leaders who are involved in fostering effective business partnerships. The template highlights essential elements such as organizational roles, partnership strategies, and communication channels. Its layout is thoughtfully designed to help users articulate the intricacies of business partnerships and the roles of various stakeholders in a clear and concise manner. This makes it an invaluable resource for presentations focusing on collaborative efforts and strategic alliances in the business world. Featuring a bright and inviting color scheme, the design of this template is both contemporary and engaging. It reflects the dynamic and collaborative nature of business partnerships, making your presentation not just informative but also visually appealing. Whether you're presenting to executives, partners, or team members, this template ensures your message is delivered with clarity and impact.


6 slides
RACI Matrix Chart Infographic
The RACI matrix is a project management tool used to define roles and responsibilities for tasks and activities within a project. This infographic template is designed to clarify the roles and responsibilities of team members in a project or process. RACI stands for Responsible, Accountable, Consulted, and Informed, and the matrix helps define each team member's involvement in different tasks or activities. This includes a step-by-step guide on how to create a RACI matrix, including identifying tasks, defining roles, and assigning responsibilities. This will simplify your audience's understanding of the RACI matrix chart.