


Features
- 6 Unique slides
- Fully editable and easy to edit in Microsoft Powerpoint, Keynote and Google Slides
- 16:9 widescreen layout
- Clean and professional designs
- Export to JPG, PDF or send by email


Do you have any questions?
Recommend


5 slides
Growth and Scale Indicators Overview Presentation
Highlight your company's upward momentum with the Growth and Scale Indicators Overview Presentation. This slide features a pyramid-style design to represent five progressive milestones or performance metrics, perfect for visualizing success benchmarks or key achievements. Fully customizable in Canva, PowerPoint, Keynote, and Google Slides for seamless integration into your presentations.


6 slides
Modern Travel Infographic
Explore your story like a globe waiting to be spun, using this clean visual layout to highlight key destinations, ideas, or data points in a modern, travel-inspired flow. It’s perfect for simplifying complex information with style. Fully customizable and compatible with PowerPoint, Keynote, and Google Slides.


7 slides
Self-sufficient Environmental Infographic
In an era where sustainability is paramount, understanding self-sufficiency in environmental contexts has never been more crucial. Our refreshing infographic, adorned in crisp whites, lush greens, with subtle black nuances, delves deep into this pivotal subject. Crafted to be both educational and engaging, this infographic sheds light on the essentials of eco-friendly independence. It's a must-have tool for educators, environmental enthusiasts, policy-makers, and individuals aiming for a green footprint. Seamlessly integrated with PowerPoint, Keynote, and Google Slides, our infographic invites you to explore, educate, and empower for a more sustainable tomorrow.


26 slides
Beginner's Guide to Investing Presentation
This presentation template is a fantastic starting point for anyone looking to dive into the world of investing. Designed with clarity and accessibility in mind, it caters specifically to beginners eager to understand the fundamentals of investment strategies and options. The template introduces users to the basics of stocks, bonds, and other investment vehicles, using easy-to-understand language and clear, informative visuals. The content is laid out in a logical sequence, beginning with basic concepts and gradually progressing to more complex investment ideas and strategies. Slides are enriched with diagrams, charts, and comparison tables that break down financial data and trends in a digestible format. Key investment terms are explained through engaging infographics that make learning both interactive and effective. To ensure a broad usability range, the template is fully compatible with popular presentation platforms such as PowerPoint, Google Slides, and Keynote. This compatibility allows users to easily adapt and present the information across different devices and settings, making it an invaluable tool for personal education or group training sessions in various learning environments.


6 slides
Hospital Management System Presentation
Bring structure and efficiency to your healthcare operations with this professional presentation. Designed to simplify complex hospital workflows, it helps visualize patient management, service coordination, and system processes with clarity. Ideal for administrators and consultants, it’s fully editable and compatible with PowerPoint, Keynote, and Google Slides for seamless customization.


5 slides
Compete-Free Market Space Creation Presentation
The Compete-Free Market Space Creation Presentation is designed to help illustrate a strategic shift toward innovation-led market growth. This circular diagram layout allows you to highlight four essential focus areas—each with customizable icons, titles, and supporting text. Ideal for presenting frameworks based on Blue Ocean Strategy, business differentiation, or uncontested market exploration. The clean, professional design supports storytelling with clarity and flow, making it perfect for consultants, business strategists, and executive teams. Fully editable in PowerPoint, Keynote, and Google Slides for maximum flexibility.


26 slides
Understanding the Stock Market Presentation
Step into the exciting world of finance with our dynamic and sleek presentation template, perfect for understanding the stock market! This comprehensive guide simplifies complex financial concepts, making it an ideal resource for beginners, students, and professionals. Featuring a sophisticated collection of slides, this template covers key topics such as market trends, investment strategies, and financial analysis. The design integrates bold colors, sharp graphics, and well-organized layouts to keep your audience engaged and informed. Infographics and charts break down intricate data, while mockups offer realistic previews of stock market tools. Fully customizable and versatile, this template can be adapted to suit various presentation needs and styles. It is compatible with PowerPoint, Keynote, and Google Slides, ensuring smooth and professional presentations across different platforms. Perfect for financial workshops, educational seminars, or anyone looking to deepen their understanding of the stock market.

24 slides
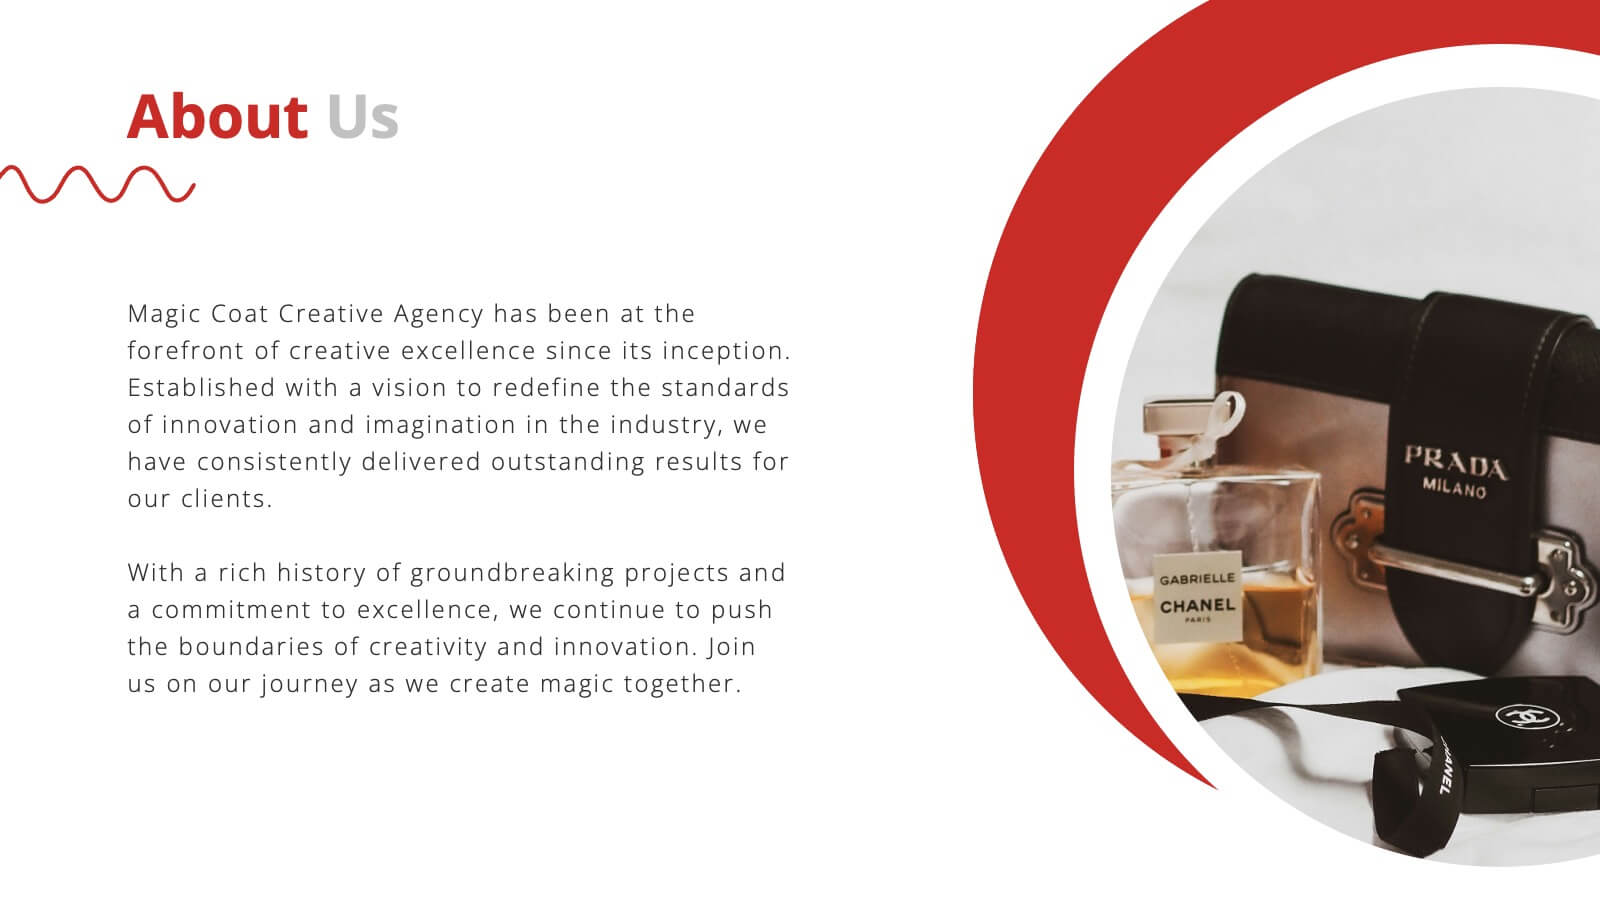
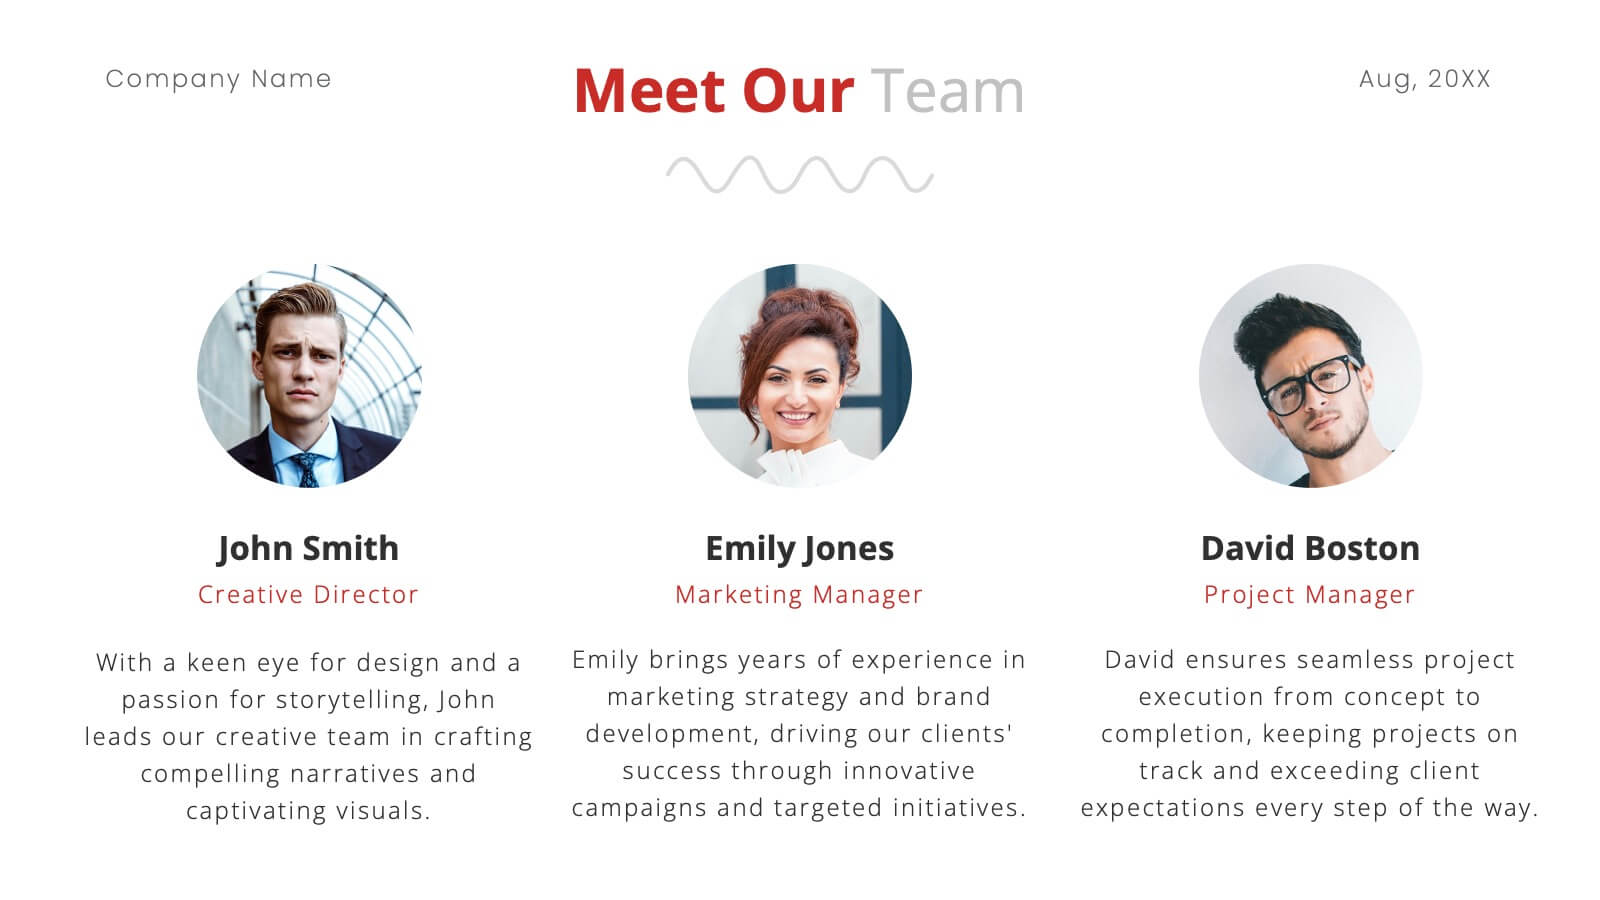
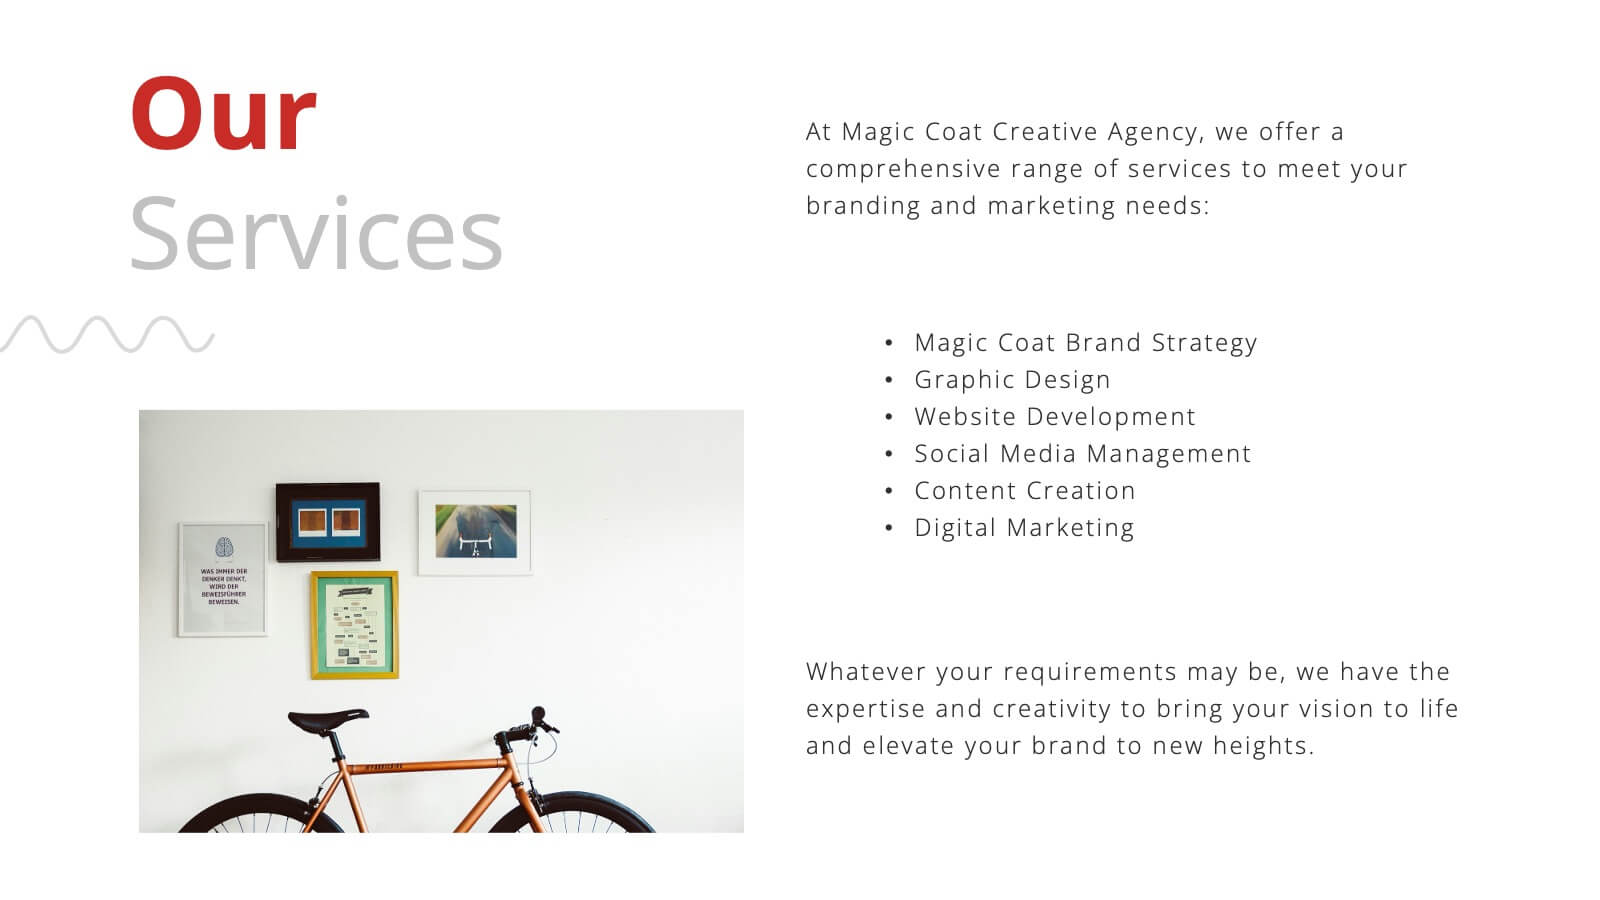
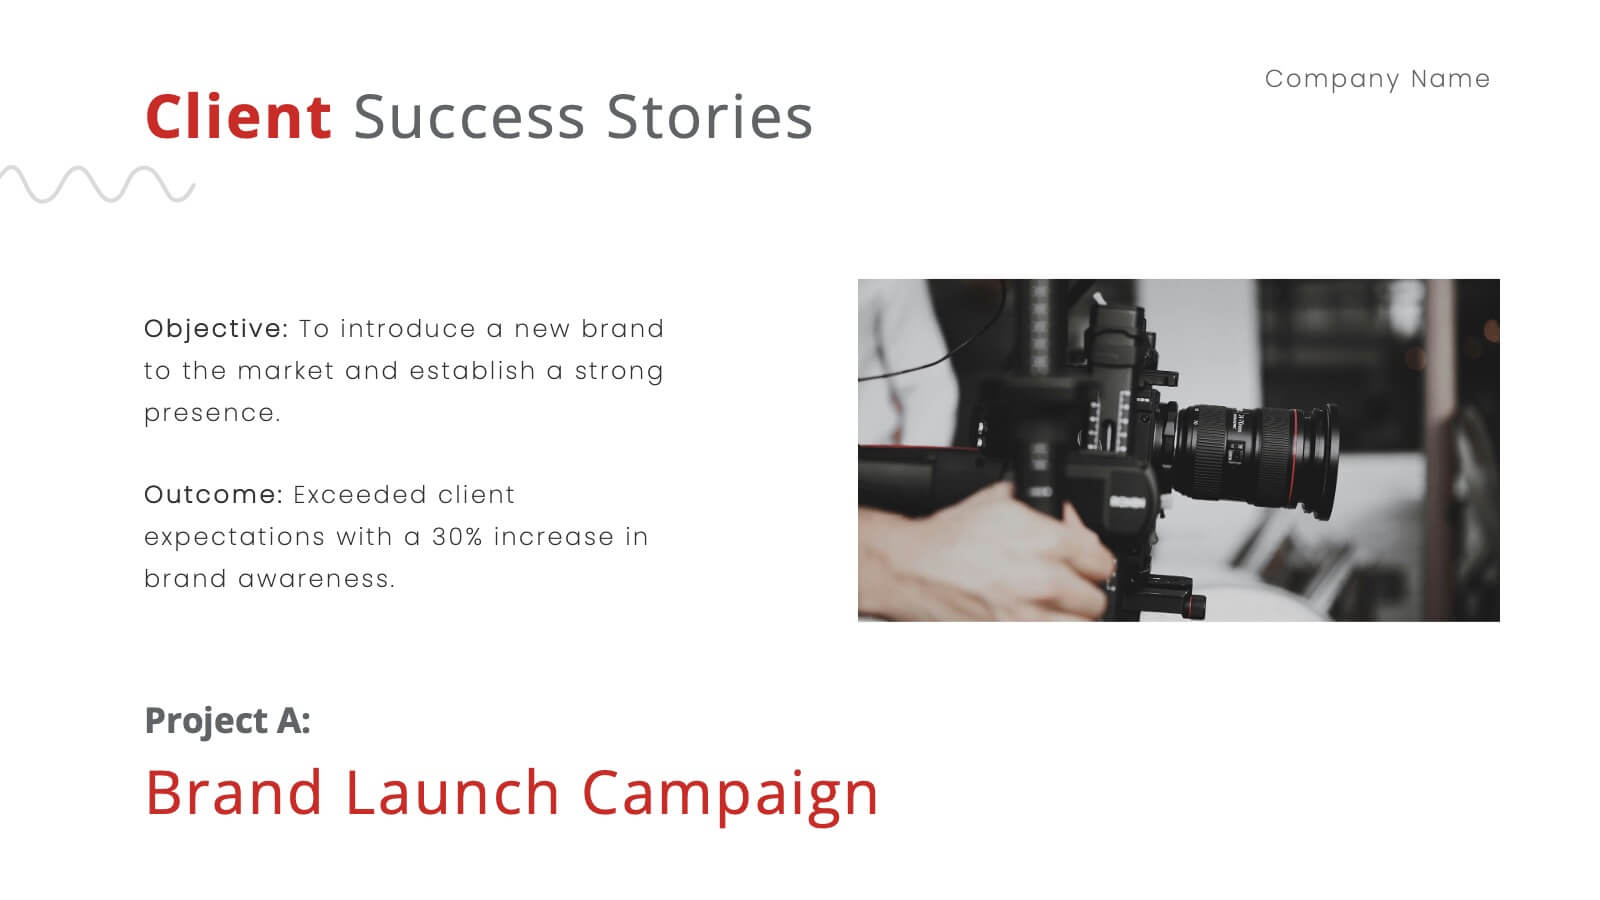
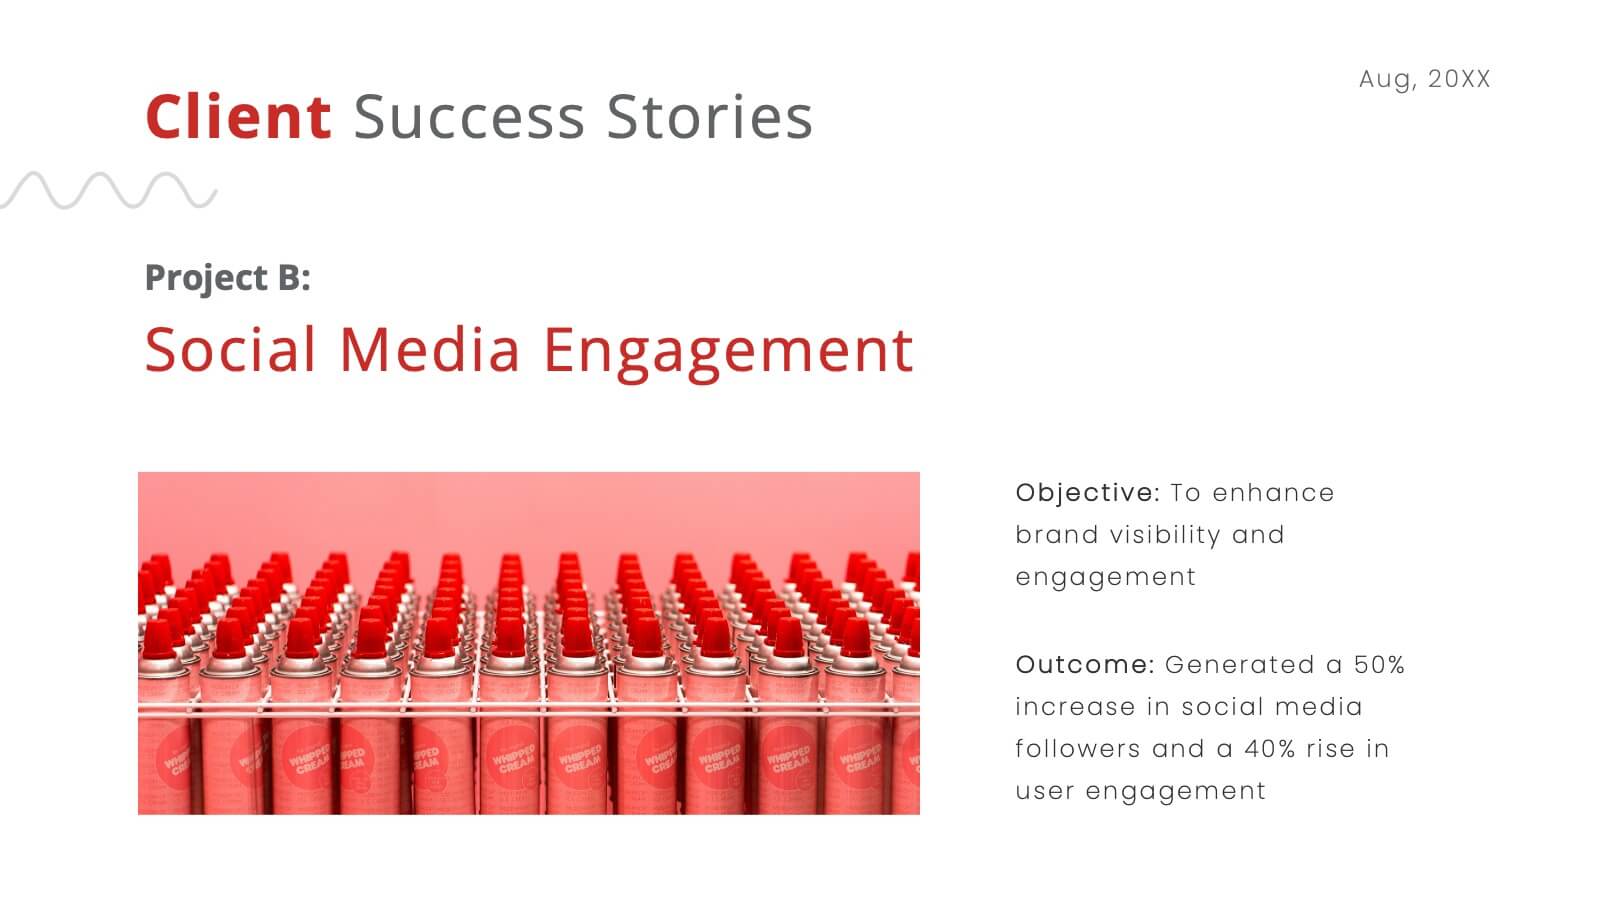
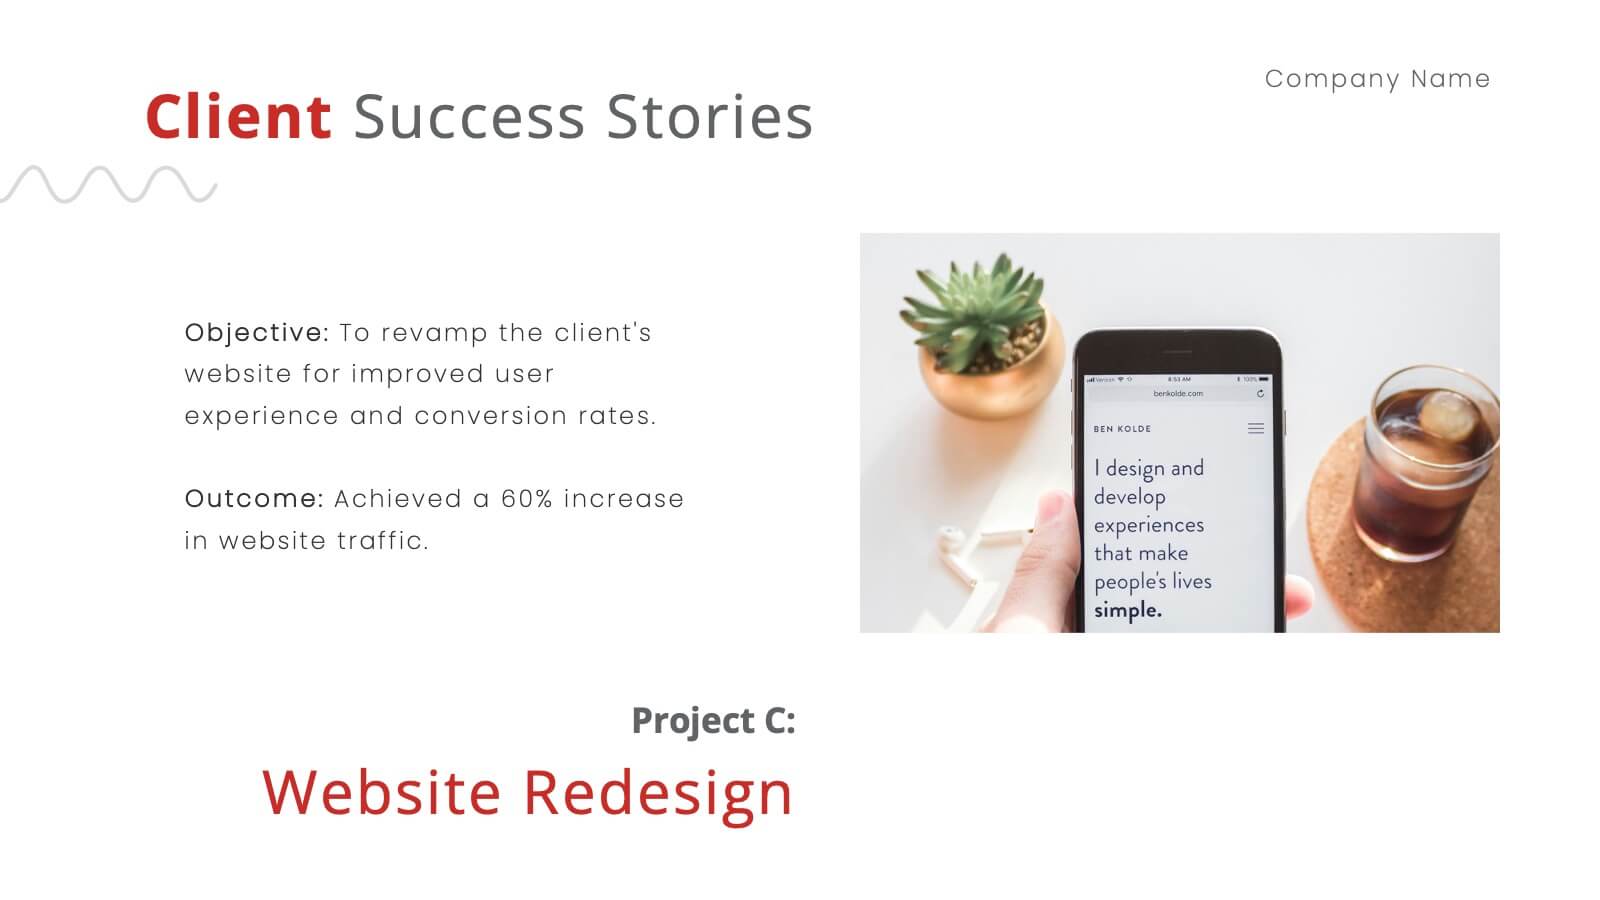
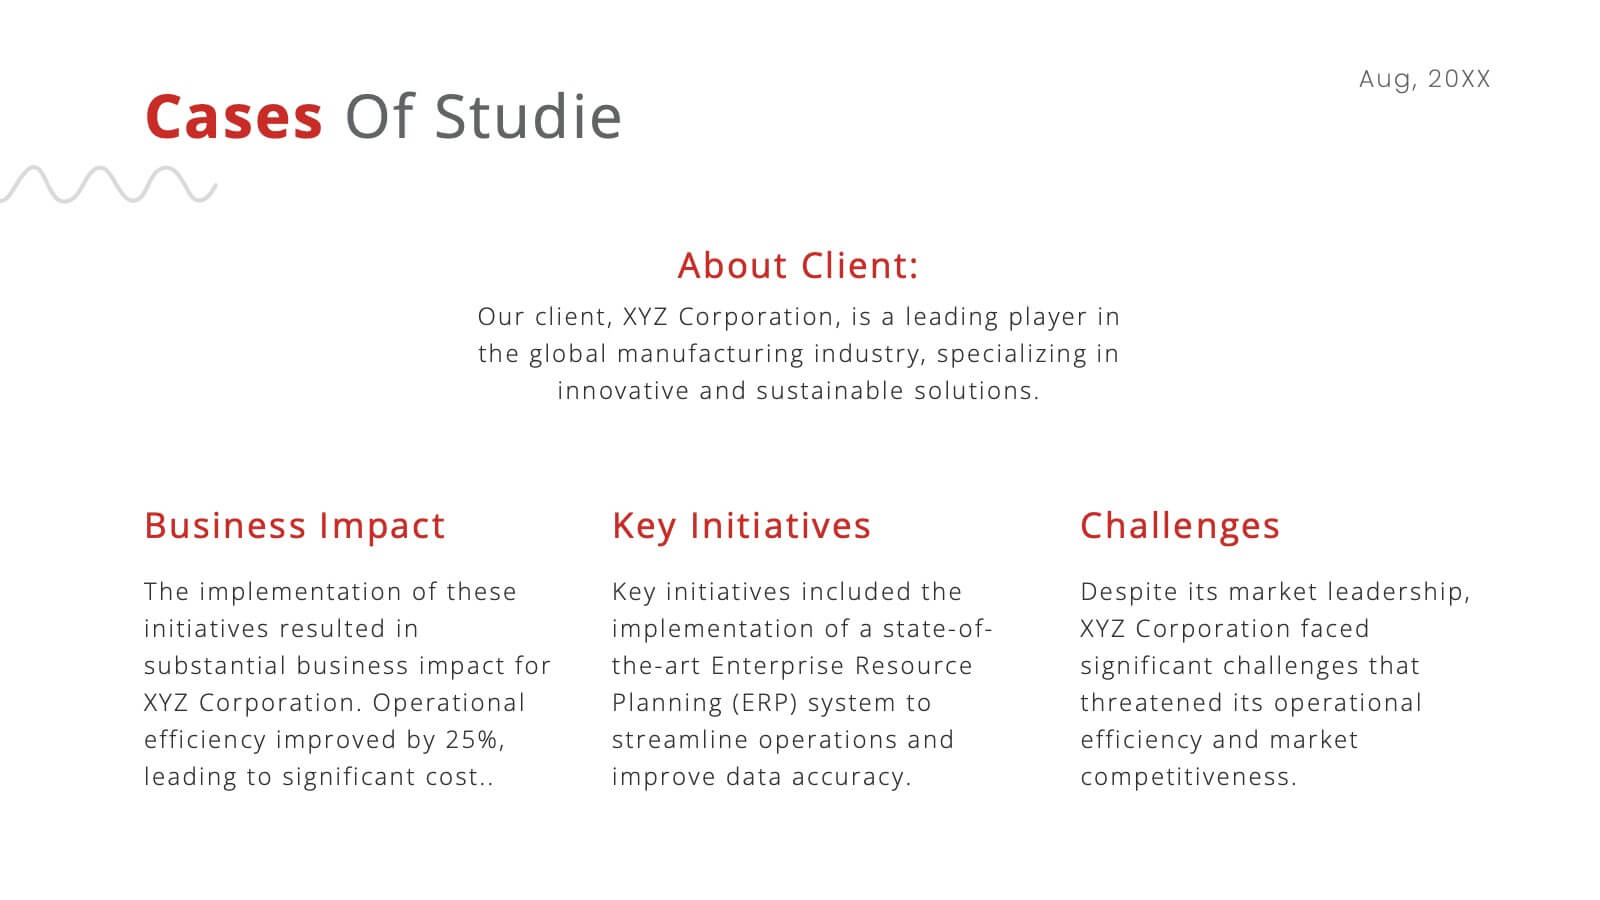
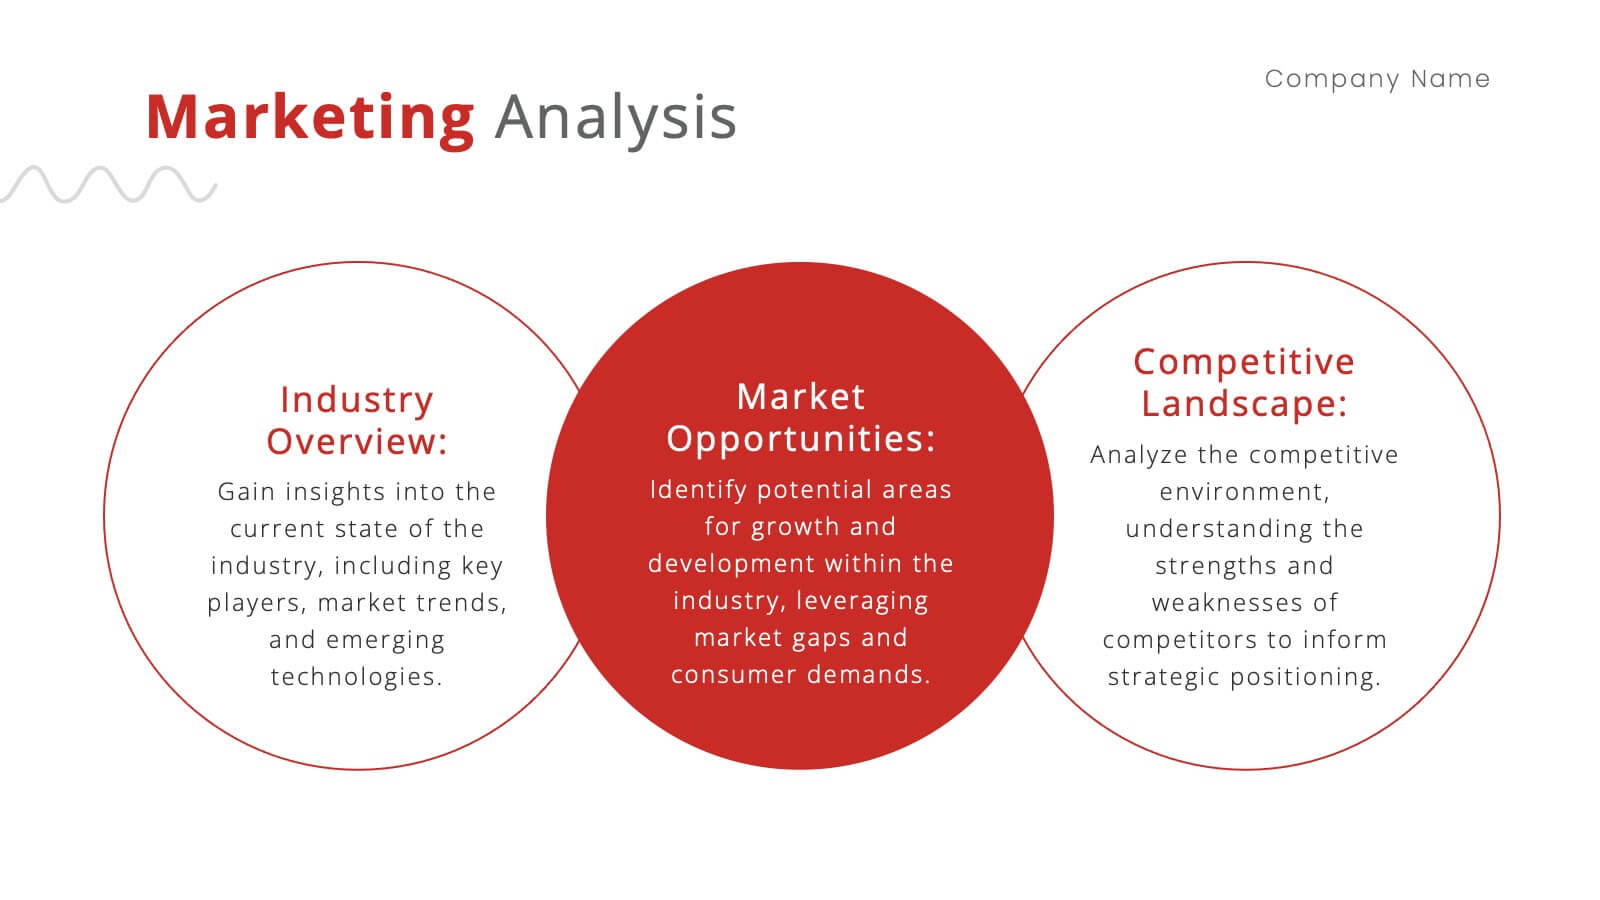
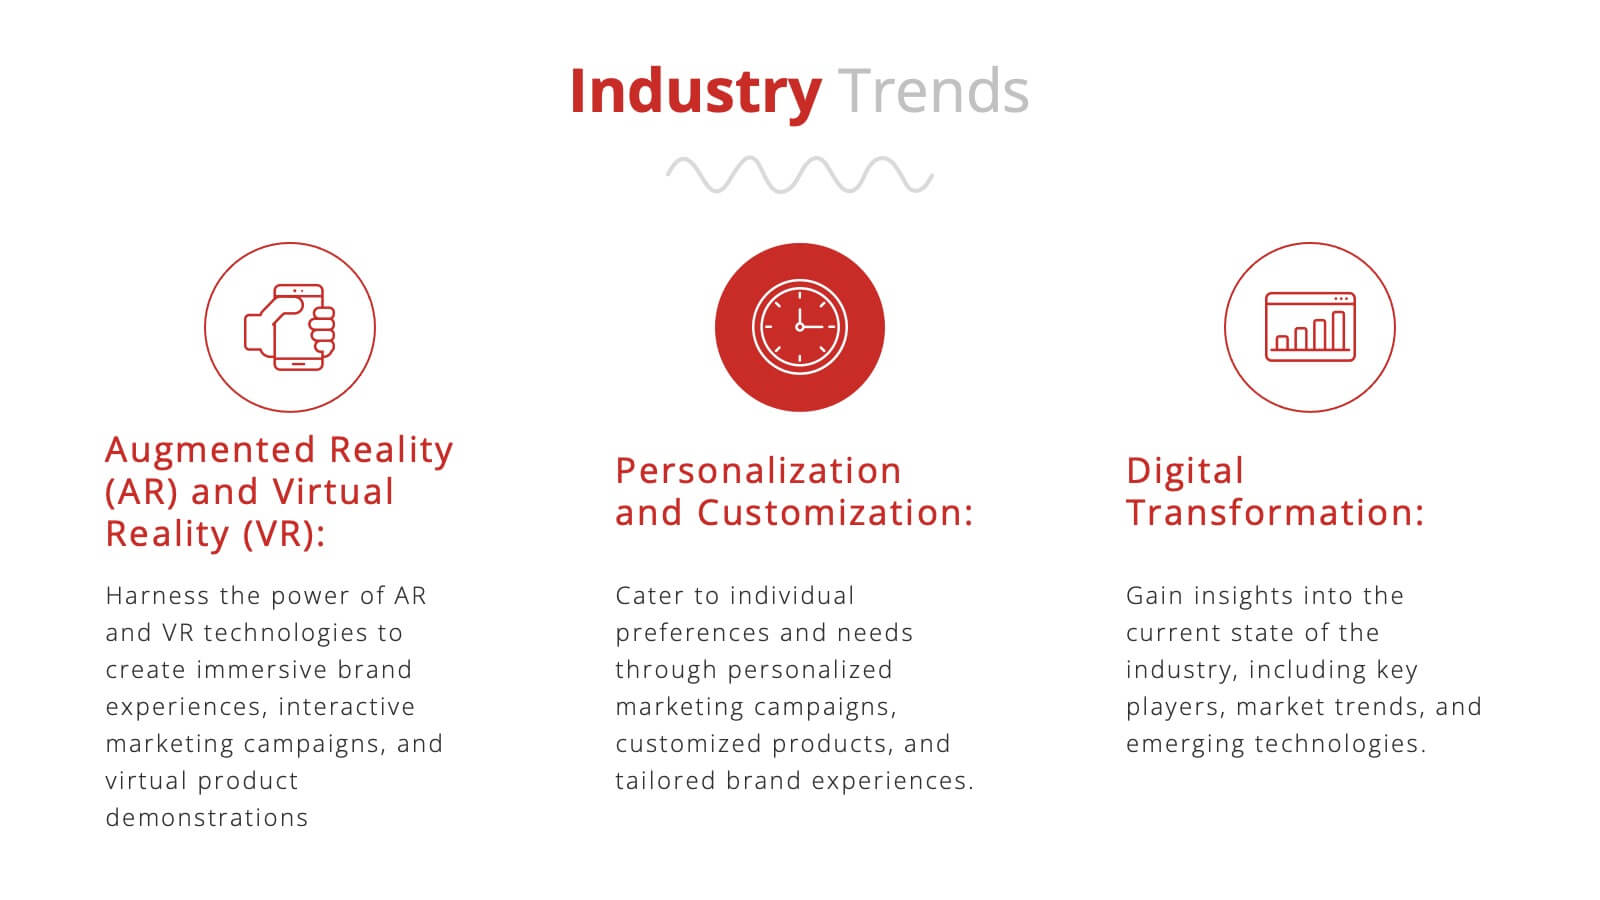
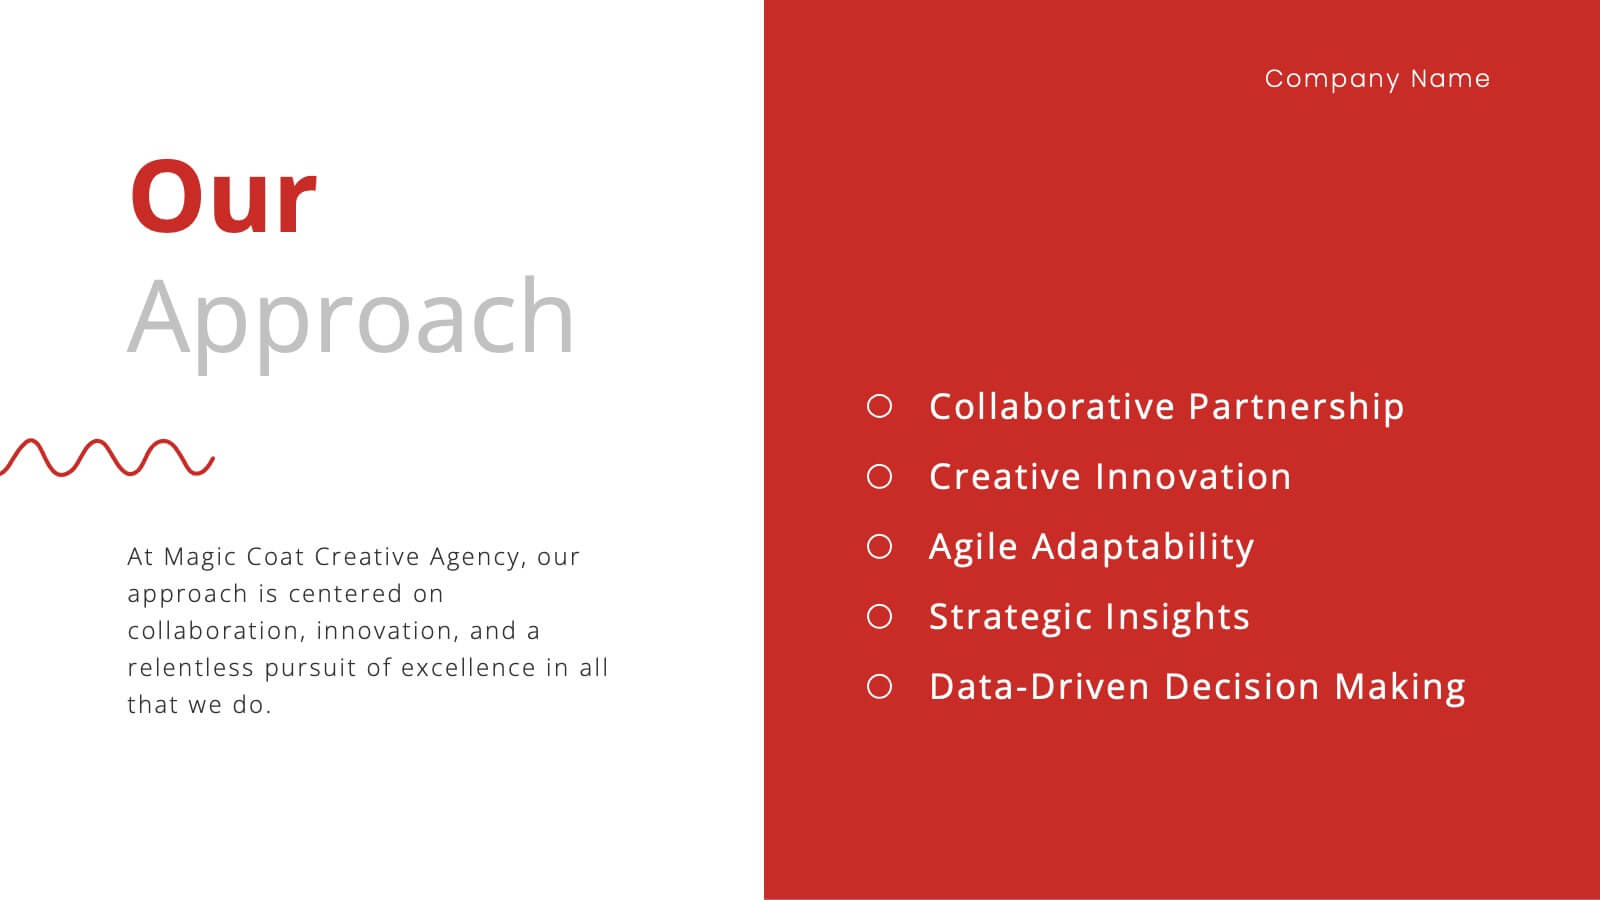
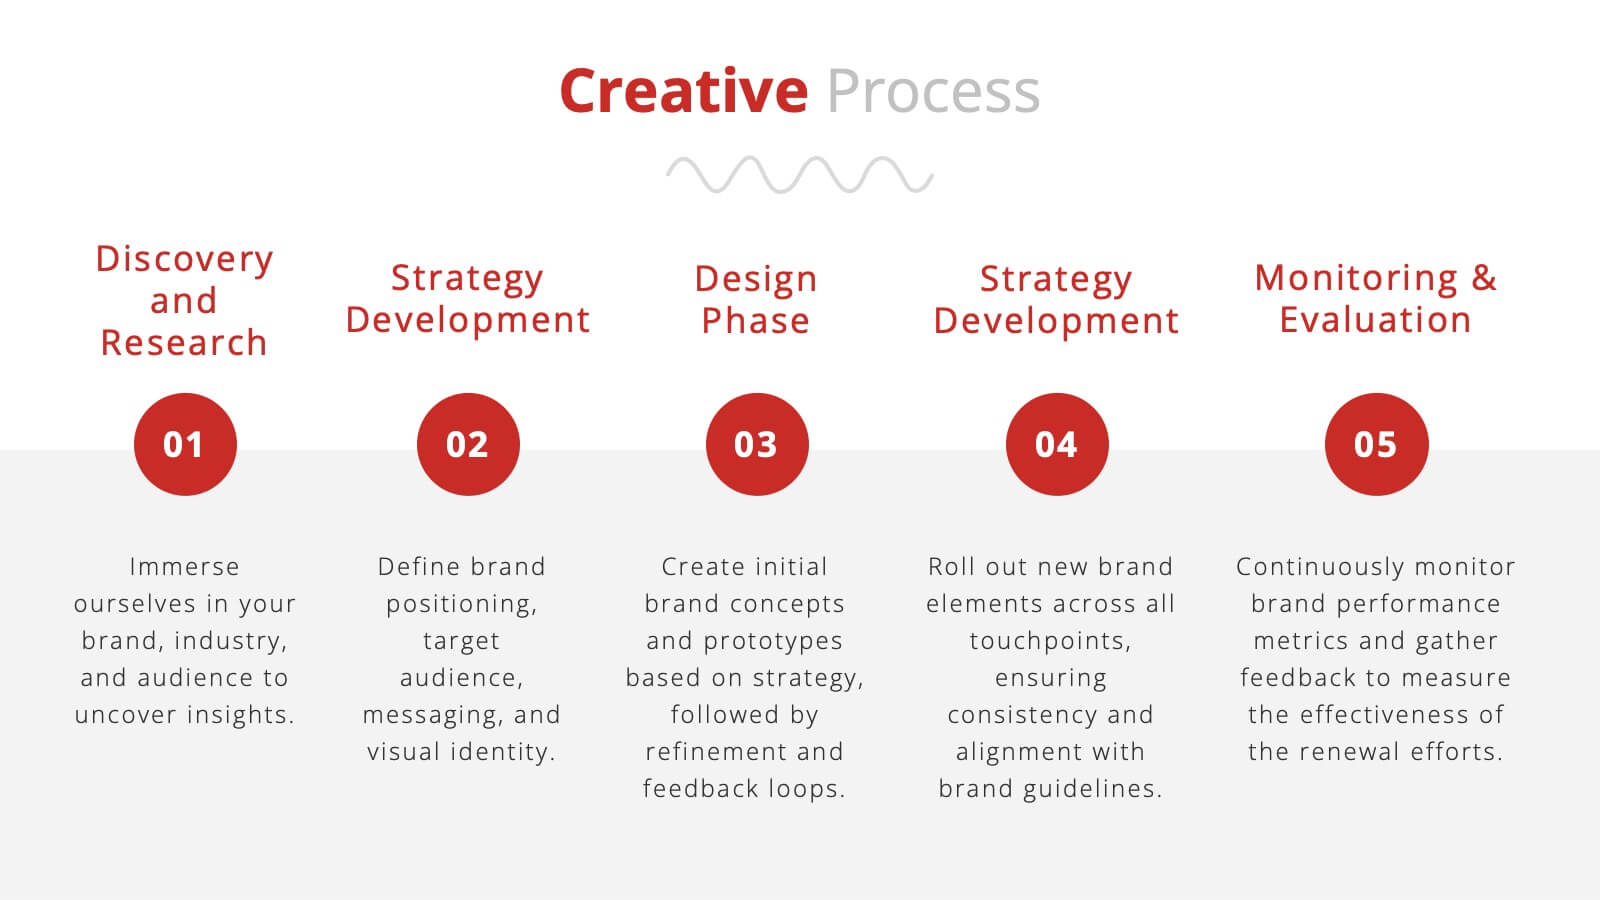
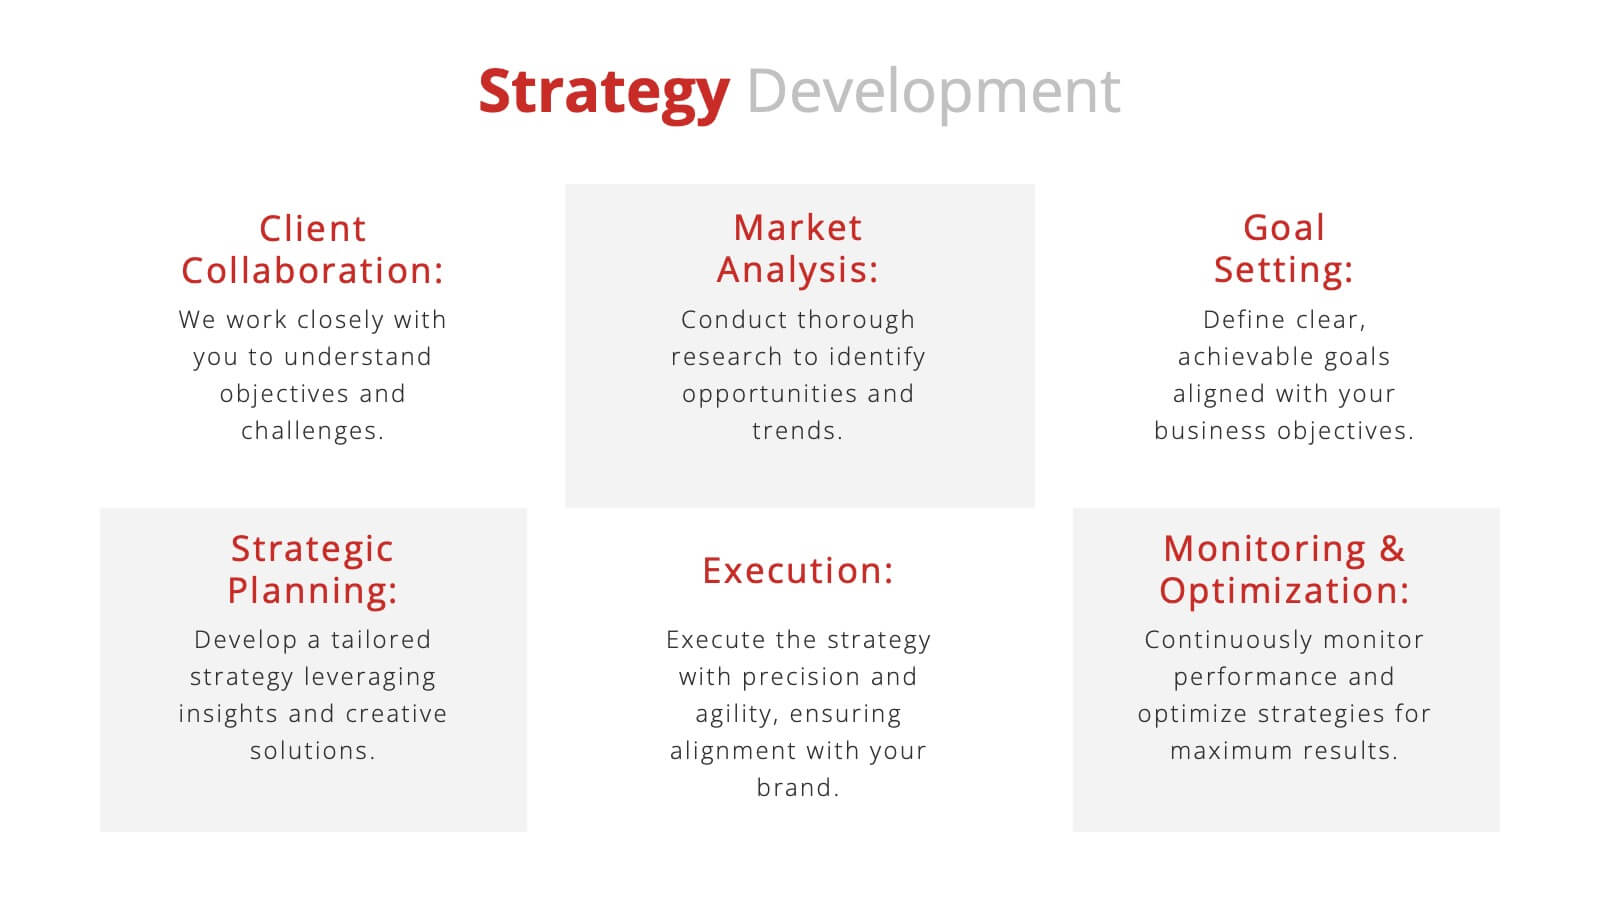
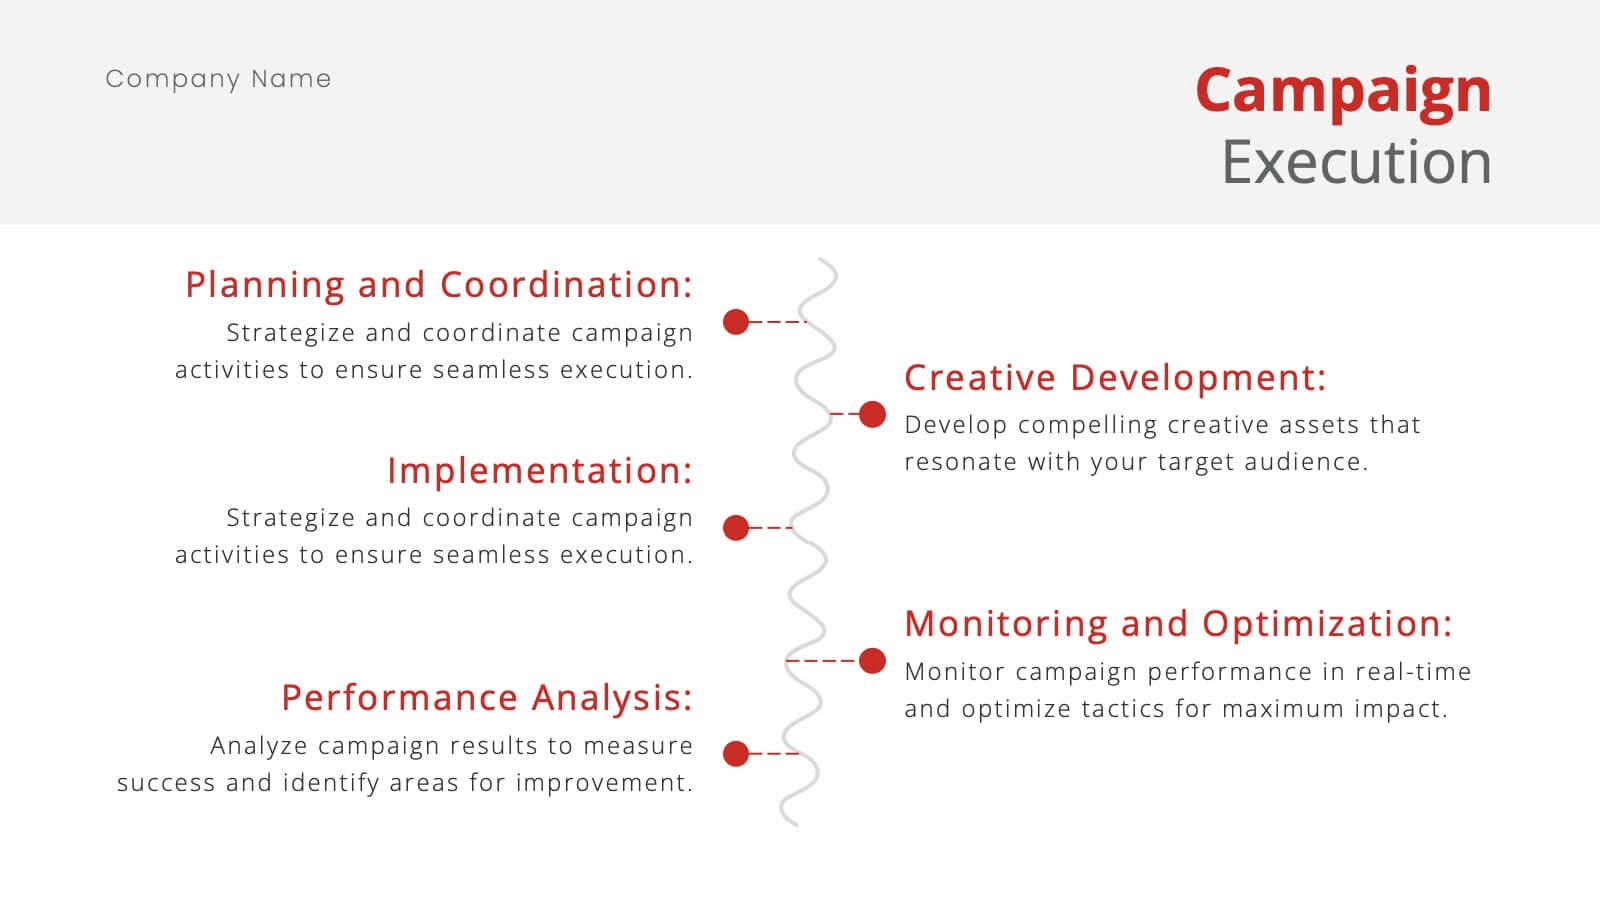
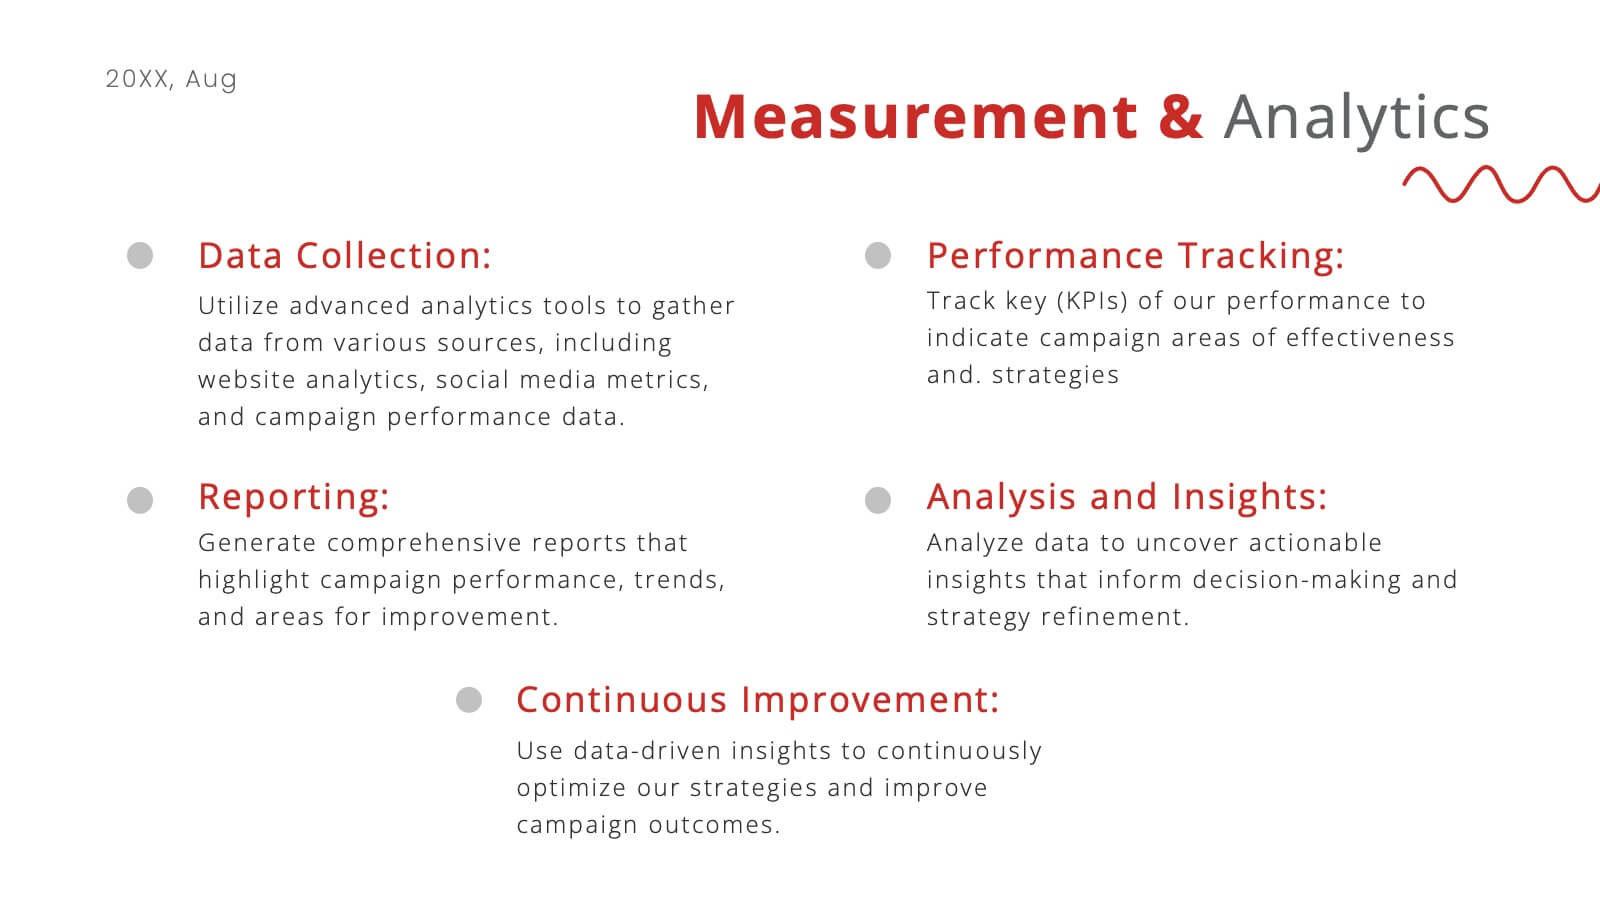
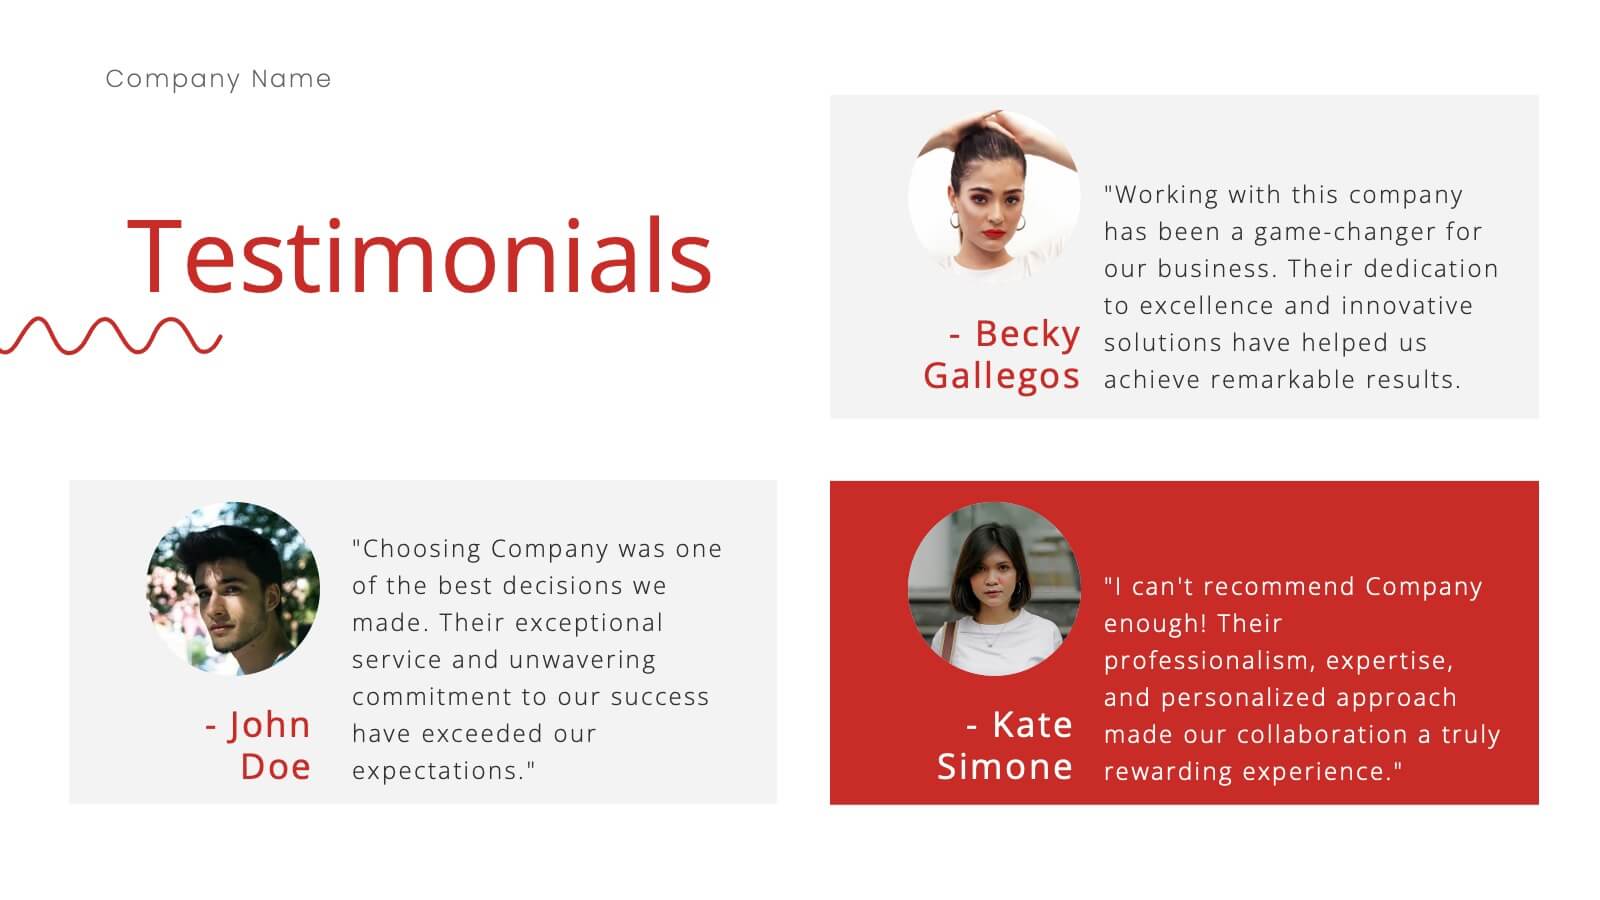
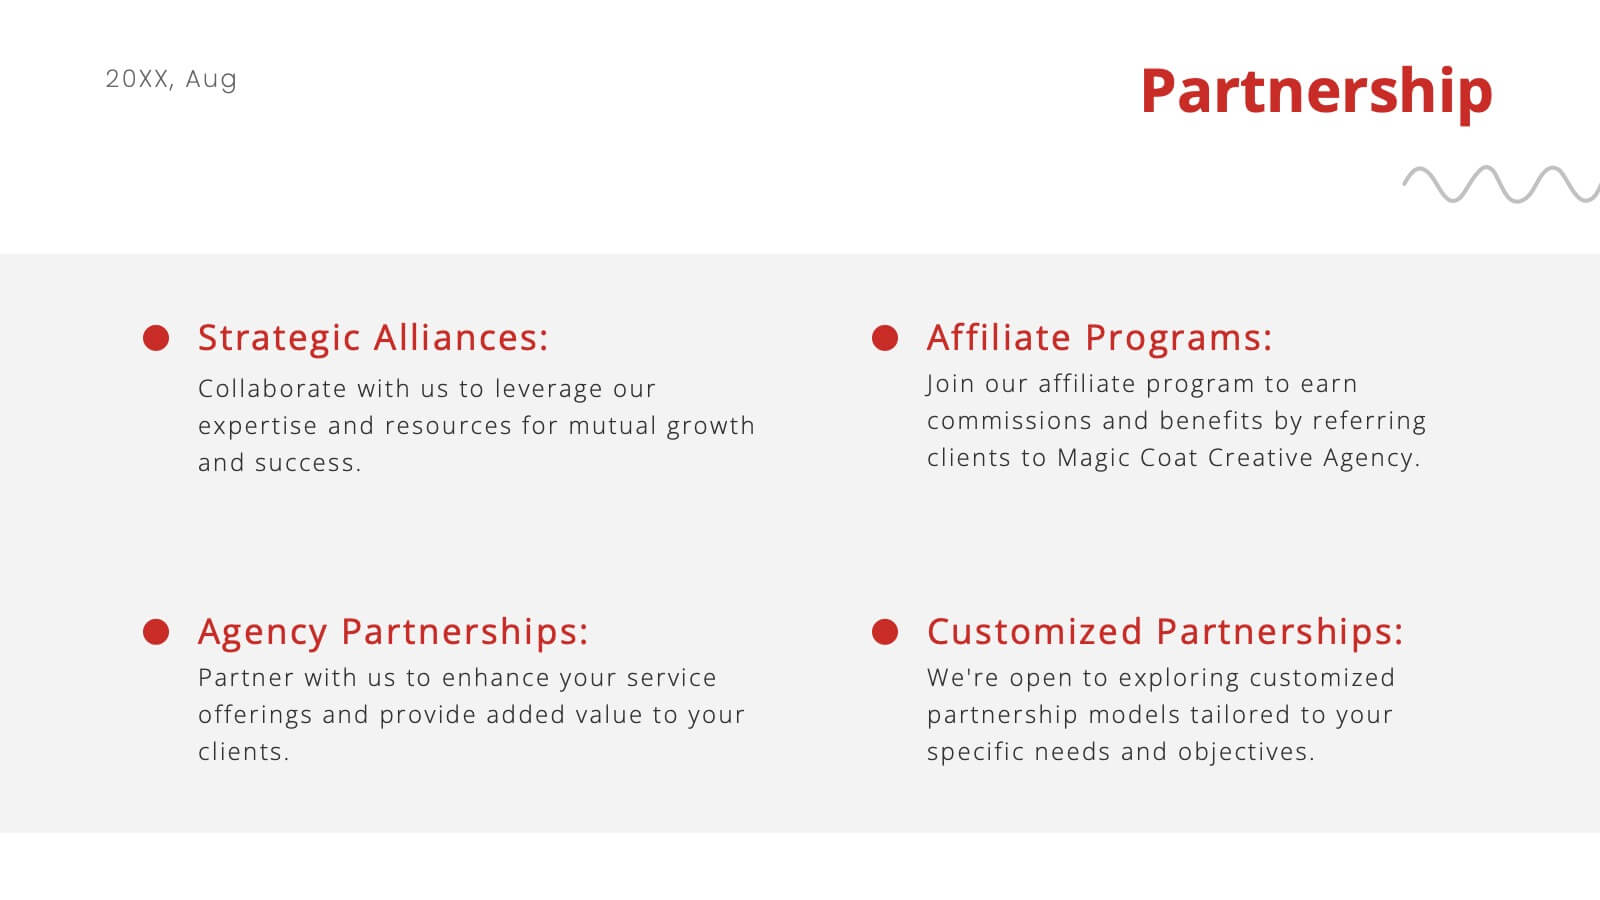
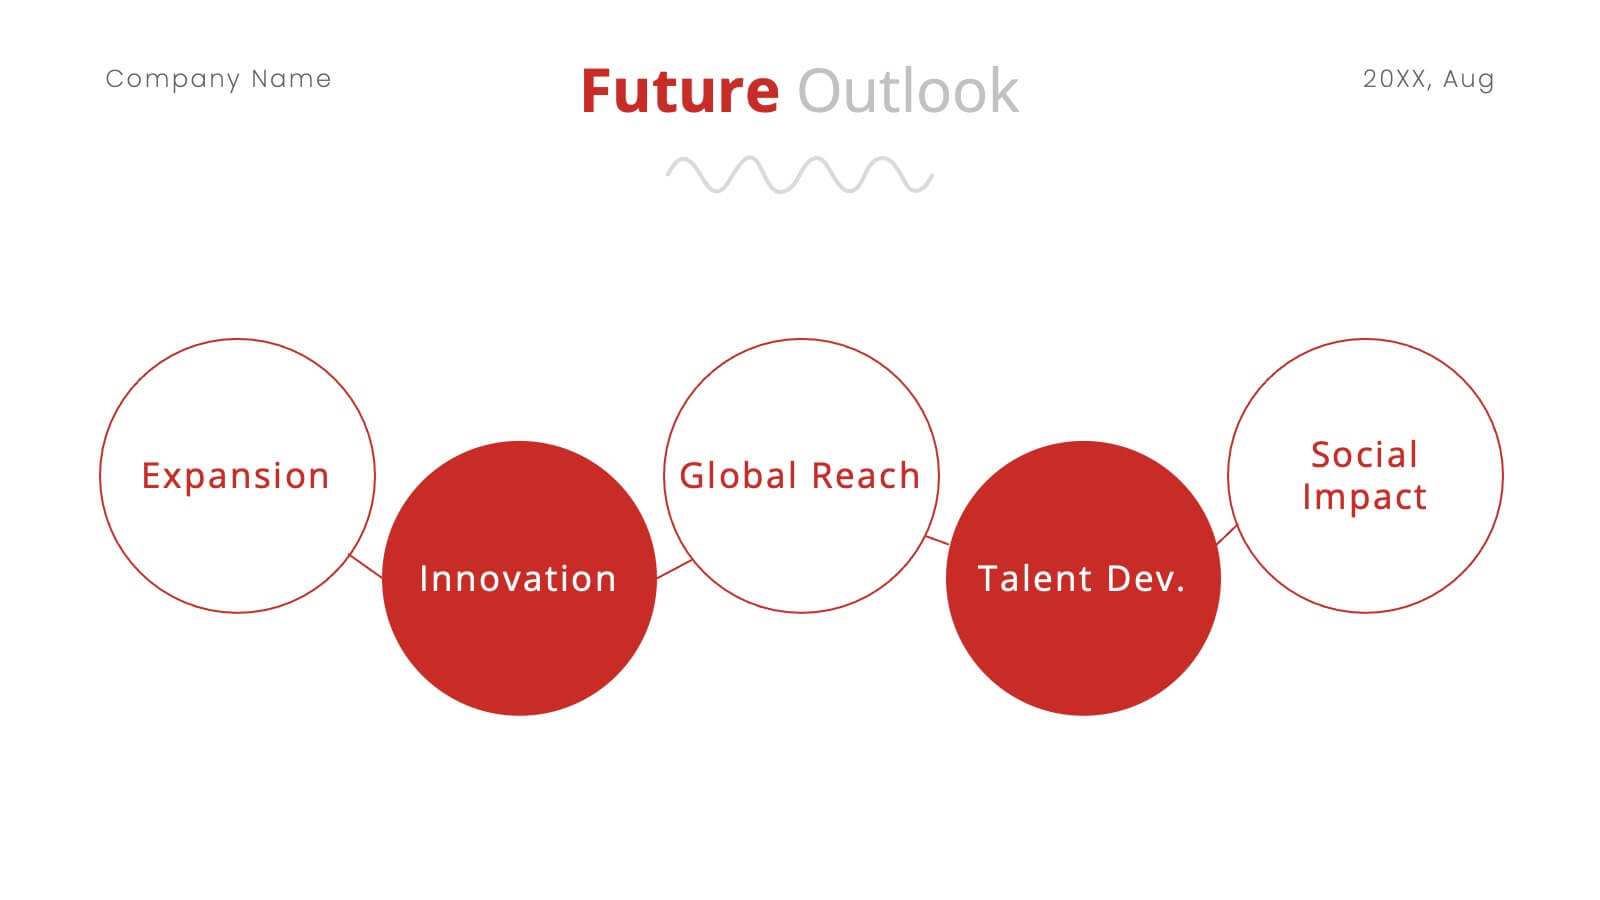
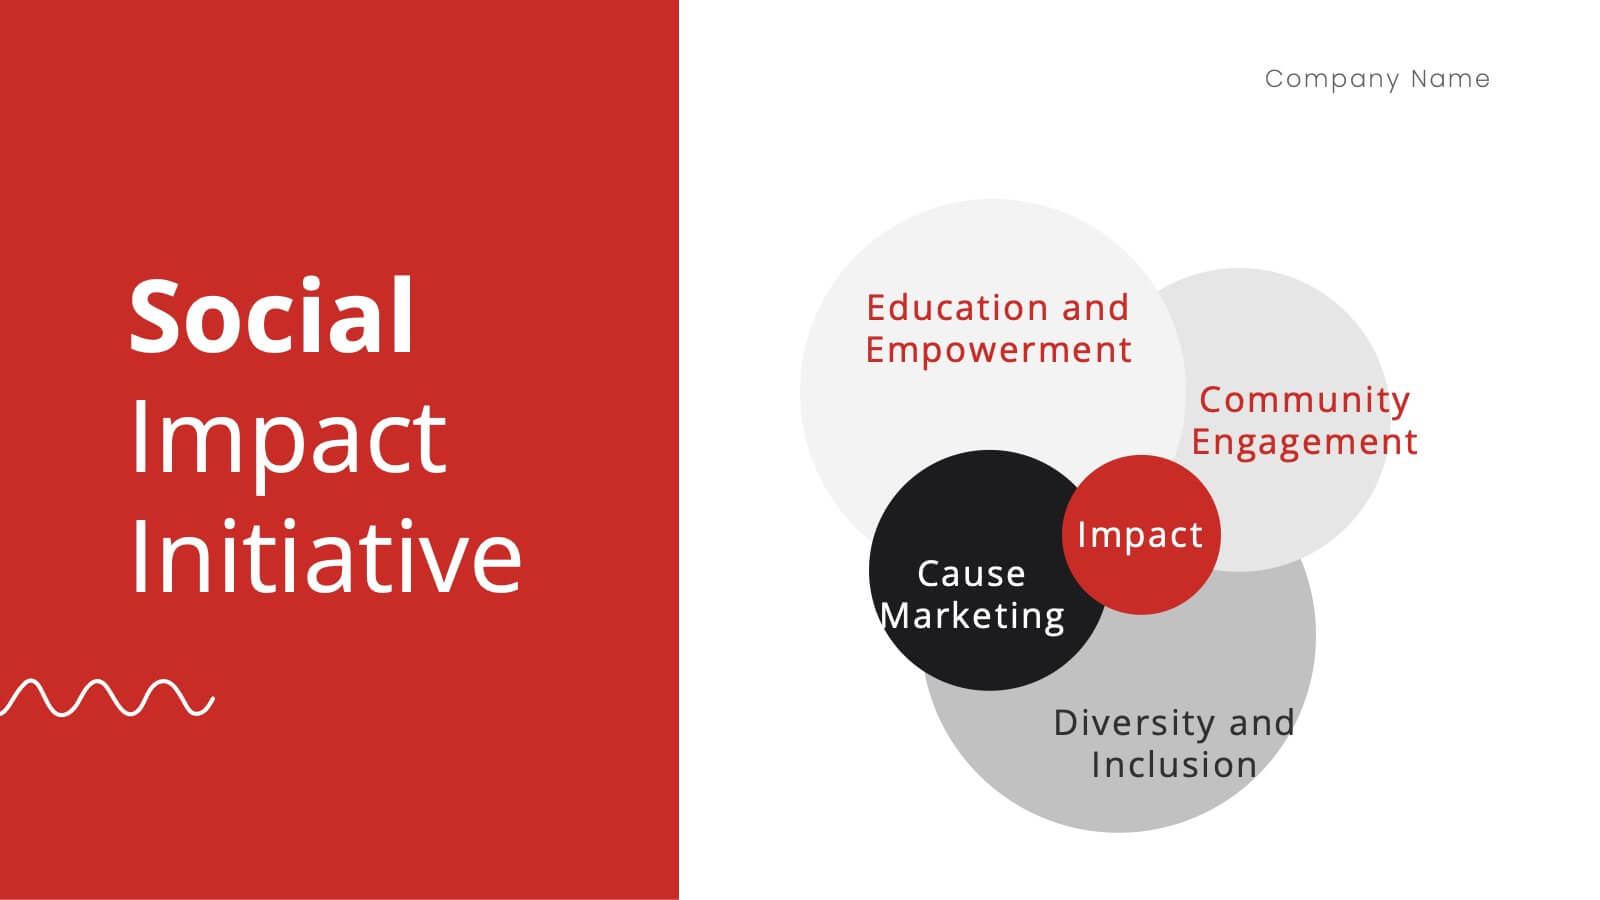
Nickel Advertising Agency Proposal Presentation
Take your advertising agency to the next level with this sleek and modern presentation template! Highlighting your services, team, success stories, and marketing strategies, it’s the perfect tool to showcase your agency’s strengths and capabilities. Fully customizable and compatible with PowerPoint, Keynote, and Google Slides, this template is ideal for impressing potential clients and partners.


6 slides
IT Operations Workflow Presentation
Visualize your IT processes with a sleek, structured flow that highlights every operational step from start to finish. Ideal for presenting systems management, network operations, or support frameworks, this presentation brings clarity to technical workflows. Fully compatible with PowerPoint, Keynote, and Google Slides for easy customization and seamless presentation delivery.


10 slides
Customer Satisfaction and Smile Rating Presentation
Visualize customer experience in a clear and engaging way with this Customer Satisfaction and Smile Rating slide. Featuring a vertical feedback meter and 5 customizable rating levels, this template is ideal for highlighting user sentiment, service evaluations, or feedback summaries. Perfect for performance reviews, UX reports, or NPS breakdowns. Compatible with PowerPoint, Keynote, and Google Slides.


5 slides
Attention to Action Model Framework Presentation
This sleek presentation visualizes the four key stages—Attention, Interest, Desire, and Action—in a clear, pyramid-based layout. Ideal for marketing, sales, or behavioral strategy discussions. Each step is color-coded for emphasis, making it easy to follow and present. Fully editable in Canva to fit your brand and messaging needs.


7 slides
Productivity Comparison Infographic
Step into the dynamic realm of efficiency with our Productivity Comparison Infographic. Set against a pristine white backdrop, the palette dances with the invigorating energy of orange, the reliability of blue, and the fervor of red. This lively template boasts engaging infographics, custom-designed icons, and adaptable image placeholders that vividly illustrate the highs and lows of productivity metrics, tools, and strategies. Expertly crafted for Powerpoint, Keynote, or Google Slides. A must-have for business analysts, team leads, productivity coaches, or any professional keen on spotlighting productivity contrasts.


5 slides
Technology Innovation Infographics
Technology innovation refers to the process of creating and introducing new or improved technologies that have the potential to bring about significant advancements in various industries and sectors. These vertical infographics explores the world of technology innovation and its impact on various industries. These templates are designed to showcase the latest advancements, emerging trends, and transformative technologies that are shaping our digital landscape. These enable you to showcase the transformative power of technology and inspire your audience to embrace the opportunities it presents.


5 slides
Residential Market Trends Overview Presentation
Track market insights with clarity using the Residential Market Trends Overview Presentation. Featuring a clean, linear layout with four content points and a central house icon, this slide is ideal for showcasing housing data, price trends, investment insights, or neighborhood developments. Fully editable in Canva, PowerPoint, Keynote, and Google Slides—perfect for real estate pros, analysts, or urban planners.


34 slides
Incubator Pitch Deck
An Incubator Pitch Deck is used by startups or entrepreneurs to pitch their business idea to an incubator or accelerator program, which are organizations that provide support, resources, and mentorship to early-stage startups to help them grow and succeed. This incubator pitch deck template is specifically tailored to the needs and requirements of the incubator or accelerator program. This template is designed with a professional and striking blue color palette, that adds a sense of sophistication and professionalism to your presentation. It also features a range of customizable slides that are specifically tailored for pitch presentations.


5 slides
Human Resource Functions Infographics
Illuminate the complexities of people management with our human resource functions infographics template. Cast in the professional yet warm palette of black, orange, pink, and red, this template is an essential tool for HR professionals, corporate trainers, and business leaders. It elegantly dissects various HR realms with its sleek graphics, intuitive icons, and dedicated image placeholders, making it perfect for showcasing recruitment processes, employee engagement strategies, or organizational culture principles. Its creative, vertical style is designed to hold the attention and fuel the imagination, turning any HR presentation into a compelling narrative.


8 slides
Company Vision and Strategic Direction Presentation
Present your company’s long-term goals with clarity using the Company Vision and Strategic Direction Presentation. This clean, icon-led layout helps communicate your vision, focus areas, and roadmap in a linear, easy-to-follow format. Ideal for executive updates, investor decks, or team briefings. Compatible with PowerPoint, Canva, and Google Slides.