


Features
- 6 Unique Slides
- Fully editable and easy to edit in Microsoft Powerpoint, Keynote and Google Slides
- 16:9 widescreen layout
- Clean and professional designs
- Export to JPG, PDF or send by email


Do you have any questions?
Recommend


8 slides
Directional Diagram with Progress Arrows Presentation
Showcase milestones, track development, or visualize progress with the Directional Diagram with Progress Arrows Presentation. This modern layout features arrow-based steps, making it ideal for roadmaps, process stages, or timeline breakdowns. Customize labels, icons, and colors to suit your message. Fully editable in PowerPoint, Google Slides, and Canva.


20 slides
Octave Marketing Proposal Presentation
The Proposal Presentation Template offers a modern, dynamic design to showcase your business strategies, solutions, and goals. Featuring 20 fully editable slides, it covers objectives, methodologies, team expertise, timelines, and budget breakdowns. Perfect for impactful business proposals, it's compatible with PowerPoint, Keynote, and Google Slides for seamless customization.


5 slides
Business Strategy Decision Tree Presentation
Streamline your strategic decisions with this Business Strategy Decision Tree template. Designed to visually map out options, outcomes, and key choices, this slide is perfect for business analysts, consultants, and executives. Featuring hierarchical branching with clear icons and customizable sections, it helps illustrate strategic planning, problem-solving, and risk assessment. Fully compatible with PowerPoint, Keynote, and Google Slides for seamless presentation integration.


6 slides
Goal Setting and Strategic Planning Presentation
Present objectives and action plans with the Goal Setting and Strategic Planning template. Featuring a modern segmented design, this layout is perfect for outlining priorities, initiatives, and milestones. Fully editable in Canva, PowerPoint, and Google Slides, allowing you to adapt colors, icons, and text to match your business vision.


18 slides
Business Data Analysis Dashboard Presentation
Track Business Performance Effectively! The Business Data Analysis Dashboard Presentation provides a structured and visually engaging way to showcase key metrics, trends, and insights. Featuring dynamic charts, graphs, and KPI indicators, this template is perfect for executive reports, financial reviews, and strategic planning. Fully customizable and compatible with PowerPoint, Keynote, and Google Slides for seamless presentation.


5 slides
Global Warming Activism Infographics
Dive into environmental advocacy with the global warming activism infographics template, steeped in earthy tones of green and brown, reflecting our planet's natural palette. This vertical collection, abundant with nature and animal-themed elements, is a tool for activists, and NGOs driving change. It melds visuals with stark realities, using striking graphics, icons, and adaptable image placeholders to spotlight climate change's impacts and the urgent strides needed for ecological preservation. Compatible with Powerpoint, Keynote, and Google Slides. By simplifying complex information, it empowers community engagement and fosters a united front for global healing efforts.


23 slides
Night Slash UX Strategy Plan Presentation
Elevate your UX/UI design presentations with the Night Slate UX Strategy Plan template! This dynamic and visually striking design is perfect for conveying your strategic ideas with impact. The bold use of contrasting black and orange creates a modern and energetic vibe, making your content stand out. Each slide is thoughtfully designed to cover every aspect of your UX/UI strategy, from user research and personas to prototyping and user testing. The template includes sections on design principles, wireframes, and responsive design, ensuring that your audience gains a comprehensive understanding of your approach. Whether you're presenting to stakeholders or guiding a design team, this template is designed to keep your audience engaged and informed. Fully compatible with PowerPoint, Keynote, and Google Slides, the Night Slate template is your go-to tool for delivering compelling UX/UI strategy presentations that leave a lasting impression.


5 slides
Teaching Strategy for Classrooms Presentation
Make classroom planning more engaging with the Teaching Strategy for Classrooms Presentation. This stacked book-style layout is ideal for outlining instructional steps, lesson phases, or teaching priorities. Perfect for teachers, education trainers, or curriculum planners. Fully editable in PowerPoint, Keynote, Canva, and Google Slides.


22 slides
Arachne Digital Marketing Strategy Plan Presentation
Weave a powerful digital marketing strategy with this sleek, Arachne-inspired presentation! Perfect for outlining your digital marketing plans, this template helps you highlight key strategies, analytics, and campaign goals in a structured and visually engaging way. Its modern design keeps your audience focused. Compatible with PowerPoint, Keynote, and Google Slides.


6 slides
Innovative Design Thinking Steps Presentation
Bring structure to creativity with a bold, modern layout that walks your audience through each phase of innovation. Perfect for showcasing processes, strategy development, or brainstorming frameworks, this presentation makes complex ideas feel simple and engaging. Fully compatible with PowerPoint, Keynote, and Google Slides for effortless editing and presentation.


7 slides
Network Infographics Presentation Template
Networking is a great way to meet people in your same field and gain valuable information. It's a great way to meet and connect with other professionals, find out about job opportunities, and keep up with what's new in your field. This template is perfect for becoming informed on the benefits of networking. Networking is a powerful way to expand your circle of contacts and get in touch with people who can help you advance in your career. This template includes a helpful infographic that explains the standard process, visualizations and diagrams, providing you with a great starting point.


6 slides
Company Profile Insights Infographic
This set of templates is designed to convey critical company insights through a visually engaging presentation, ideal for showcasing a company’s core strengths and operational highlights. Each layout provides a structured approach to display key data points and insights that are vital to understanding the company's market position and strategic direction. The templates feature a variety of elements, such as statistical displays, financial summaries, and operational benchmarks, that provide a comprehensive snapshot of company performance. By integrating graphical representations like bar charts, pie charts, and progress indicators, these templates make complex data accessible and easily understandable. The color schemes and design elements can be customized to align with company branding, ensuring a cohesive look throughout the presentation. These are excellent tools for annual meetings, investor briefings, or internal reviews, enabling businesses to effectively communicate their achievements, identify trends in their operations, and guide strategic planning discussions. By utilizing these templates, companies can highlight their successes, areas for improvement, and future outlook in a clear and professional manner, fostering transparency and confidence among stakeholders.


2 slides
Modern Business Title Slide Presentation
Step into the future of presentations with the "Modern Business Slide," designed to make your corporate message shine. This template features a sleek, minimalist layout with bold typography and a striking visual of a stylish office setting, perfect for making a professional impact. Ideal for any business presentation, it's compatible with PowerPoint, Keynote, and Google Slides, ensuring versatility across different platforms.


6 slides
Education Through Gamified Learning Presentation
Make learning fun and engaging with the Education Through Gamified Learning Presentation. This creative slide layout uses a playful interface with progress-style icons and a “Play” button to simulate game-based education paths. Ideal for educators, trainers, and eLearning designers. Fully customizable in Canva, PowerPoint, Keynote, and Google Slides.


5 slides
Letter Recognition Chart Presentation
Enhance learning and data visualization with this Letter Recognition Chart Presentation template. Featuring a modern, stepwise design with speech bubbles, this layout is perfect for education, branding, and business-related presentations. Fully customizable and compatible with PowerPoint, Keynote, and Google Slides.


20 slides
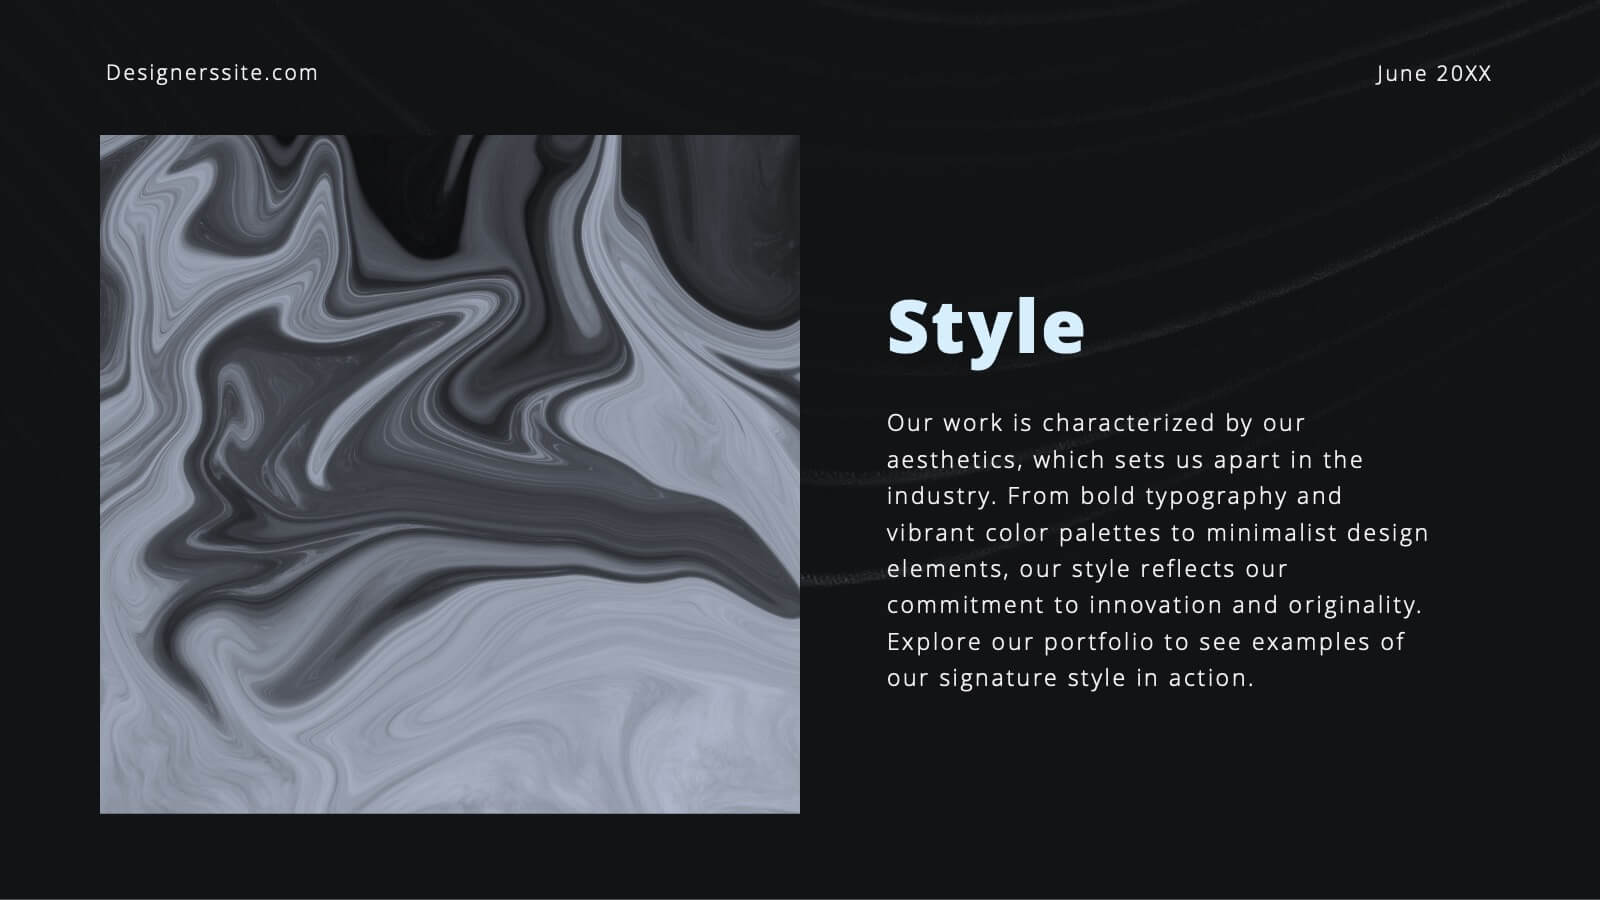
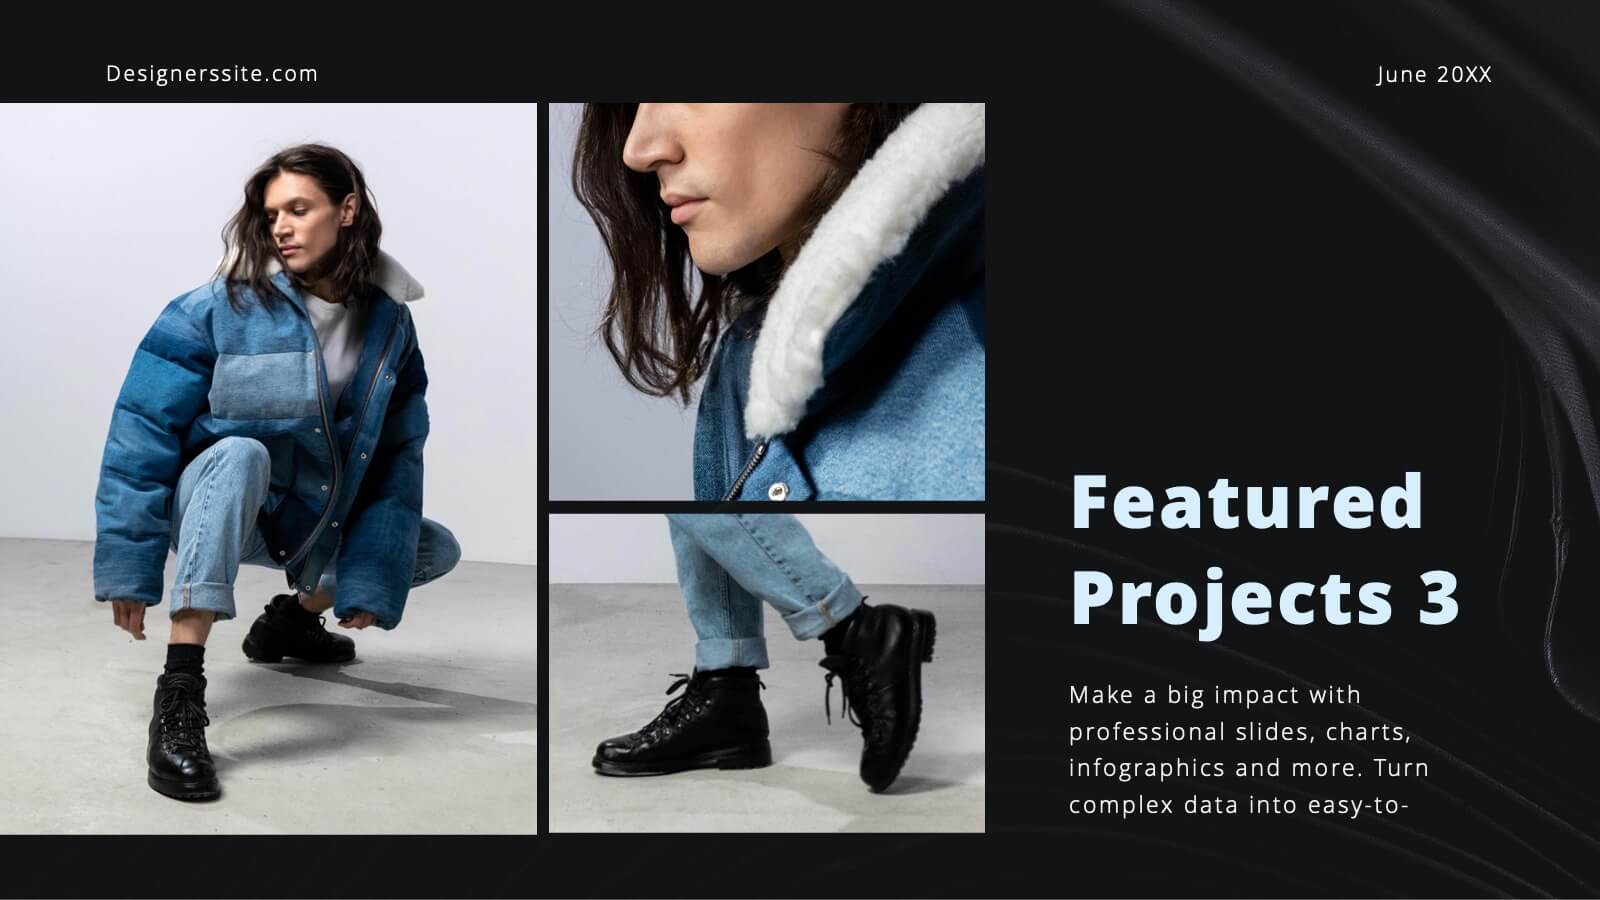
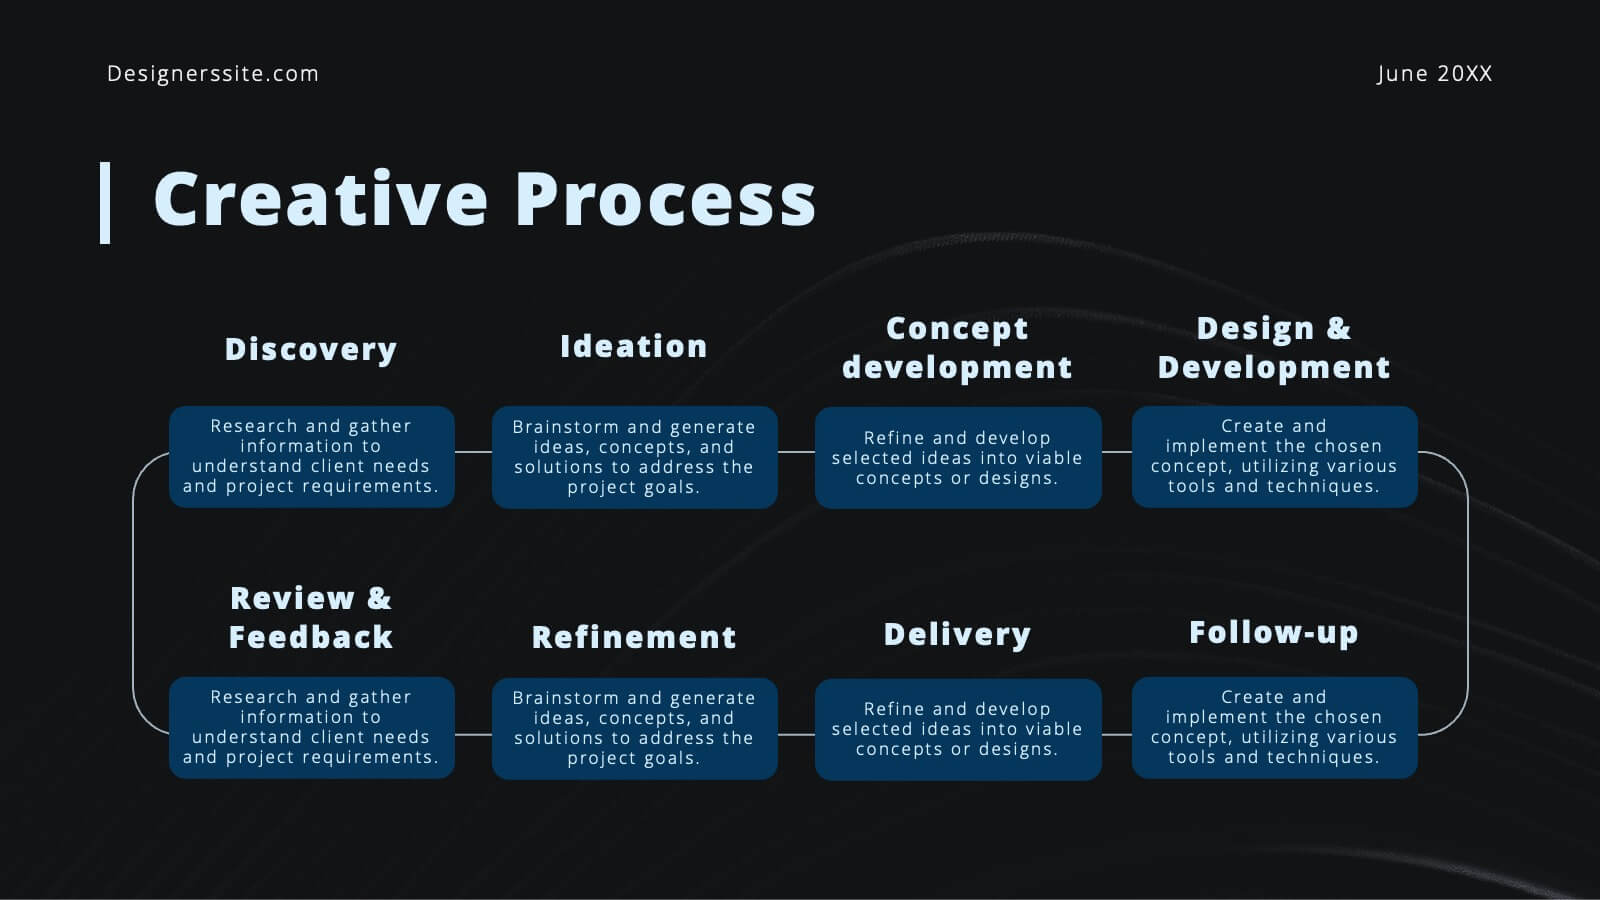
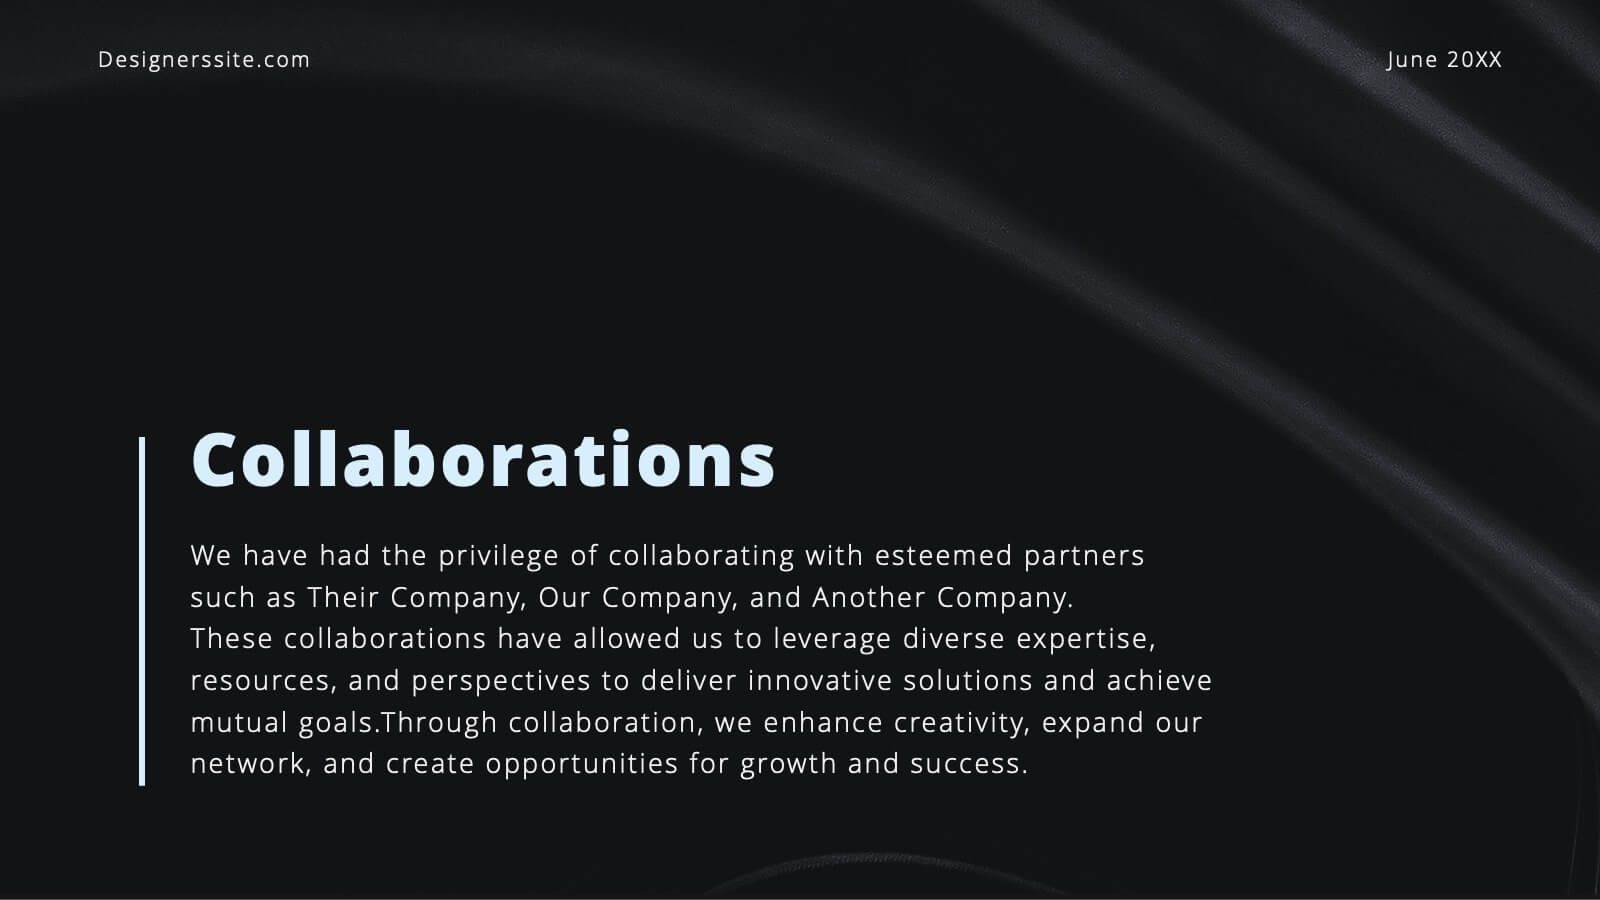
Bravo Creative Portfolio Presentation
Showcase your creative prowess with this sleek, modern portfolio presentation template. Perfect for highlighting featured projects, client testimonials, and your creative process, this template ensures your work shines. Its stylish design and professional layout make it ideal for impressing potential clients and collaborators. Compatible with PowerPoint, Keynote, and Google Slides, it's versatile for any platform.


6 slides
Customer Feedback Smile Rating Scale
Visualize customer satisfaction with this editable Smile Rating Scale Presentation. Featuring five emotive icons, it’s perfect for showcasing feedback, survey results, or performance reviews. Fully customizable in PowerPoint, Keynote, and Google Slides, it simplifies data presentation while adding a friendly, professional touch to your report or presentation.