


Features
- 5 Unique slides
- Fully editable and easy to edit in Microsoft Powerpoint, Keynote and Google Slides
- 16:9 widescreen layout
- Clean and professional designs
- Export to JPG, PDF or send by email


Do you have any questions?
Recommend


7 slides
Decision Process Infographic Presentation
A Structured Decision Process is crucial for individuals and organizations to make informed and effective decisions. This is a flexible template that allows you to create your presentation using PowerPoint, Google Slides or Keynote. It includes decision illustrations so that you have everything you need to explain the decision and to present the pros and cons of each option. With a stylish design and eye-catching elements you can use this infographic for presentations of any kind. For promoting a new product or service, making recommendations or simply to explain your next steps and decisions.


6 slides
Business Task Checklist Presentation
Bring order and focus to your workflow with a clean, structured layout that tracks progress and priorities at a glance. Ideal for project updates, task planning, or performance reviews, this presentation makes organization effortless. Fully compatible with PowerPoint, Keynote, and Google Slides for easy customization and professional use.


5 slides
Employee Training Needs Skills Gap Presentation
Optimize Workforce Training with a Skills Gap Analysis! The Employee Training Needs Skills Gap template helps HR teams, trainers, and managers visualize skill gaps, assess employee competencies, and align training programs with business goals. Featuring an interactive dot matrix layout, this template enables clear comparisons across skill areas, ensuring targeted and efficient upskilling strategies. Fully customizable in PowerPoint, Keynote, and Google Slides, it streamlines workforce development planning for maximum impact and growth.


5 slides
Level-Based Authority Chart Presentation
Display organizational hierarchy with clarity using this level-based authority chart. The pyramid layout highlights reporting tiers, perfect for showcasing leadership roles, department levels, or team structures. Fully customizable in Canva, PowerPoint, or Google Slides—ideal for managers, HR professionals, and business consultants looking to present structured authority in a clean format.


10 slides
Financial Growth Planning
Visualize your path to financial success with this puzzle-themed Financial Growth Planning template. Each step connects seamlessly to outline investment goals, budgeting strategies, or revenue milestones. Designed for clarity and impact, it's fully editable in PowerPoint, Keynote, and Google Slides for effortless customization.


6 slides
Milestones Technologies Infographics
Highlight significant milestones in technology with our Milestones Technologies infographic template. This template is fully compatible with popular presentation software like PowerPoint, Keynote, and Google Slides, allowing you to easily customize it to showcase pivotal moments and achievements in the world of technology. The Milestones Technologies infographic template offers a visually engaging platform to chronicle and celebrate key technological advancements, innovations, and breakthroughs throughout history. Whether you're a tech enthusiast, educator, or simply interested in technological progress, this template provides a user-friendly canvas to create informative presentations and educational materials. Deepen your appreciation for the impact of technology with this SEO-optimized Milestones Technologies infographic template, thoughtfully designed for clarity and ease of use. Customize it to highlight milestones across various fields, from computing and telecommunications to space exploration and biotechnology, making it a valuable resource for sharing the history of technology with your audience. Start crafting your personalized infographic today to explore the remarkable journey of technological progress.


7 slides
Service Introduction Infographic
Introduce your services with precision and professionalism using our series of slide templates designed specifically for service introductions. These templates are perfect for presentations that aim to showcase new service offerings or explain existing services in a detailed and engaging manner. Each template is crafted with a clean, modern aesthetic that focuses on making your service offerings clear and appealing. The layouts are structured to guide the audience through each key feature of your service, including benefits, team roles, and operational processes. They also include space for visual elements such as images or icons that can help illustrate the unique aspects of your services.´ These slides are fully customizable, allowing you to adjust the color schemes, text, and graphics to align perfectly with your brand identity. Whether you're presenting to potential clients, stakeholders, or internal teams, these templates provide a solid foundation for a compelling narrative about your services.


6 slides
Core Mission Vision Goals Presentation
Spark clarity and momentum with a clean, modern slide designed to showcase your organization’s purpose and future direction. This presentation highlights your core mission and vision in a visually engaging layout that keeps teams aligned and focused. Fully compatible with PowerPoint, Keynote, and Google Slides.


20 slides
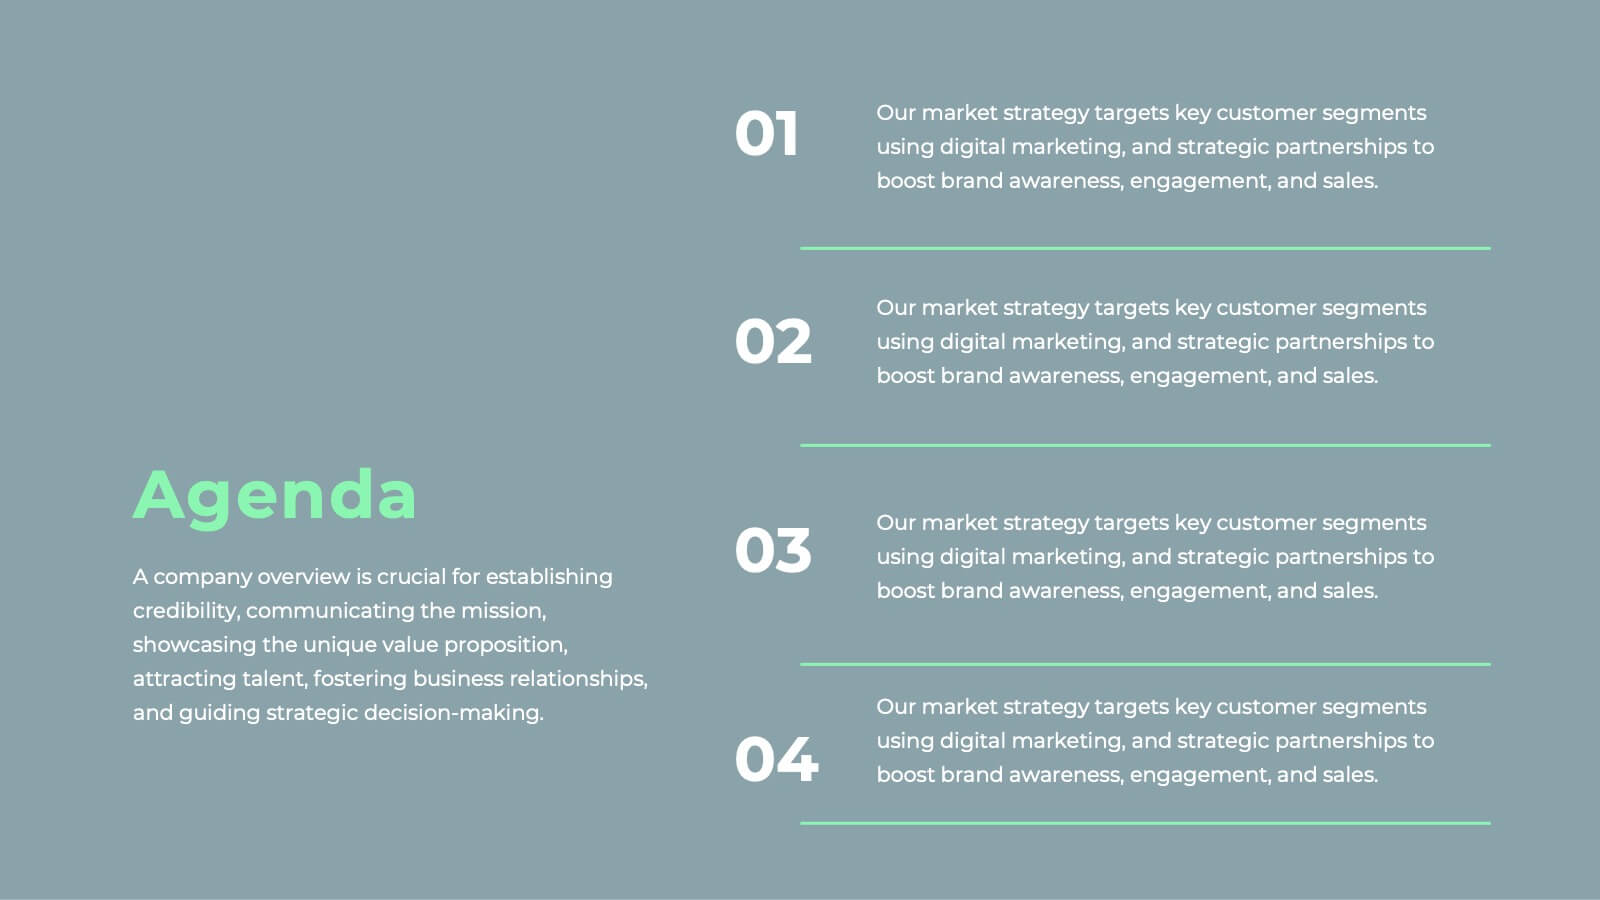
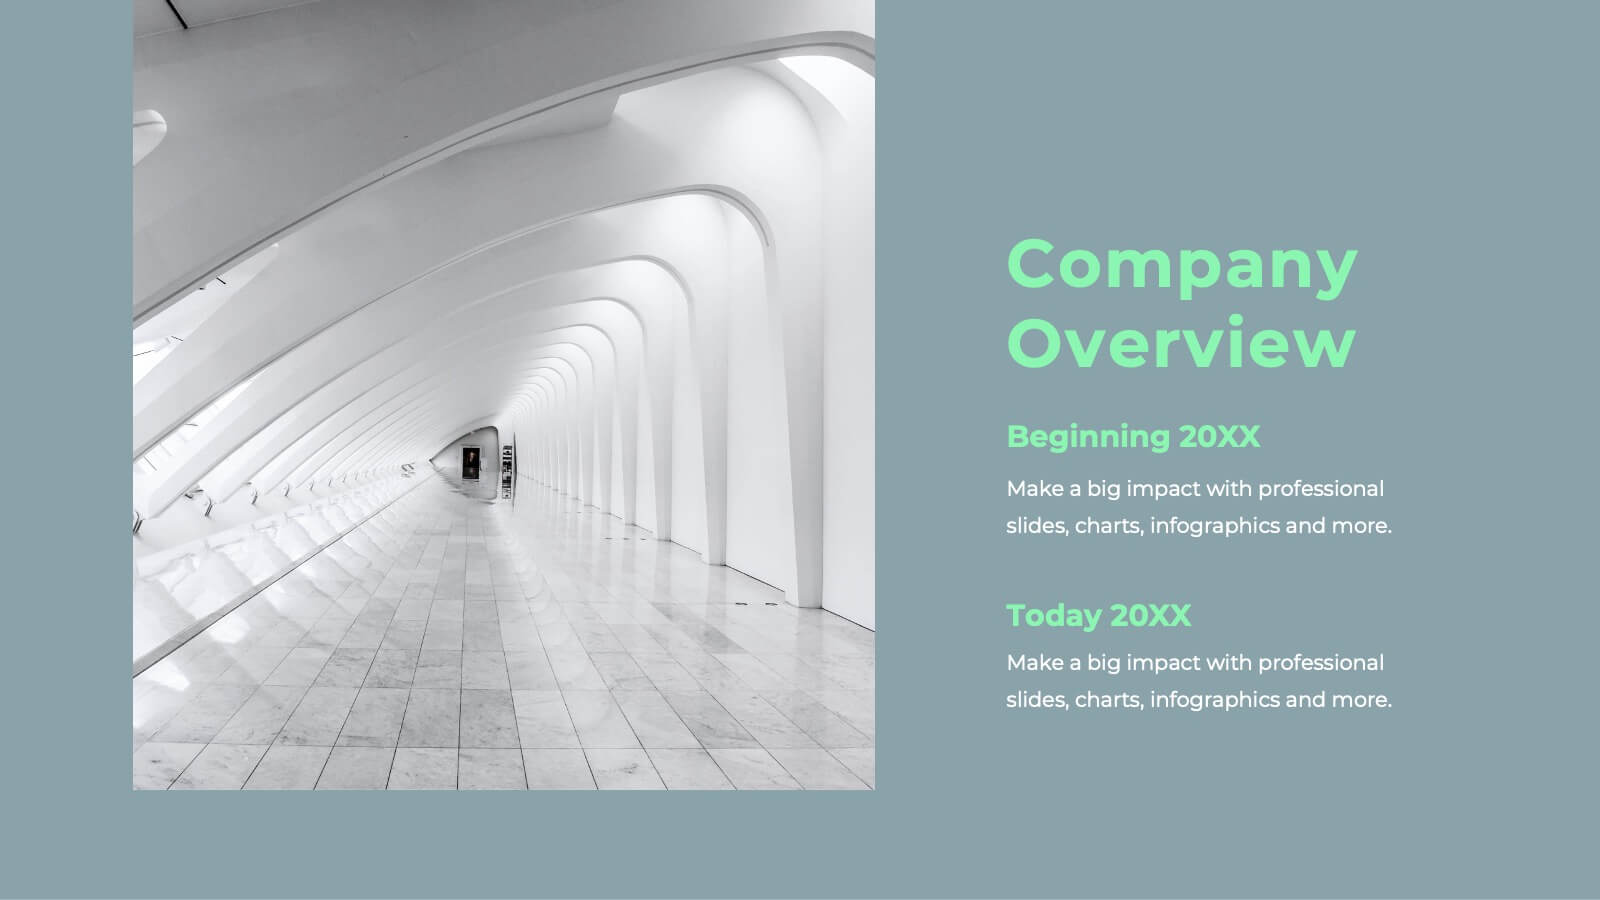
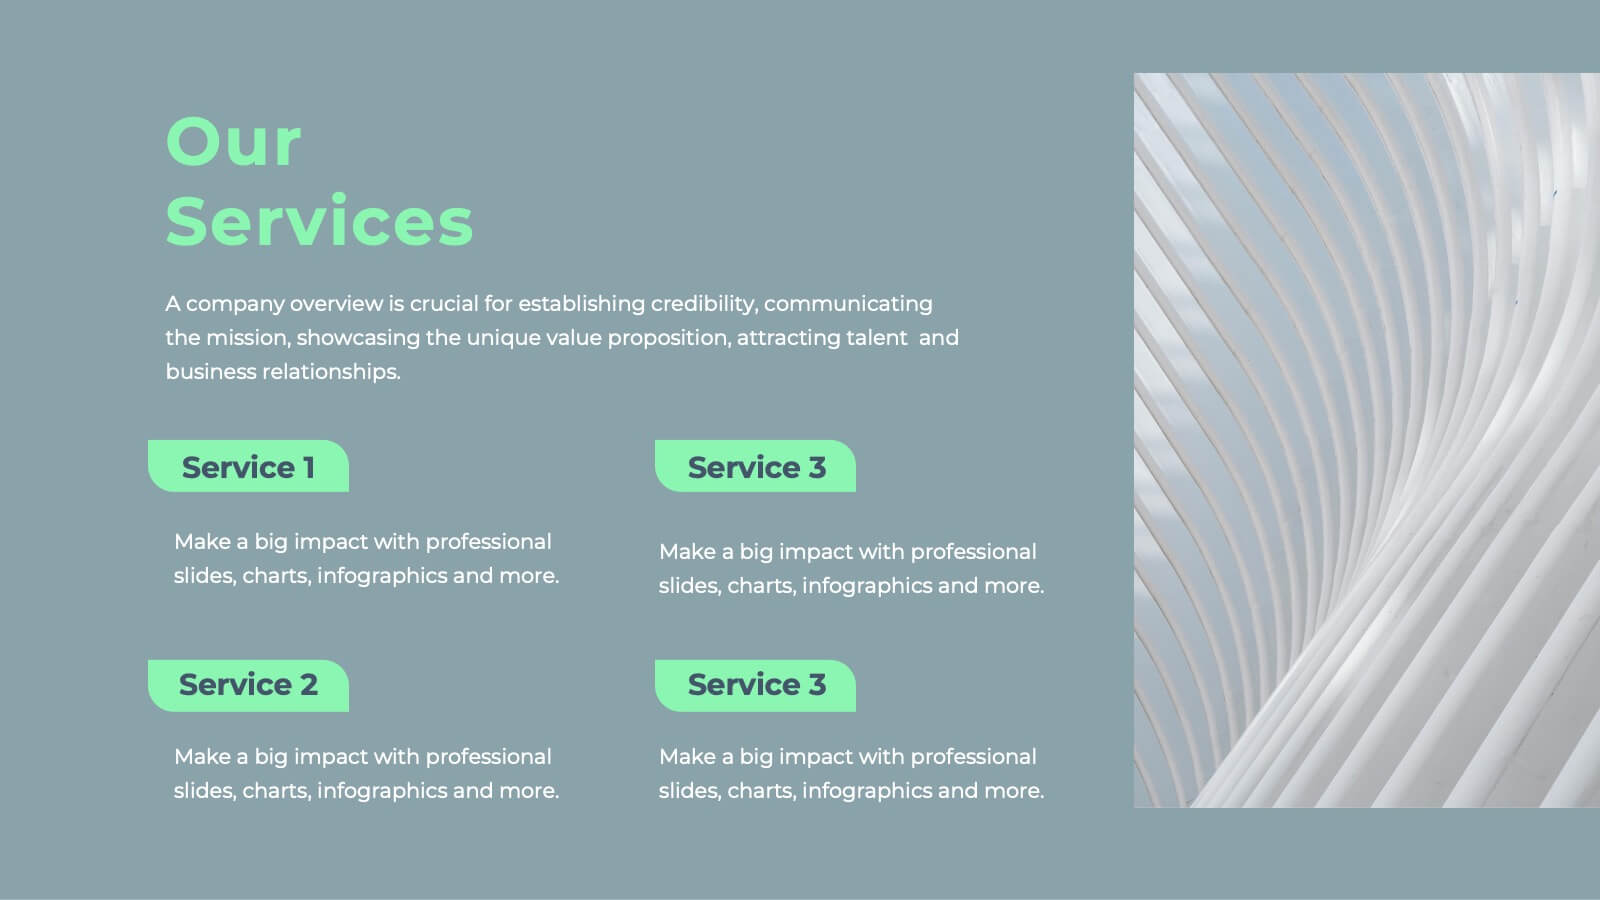
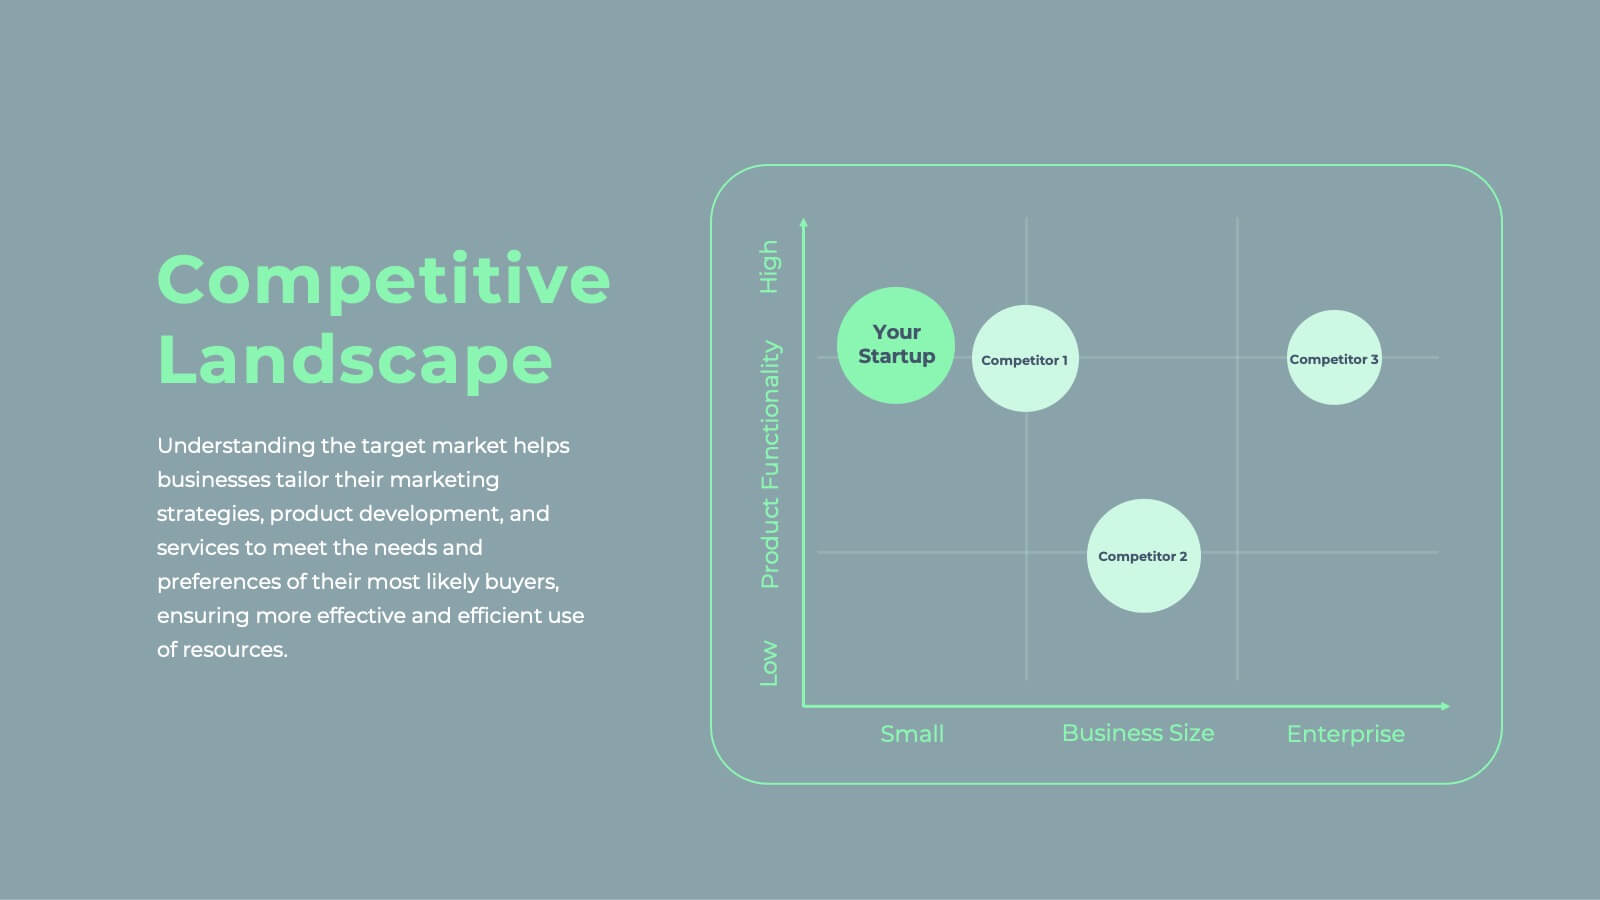
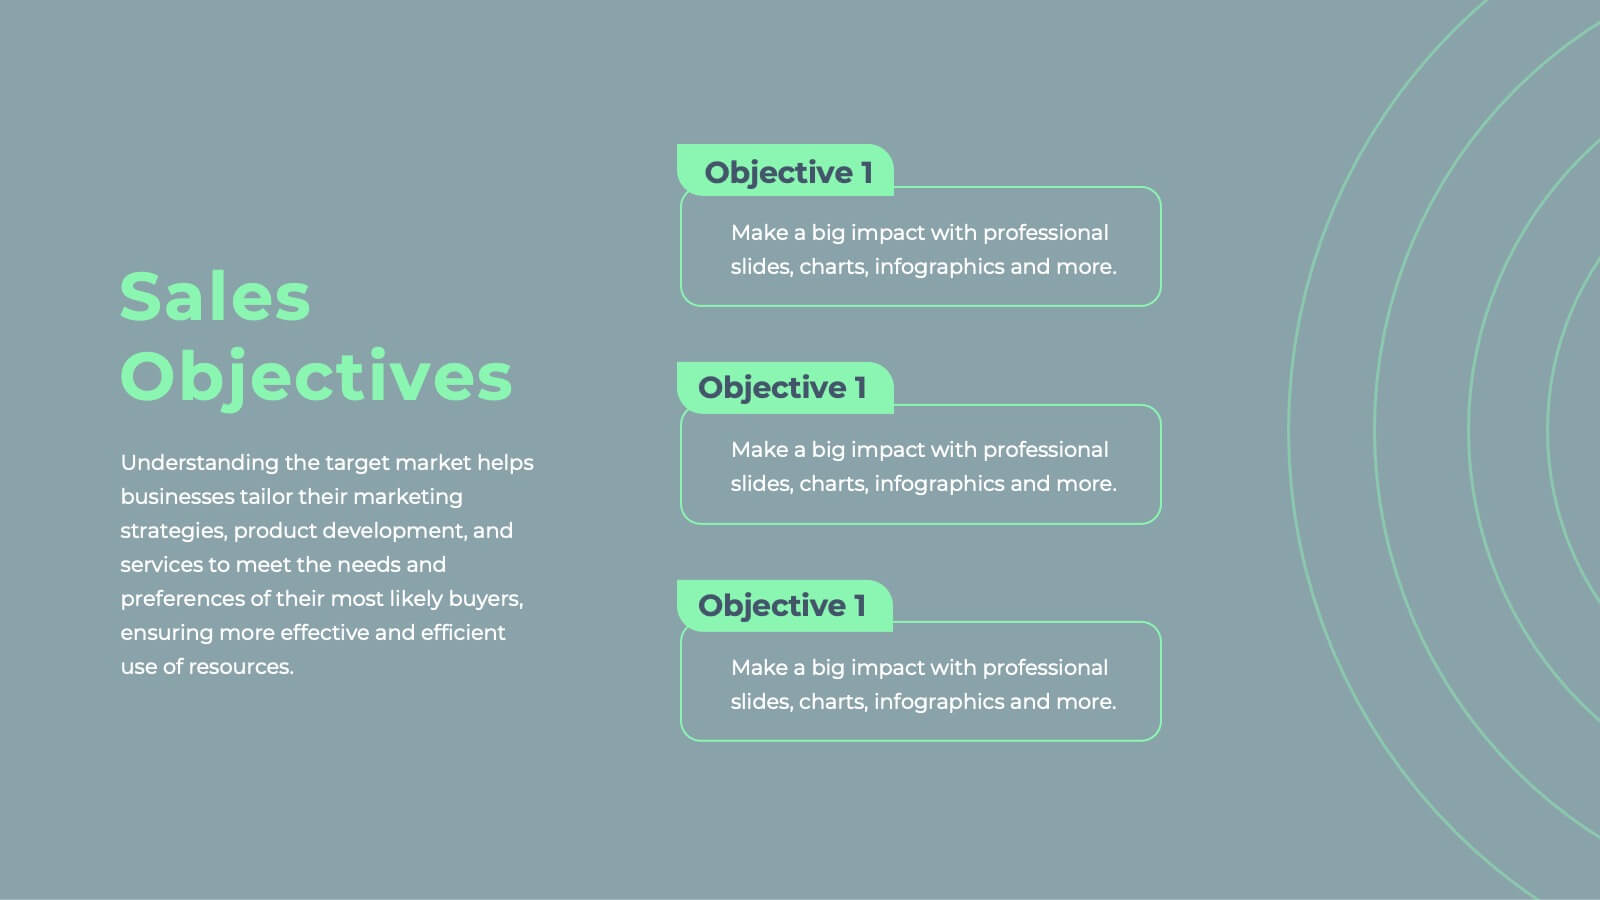
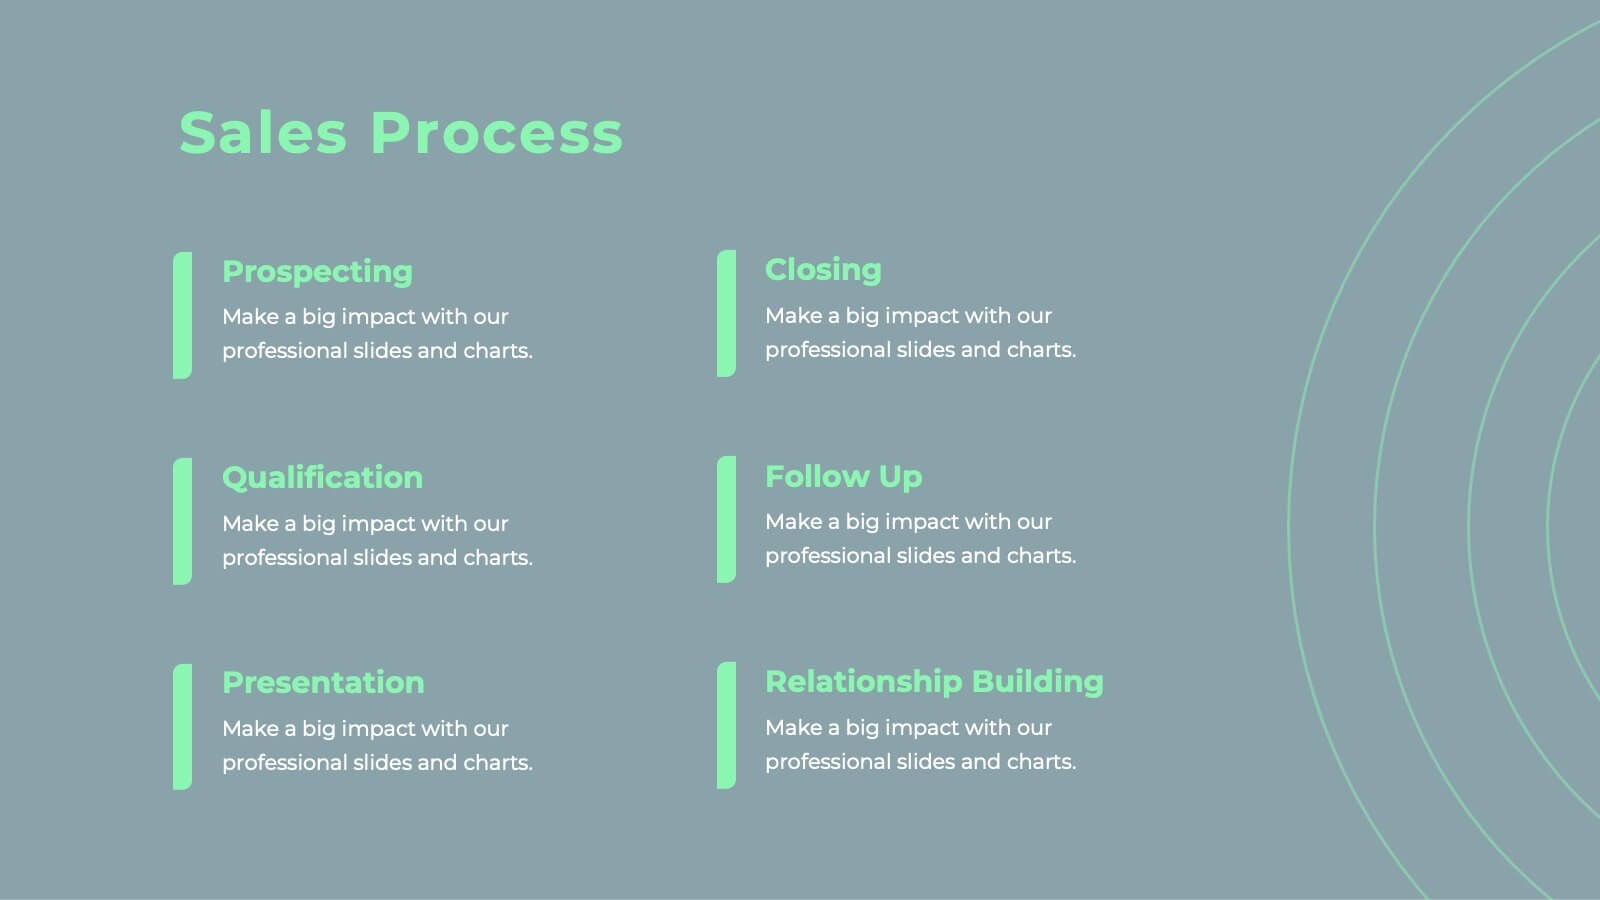
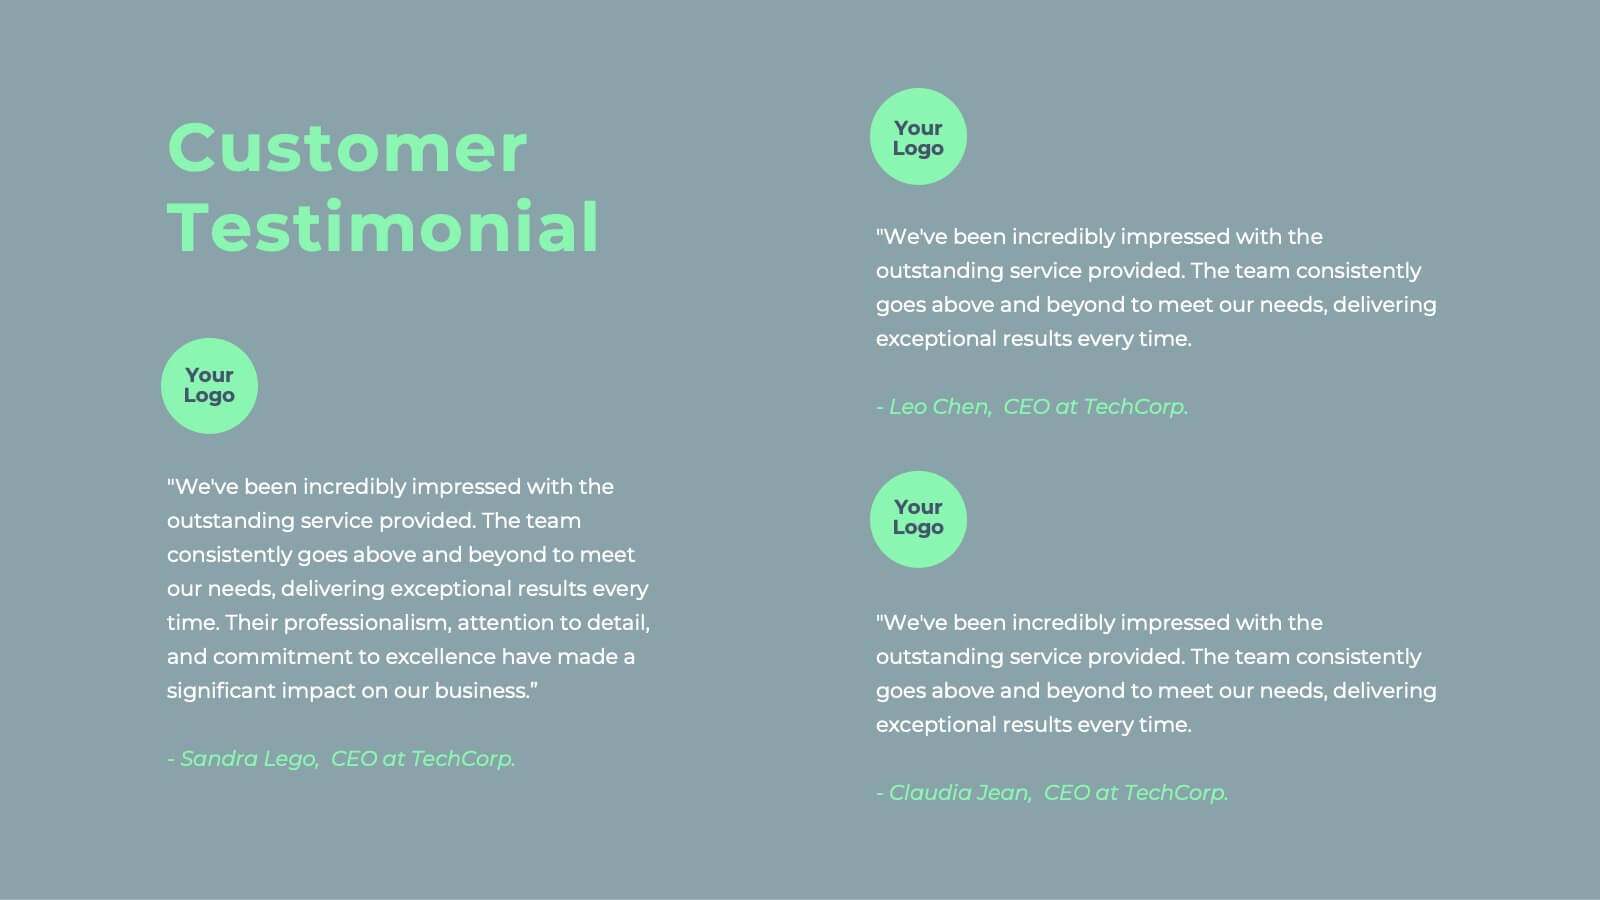
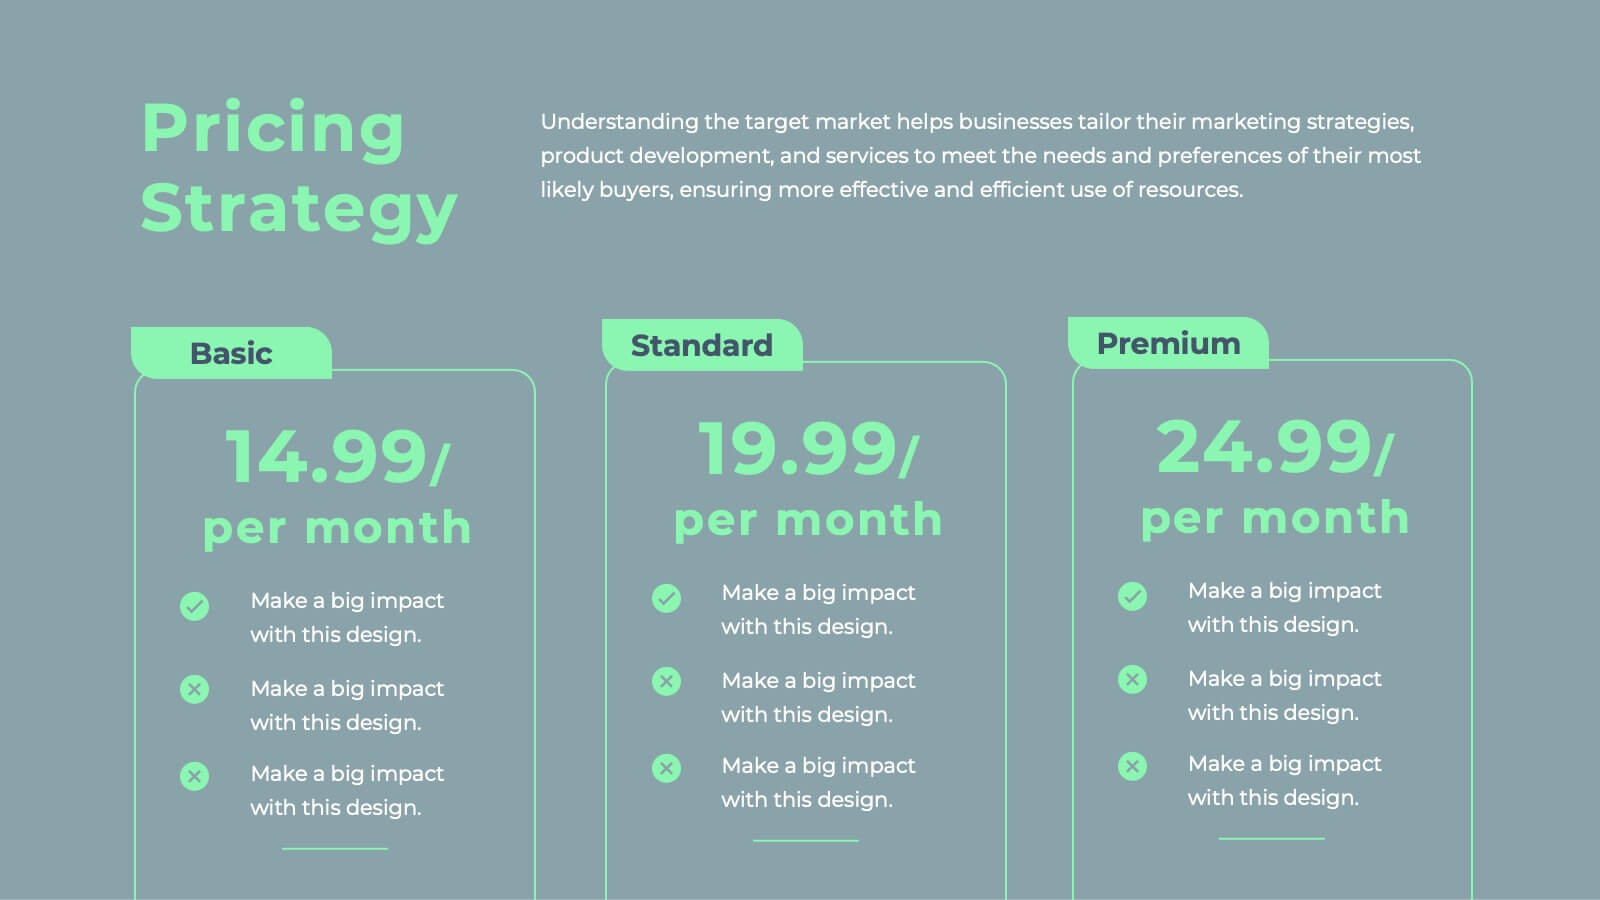
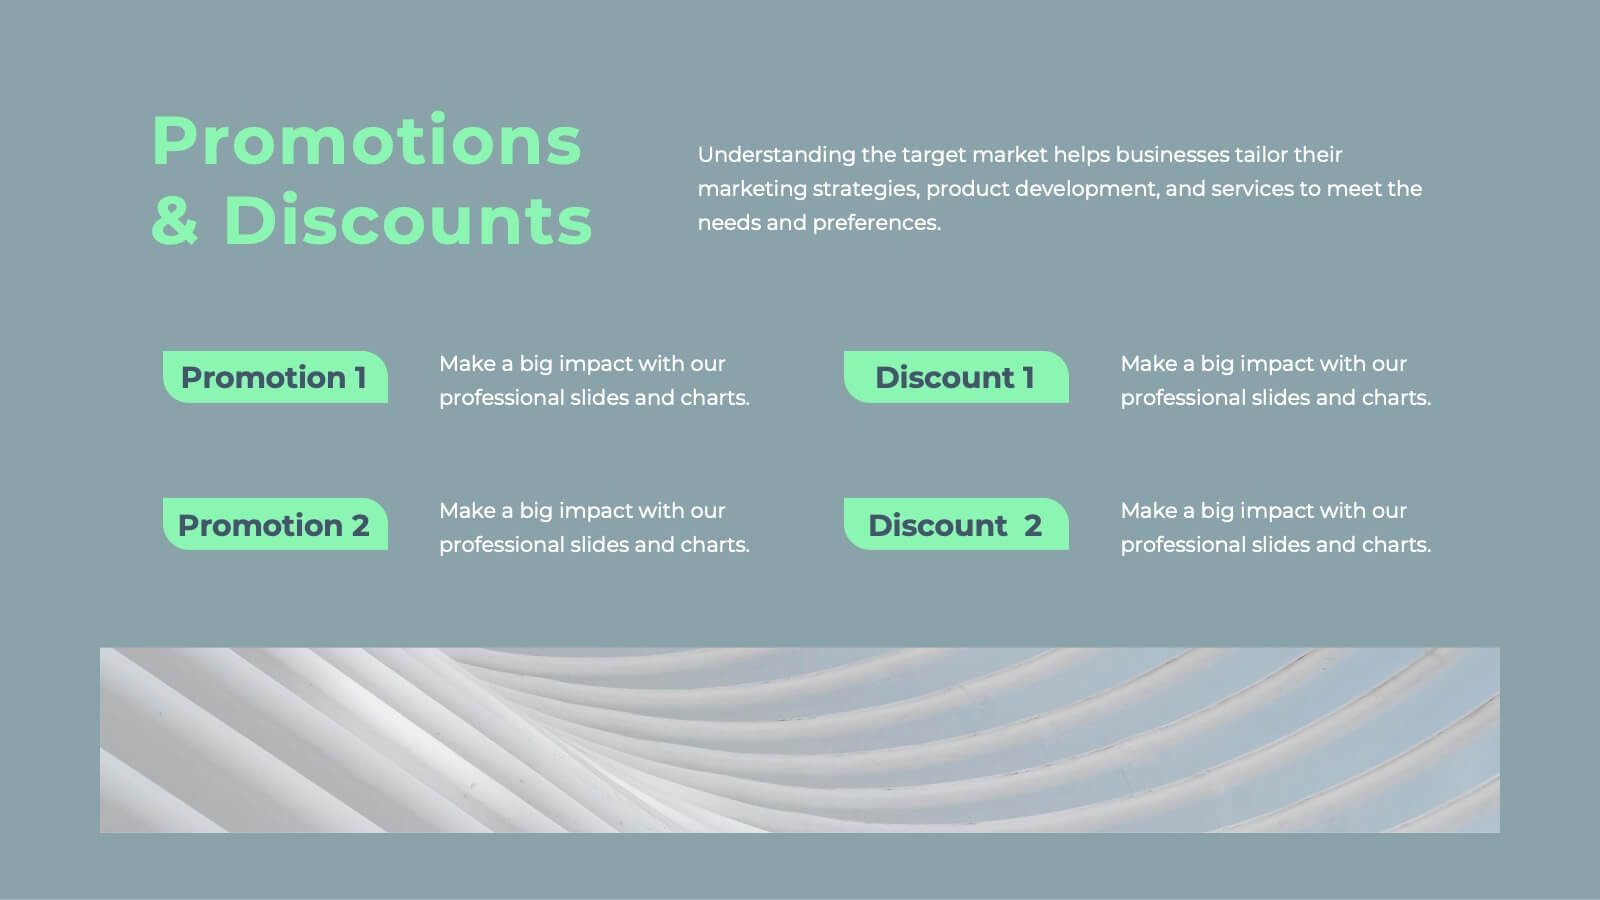
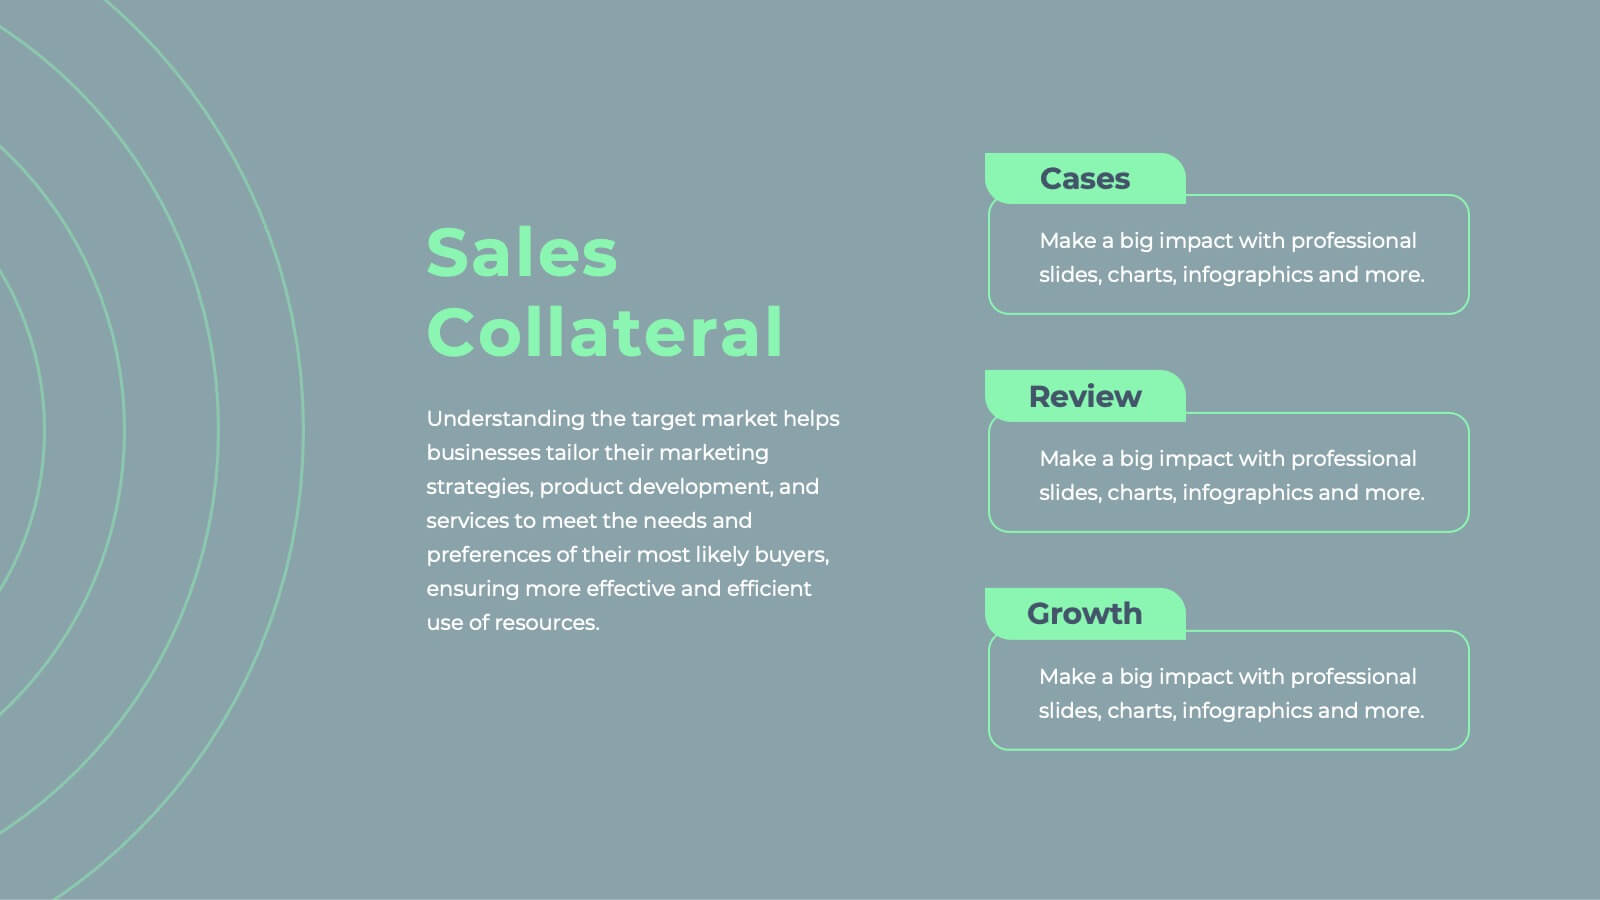
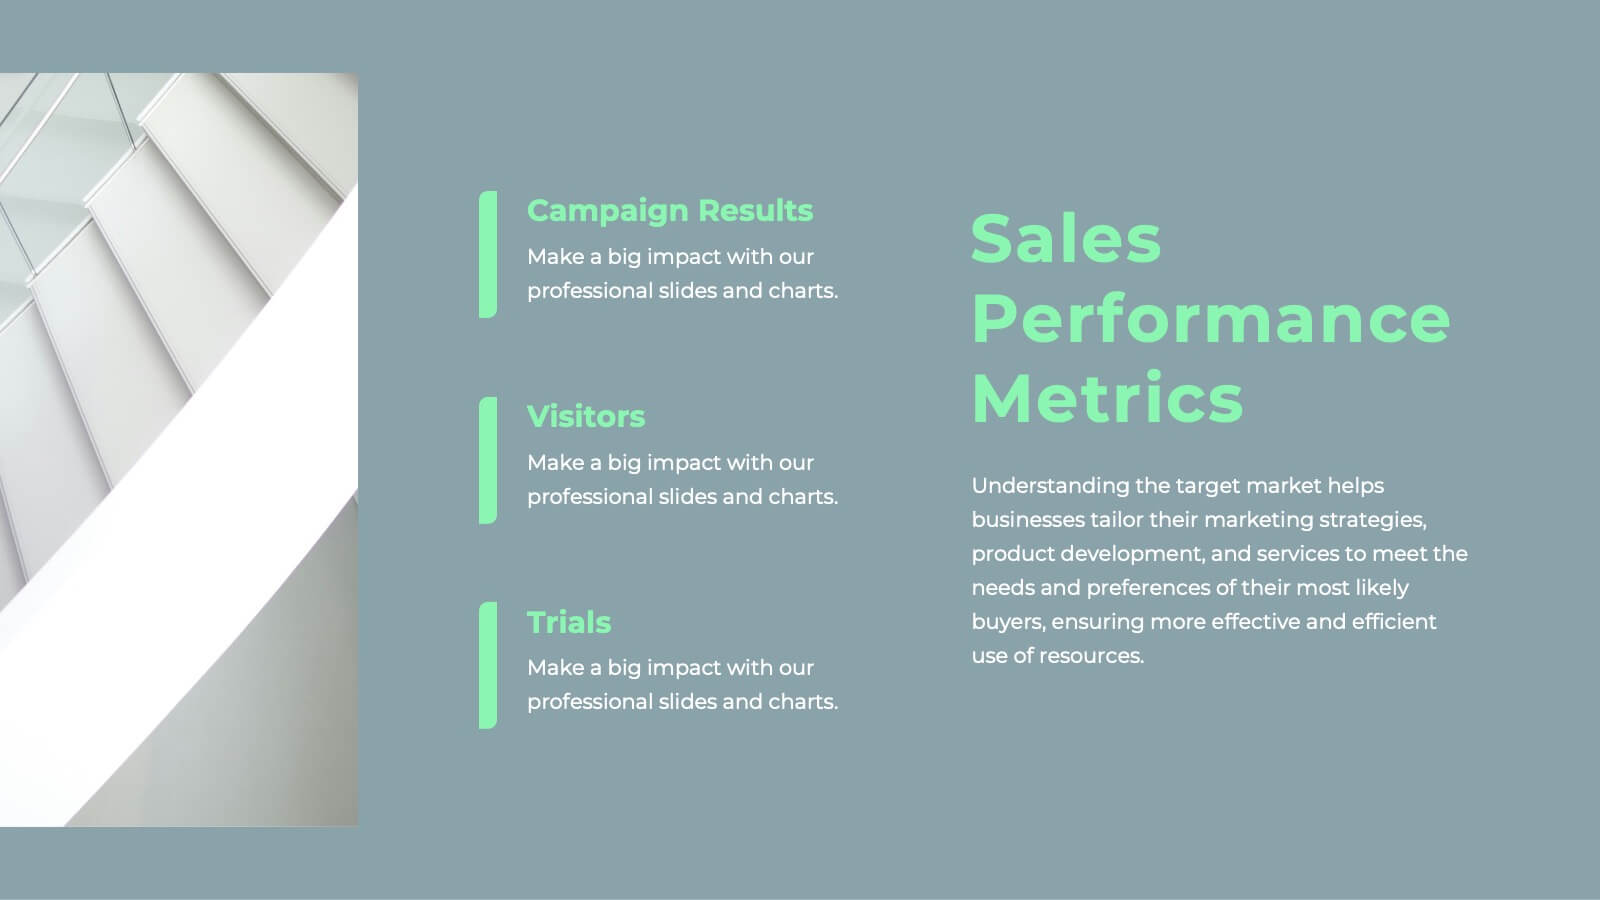
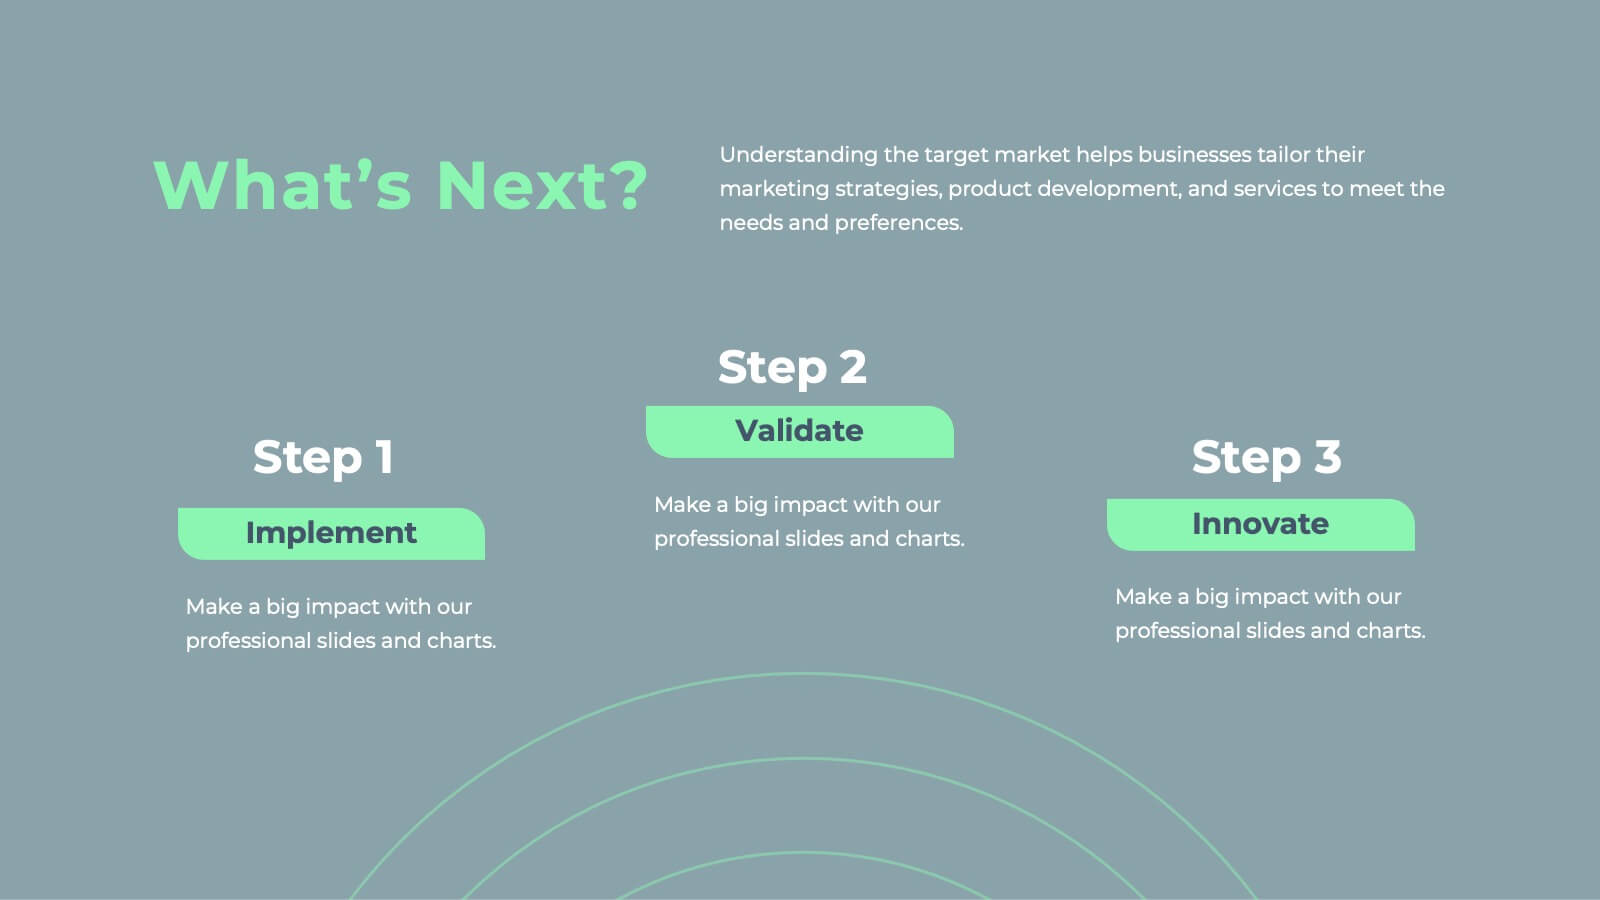
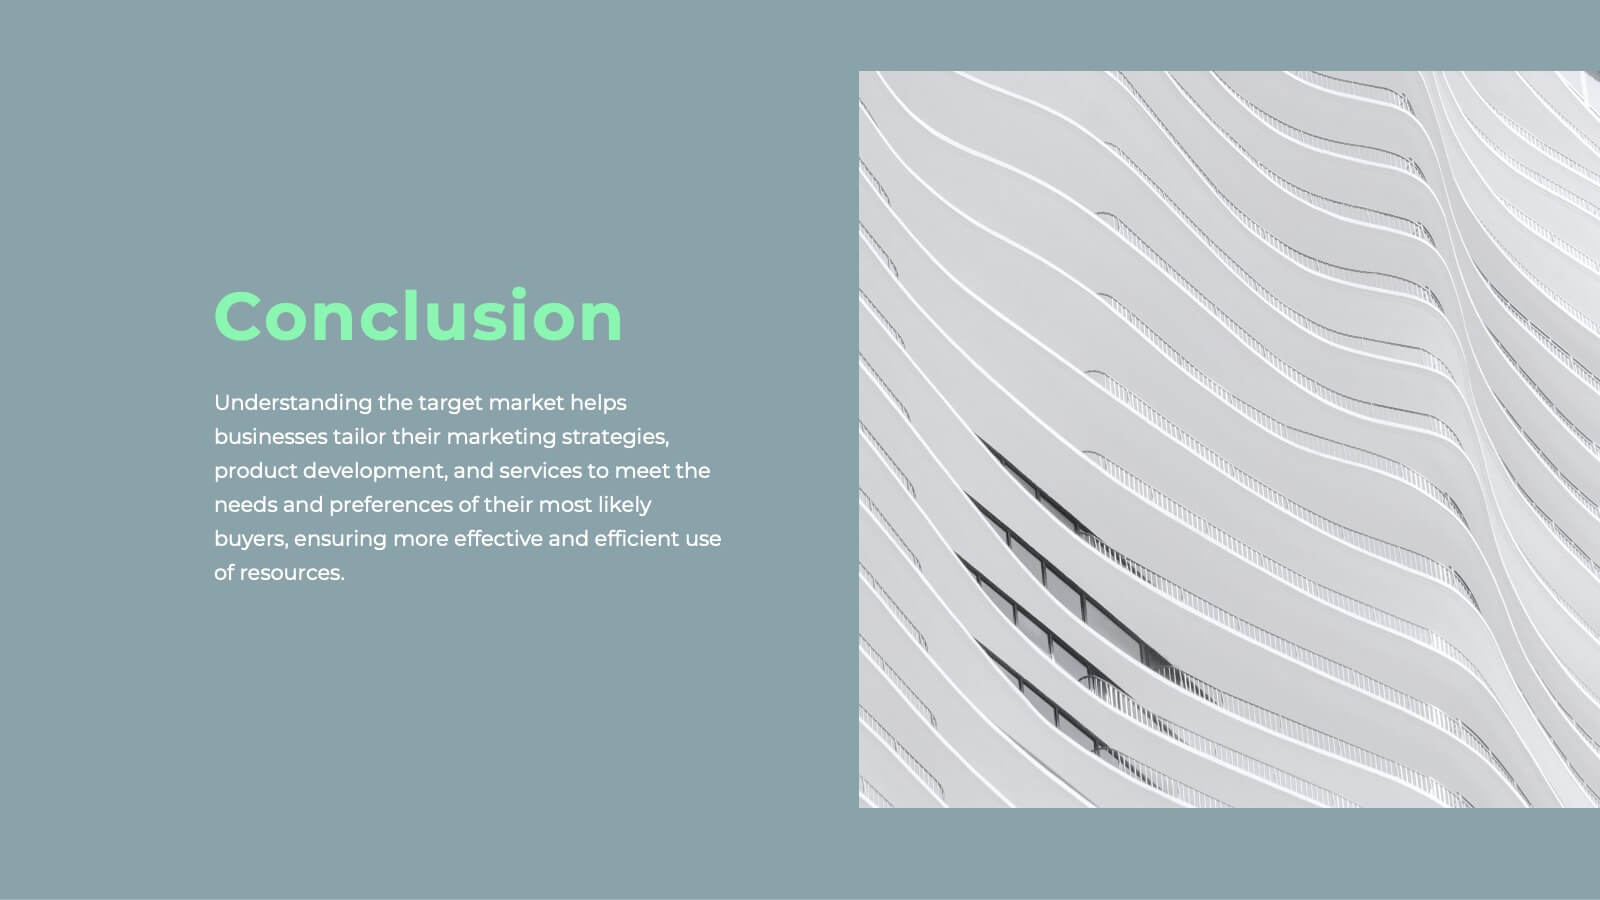
Javelin Sales Strategy Presentation
Boost your sales strategy with this sleek template! Perfect for outlining objectives, processes, performance metrics, and future opportunities. Tailored for impactful presentations to clients and teams. Fully customizable and compatible with PowerPoint, Keynote, and Google Slides.


6 slides
Human Resources Job Infographic
Human Resources (HR) refers to the department or function within an organization that is responsible for managing the human capital, workforce, and related processes. This infographic template serves as a helpful guide for individuals interested in pursuing a career in HR or for HR professionals looking to understand the different career paths and opportunities available in their field. This infographic uses visuals, icons, and graphics to make the content more engaging and easily understandable. The layout of the infographic is organized and easy to navigate, allowing viewers to quickly find information about different HR job roles.


8 slides
Puzzle Piece Strategy Connection Presentation
Align your ideas with clarity using the Puzzle Piece Strategy Connection Presentation. This vertical puzzle layout visually connects four key steps, making it perfect for illustrating strategy alignment, workflow processes, or integrated systems. Easily editable in PowerPoint, Canva, or Google Slides—ideal for team briefings or strategic roadmaps.


8 slides
Building Planning and Architecture Strategy Presentation
Bring structure and vision to your development plans with the Building Planning and Architecture Strategy Presentation. This visual template showcases an illustrated construction scene paired with four key planning pillars—ideal for presenting design phases, zoning steps, or project milestones. Fully customizable in PowerPoint, Keynote, and Google Slides.


6 slides
SCAR Process Model Presentation
The "SCAR Process Model" presentation template provides a clear visualization of the SCAR (Supplier, Corrective, Action, Request) model, designed to help professionals manage and enhance supplier relationships effectively. Each quadrant of the template is dedicated to one of the SCAR components, neatly arranged around a central hub, symbolizing the interconnected nature of these processes. The circular layout facilitates the understanding of how each component influences the others, leading to a more streamlined approach in handling supplier interactions and corrective actions. This template is perfect for presentations in supply chain management, operational reviews, and strategic planning meetings, offering a practical framework for discussing and planning effective supply chain strategies.


5 slides
Four-Step Marketing Funnel Plan Presentation
Streamline your messaging with the Four-Step Marketing Funnel Plan Presentation. This clean, vertical funnel layout highlights each stage of your strategy—ideal for visualizing lead nurturing, sales processes, or campaign progression. Each level is clearly marked and editable, helping you deliver focused insights with ease. Fully compatible with PowerPoint, Canva, Keynote, and Google Slides.


4 slides
Technology Device Mockup Presentation
Bring your ideas to life with a sleek, modern slide that showcases your digital product in a clean smartphone mockup. This presentation explains key features or app benefits with clear, structured text that keeps your message focused and professional. Fully compatible with PowerPoint, Keynote, and Google Slides for easy editing and use.


12 slides
Health and Safety Compliance Strategy Presentation
Ensure your organization meets regulatory standards with the Health and Safety Compliance Strategy presentation. This sleek, diamond-based layout breaks down key safety elements into five visually engaging segments, ideal for outlining compliance measures, emergency protocols, training requirements, risk assessments, and inspection plans. Each icon-based section includes editable titles and text boxes for quick customization. Designed to keep information clear and actionable, this template is perfect for corporate safety briefings, internal audits, or HR presentations. Fully compatible with PowerPoint, Keynote, and Google Slides.


5 slides
Strategic Framework Slide Presentation
Turn your strategy into a story that flows with clarity and precision using this clean, timeline-based presentation design. Ideal for illustrating project phases, corporate planning, or growth roadmaps, it keeps information structured and engaging. Fully editable and compatible with PowerPoint, Keynote, and Google Slides for seamless customization.