Engagement Survey Results Infographics
PowerPoint Template and Google Slides Theme


Features
- 6 Unique slides
- Fully editable and easy to edit in Microsoft Powerpoint, Keynote and Google Slides
- 16:9 widescreen layout
- Clean and professional designs
- Export to JPG, PDF or send by email
- Remove from favorites
Powerpoint Template
1 MB
Google Slides Template
External link
Keynote Template
1 MB
Recommend
- Remove from favorites
Powerpoint Template
1 MB
Google Slides Template
External link
Keynote Template
2 MB
8 slides
Tech Product Showcase Mockup Presentation
Highlight your mobile or app-based product with this sleek tech showcase slide. Featuring a realistic smartphone mockup alongside three content sections, it's perfect for presenting app features, service tiers, or UI comparisons. Fully customizable in PowerPoint, Keynote, or Google Slides to suit tech startups, product demos, or marketing presentations.
- Remove from favorites
Powerpoint Template
1 MB
Google Slides Template
External link
Keynote Template
1 MB
5 slides
Project Boundaries and Deliverables Presentation
Visualize key checkpoints with the Project Boundaries and Deliverables Presentation. This flag-style timeline infographic clearly marks each phase of your project journey—ideal for outlining scope, goals, and delivery milestones. Designed for clarity and progress tracking, this template works seamlessly in PowerPoint, Keynote, and Google Slides.
- Remove from favorites
Powerpoint Template
1 MB
Google Slides Template
External link
Keynote Template
1 MB
5 slides
Social Media Marketing Infographics
Social Media Marketing is an essential component of any modern marketing strategy. These vertical infographics can be used to provide valuable insights into the most effective social media platforms, the latest trends in social media marketing, and tips and strategies for optimizing social media campaigns. These are an excellent way to communicate complex information in an easy-to-digest format and can be used for marketing and educational purposes. Use these infographics to Include data on user demographics, engagement rates, platform-specific best practices, and industry benchmarks.
- Remove from favorites
Powerpoint Template
1 MB
Google Slides Template
External link
Keynote Template
1 MB
7 slides
Feedback Infographics Presentation Template
The goal of feedback is to recognize strengths and improve weaknesses. Feedback, both positive and negative, helps us see what we can improve on in order to better our results. This template is perfect for understanding how essential feedback is, and learning how to deliver feedback in a productive way. It provides positive criticism, showing what you can improve to achieve better results and success. Feedback provides the opportunity to learn, and is the most effective way to improve your skills. This template makes it simple to create an informed and well-rounded presentation to share.
- Remove from favorites
Powerpoint Template
1 MB
Google Slides Template
External link
Keynote Template
2 MB
7 slides
Side-by-Side Feature Comparison Presentation
Clearly showcase differences across multiple categories with this Side-by-Side Feature Comparison Presentation. Designed with a visual grid system and bold colors, it's perfect for highlighting product or service variations at a glance. Fully customizable in PowerPoint, Keynote, and Google Slides.
- Remove from favorites
Powerpoint Template
1 MB
Google Slides Template
External link
Keynote Template
2 MB
6 slides
Sales Team Infographic
The series presented showcases various slide templates tailored for enhancing sales team strategies and communication. Each slide is crafted to assist sales professionals in detailing team structures, sales goals, performance metrics, and strategic initiatives effectively. Utilizing vibrant color blocks and streamlined design elements, these templates make complex sales data approachable and engaging, facilitating clear and impactful presentations. The collection is designed with adaptability in mind, incorporating elements that can be easily customized to fit different team needs and company branding. These include comparative layouts for benchmarking, timeline formats for showcasing sales cycles, and diagrammatic representations for visualizing sales processes and results. Perfect for internal meetings, sales training sessions, and stakeholder presentations, these templates serve as essential tools for sales leaders to convey their team’s progress, celebrate wins, and strategize for future sales endeavors.
- Remove from favorites
Powerpoint Template
1 MB
Google Slides Template
External link
Keynote Template
External link
5 slides
Online Digital Marketing Infographics
Online Digital Marketing refers to the promotion of products, services, or brands using digital channels and technologies. These infographic templates aims to educate and inspire the audience about the world of digital marketing and equip them with valuable insights and strategies to enhance their online presence. This is a valuable tool for presenting the intricacies of digital marketing in a clear and engaging manner. The templates provide slides that focus on analytics and measurement, emphasizing the importance of tracking and evaluating digital marketing efforts. You can customize the templates with your own branding to create a professional look.
- Remove from favorites
Powerpoint Template
1 MB
Google Slides Template
External link
Keynote Template
2 MB
6 slides
IT Security and Data Protection
Safeguard your digital infrastructure with this sleek 6-step IT security infographic. Centered around a shield icon, this layout is ideal for cybersecurity briefings, data compliance protocols, and risk assessments. Fully customizable in PowerPoint, Keynote, and Google Slides—perfect for IT professionals and corporate tech teams.
- Remove from favorites
Powerpoint Template
1 MB
Google Slides Template
External link
Keynote Template
1 MB
4 slides
Roadmap to Personal and Business Success Presentation
Guide your audience through a strategic journey with this roadmap-themed presentation. Featuring traffic cones on a winding path, it’s ideal for illustrating goals, milestones, or stages of development. Fully editable in PowerPoint, Keynote, and Google Slides—perfect for growth plans, personal development, project timelines, or business success strategies.
- Remove from favorites
Powerpoint Template
1 MB
Google Slides Template
External link
Keynote Template
1 MB
5 slides
Impacts of Fake News Infographics
Fake News refers to deliberately false or misleading information presented as factual news. The spread of fake news can have significant impacts on individuals, society, and even the democratic process. With this infographic template, you can effectively communicate the far-reaching consequences of fake news and encourage critical thinking and media literacy. Whether you're presenting to a classroom, sharing on social media, or creating educational materials, this template serves as a powerful tool to raise awareness and promote responsible consumption of information in the digital era. Compatible with Powerpoint, Keynote, and Google Slides.
- Remove from favorites
Powerpoint Template
1 MB
Google Slides Template
External link
Keynote Template
1 MB
4 slides
Organizational Layered Structure Presentation
Visualize team dynamics and reporting lines with this clean and professional organizational layered structure template. Designed to help you present hierarchy, roles, and responsibilities across departments, this slide is perfect for HR, operations, or executive updates. Easily editable and fully compatible with PowerPoint, Keynote, and Google Slides.
- Remove from favorites
Powerpoint Template
1 MB
Google Slides Template
External link
Keynote Template
1 MB
6 slides
Business Growth and Progress Metrics Presentation
Showcase milestones, trends, and business wins with this sleek bar chart and line graph combo. Designed to illustrate upward momentum, each slide highlights progress using a trophy peak icon, 5 key steps, and editable labels. Ideal for quarterly reviews, growth tracking, and strategic updates. Fully compatible with PowerPoint, Keynote, and Google Slides.
- Remove from favorites
Powerpoint Template
1 MB
Google Slides Template
External link
Keynote Template
1 MB
6 slides
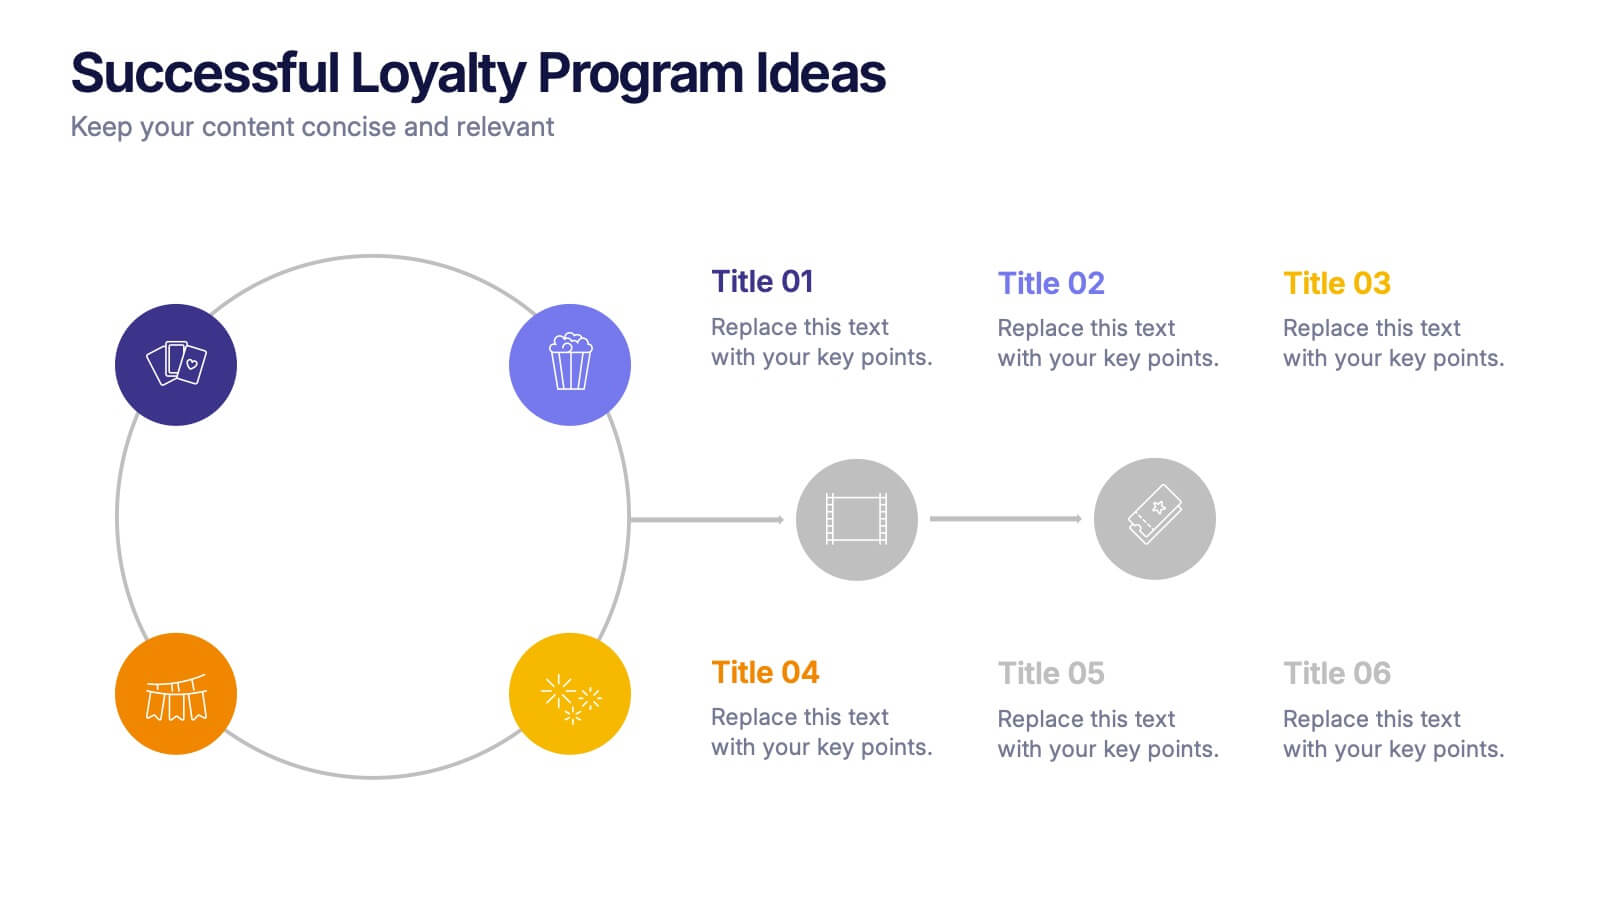
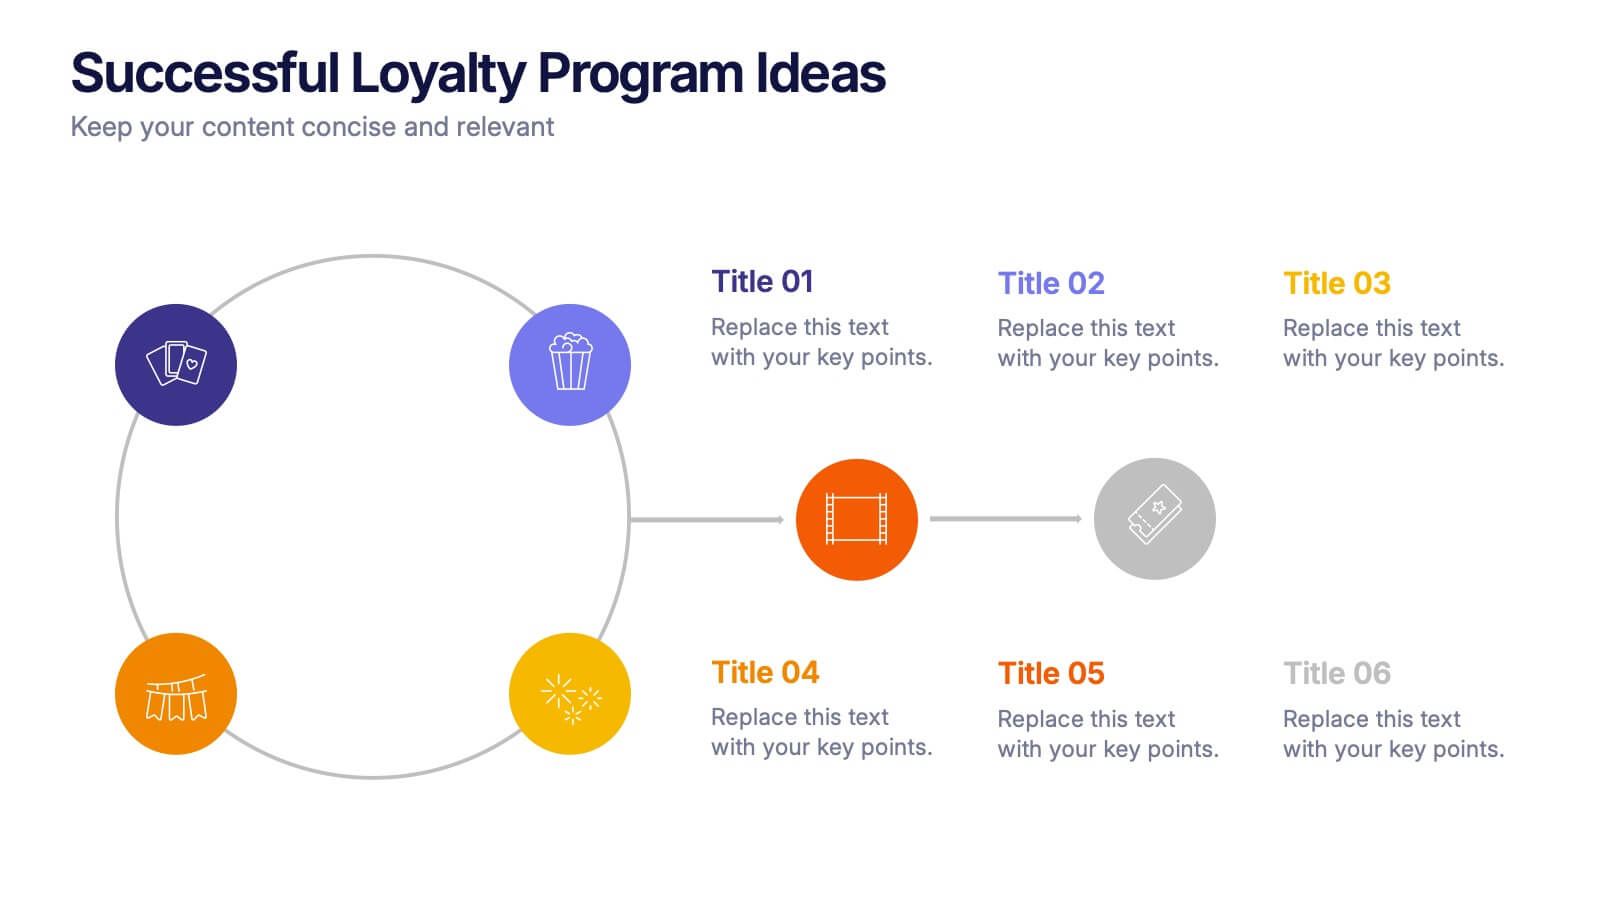
Successful Loyalty Program Ideas Presentation
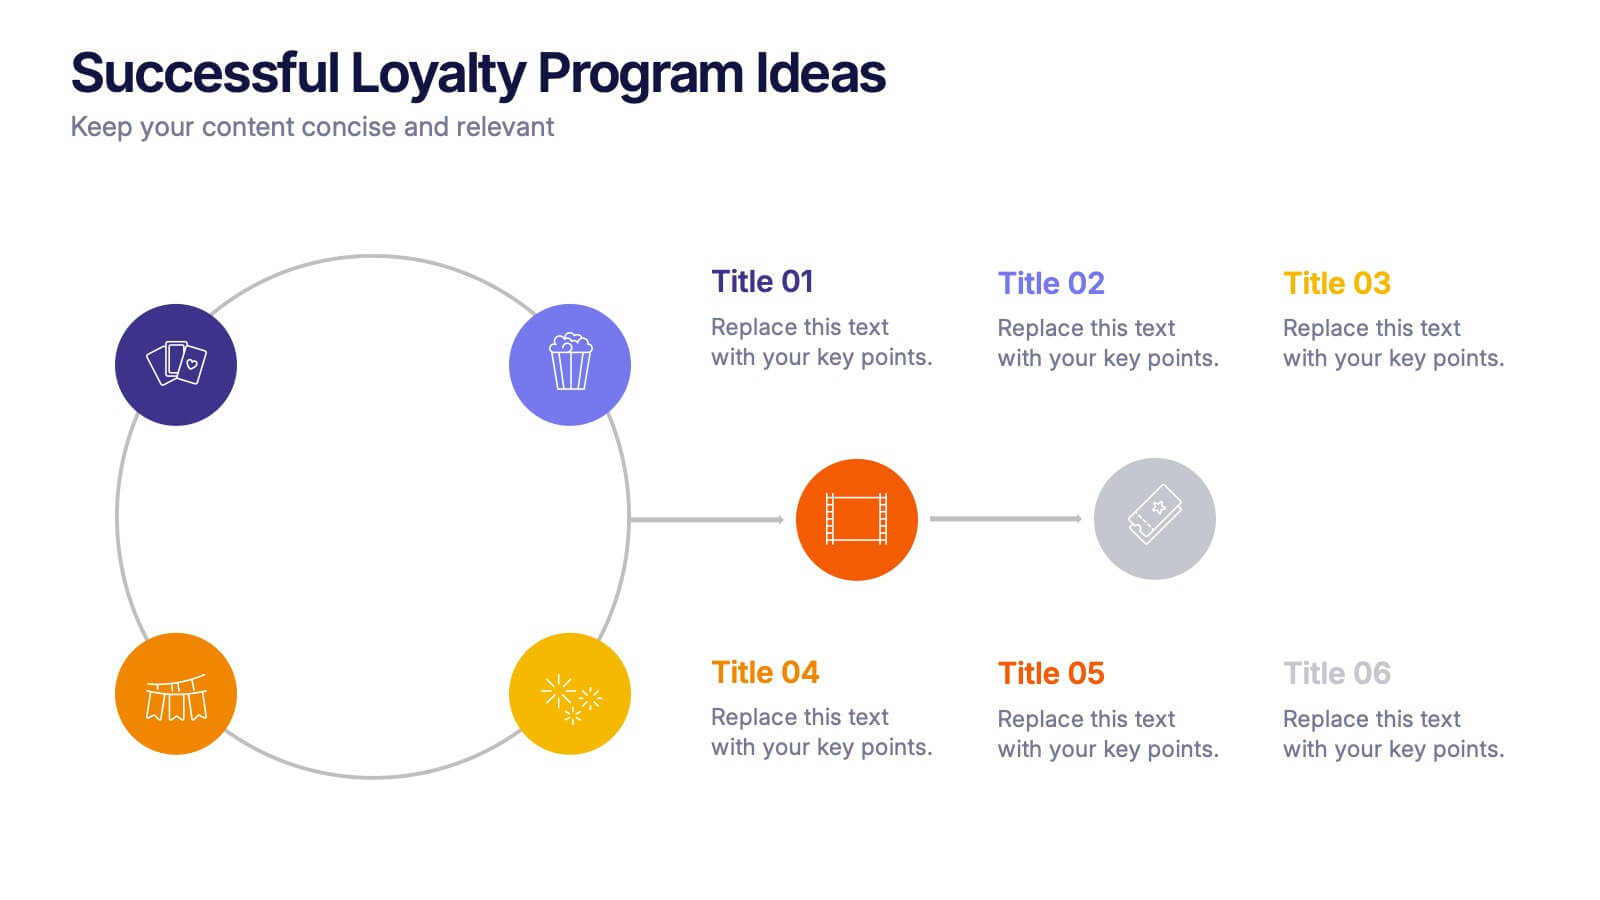
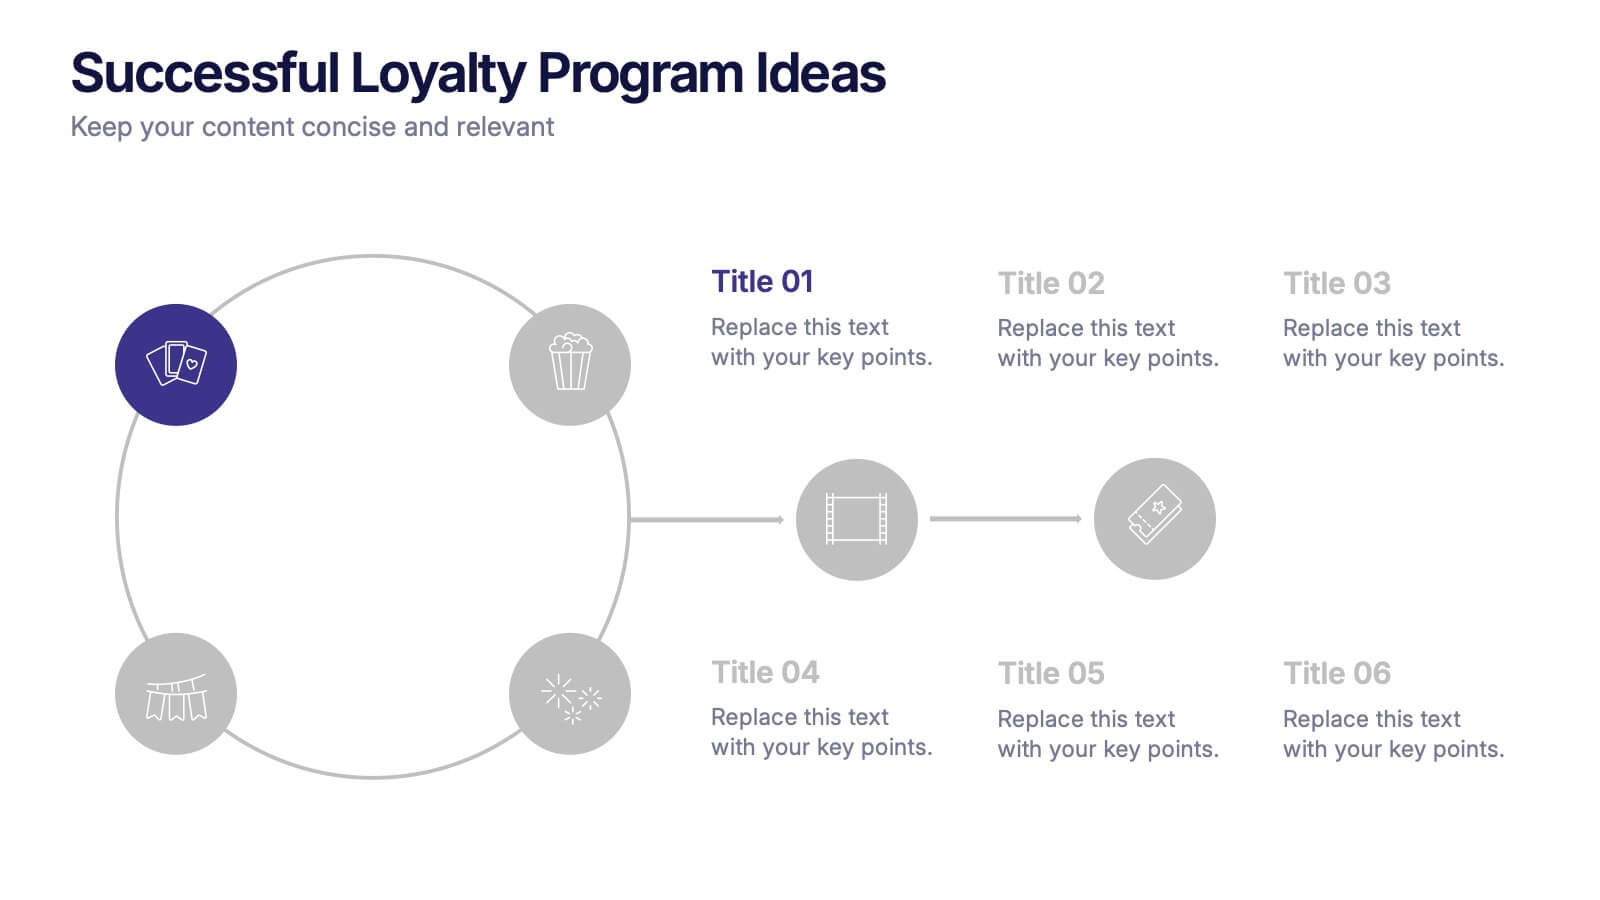
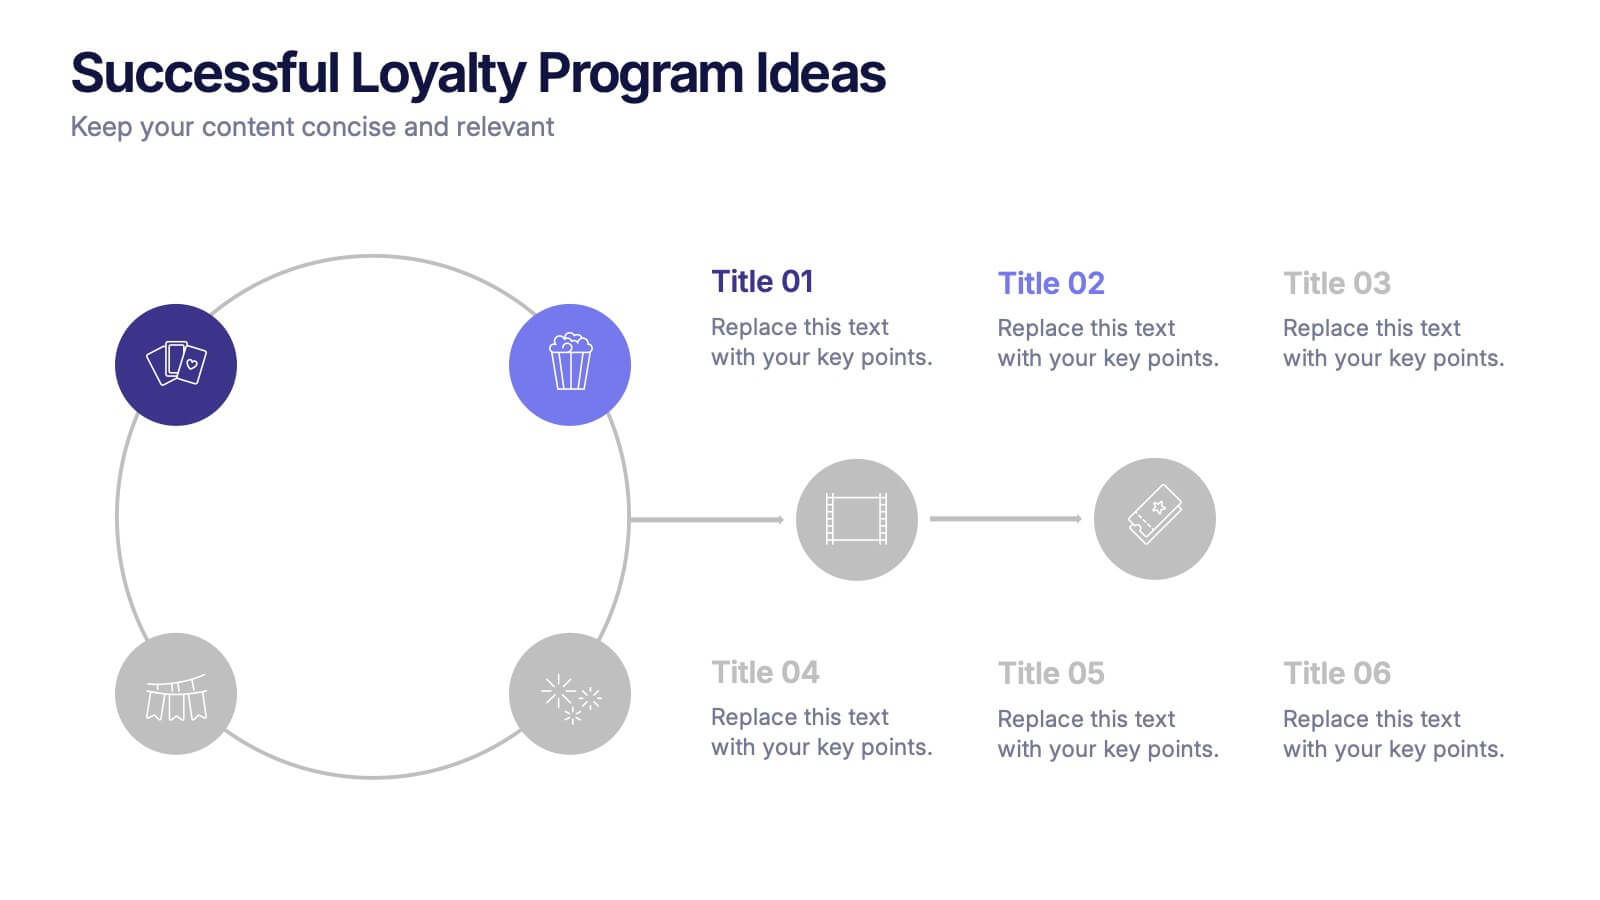
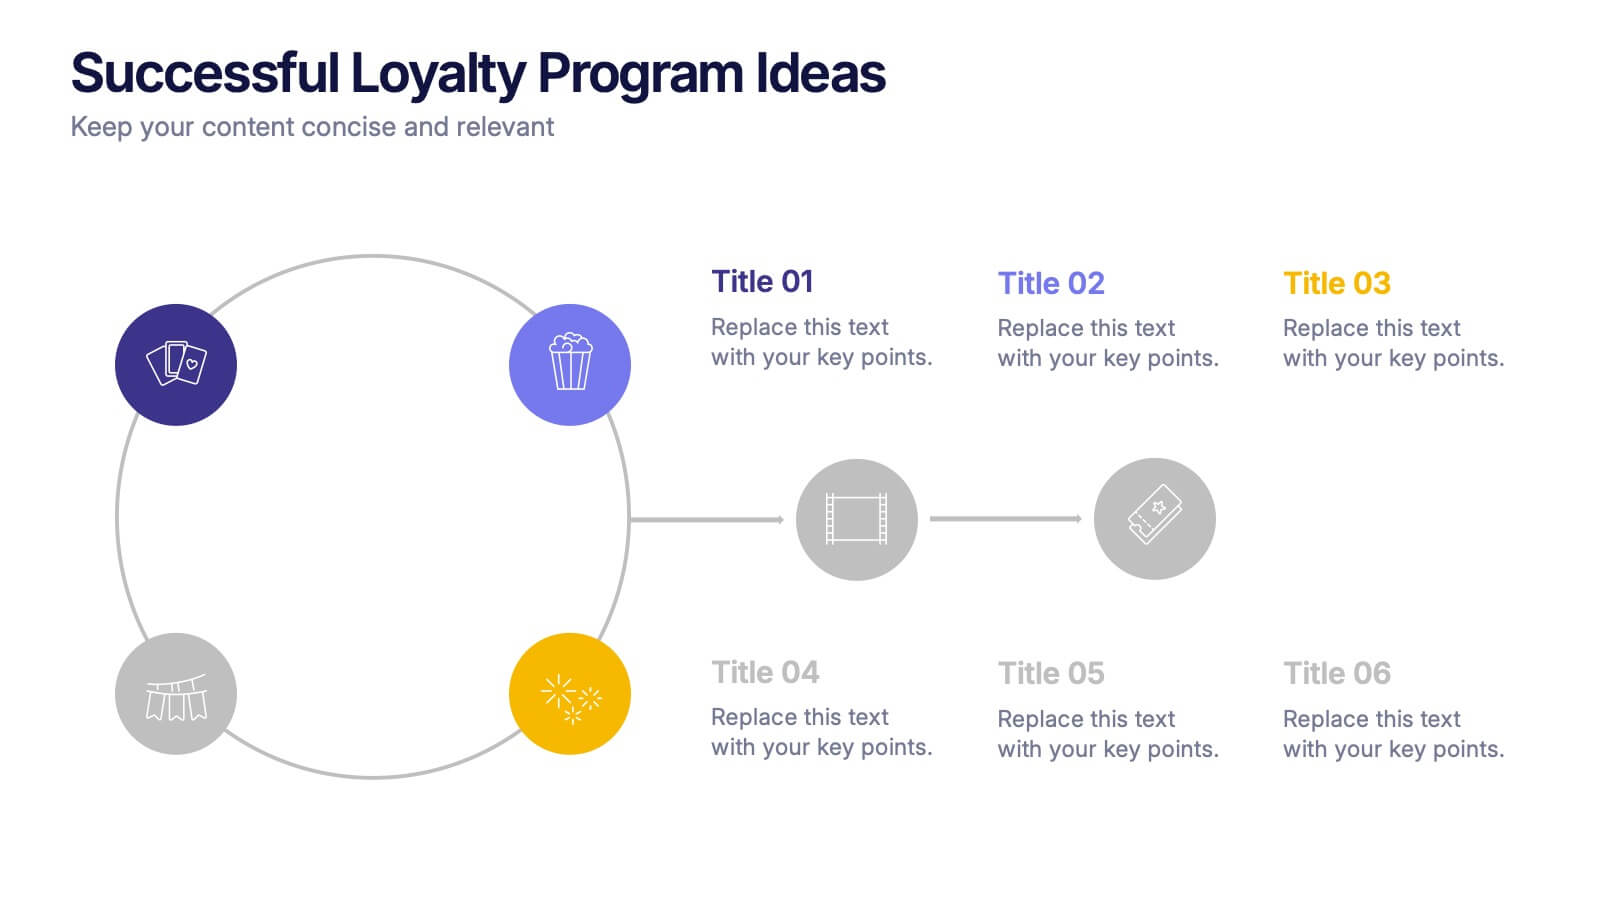
Turn creative reward concepts into visually engaging stories that inspire customer retention and brand loyalty. This modern layout is ideal for presenting program ideas, reward systems, and engagement strategies with clarity and style. Fully customizable and compatible with PowerPoint, Keynote, and Google Slides for seamless presentation design.
- Remove from favorites
Powerpoint Template
1 MB
Google Slides Template
External link
Keynote Template
1 MB
4 slides
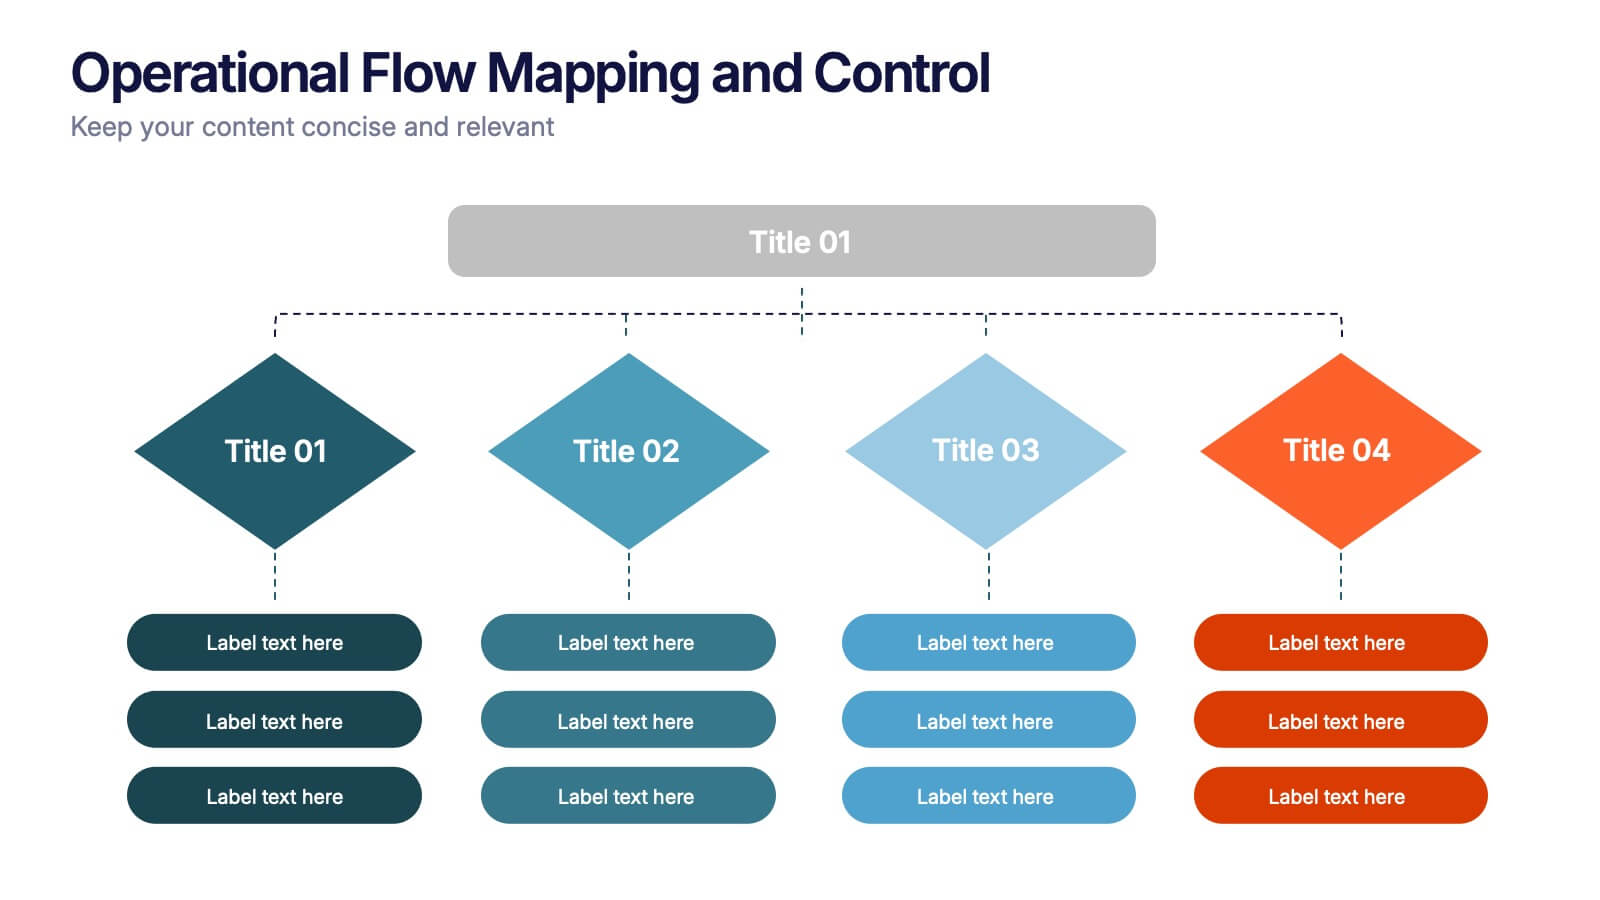
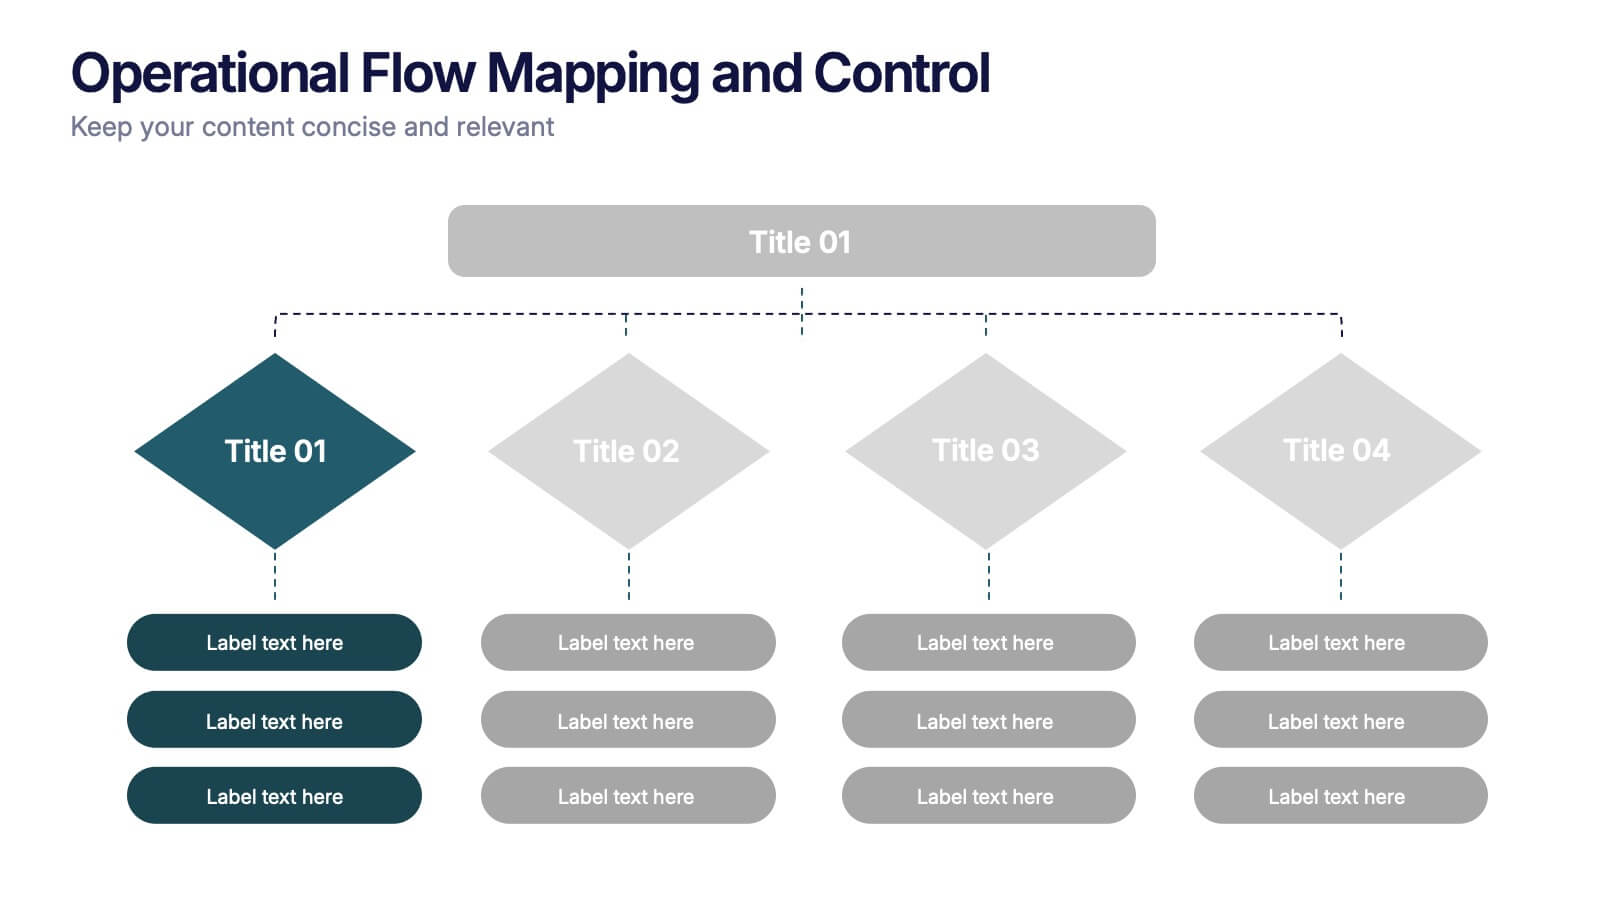
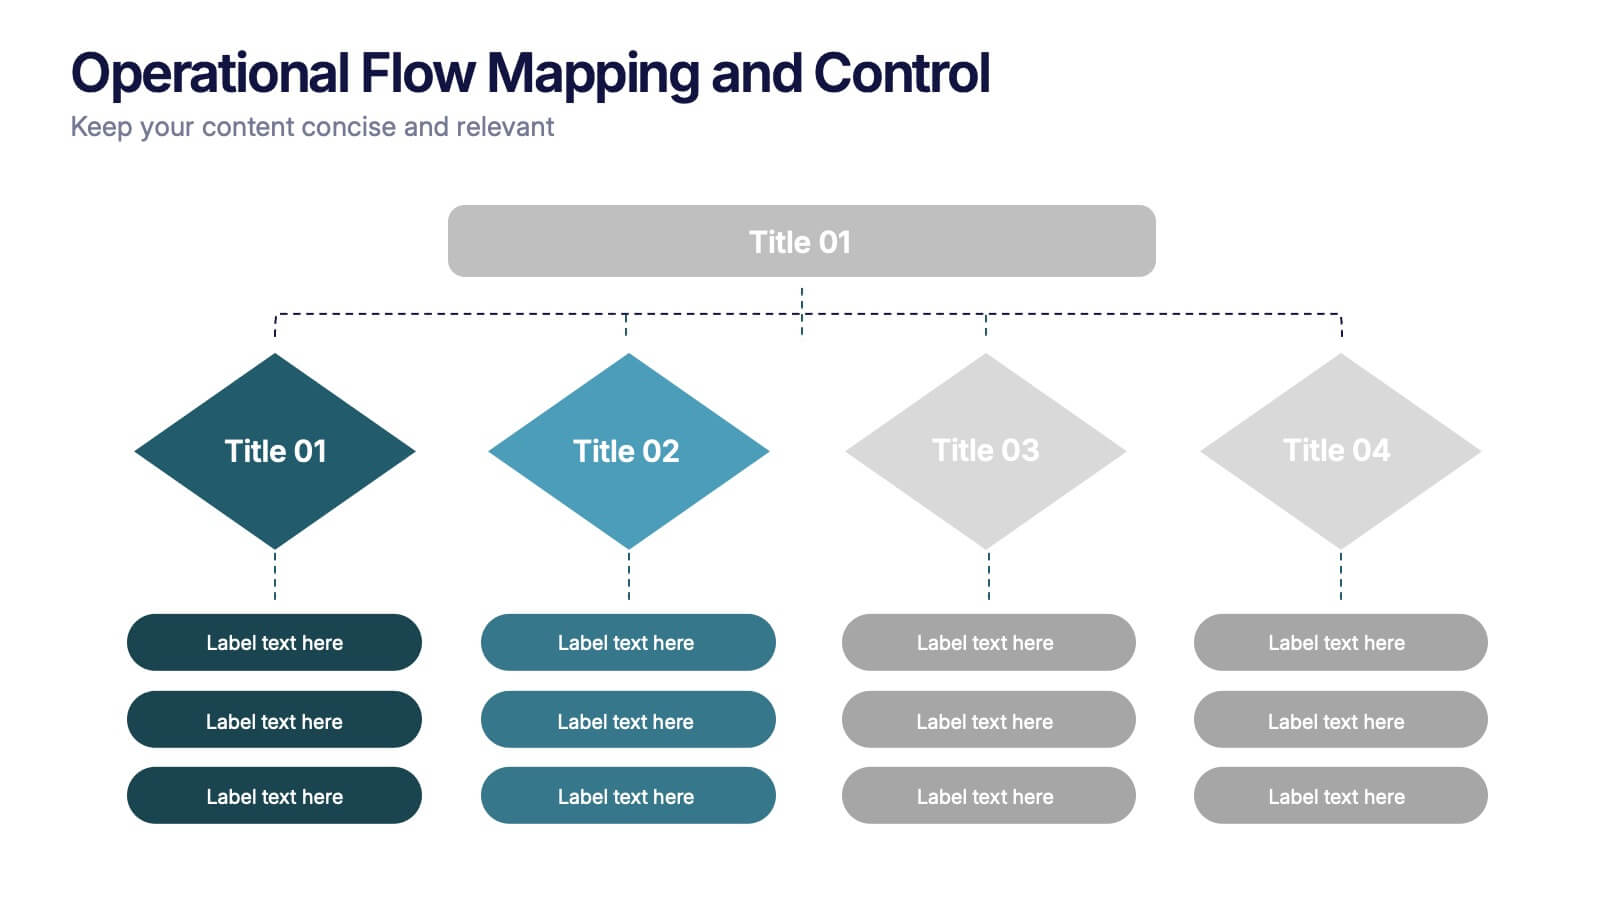
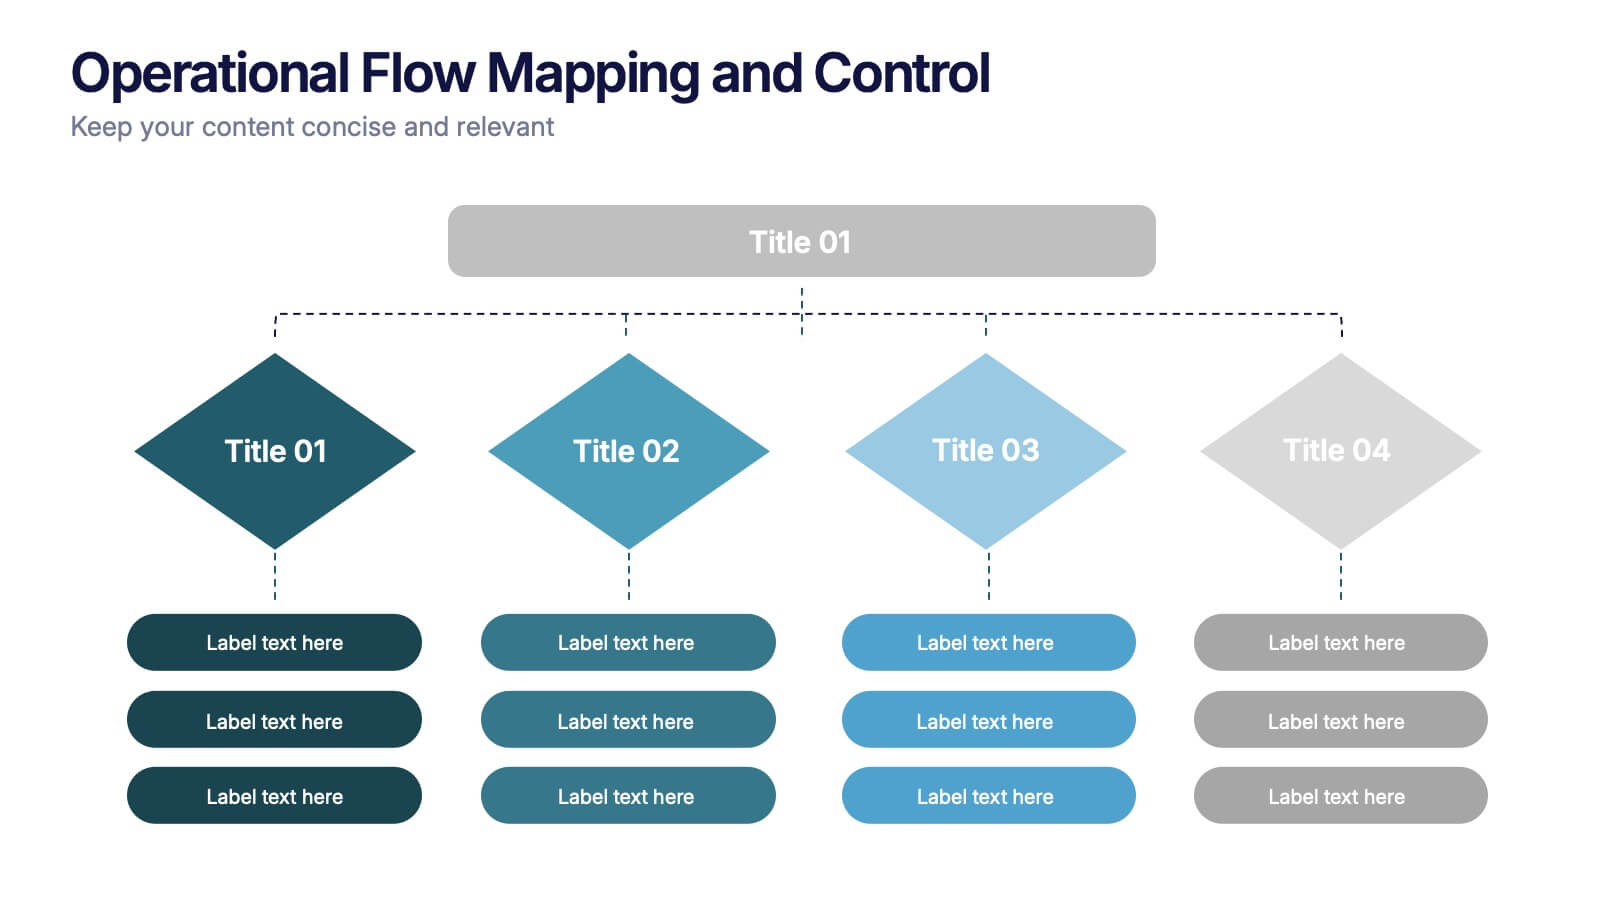
Operational Flow Mapping and Control Presentation
Streamline complex processes with the Operational Flow Mapping and Control Presentation. This template uses a clear, hierarchical layout to visualize workflows, decision points, and operational branches. Ideal for SOPs, business systems, or process improvement plans. Fully editable in Canva, PowerPoint, and Google Slides to fit any project or team need.
- Remove from favorites
Powerpoint Template
1 MB
Google Slides Template
External link
Keynote Template
1 MB
5 slides
Strategic Vision for Long-Term Growth
Turn big goals into clear milestones with this upward path-style layout—perfect for illustrating your company’s strategic vision and long-term growth plan. Use each step to highlight priorities, phases, or guiding principles along the journey. Fully compatible with PowerPoint, Keynote, and Google Slides.
- Remove from favorites
Powerpoint Template
1 MB
Google Slides Template
External link
Keynote Template
1 MB
4 slides
Risk Assessment Matrix Presentation
Highlight and evaluate business uncertainties with this Risk Assessment Matrix Presentation. Featuring a clean grid layout and color-coded risk levels, this template allows you to map out potential risks by likelihood and impact. Use the customizable labels, percentages, and legend to make your analysis clear and actionable. Ideal for project managers, consultants, or strategy teams. Compatible with PowerPoint, Keynote, and Google Slides.
- Remove from favorites
Powerpoint Template
1 MB
Google Slides Template
External link
Keynote Template
1 MB
5 slides
End-to-End Value Chain Map Presentation
Bring clarity to complex operations with a smooth, visual flow that makes every stage of your process easy to follow. This presentation maps activities from start to finish, helping teams understand dependencies, improve efficiency, and spot opportunities for optimization. Fully compatible with PowerPoint, Keynote, and Google Slides.


