


Features
- 21 Unique Slides
- Fully editable and easy to edit in Microsoft Powerpoint, Keynote and Google Slides
- 16:9 widescreen layout
- Clean and professional designs
- Export to JPG, PDF or send by email


Do you have any questions?
Recommend


5 slides
Performance Scaling Overview Presentation
Illustrate performance development with this sleek layered pyramid chart. Designed to visualize growth stages, team levels, or scaling strategies, each tier includes editable text and icons for clarity. Ideal for business reviews, capability mapping, or operational planning. Fully customizable in PowerPoint, Keynote, and Google Slides for effortless updates.


26 slides
Wilten Presentation Template
This template is a design foundation, and has been built with modern esthetic principles. The shapes are organic and earthy, with image place holders to allow customization. Designed for companies that have a strong connection to nature and the aesthetic, who wants to go beyond just being organic. Wilten template allows you to save time while getting the best result possible. A great clean modern template for creative agencies, business or branding deck. Enhance your presentations with this minimalistic design and impress your audience with smart ideas.


4 slides
Employee Performance Feedback
Showcase progress clearly with this Employee Performance Feedback presentation. Featuring skill-based metrics, productivity scores, and analysis ratings, this layout uses visual data bars to evaluate team performance at a glance. Perfect for HR reviews, team assessments, or quarterly check-ins. Fully editable in PowerPoint, Keynote, and Google Slides.


6 slides
AI-Driven Innovation in Business Presentation
Bring your ideas to life with a burst of tech brilliance—this bold, modern layout captures the synergy between artificial intelligence and business innovation. Use it to explore automation, data-driven insights, and future-focused strategies. Fully editable and compatible with PowerPoint, Keynote, and Google Slides for seamless presentation design.


4 slides
EU Business Coverage Map Presentation
Highlight your European business presence with the EU Business Coverage Map Presentation. This slide layout uses pinpoint markers and color-coded regions to showcase operations, regional offices, or market coverage across Europe. Ideal for quarterly reports, sales updates, or investor briefings. Fully editable in PowerPoint, Keynote, Google Slides, and Canva.


12 slides
Cloud-Based Digital Transformation Presentation
Illustrate your path to digital evolution with this multi-cloud infographic layout. Perfect for visualizing service integrations, SaaS environments, or migration strategies, this slide highlights five key areas of transformation using cloud-shaped icons and a central connectivity hub. Fully customizable in PowerPoint, Keynote, and Google Slides.


4 slides
Business Plan in 4 Clear Steps
Break down your business strategy into four simple, actionable stages with this bold, visual template. Featuring a colorful quadrant layout inside a professional case graphic, it's perfect for business plans, roadmaps, or project overviews. Easily editable in PowerPoint, Keynote, and Google Slides.


4 slides
Europe Market Expansion Visualization Presentation
Showcase your European growth strategy with the Europe Market Expansion Visualization Presentation. This map-based slide design allows you to clearly highlight regional opportunities, new market entries, and key expansion zones using icons and color-coded country markers. Ideal for strategic planning, investor updates, and sales overviews. Fully editable in PowerPoint, Keynote, Google Slides, and Canva.


8 slides
Interactive Digital Learning Experience Presentation
Make your content more engaging with the Interactive Digital Learning Experience Presentation. This layout blends quiz-style visuals and educational icons, helping you present learning modules, assessments, or training checkpoints in a fun and intuitive way. Use it to simplify information, boost audience interaction, or highlight multiple-choice content. Fully editable in Canva, PowerPoint, Keynote, and Google Slides.


6 slides
Scrum and Kanban Agile Delivery Presentation
Streamline your Agile processes with this modern Scrum and Kanban workflow slide. Highlight six key stages in your delivery cycle using a sleek, color-coded format with icons. Ideal for project managers, developers, and Agile teams. Fully editable in PowerPoint, Keynote, and Google Slides. Clean, professional layout for maximum clarity.


8 slides
30-60-90 Day Business Plan Presentation
Set clear goals and track progress effortlessly with this 30-60-90 day business plan template! Designed for professionals, managers, and entrepreneurs, this structured layout helps outline priorities, set milestones, and ensure a smooth transition from planning to execution. Fully customizable and compatible with PowerPoint, Keynote, and Google Slides for seamless presentations.


5 slides
Collaboration Tools for Team Efficiency Presentation
Visualize teamwork like never before with the Collaboration Tools for Team Efficiency Presentation. Featuring a puzzle-style layout, this slide highlights four interconnected ideas or steps—perfect for team workflows, project milestones, or tool comparisons. Easy to customize in Canva, PowerPoint, or Google Slides.


26 slides
Olympus Brand Guidelines Proposal Presentation
The Olympus Brand Identity Presentation is a sleek and modern template designed to help you showcase your brand's unique identity and strategy. This template kicks off with a clean and engaging slide that sets the stage for the entire presentation. It guides you through various aspects of brand identity, including brand components, target audience, and unique selling proposition (USP). The template also dives into brand positioning, strategy, and guidelines, ensuring that your brand's message is consistent and compelling. Additionally, it covers brand experience, recognition, and recall, offering a comprehensive view of your brand's impact. With dedicated sections for performance metrics, brand success stories, and future development, this template provides a complete toolkit for effectively communicating your brand's strengths and vision. Fully compatible with PowerPoint, Keynote, and Google Slides, the Olympus template is perfect for any brand-focused presentation.
20 slides
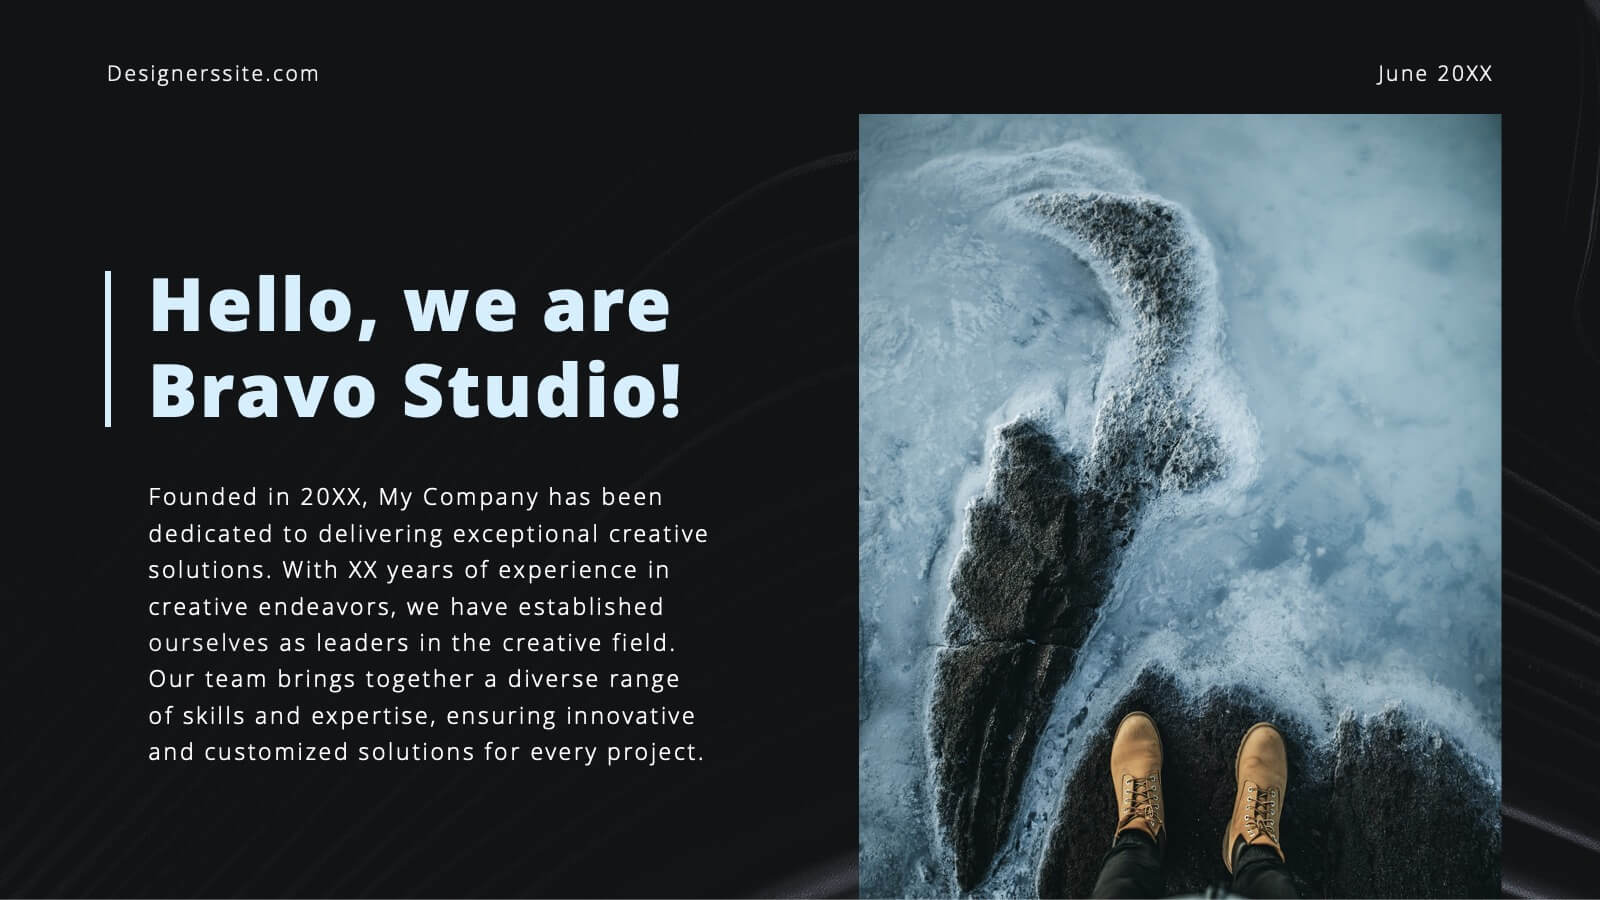
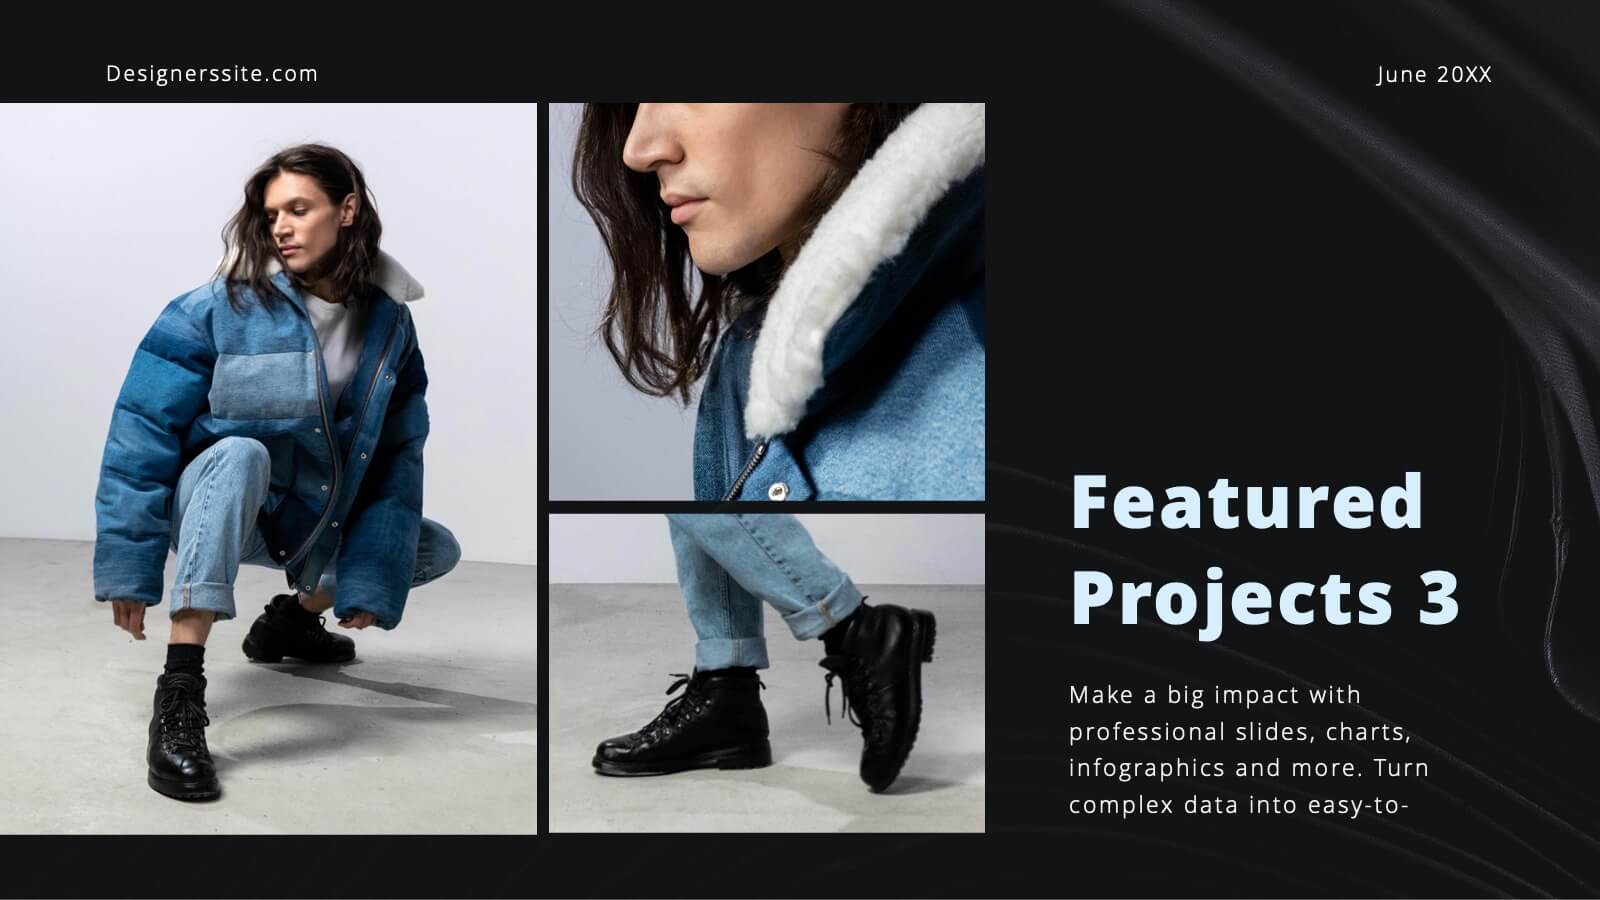
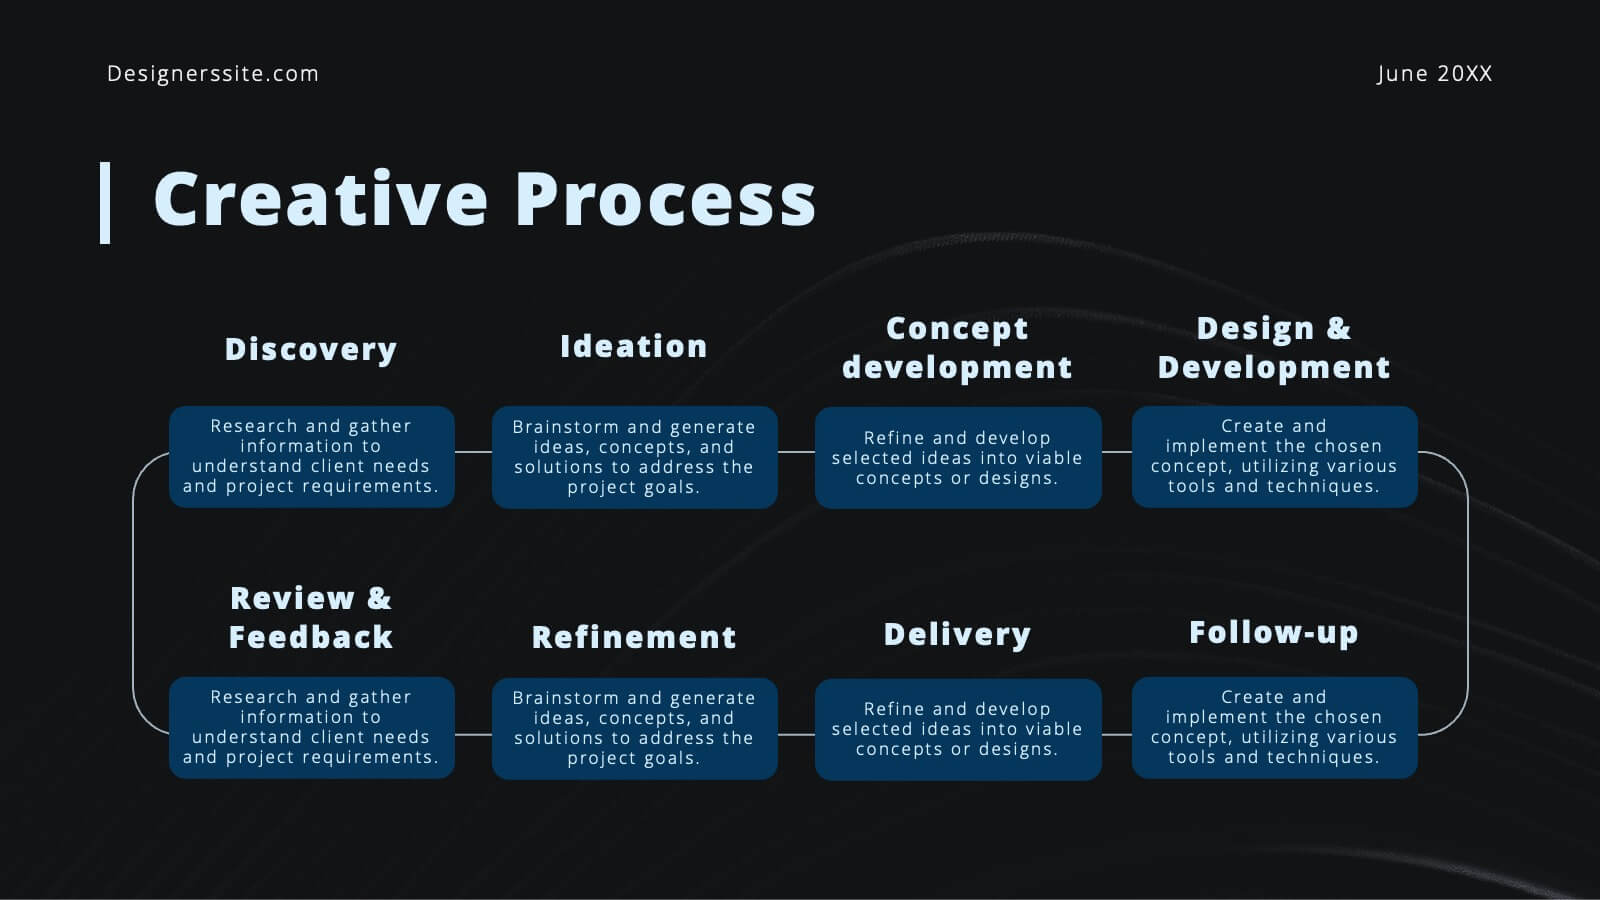
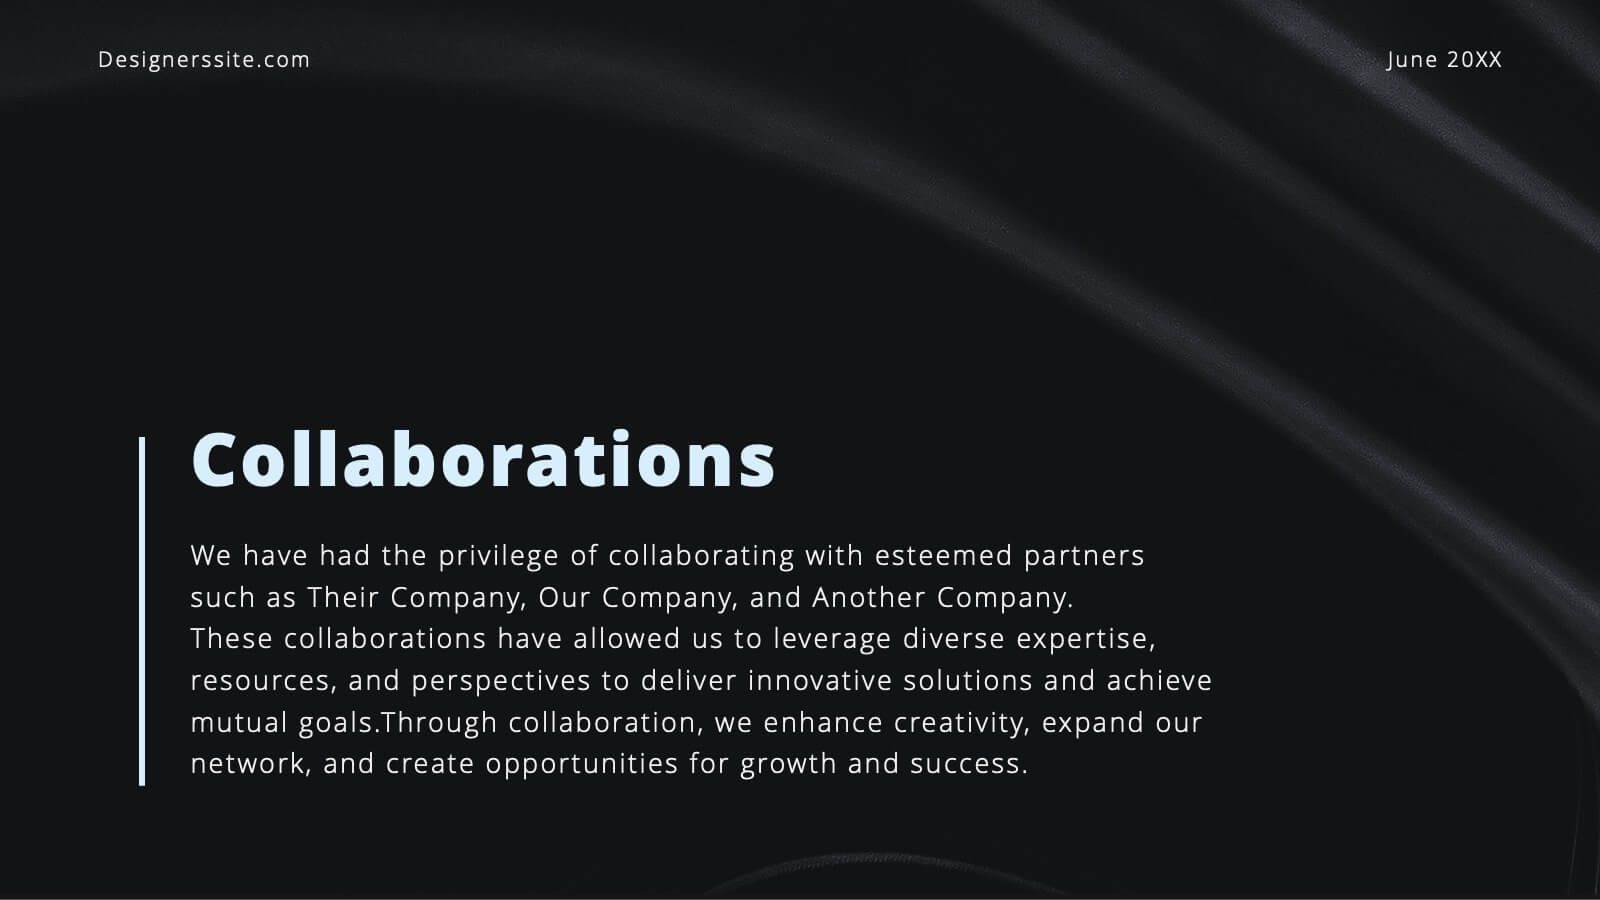
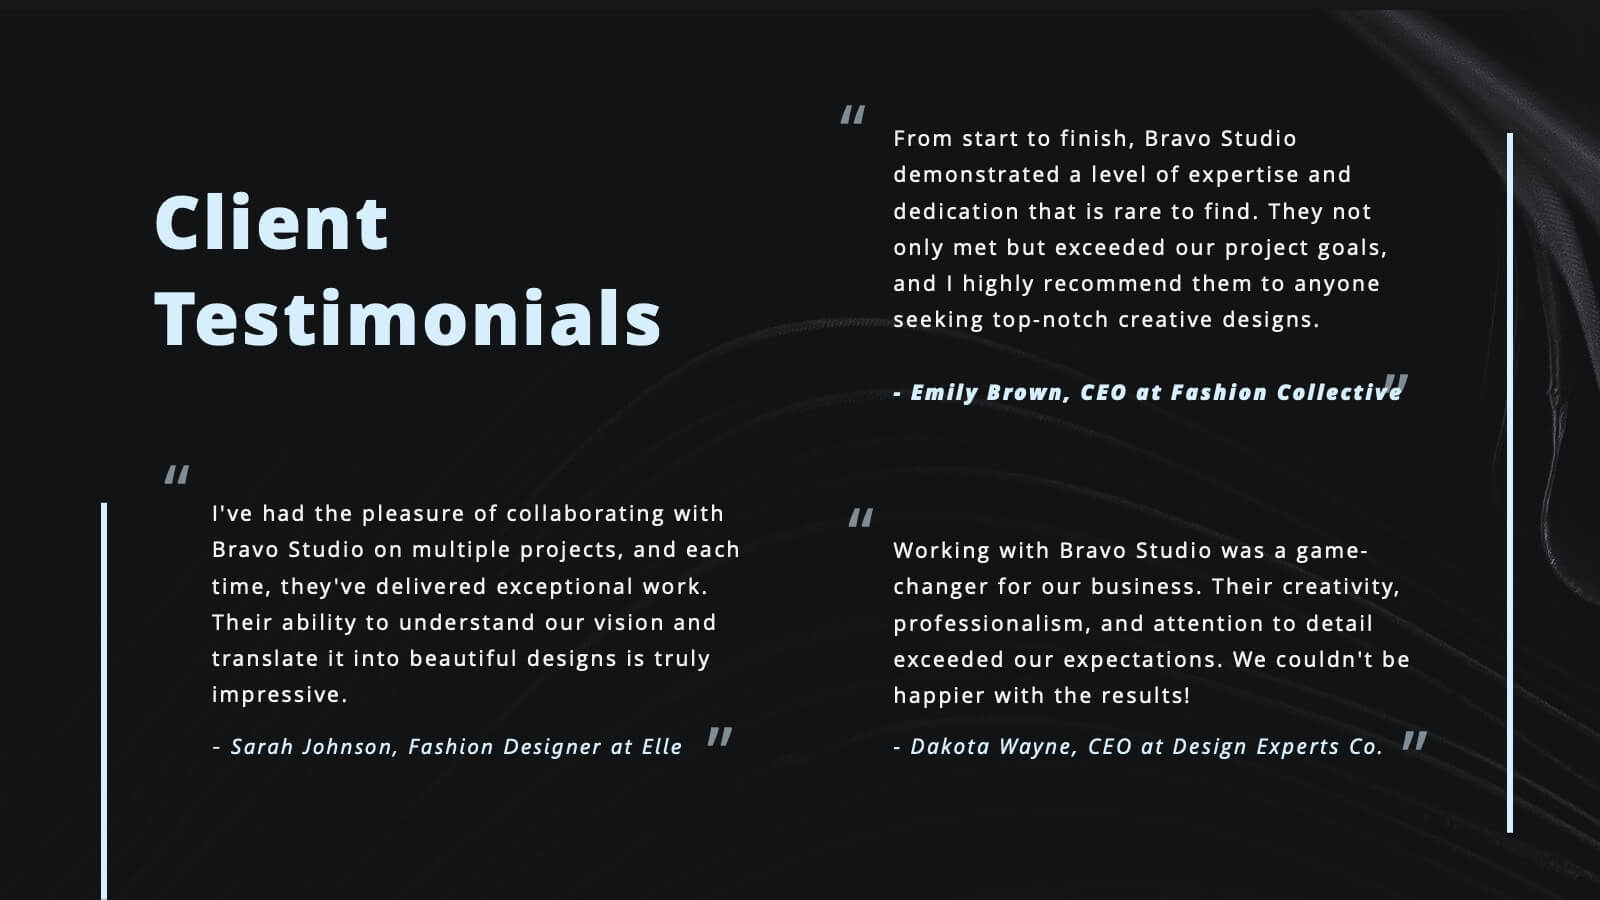
Bravo Creative Portfolio Presentation
Showcase your creative prowess with this sleek, modern portfolio presentation template. Perfect for highlighting featured projects, client testimonials, and your creative process, this template ensures your work shines. Its stylish design and professional layout make it ideal for impressing potential clients and collaborators. Compatible with PowerPoint, Keynote, and Google Slides, it's versatile for any platform.


5 slides
Visual Data Representation Bubble Map
Display complex data in a clean, engaging format with this Visual Data Representation Bubble Map. Ideal for highlighting key points, data clusters, or relationships, each bubble can be customized to match your topic. Perfect for presentations in business, research, or strategy—fully editable in PowerPoint, Keynote, and Google Slides.


6 slides
Professional Business Plan Presentation
Make every idea count with a clean, professional presentation that helps you communicate your business strategy clearly and confidently. Ideal for showcasing goals, market insights, and performance plans, it delivers structure with style. Fully compatible with PowerPoint, Keynote, and Google Slides for easy customization and seamless presentation design.


6 slides
Strategic Triangle Layout Presentation
Turn your ideas into a visual roadmap with this sleek, geometric layout that balances design and strategy. Perfect for illustrating workflows, key milestones, or connected concepts, it helps your message flow seamlessly across stages. Fully editable and compatible with PowerPoint, Keynote, and Google Slides for effortless customization.