


Features
- 10 Unique Slides
- Fully editable and easy to edit in Microsoft Powerpoint, Keynote and Google Slides
- 16:9 widescreen layout
- Clean and professional designs
- Export to JPG, PDF or send by email


Do you have any questions?
Recommend


5 slides
Real Estate Requirements Infographics
Real Estate Infographics can be an effective way to convey information about the real estate industry in a visually appealing and simple manner. This infographic template is perfect to showcase market trends, statistics, and data in a clear and concise way, making it easier for your audience to interpret the information. As well as educating and informing your clients, investors, and other stakeholders about various aspects of the real estate market. Overall, these infographic will help you communicate information about the real estate industry and help your clients make informed decisions about buying, selling, or investing in property.


6 slides
World Market Presence and Expansion Map Presentation
Showcase your company’s global footprint with this World Market Presence and Expansion Map. Visually highlight key regions, market activity, or strategic territories. Perfect for investor decks, global overviews, or international growth strategies. Fully editable in PowerPoint, Keynote, and Google Slides for seamless integration into your professional presentation workflow.


21 slides
Selkie New Product Proposal Presentation
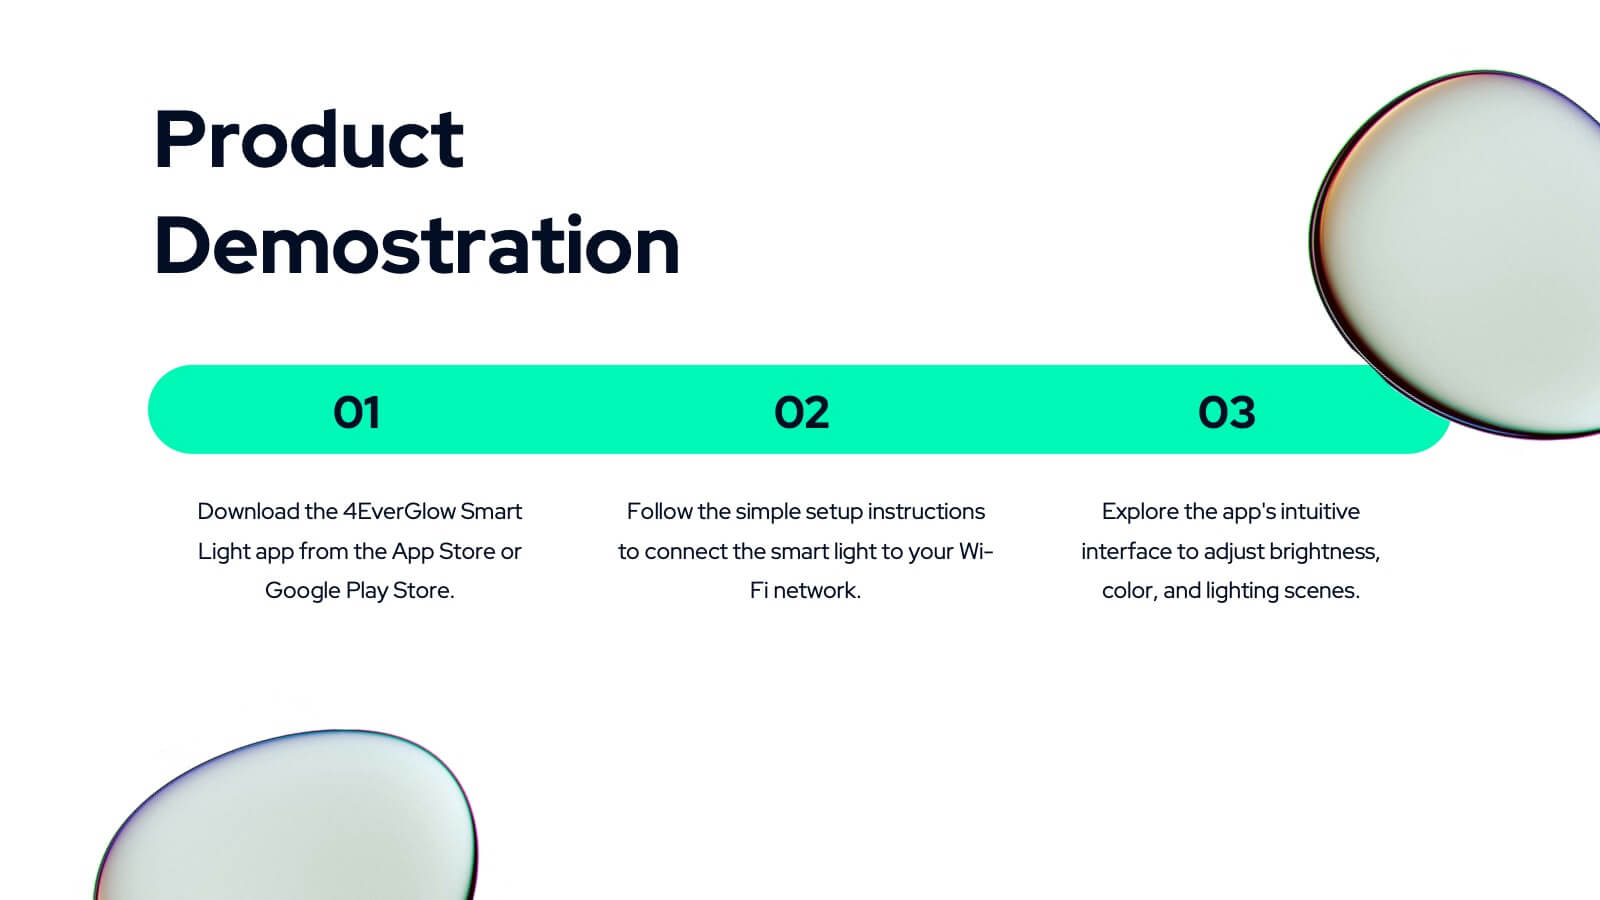
Dive into your next big idea with this sleek, Selkie-inspired presentation template, designed for presenting a new product proposal! Highlight key features, market opportunities, and potential growth in a visually captivating format that flows effortlessly. Engage your audience and make an impact. Compatible with PowerPoint, Keynote, and Google Slides for easy customization.


6 slides
Simple Horizontal Timeline Design Presentation
Bring your story to life with a smooth, step-by-step visual that guides viewers through key events with clarity and ease. This presentation helps you outline timelines, processes, or project stages in a clean horizontal flow that’s simple to follow and easy to customize. Fully compatible with PowerPoint, Keynote, and Google Slides.


21 slides
Slumbera Product Roadmap Presentation
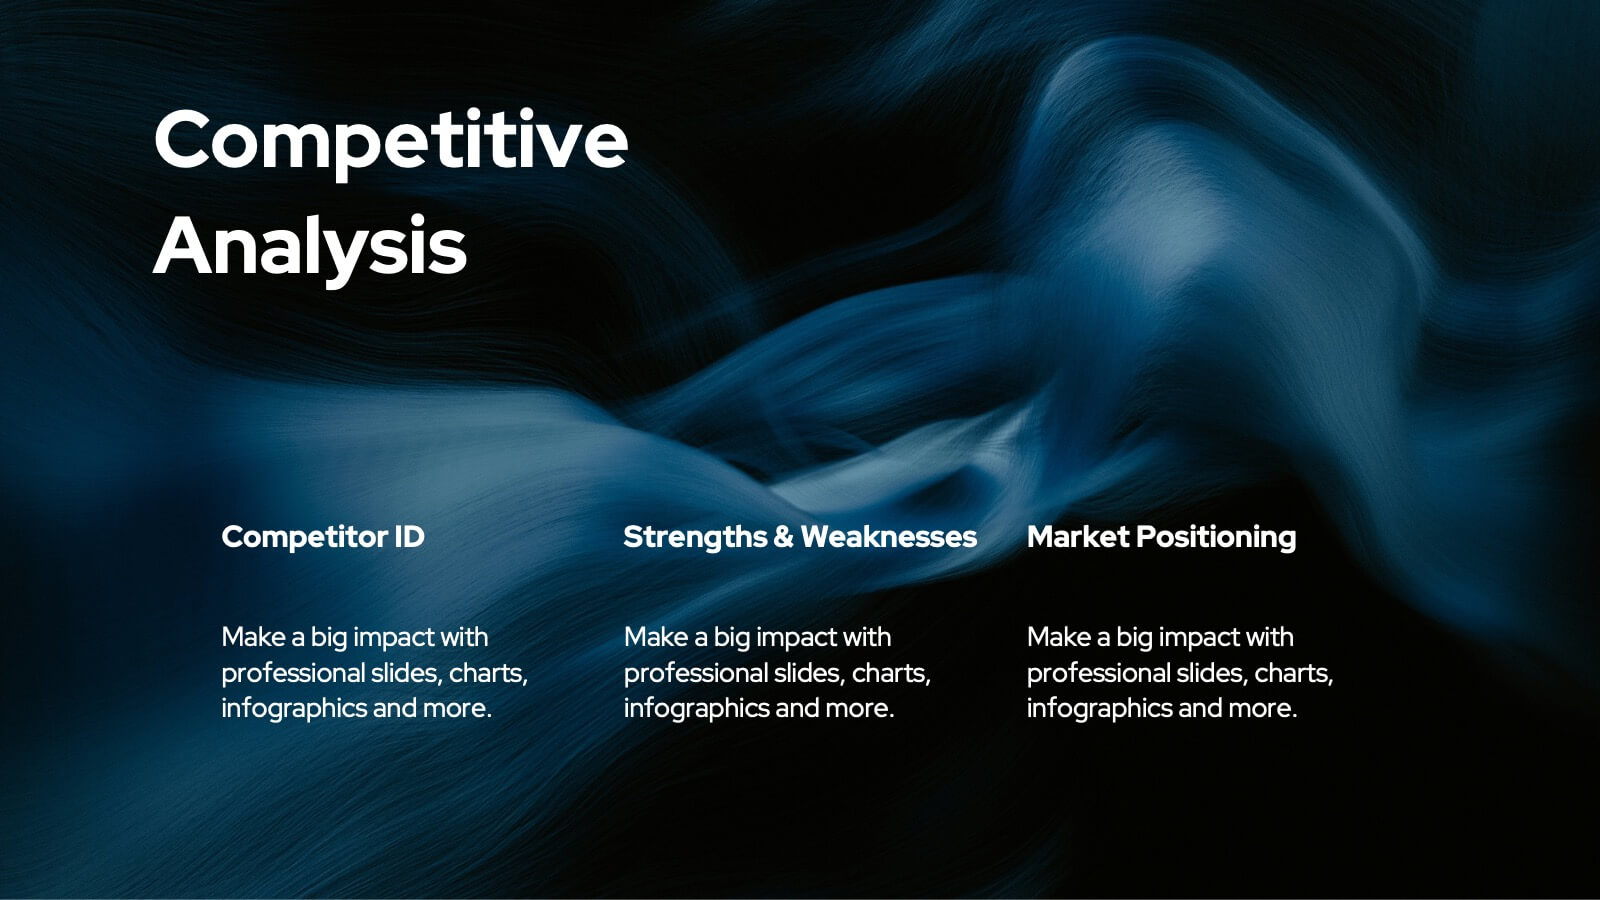
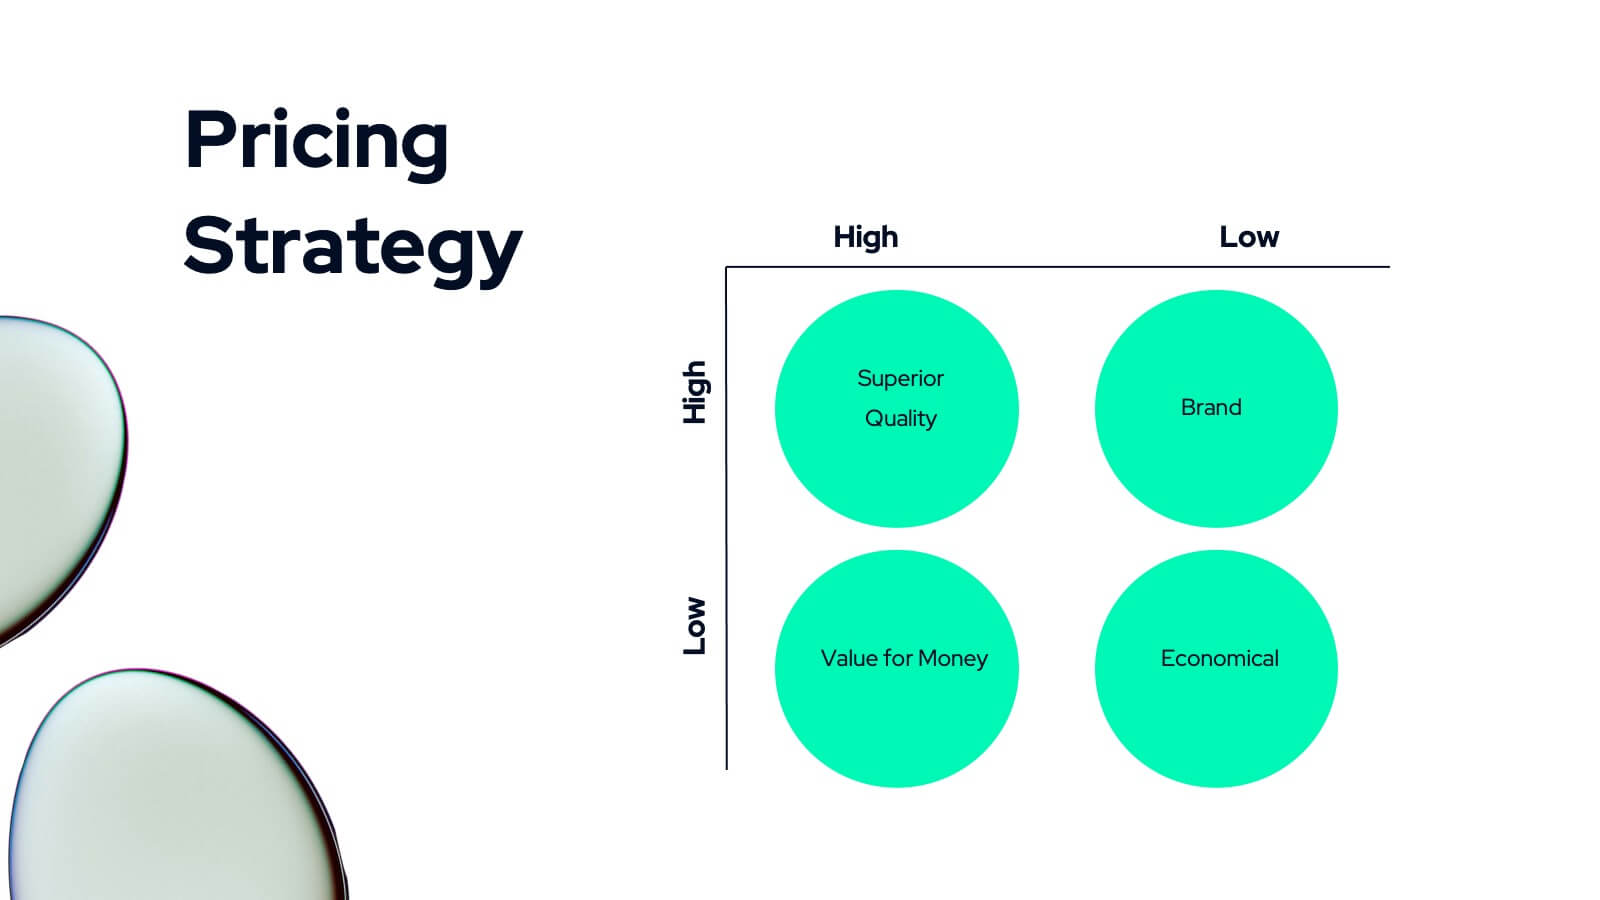
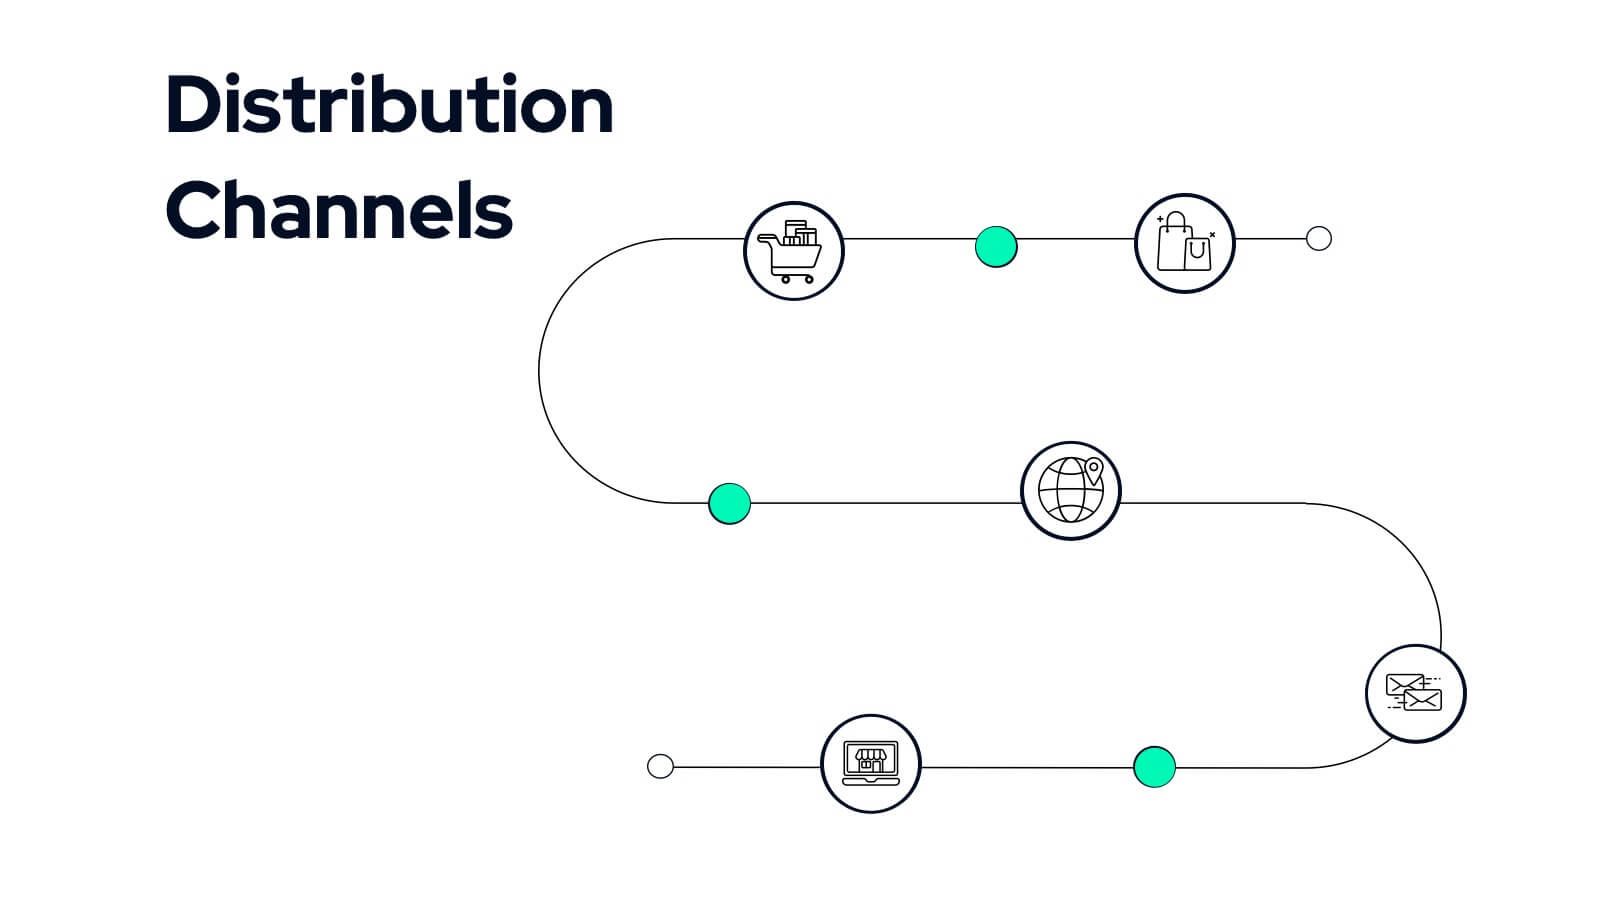
Plan and showcase your product strategy with this clean and professional template. Cover key aspects such as product overview, target market, competitive analysis, and marketing strategy to align stakeholders and drive success. Fully customizable and compatible with PowerPoint, Keynote, and Google Slides.


7 slides
Performance Cycle Infographic Presentation
A Cycle Infographic is a process-oriented model that describes an ongoing activity or a repeating task. The cycle diagrams are used to show the flow of a process as a series of steps and decisions, each with its own terminations and branches. This template is perfect for motivating, organizing and presenting tasks and projects. It can be used to highlight processes, collaboration, statistics and more. This is a colorful, creative template design for explaining key business ideas, processes or theories in a dynamic and easily digestible way. It's perfect for teaching, students and businesses.


6 slides
Business Process Flowchart Presentation
Streamline your workflow with the Business Process Flowchart presentation. This structured and visually engaging template helps you map out processes, optimize efficiency, and improve communication within your team. Designed for business analysts, managers, and strategists, this fully editable slide ensures clarity in decision-making and operations. Compatible with PowerPoint, Keynote, and Google Slides.


6 slides
Strategic Wheel Diagram Presentation
Capture attention instantly with this bold and modern visual design built for strategic presentations. Ideal for mapping key processes, illustrating interconnected goals, or showcasing business strategies, it organizes ideas in a circular, easy-to-follow layout. Fully customizable and compatible with PowerPoint, Keynote, and Google Slides for seamless editing and presentation.


6 slides
Strategic Business Planning Presentation
Bring your ideas to life with a slide design that makes strategic planning feel bold, focused, and easy to follow. This presentation walks through key business objectives, priorities, and action steps using clean visuals and intuitive layouts. Perfect for teams presenting strategy, goals, and long-term planning. Fully compatible with PowerPoint, Keynote, and Google Slides.


6 slides
Team Leadership and Management
Foster stronger collaboration with this team-focused circular diagram. Designed to showcase six key areas of team leadership, this template is perfect for outlining communication, goal-setting, delegation, performance, feedback, and development strategies. Ideal for managers, trainers, and HR professionals. Fully customizable in PowerPoint, Keynote, and Google Slides.


5 slides
Territory Overview in Oceania Presentation
Highlight your regional data with the Territory Overview in Oceania Presentation. Featuring a clean map layout of Australia and surrounding territories, this slide is ideal for displaying key regional insights, office locations, or performance data. Color-coded markers and callouts help organize your content clearly. Fully editable in Canva, PowerPoint, or Google Slides.


23 slides
Drift UX Case Study Presentation
Ready to wow your audience with a stunning showcase of your UX and UI design brilliance? This UX Case Study template is your secret weapon to turn heads and leave a lasting impression! Bursting with sleek, modern designs, it’s tailored to guide your audience through every thrilling step of your design process—from initial research and user personas to wireframes, prototypes, and polished final products. Highlight your innovative thinking, showcase your creative problem-solving, and bring your design stories to life in a way that's not just informative, but truly inspiring. Whether you’re pitching to a client, presenting to stakeholders, or sharing your vision with the world, this template ensures your ideas shine bright. Fully compatible with PowerPoint, Keynote, and Google Slides, it's the perfect tool to captivate, engage, and inspire your audience at every slide!


10 slides
Territorial Insights with South America Map Presentation
Unlock regional clarity with the Territorial Insights with South America Map Presentation. This editable slide visualizes country-specific highlights using a modern grid-based map layout, customizable color zones, and label connectors to break down key insights. Ideal for sales analysis, market entry strategies, or logistics reporting. Compatible with PowerPoint, Keynote, Google Slides, and Canva.


6 slides
Innovation Pipeline and Idea Execution
Streamline your innovation process with the Innovation Pipeline and Idea Execution Presentation. This clean, layered funnel layout is ideal for visualizing each stage from idea generation to implementation. Perfect for R&D teams, product managers, or corporate strategists, this slide is fully editable in PowerPoint, Keynote, and Google Slides.


5 slides
Data Analytics Heat Map
Visualize data intensity and trends effortlessly using this heat map-style layout. Ideal for performance tracking, comparative analysis, and decision-making frameworks, this slide organizes information by low, medium, and high value ranges. Fully customizable in PowerPoint, Keynote, and Google Slides.


20 slides
Miragyn Project Proposal Presentation
Showcase your project proposal with confidence using this visually appealing and structured template. Featuring a clear layout, it includes slides for project summaries, problem statements, and proposed solutions, allowing you to effectively communicate your vision and strategy. This template highlights essential details such as objectives and goals, timeline and milestones, and budget breakdown, making it ideal for delivering concise and impactful proposals. It also includes dedicated sections for team expertise, client testimonials, and terms and conditions, ensuring every aspect of your project is covered. Fully editable and compatible with PowerPoint, Google Slides, and Keynote, this template is perfect for professionals aiming to leave a lasting impression with their project presentations.


7 slides
Europe Population Infographic Presentation
A Europe Map infographic is a visual representation of the European continent, highlighting its geographic features, population, culture, history, and other relevant information. This template is a perfect graphic representation of Europe that combines text, data, and images in a fun and engaging way. This pre-designed template allows users to modify or customize the map to suit their specific needs. This includes a map of Europe with its countries, major cities, and geographic features, along with additional information and visuals related to the topic or purpose of the infographic.