


Features
- 2 Unique slides
- Fully editable and easy to edit in Microsoft Powerpoint, Keynote and Google Slides
- 16:9 widescreen layout
- Clean and professional designs
- Export to JPG, PDF or send by email


Do you have any questions?
Recommend


7 slides
Mission Statement Infographic
Present your organization's core values and goals with clarity using this collection of professionally designed slide templates. Each one is crafted to communicate key elements of your strategic vision effectively, combining aesthetic appeal with functional design to ensure your message resonates. Featuring a clean and professional layout, these slides emphasize the importance of your foundational principles. The balanced use of images and text is ideal for enhancing corporate presentations, stakeholder meetings, or team workshops. With various designs available, you can select the layout that best aligns with your branding and organizational ethos. These templates are fully customizable, allowing for adjustments in color, font, and imagery to perfectly articulate your core messages. They are an excellent tool for motivating your team, impressing stakeholders, and conveying the driving purpose behind your initiatives.


24 slides
Blazewind User Experience Proposal Presentation
This UX Strategy Plan Presentation Template is a comprehensive and visually engaging solution for presenting user experience design strategies. Covering key elements such as research, wireframing, prototyping, user testing, and design principles, it ensures a structured approach to showcasing your UX process. Ideal for UX/UI designers, agencies, and businesses looking to communicate their design strategies effectively. Fully compatible with PowerPoint, Keynote, and Google Slides for seamless customization.


7 slides
Business Model Canvas Value Infographic
The business model canvas is a strategic management tool that provides a visual framework for developing, describing, and analyzing a business model. Prepare for a dynamic voyage through business success with our business model canvas value infographic. This is not just a blueprint; it's a vivid map to unlock the value potential in your business model. Navigate through the core elements, envision your venture, and redefine success. Compatible with Powerpoint, Keynote, and Google Slides. Showcase how a strong customer relationships is key. With this infographic illustrate the strategies to keep your audience coming back for more!


6 slides
Education Services Infographic
Education services refer to the various activities and resources provided to facilitate learning and knowledge acquisition. This infographic template showcases various education services and their benefits. This infographic is designed to highlight the different aspects of education services and their impact on individuals and society as a whole. The infographic features a vibrant and eye-catching design that captures attention and engages viewers. The use of bright colors and appealing illustrations makes the infographic visually appealing and memorable. Compatible with Powerpoint, Keynote, and Google Slides.


12 slides
Investment Strategy Presentation
The "Investment Strategy Presentation" template is designed for effectively mapping out and displaying various investment strategies. It uses a multi-colored light bulb graphic, which symbolizes ideas and innovation in investment planning, making it visually appealing and easy to understand. Each segment of the light bulb is labeled with letters A through F, representing different aspects or phases of an investment strategy that can be tailored to specific objectives or points of discussion. This format helps in presenting complex financial data or strategies in a straightforward manner that can be easily grasped by audiences, making it an ideal choice for financial analysts, investors, or corporate strategy meetings.

22 slides
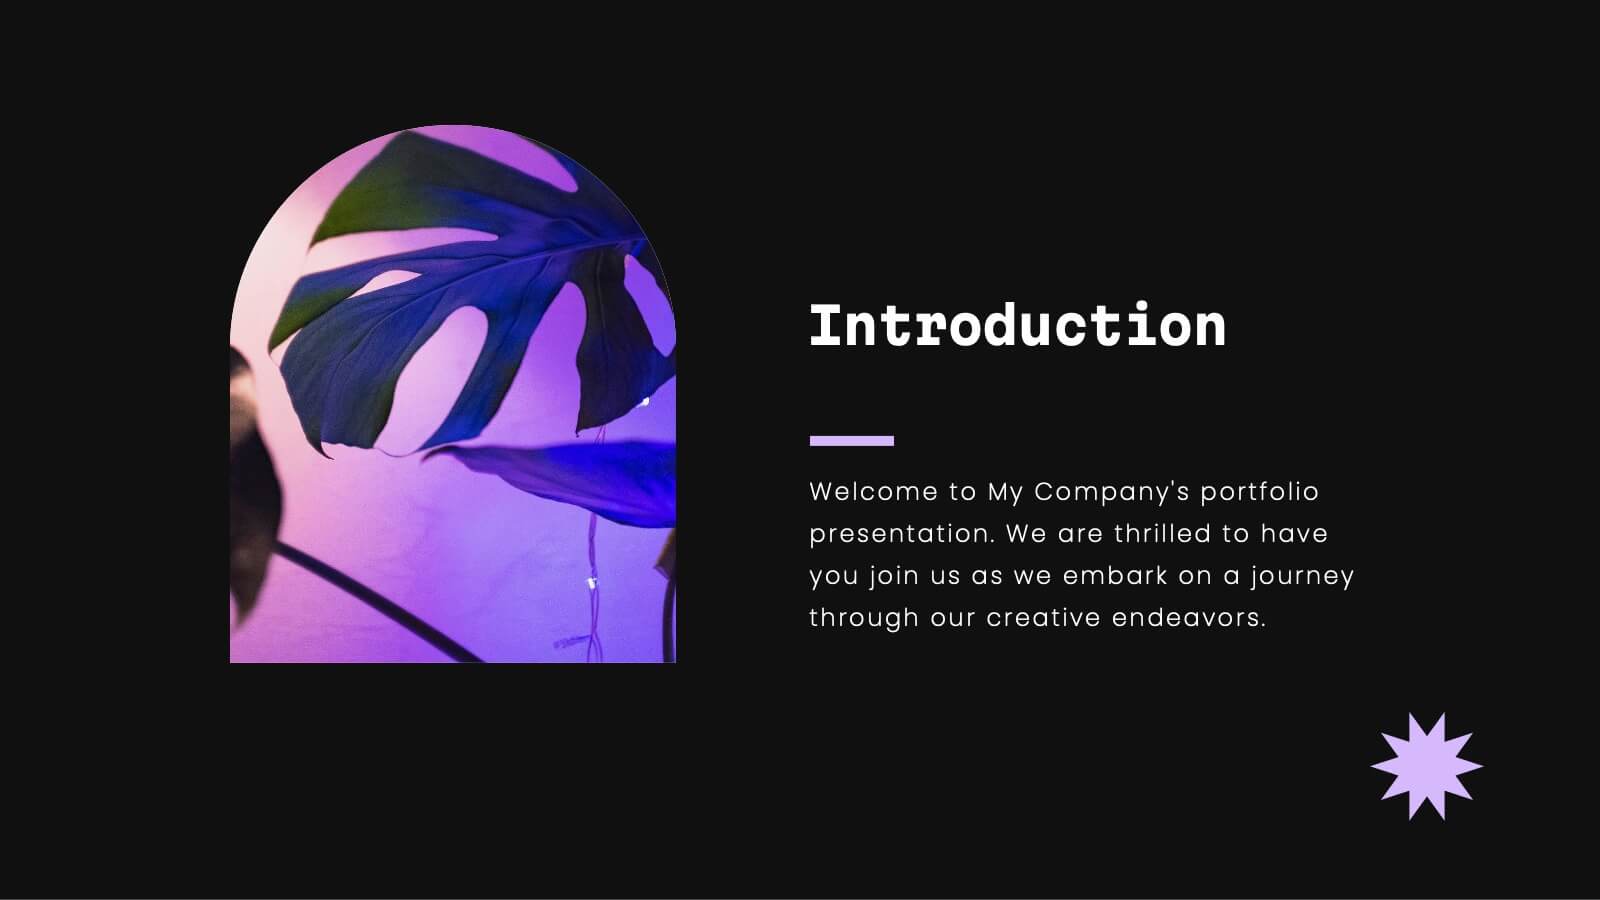
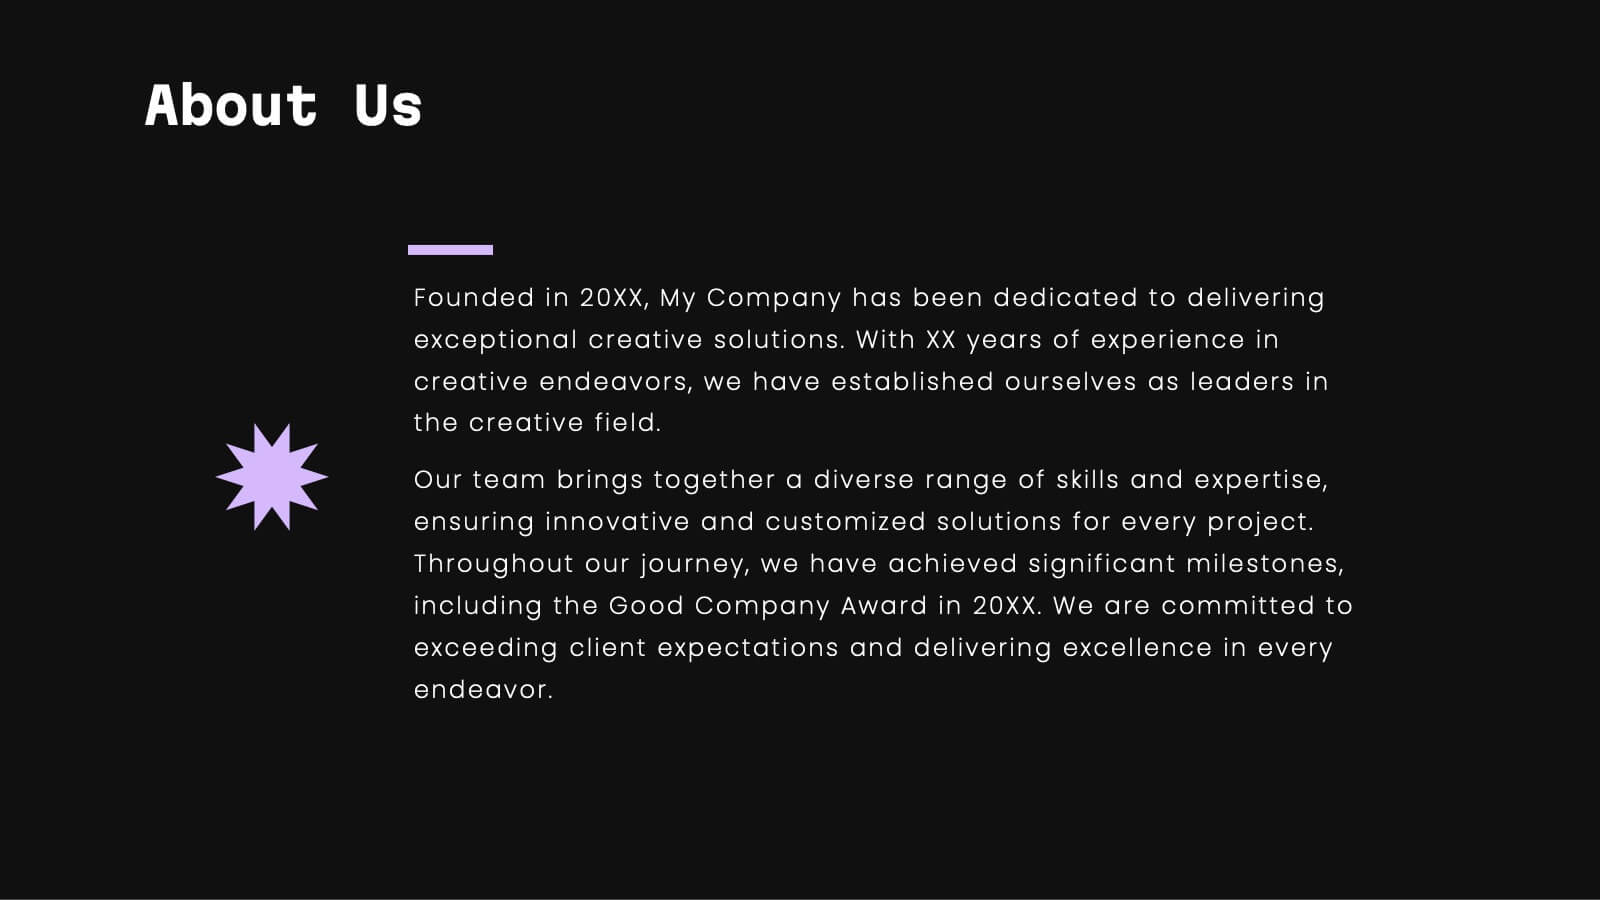
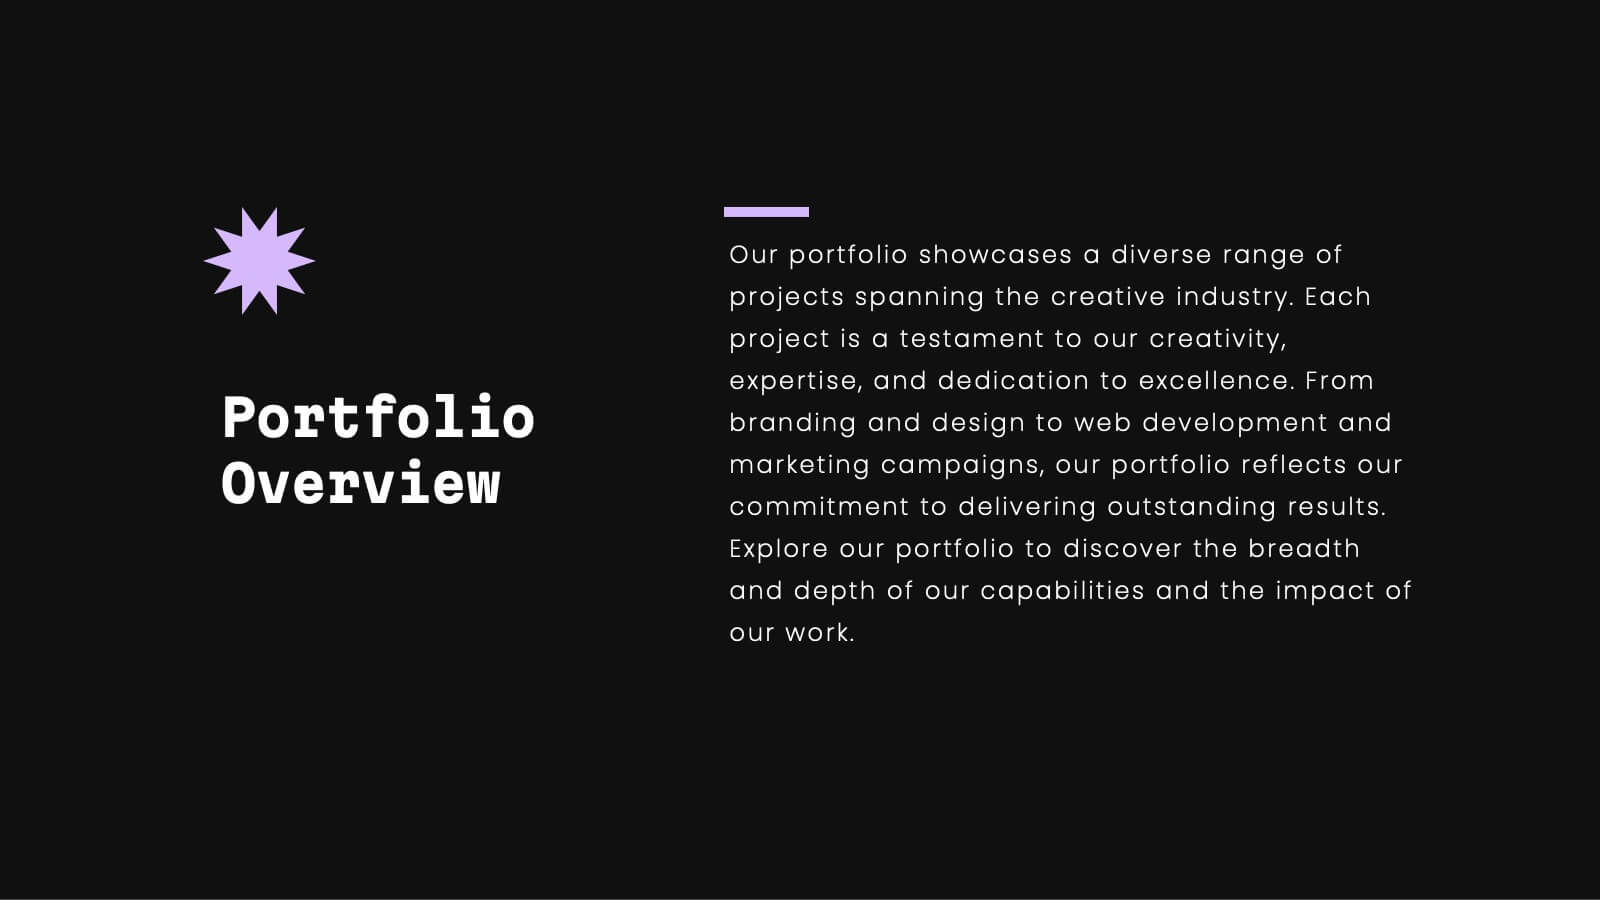
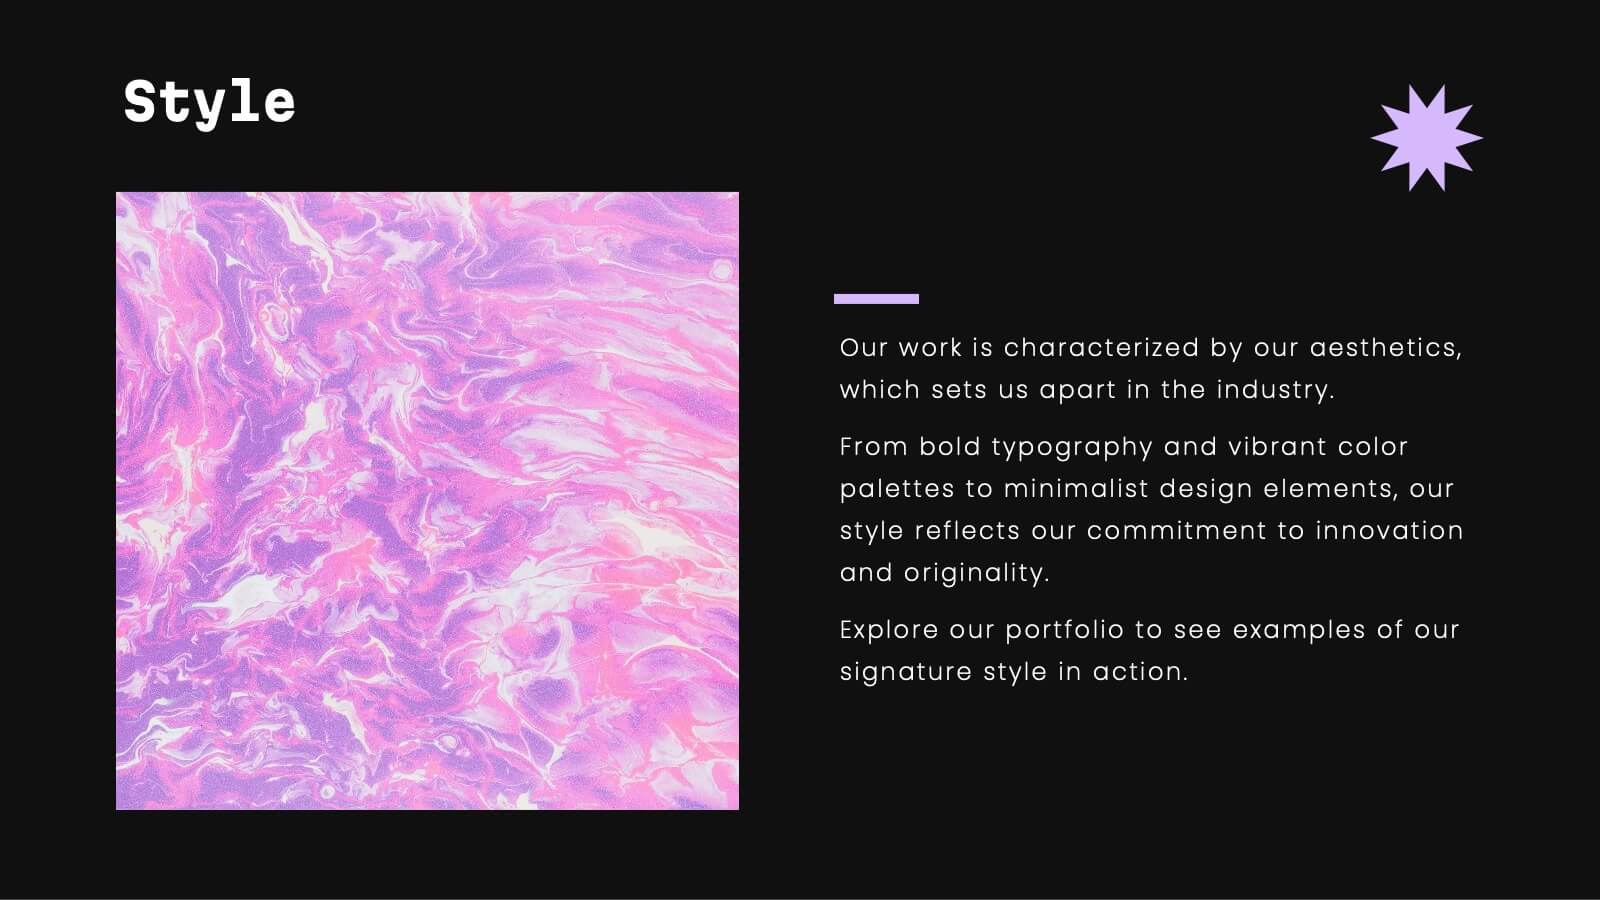
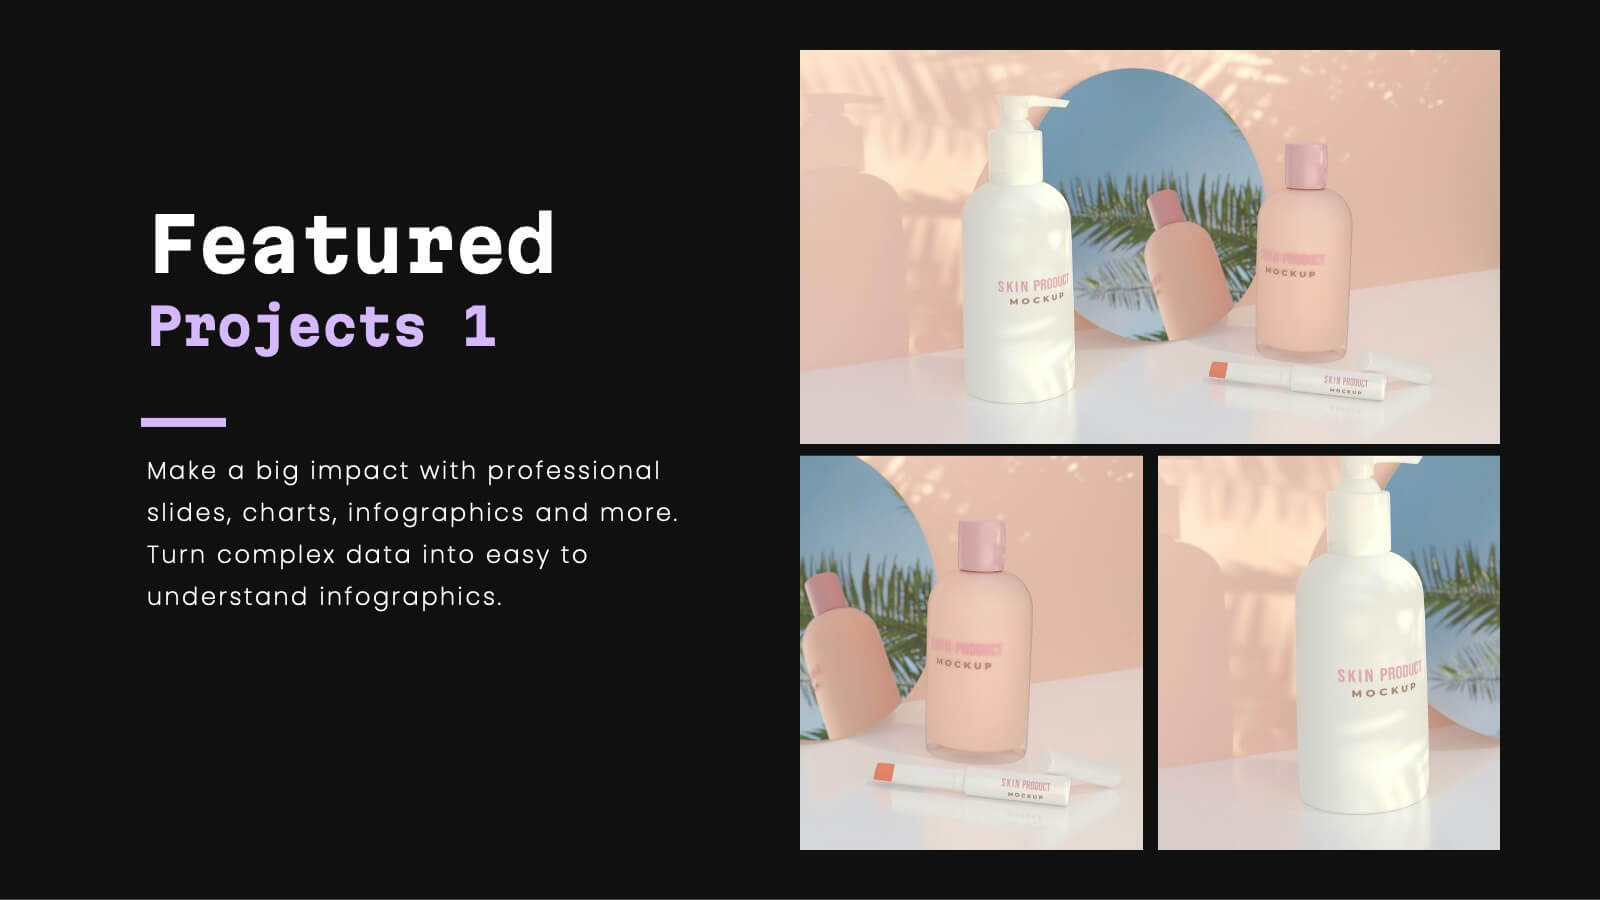
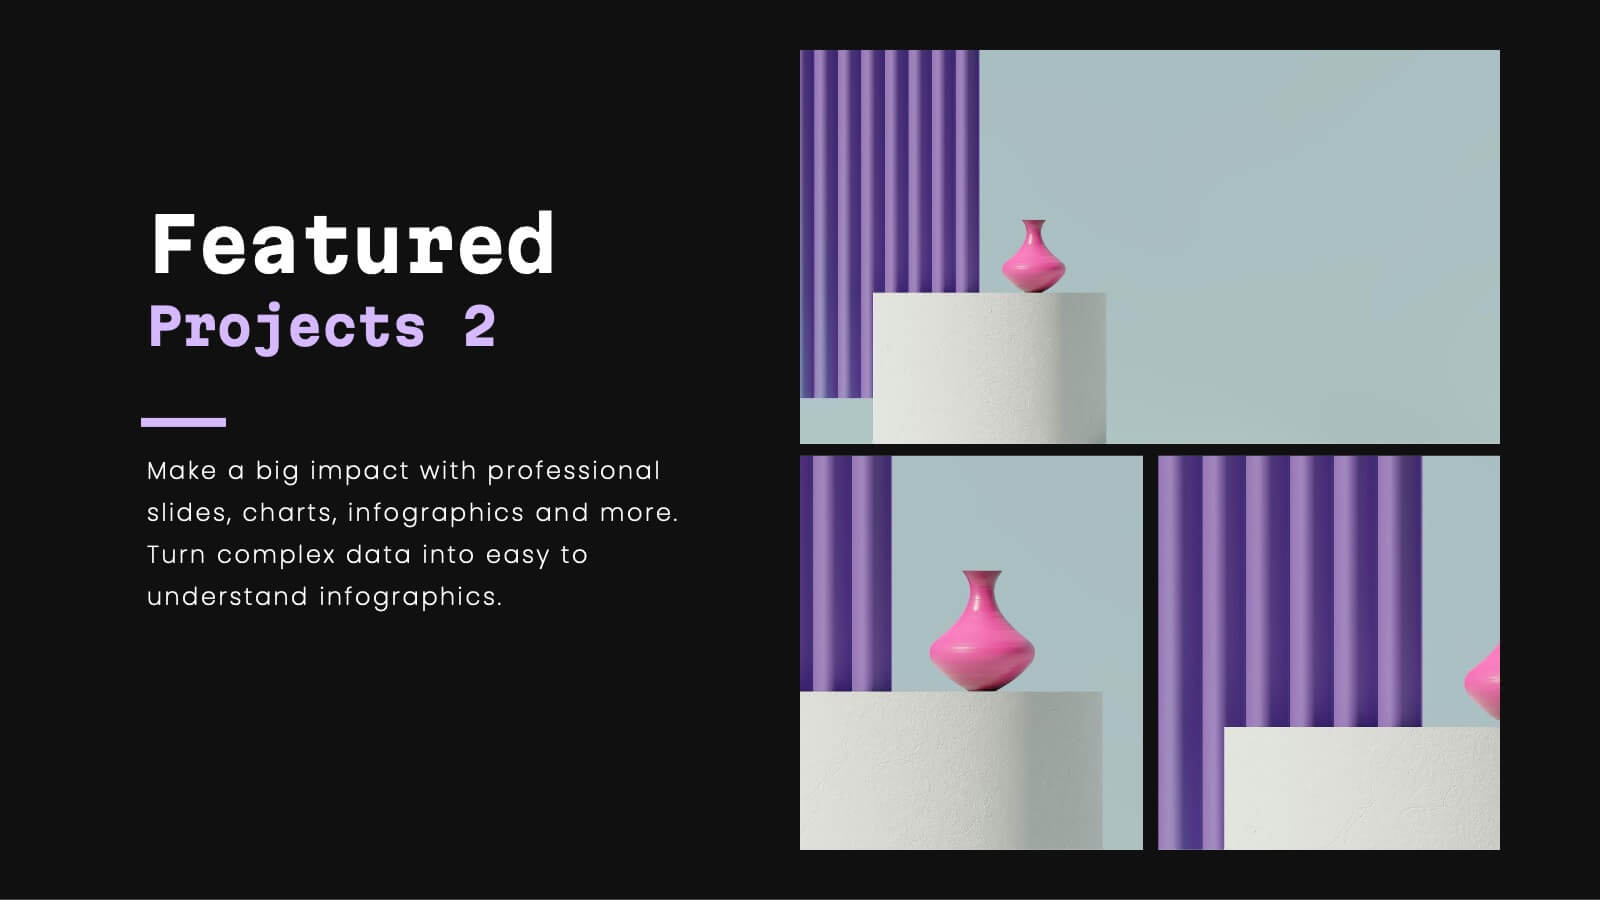
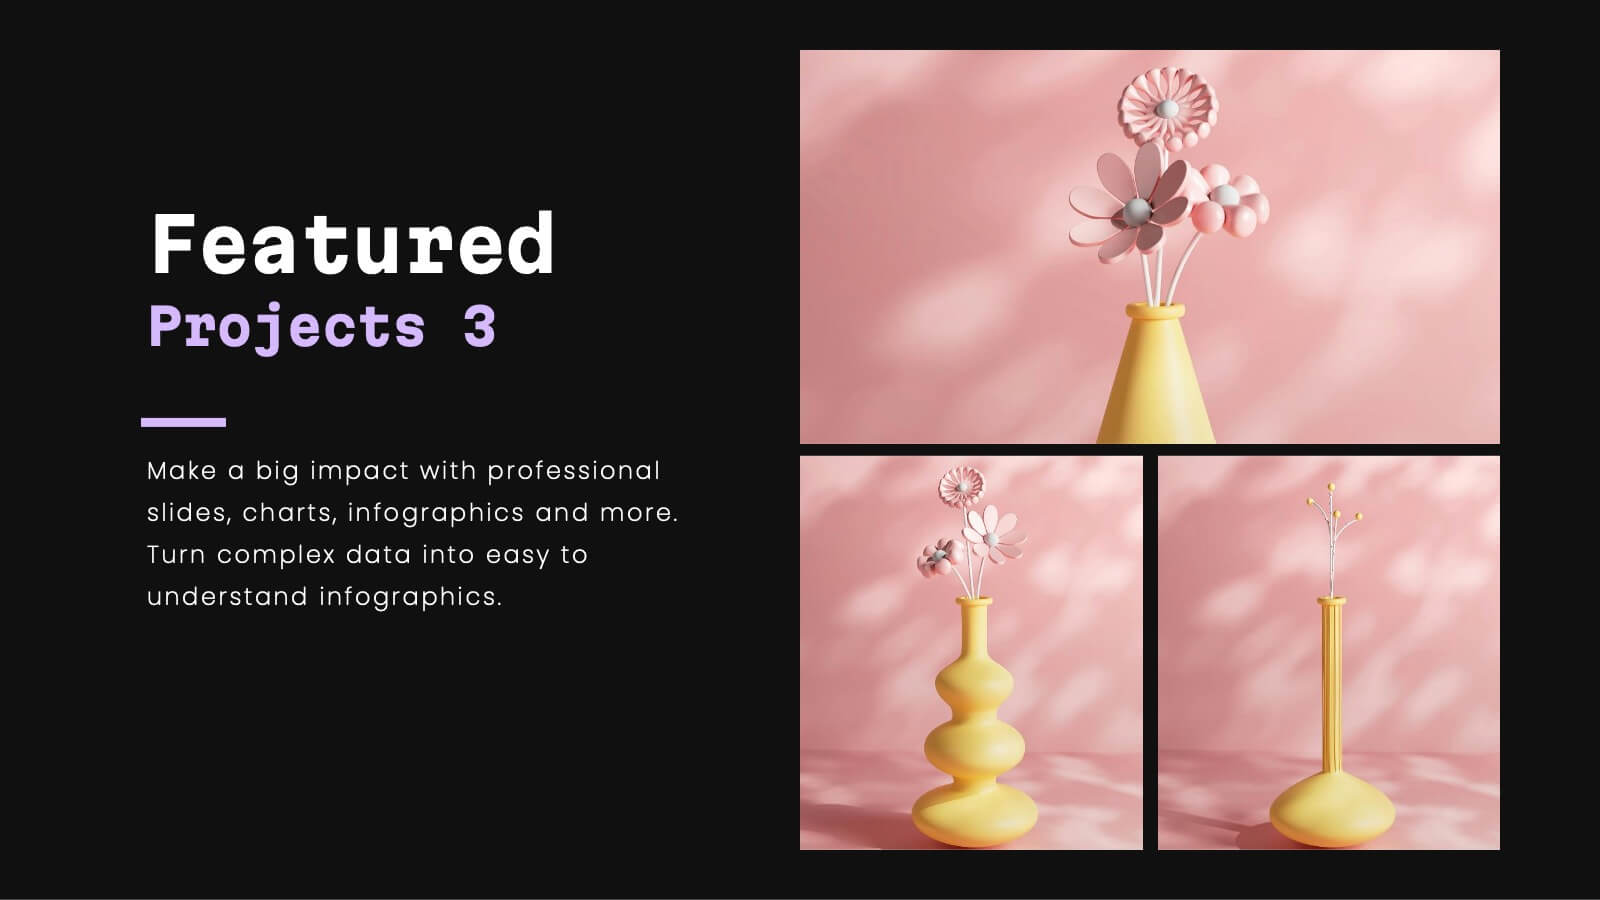
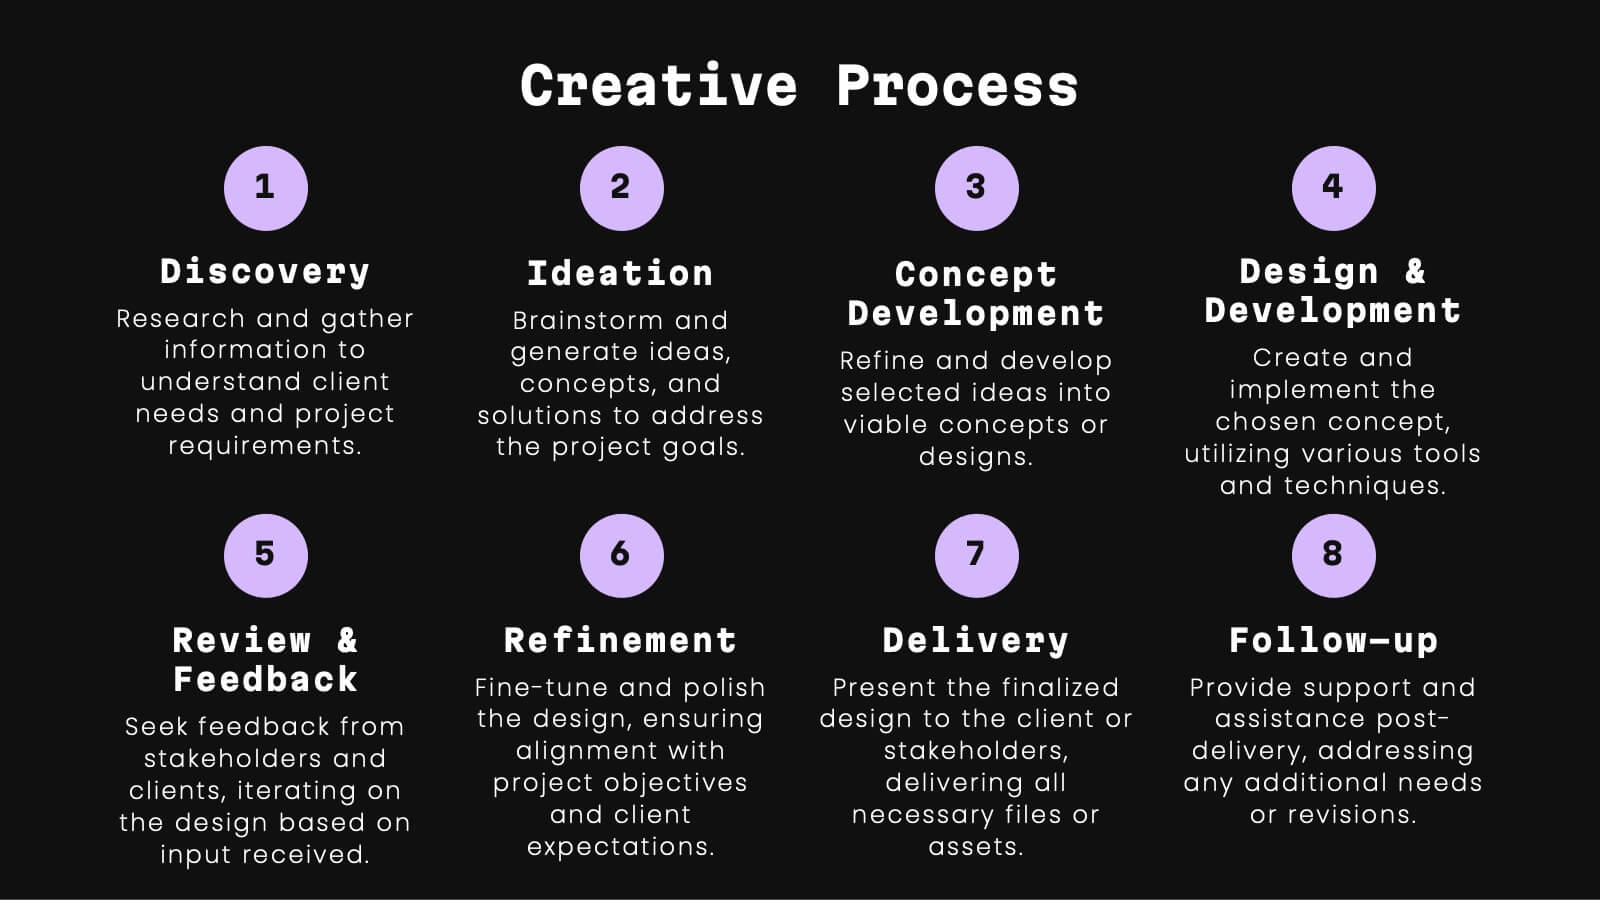
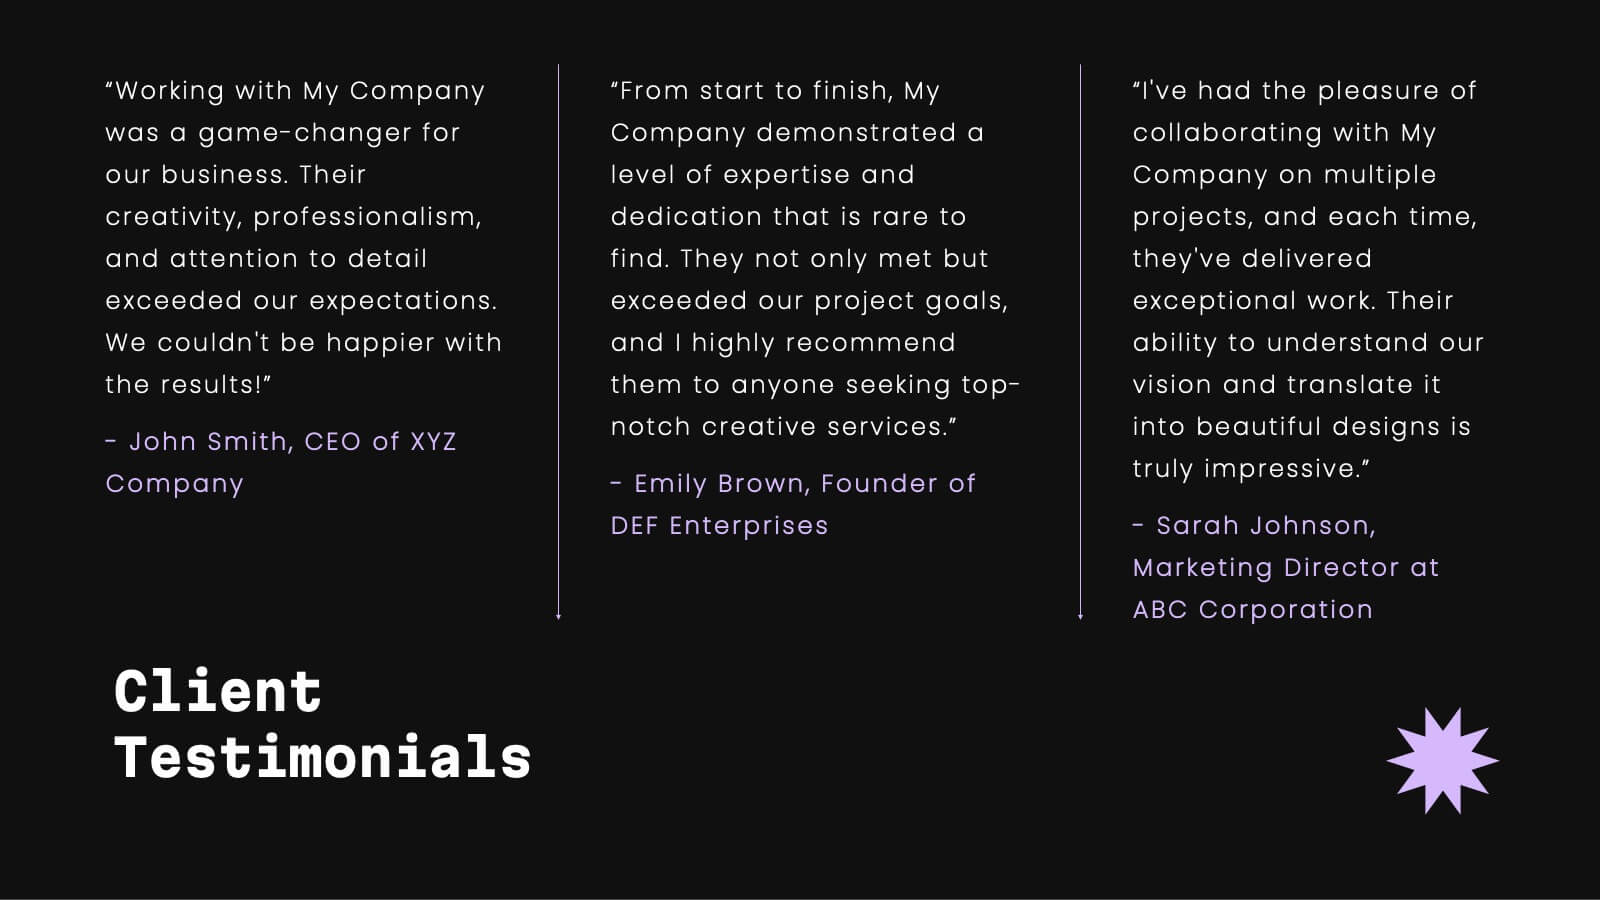
Celeste Professional Portfolio Showcase Presentation
Impress with style using this sophisticated portfolio presentation template. Perfect for showcasing featured projects, creative processes, and client testimonials, this template enhances the visual appeal of your work. Its modern, dark-themed design ensures your content stands out, making a lasting impression. Compatible with PowerPoint, Keynote, and Google Slides, it's versatile for any platform.
8 slides
OKR Strategy Tracker Presentation
Bring your goals to life with a dynamic, structured layout that tracks objectives, measures results, and keeps teams aligned from start to finish. Ideal for strategic planning, quarterly reviews, or business updates, this presentation makes performance tracking effortless. Compatible with PowerPoint, Keynote, and Google Slides for full customization.


3 slides
Customers Loyalty Program Strategy Presentation
Turn customer rewards into a story worth sharing with this modern, visually engaging layout. Ideal for showcasing loyalty program concepts, benefits, and engagement strategies, it helps businesses highlight how they retain and reward loyal clients. Fully customizable and compatible with PowerPoint, Keynote, and Google Slides for effortless presentation design.


6 slides
User Empathy Map Infographic
An Empathy Map is a visual tool used in design thinking and customer-centric approaches to understand the needs, thoughts, feelings, and behaviors of a specific target user or customer. This infographic template is a tool used in user-centered design and product development to better understand and empathize with the needs, thoughts, emotions, and experiences of the target users. It helps teams gain deeper insights into the users' perspectives and develop more user-focused solutions. The infographic consists of four quadrants, each representing different aspects of the user's experience. Compatible with Powerpoint, Keynote, and Google Slides.


23 slides
Glimmer Sales Pitch Deck Presentation
Get ready to wow investors with this dynamic pitch deck! Perfect for startups and entrepreneurs, it covers company overview, market opportunity, revenue models, and more. Designed to highlight your business potential and secure funding. Compatible with PowerPoint, Keynote, and Google Slides, it’s your ultimate tool for impactful presentations.


26 slides
Business Research and Development Presentation
Business Research and Development refers to the process of investigating new ideas and methods with the goal of developing new services or processes that can help a company stay competitive in the market. This template is a tool that organizations can use to communicate their research findings and new developments. You can include information on market research, product development, and other aspects of your organization's research and development efforts. Compatible with PowerPoint, Keynote, and Google Slides. It features customizable layouts, charts, and graphs, as well as icons and illustrations that can be modified to fit your brand and message.


6 slides
Letter Recognition and Phonics Training Presentation
Make early learning visual and interactive with this clean, A-to-F phonics layout. Each letter icon is paired with editable text for sound associations, learning milestones, or steps in a language program. Great for educators, speech therapists, or early childhood presentations. Fully editable in PowerPoint, Keynote, and Google Slides.


26 slides
HIIT Workout Pink Presentation
Unleash the energy with our vibrant HIIT gym workout presentation template, a dynamic blend of pink, red, orange, and yellow, designed to bring your fitness regime to life. This energetic palette is perfect for gym owners, fitness influencers, and personal trainers aiming to showcase the high-intensity intervals that promise fast results. The template offers various graphics, icons, and image placeholders that add a visual punch to your information. Dive into creating an engaging, motivational fitness journey that highlights the benefits, routines, and transformative power of HIIT workouts, ensuring your audience is pumped and ready to go!


8 slides
Health and Safety Training
Create impactful safety briefings with this visual slide designed around a caution-sign layout. Perfect for outlining training modules, compliance steps, or workplace hazard procedures, it presents four key points using icons and color-coded elements. Fully customizable in PowerPoint, Keynote, and Google Slides.


21 slides
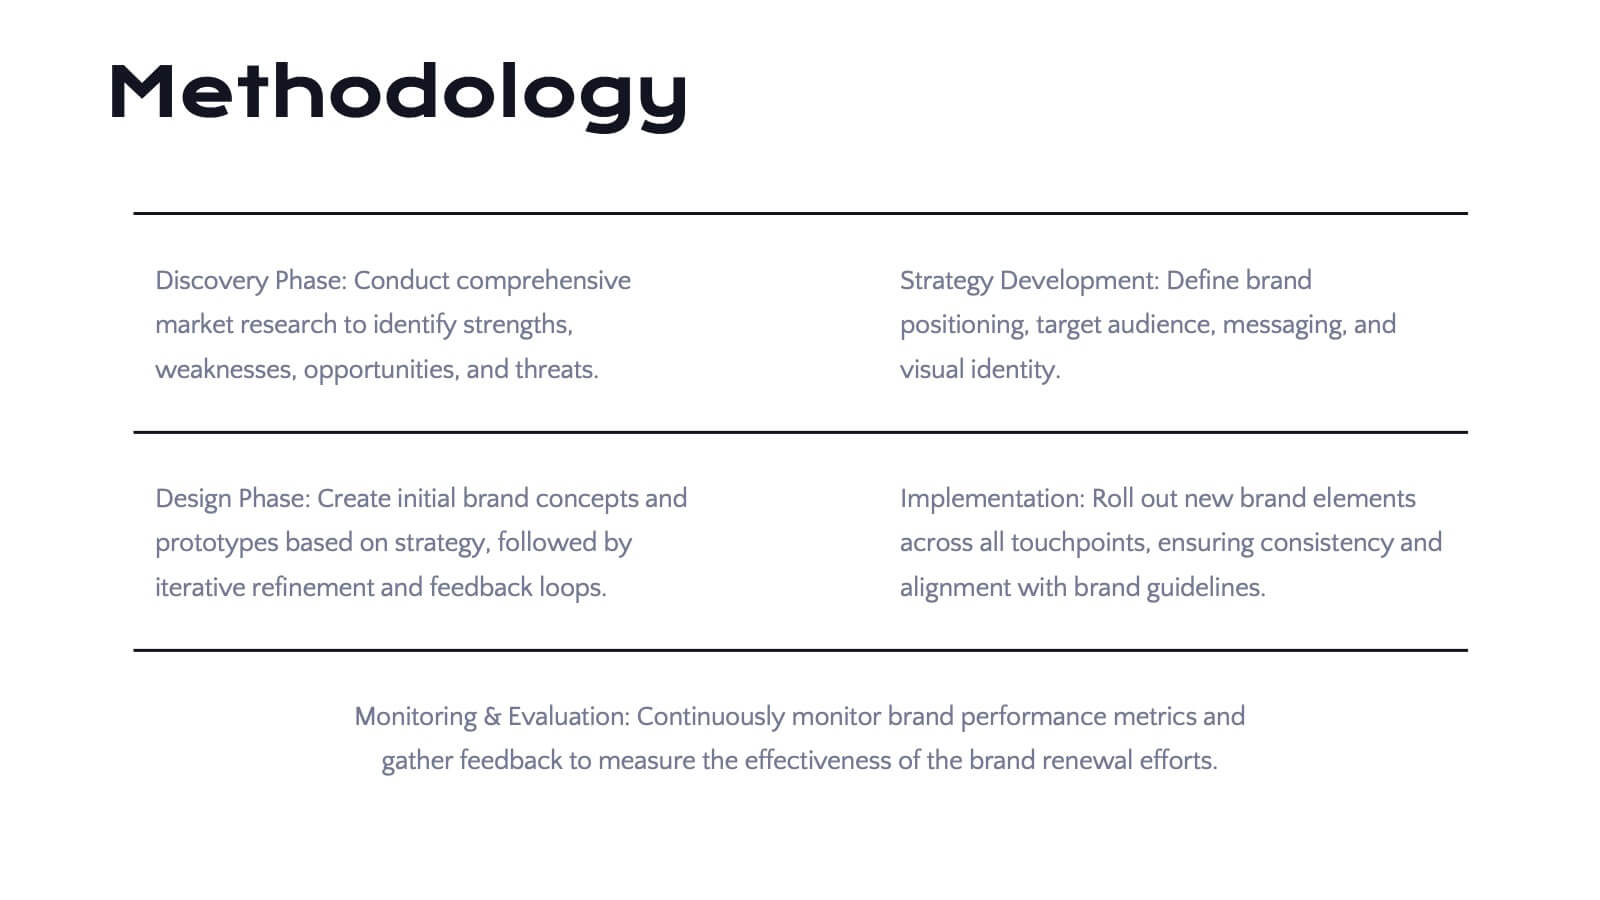
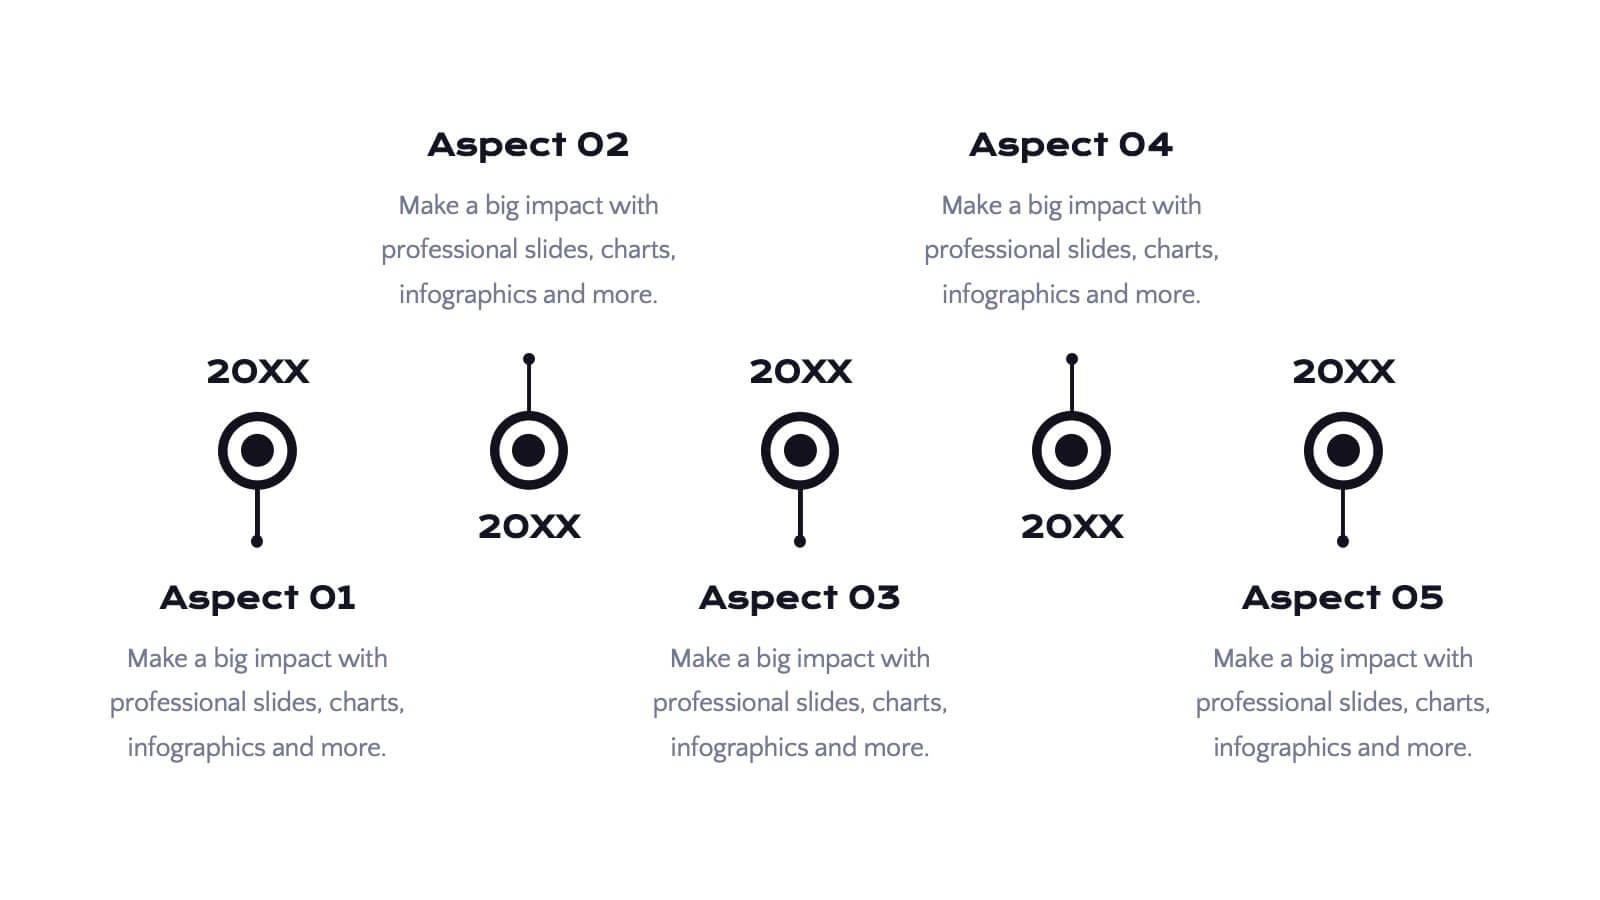
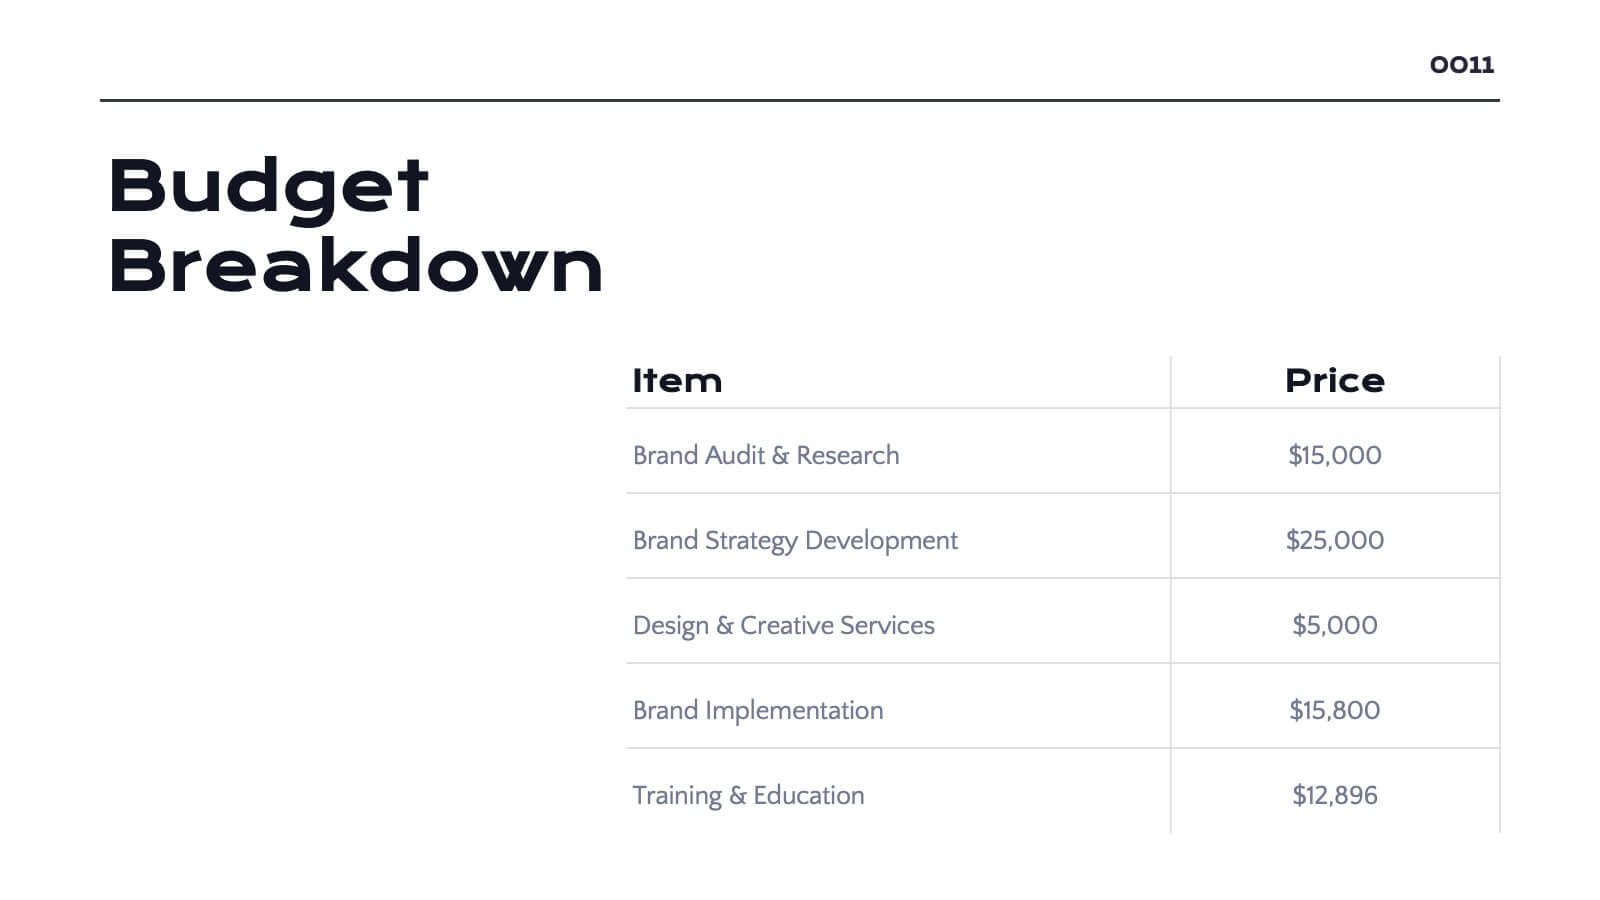
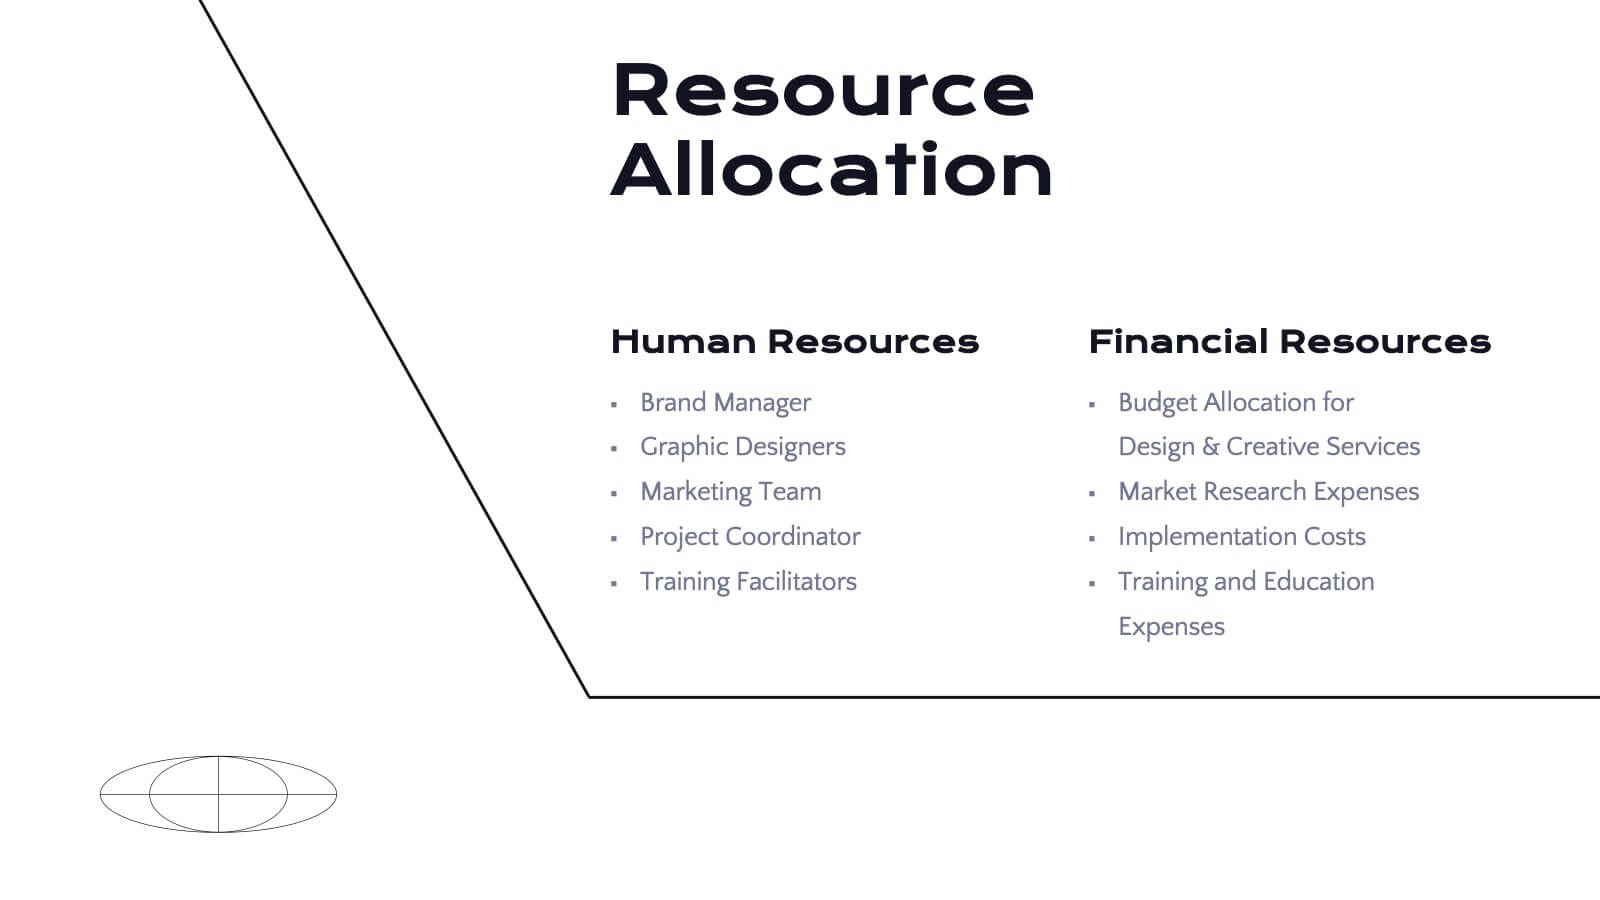
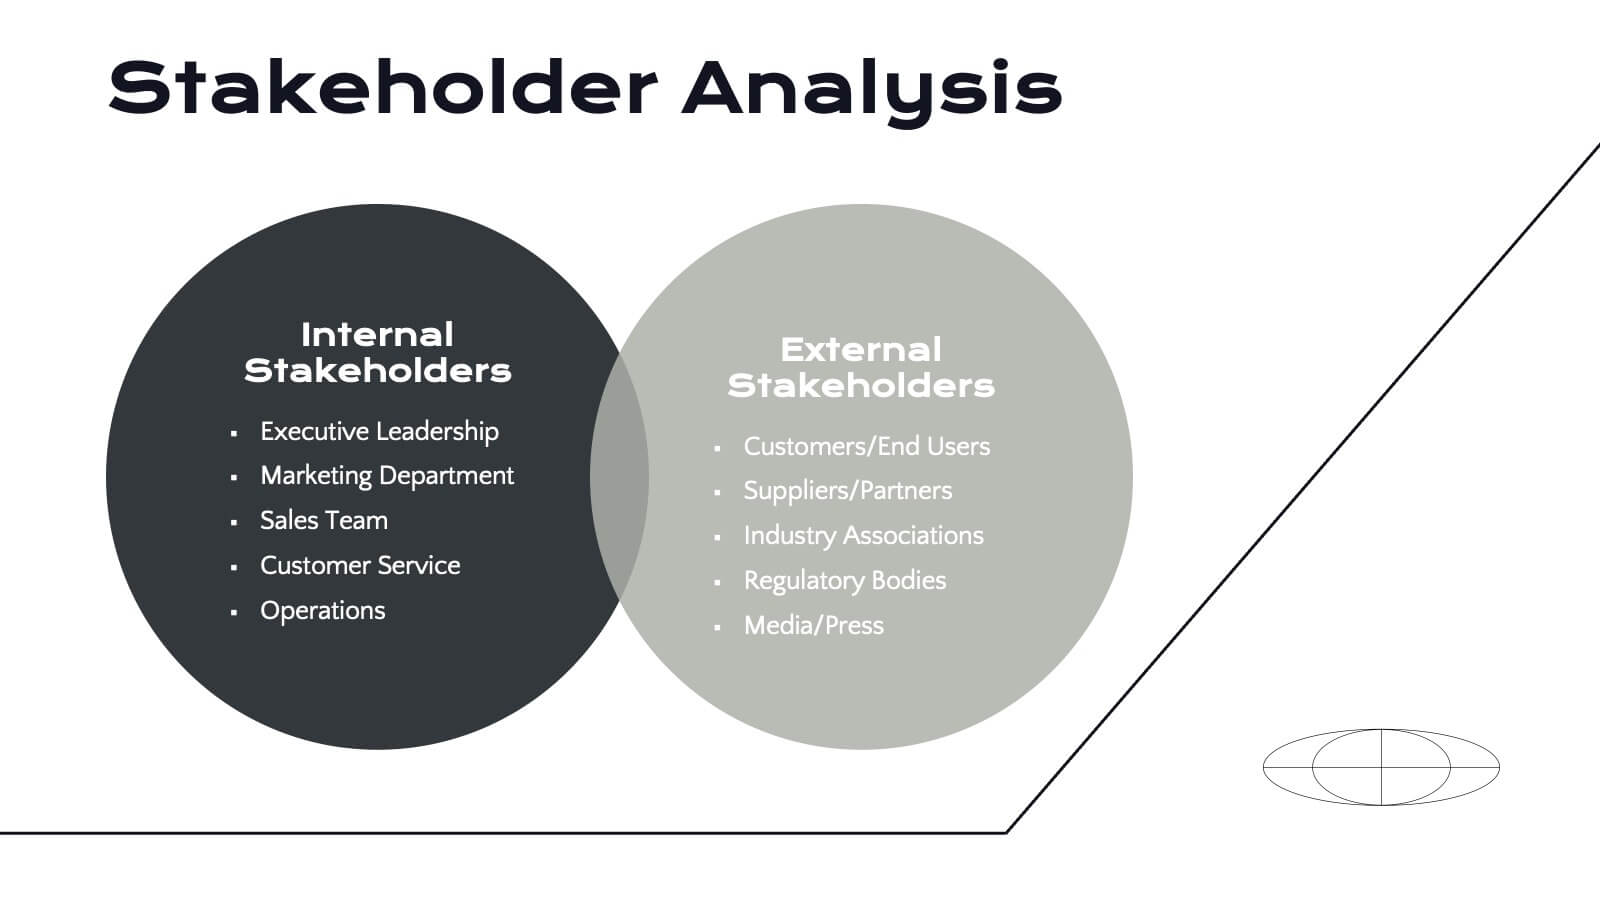
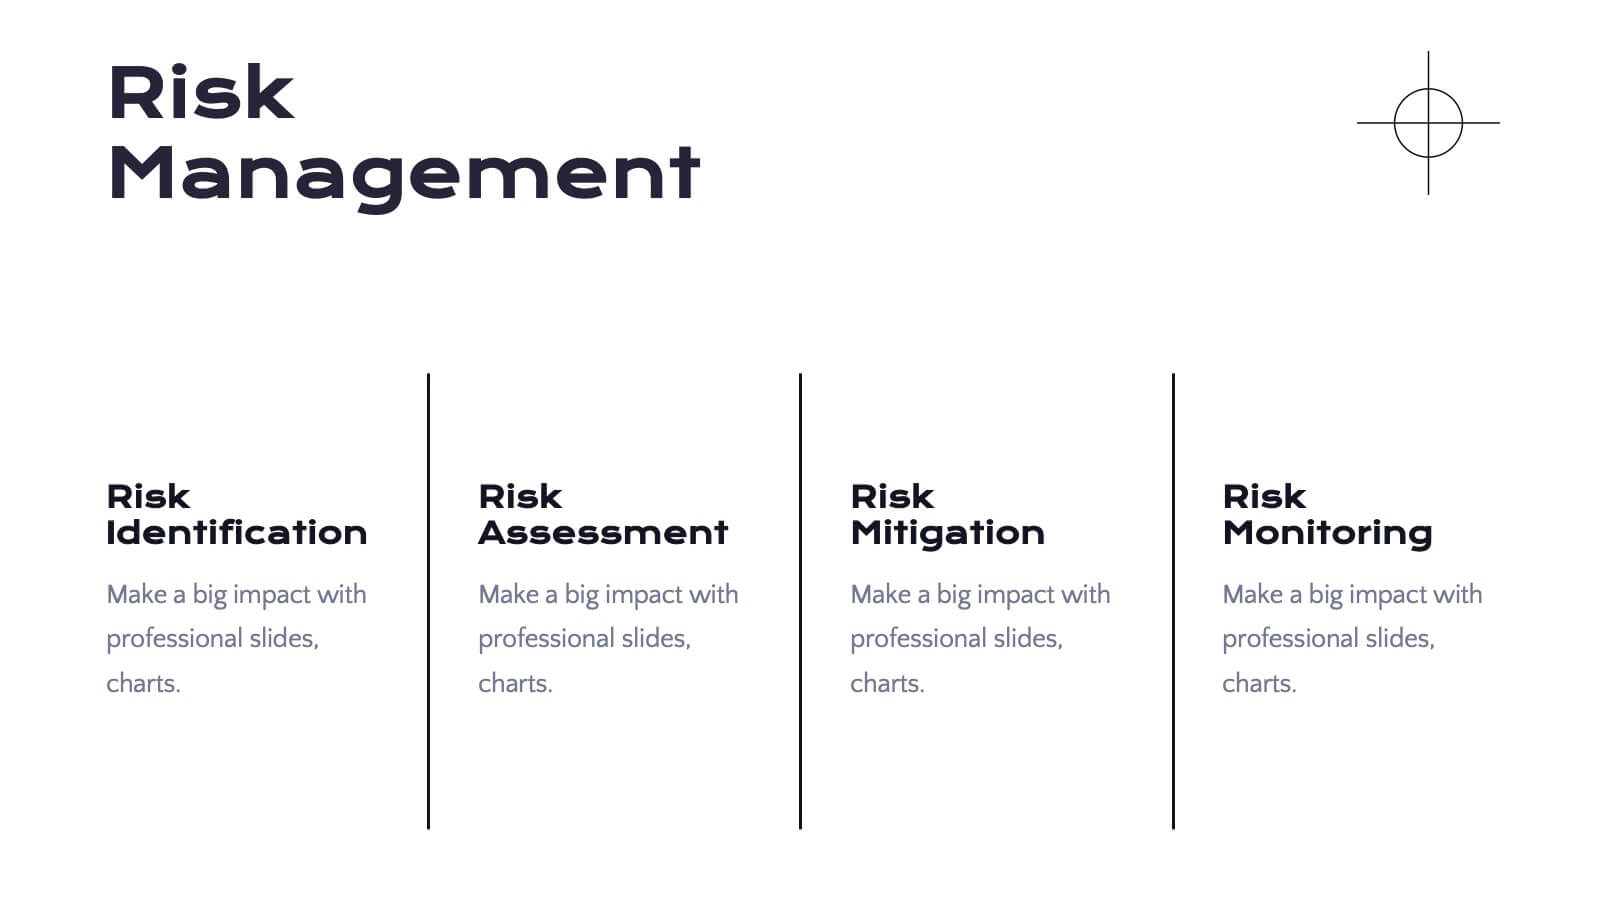
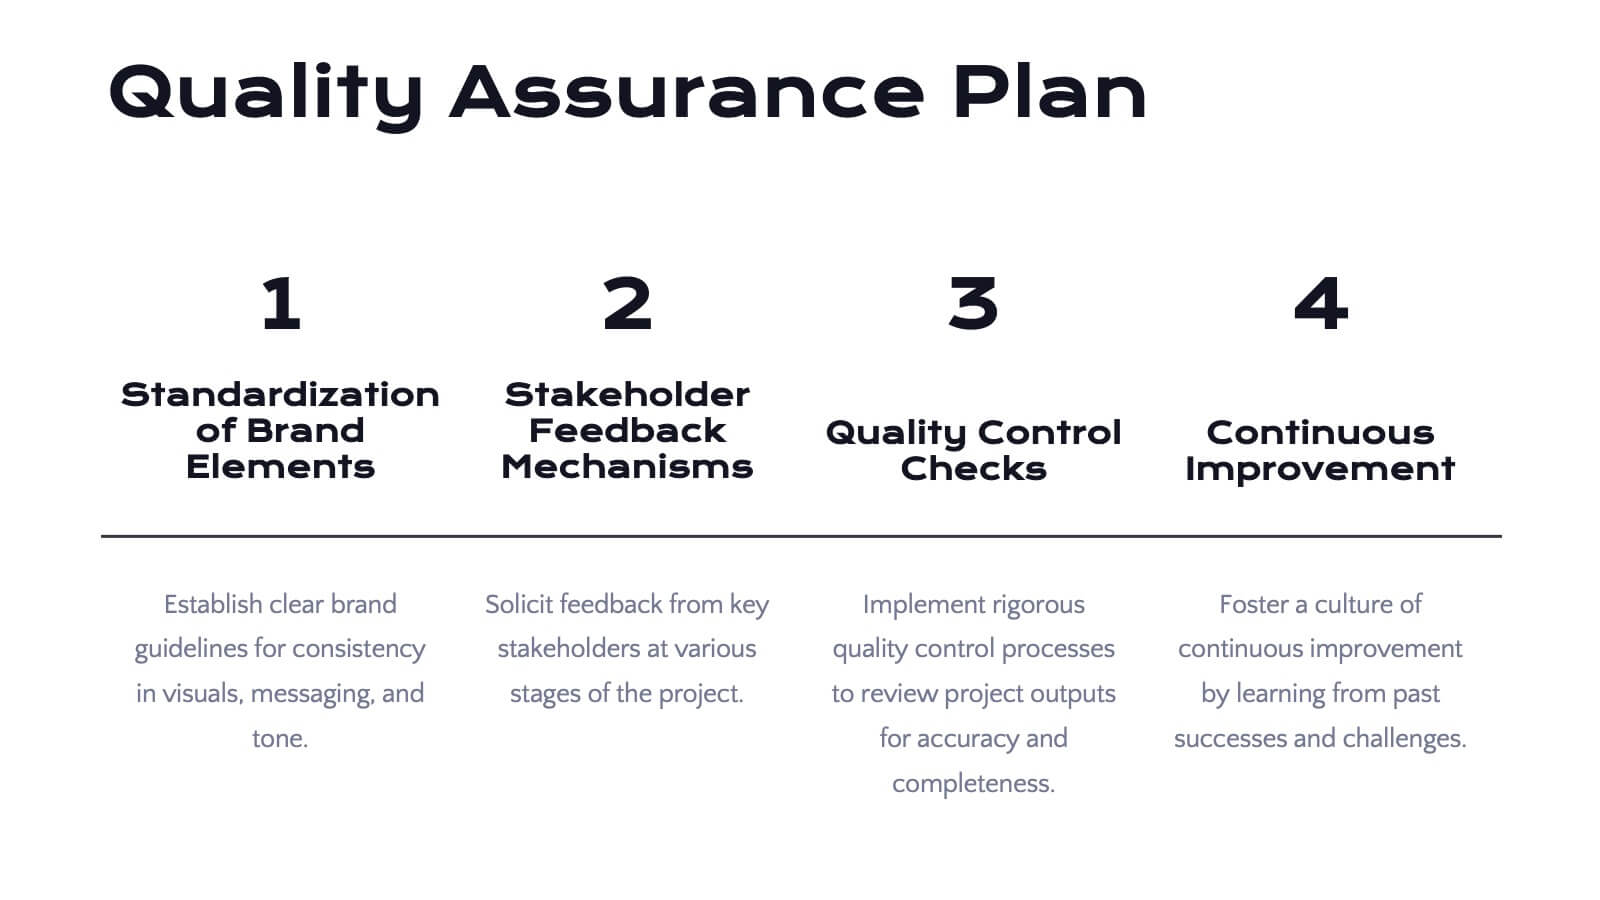
Radiance Detailed Project Execution Plan Presentation
Elevate your project execution presentations with this sleek template, covering everything from objectives to timelines and budget breakdowns. It's perfect for aligning your team and stakeholders. Compatible with PowerPoint, Keynote, and Google Slides, it ensures professionalism and clarity in showcasing your project plans.


6 slides
Regional Finance Infographic
Regional finance plays a vital role in fostering economic growth, attracting investments, and improving the overall well-being of communities within a specific region. This infographic template focuses on financial trends, insights, and data related to specific regions or countries. It is designed to help businesses, organizations, or financial professionals analyze and understand the financial landscape of a particular region. The data-driven content in this template is suitable for businesses or individuals seeking insights to make informed decisions regarding investments, market entry, or financial planning in a specific region.


7 slides
Annual Marketing Report Infographic
Elevate your corporate narrative with our meticulously curated Annual Report Infographic. Cloaked in the purity of white and varying professional blue tones, our template mirrors the precision and credibility essential for annual reviews. Enhanced with succinct infographics, coherent icons, and pertinent image placeholders, it weaves a year's data into a compelling visual story. Flawlessly adapted for Powerpoint, Keynote, or Google Slides. A quintessential instrument for CEOs, financial analysts, stakeholders, or any organization presenting its yearly milestones and future outlook. Reflect, report, and strategize; let every slide be a testament to your organization's journey and ambition.