


Features
- 5 Unique slides
- Fully editable and easy to edit in Microsoft Powerpoint, Keynote and Google Slides
- 16:9 widescreen layout
- Clean and professional designs
- Export to JPG, PDF or send by email


Do you have any questions?
Recommend


6 slides
Business Challenge Identification Presentation
Spotting roadblocks has never looked this good! This infographic presentation template helps you map out key pain points across departments or processes, making it easier to analyze, discuss, and resolve challenges visually. It’s a perfect tool for business strategy teams and consultants. Fully compatible with PowerPoint, Keynote, and Google Slides.


7 slides
Big Data Analytic Infographics
Big Data are the large and complex data sets that are difficult to process and analyze using traditional data processing methods. This template will allow you to visualize key data points and insights in an appealing and easy to digest way. Your information is presented in a clear manner with a variety of graphs, to convey the fundamentals of big data analytics. Customize this infographic with your own data in the bullet points and graphics. Quickly edit text and colors for your next presentation. All the slide in this template are fully editable in Powerpoint, Keynote, and Google Slides.


4 slides
Work From Home Bests Practices Presentation
Bring remote work to life with a clean, modern layout that helps teams stay focused, organized, and productive. This presentation highlights key habits, routines, and strategies for working efficiently from home, offering clear visuals that simplify every point. Fully editable and compatible with PowerPoint, Keynote, and Google Slides.


6 slides
Overcoming Market Challenges Strategy Presentation
Tackle industry obstacles with clarity using this dynamic teamwork-themed visual. Featuring illustrated characters passing puzzle pieces along a circular process, this design is perfect for illustrating phased strategies, collaborative efforts, or key milestones. Great for strategic planning or team alignment presentations. Fully editable in PowerPoint, Keynote, and Google Slides.


7 slides
Chart Comparison Infographic Presentation
Chart Comparison is the process of comparing different charts or graphs to identify similarities. It involves analyzing multiple sets of data by visually presenting them in charts. Use this template to show the comparison of various charts and how things look when they are compared. This template will help you create a professional Infographic presentation that highlights the key differences between data sets. Each chart can have it's own color, so you can use any color you want. You can also add text in the chart with your own content, and edit in Powerpoint, Keynote, or Google Slides.


4 slides
Key Pillar Infographic Slide Presentation
Make your ideas stand tall with this modern pillar-themed infographic layout. Perfect for illustrating strategies, business foundations, or organizational principles, it transforms complex data into visually clear, structured visuals. Fully editable and compatible with PowerPoint, Keynote, and Google Slides for professional and easy-to-customize presentations.


4 slides
Property Investment Pitch Deck Presentation
Impress investors with a sleek and confident presentation designed to highlight property opportunities and market growth. This professional layout helps you showcase financial insights, projections, and investment strategies with clarity and style. Fully customizable and compatible with PowerPoint, Keynote, and Google Slides for effortless editing and impactful delivery.


6 slides
Money Fee Infographic
Money is a universally accepted medium of exchange, typically in the form of coins, or digital currency, that is used to facilitate transactions and the exchange of goods and services. This infographic template visually presents types of fees and charges associated with financial transactions and services. This template will help your viewers understand the costs involved in financial activities and empower them to make informed decisions. This infographic can be used by financial institutions, educational platforms, and consumer advocacy organizations to educate individuals about the different fees they might encounter while handling their finances.


4 slides
Market Research Survey Insights Presentation
Showcase key data from your latest research with this bold, megaphone-themed survey slide. Ideal for presenting percentages and key findings side-by-side, this layout draws attention to market trends, consumer feedback, or audience segmentation. Fully editable in PowerPoint, Keynote, and Google Slides.


5 slides
Key Data and Performance Numbers Slide
Visualize data with impact using the Key Data and Performance Numbers Slide Presentation. This infographic-style layout features a central pie chart and five bold percentage callouts, making it ideal for presenting insights, progress, or KPIs. Easily customize the colors, titles, and text in PowerPoint, Keynote, or Google Slides.


4 slides
Resource Mapping in African Regions Presentation
Visualize regional distribution clearly with the Resource Mapping in African Regions Presentation. This engaging slide highlights key areas using color-coded map segments, helping you present data like resource allocation, project focus, or regional analysis with clarity. Ideal for NGOs, researchers, or government briefings. Compatible with PowerPoint, Keynote, Canva, and Google Slides.


5 slides
Operational Planning in 5 Key Steps Presentation
Present your operational roadmap with this dynamic 5-step arrow diagram. Each line represents a strategic input streamlined toward a unified goal. Ideal for workflows, business processes, or implementation plans. Fully editable in PowerPoint, Keynote, and Google Slides—perfect for team planning, operations meetings, and project execution strategies.


3 slides
Stock Market Performance Overview Presentation
Showcase financial growth like a pro with this clean, data-driven layout designed to visualize performance, market activity, and business progress over time. Ideal for professionals presenting key financial trends, metrics, or strategies. Fully compatible with PowerPoint, Keynote, and Google Slides for easy customization and professional presentation results.


6 slides
Home Security Infographics
Enhance your home security awareness with our Home Security infographic template. This template is fully compatible with popular presentation software like PowerPoint, Keynote, and Google Slides, allowing you to easily customize it to illustrate and communicate various aspects of home security measures and best practices. The Home Security infographic template offers a visually engaging platform to outline home security strategies, including alarm systems, surveillance, access control, and safety tips. Whether you're a homeowner, security professional, or simply interested in safeguarding your property and loved ones, this template provides a user-friendly canvas to create informative presentations and educational materials. Optimize your home security with this SEO-optimized Home Security infographic template, thoughtfully designed for clarity and ease of use. Customize it to showcase security device options, safety checklists, emergency procedures, and the importance of a secure home environment, ensuring that your audience gains valuable insights into this critical aspect of personal safety. Start crafting your personalized infographic today to bolster your home security knowledge and practices.


6 slides
Conversion Funnel Stages Overview Presentation
Visualize user journeys with clarity using the Conversion Funnel Stages Overview Presentation. This funnel diagram template breaks down key conversion phases—from awareness to decision—into distinct, color-coded stages. Ideal for marketing reports, sales strategies, or product demos. Fully editable in PowerPoint, Google Slides, and Canva.


6 slides
Core Focus Areas in Strategic Wheel Model Presentation
Showcase your business's key focus areas using this five-part strategic wheel layout. Each segment is paired with corresponding labels and editable text fields for streamlined messaging. Ideal for strategy, operations, or team planning. Fully customizable and compatible with PowerPoint, Keynote, and Google Slides to suit any brand style.


21 slides
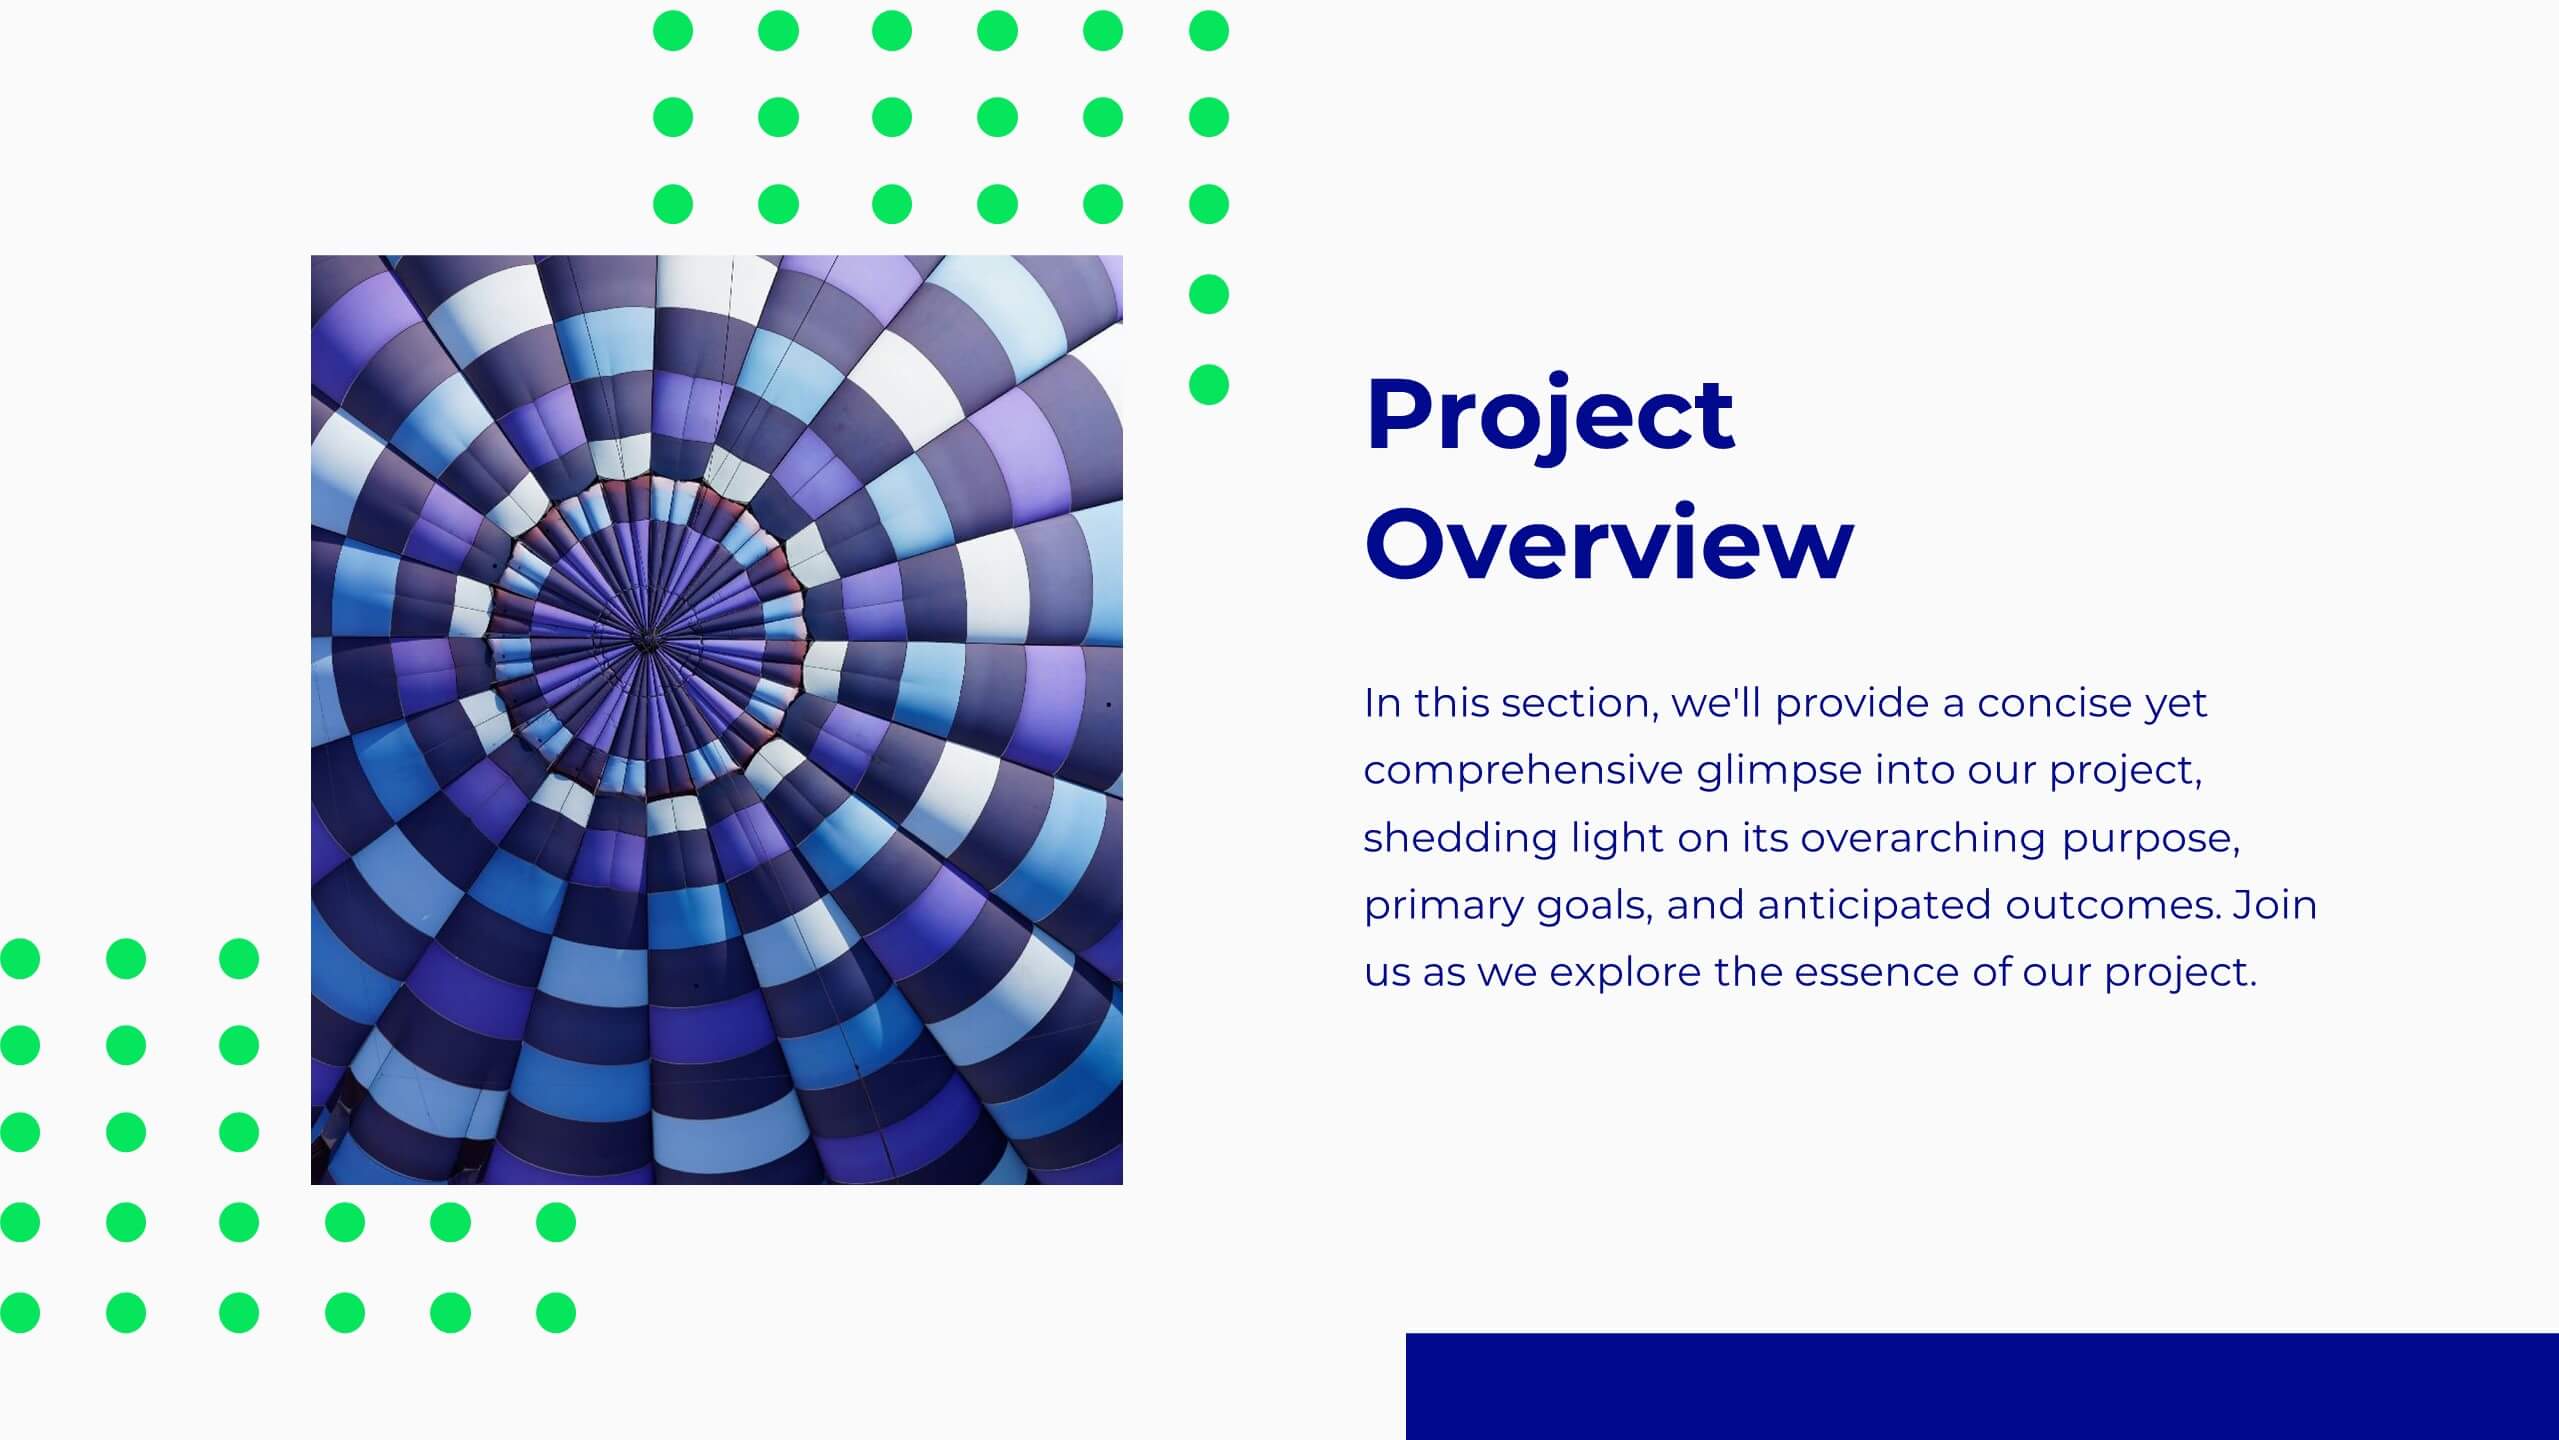
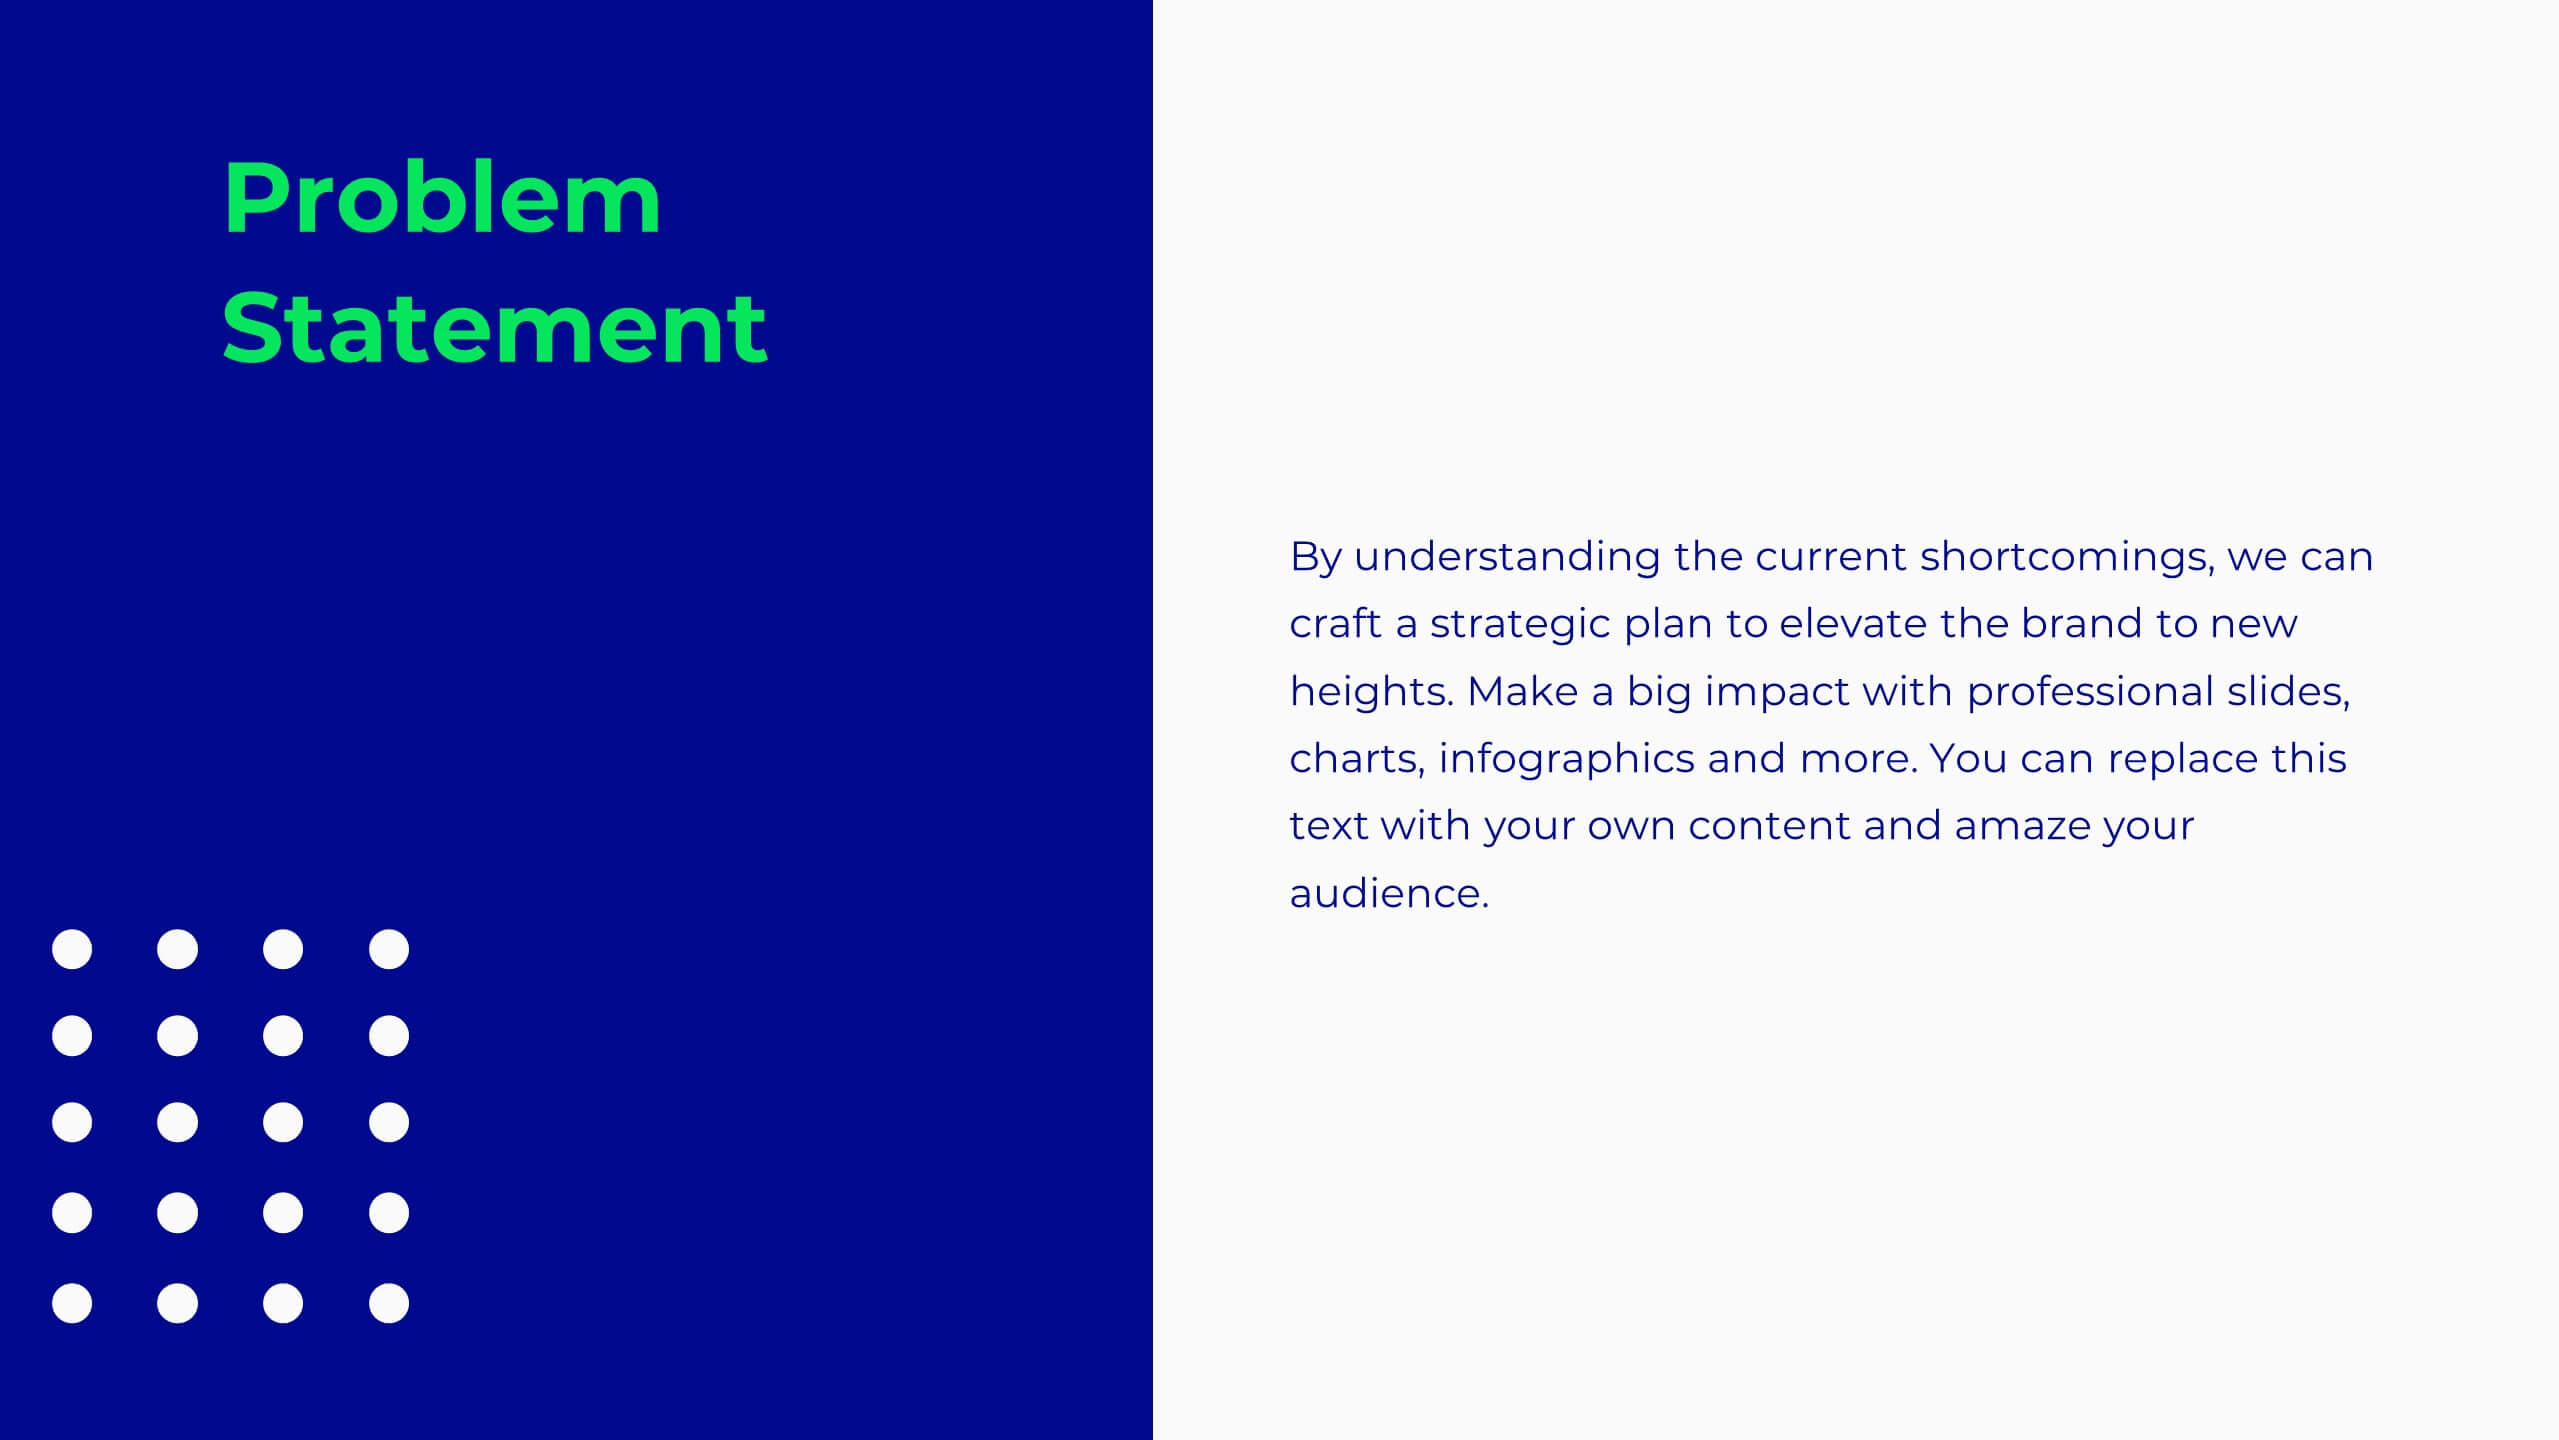
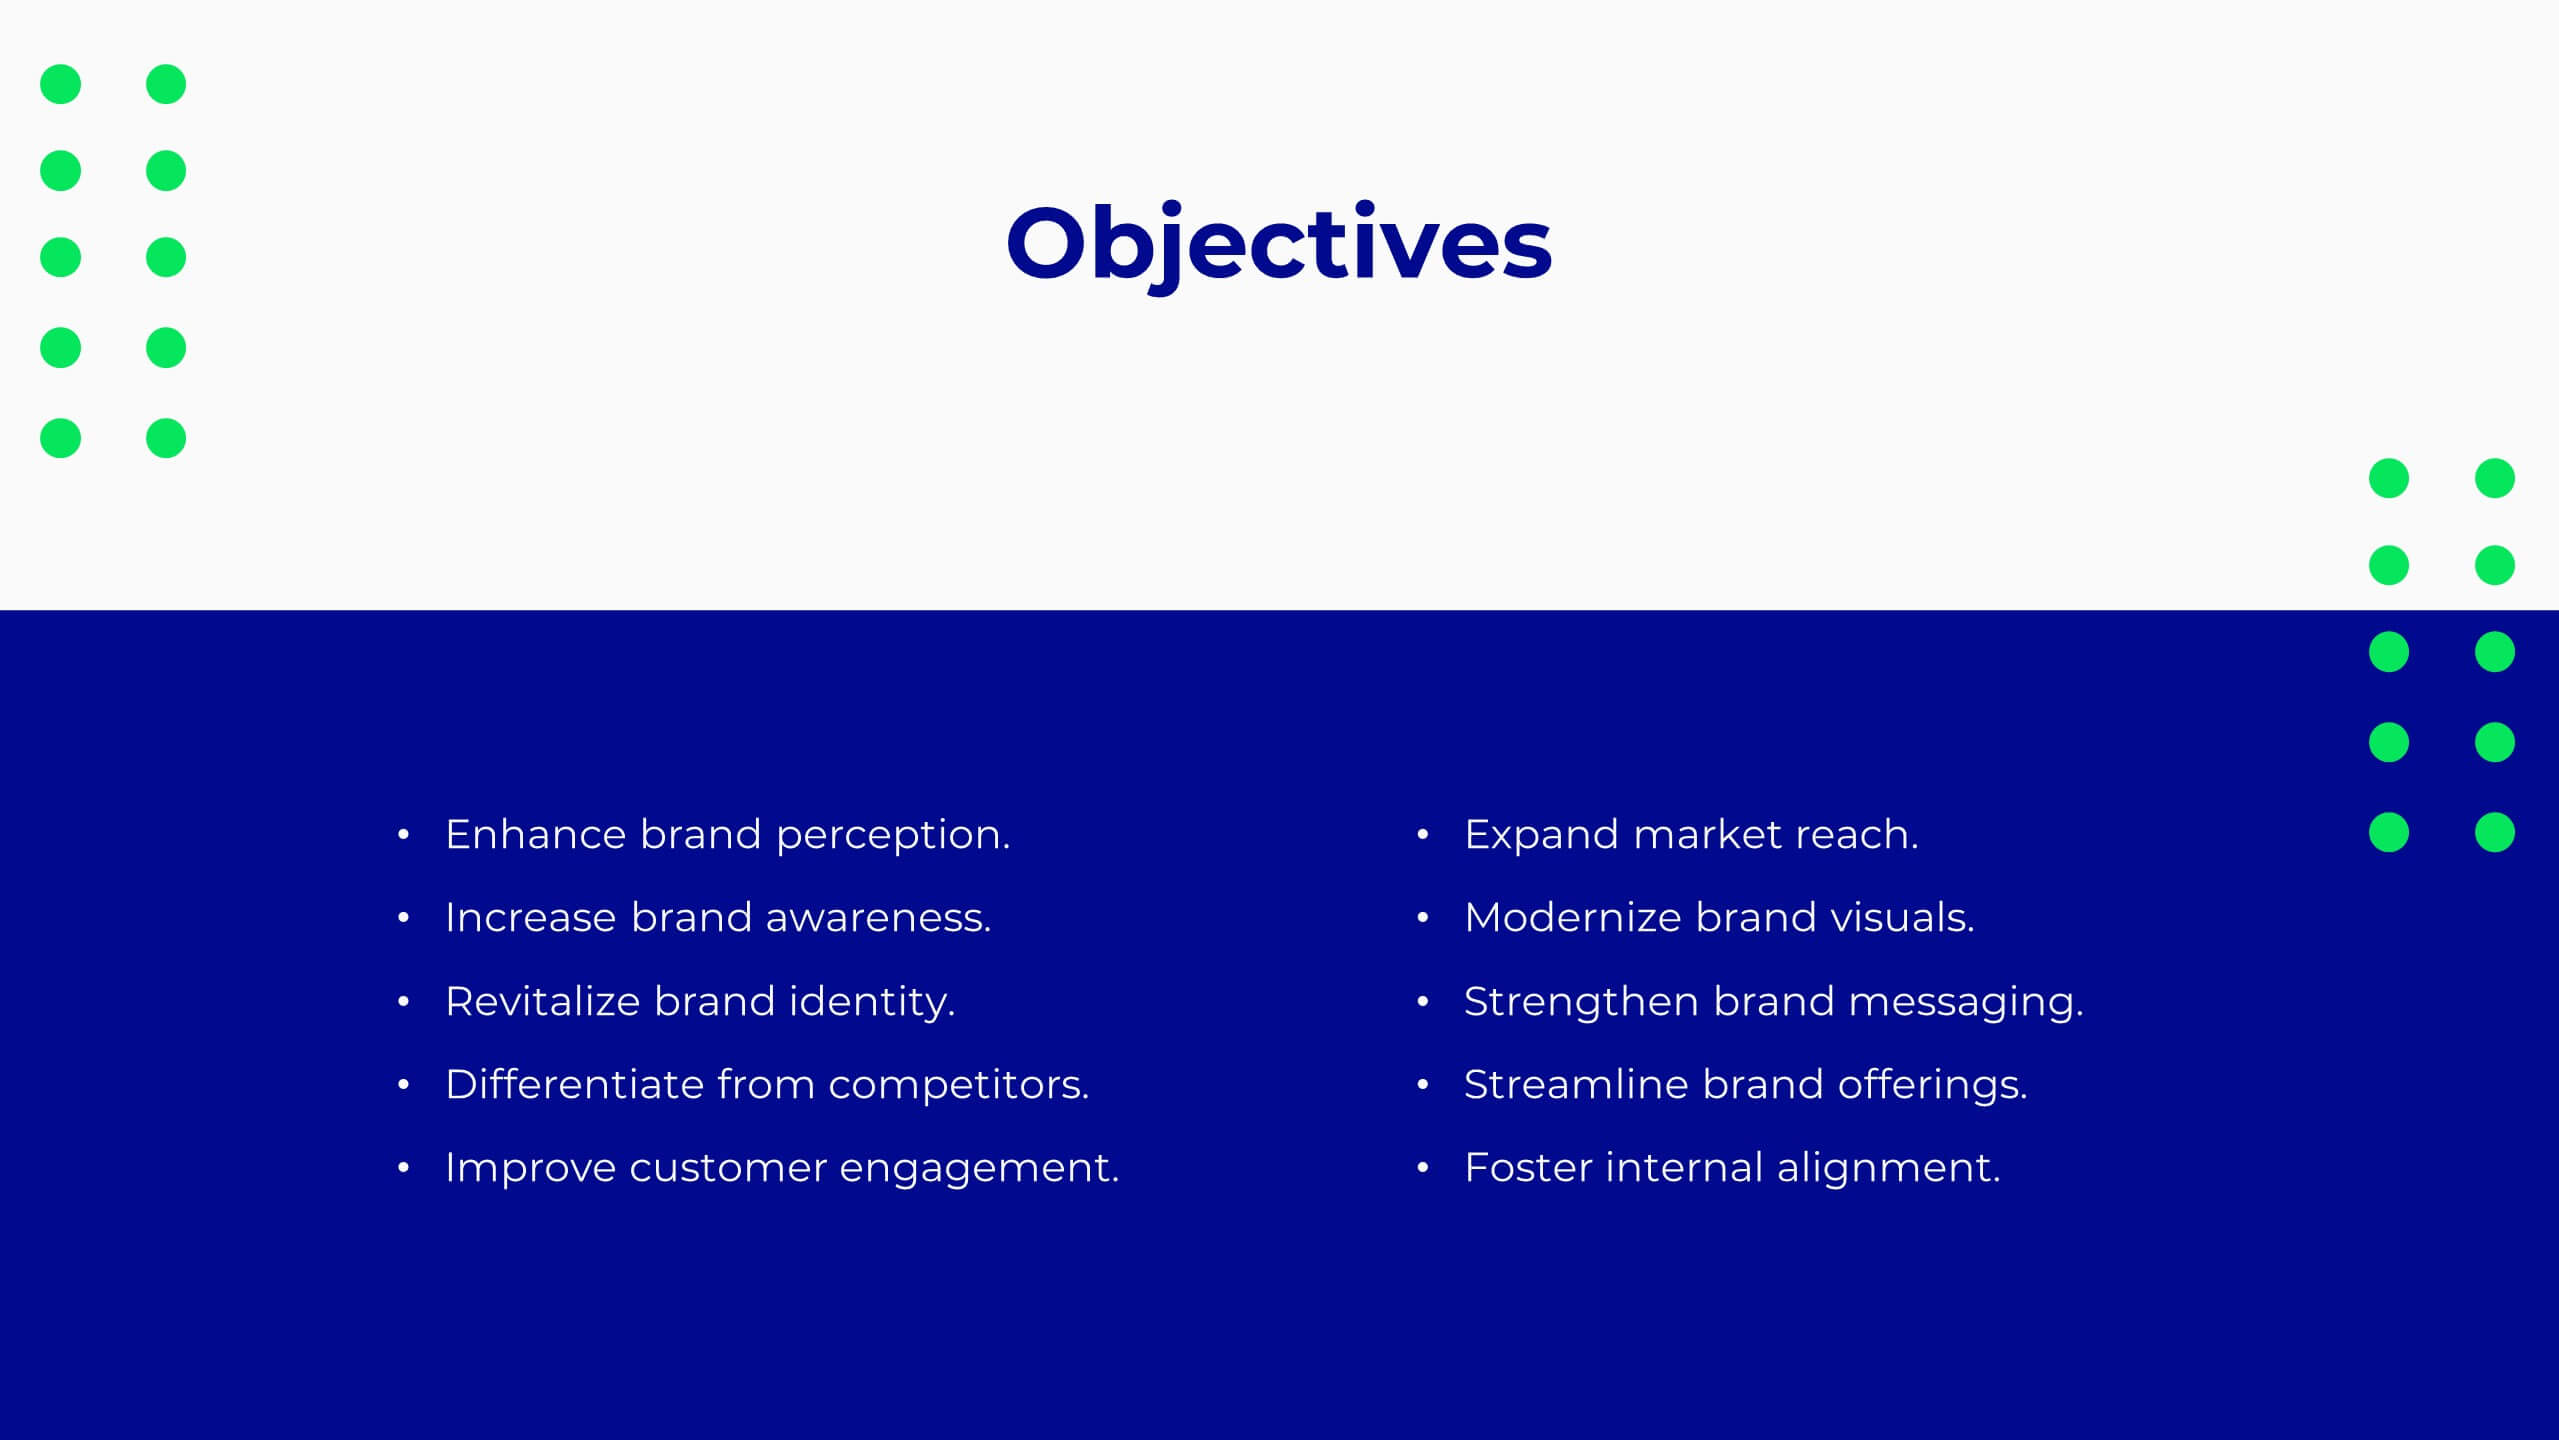
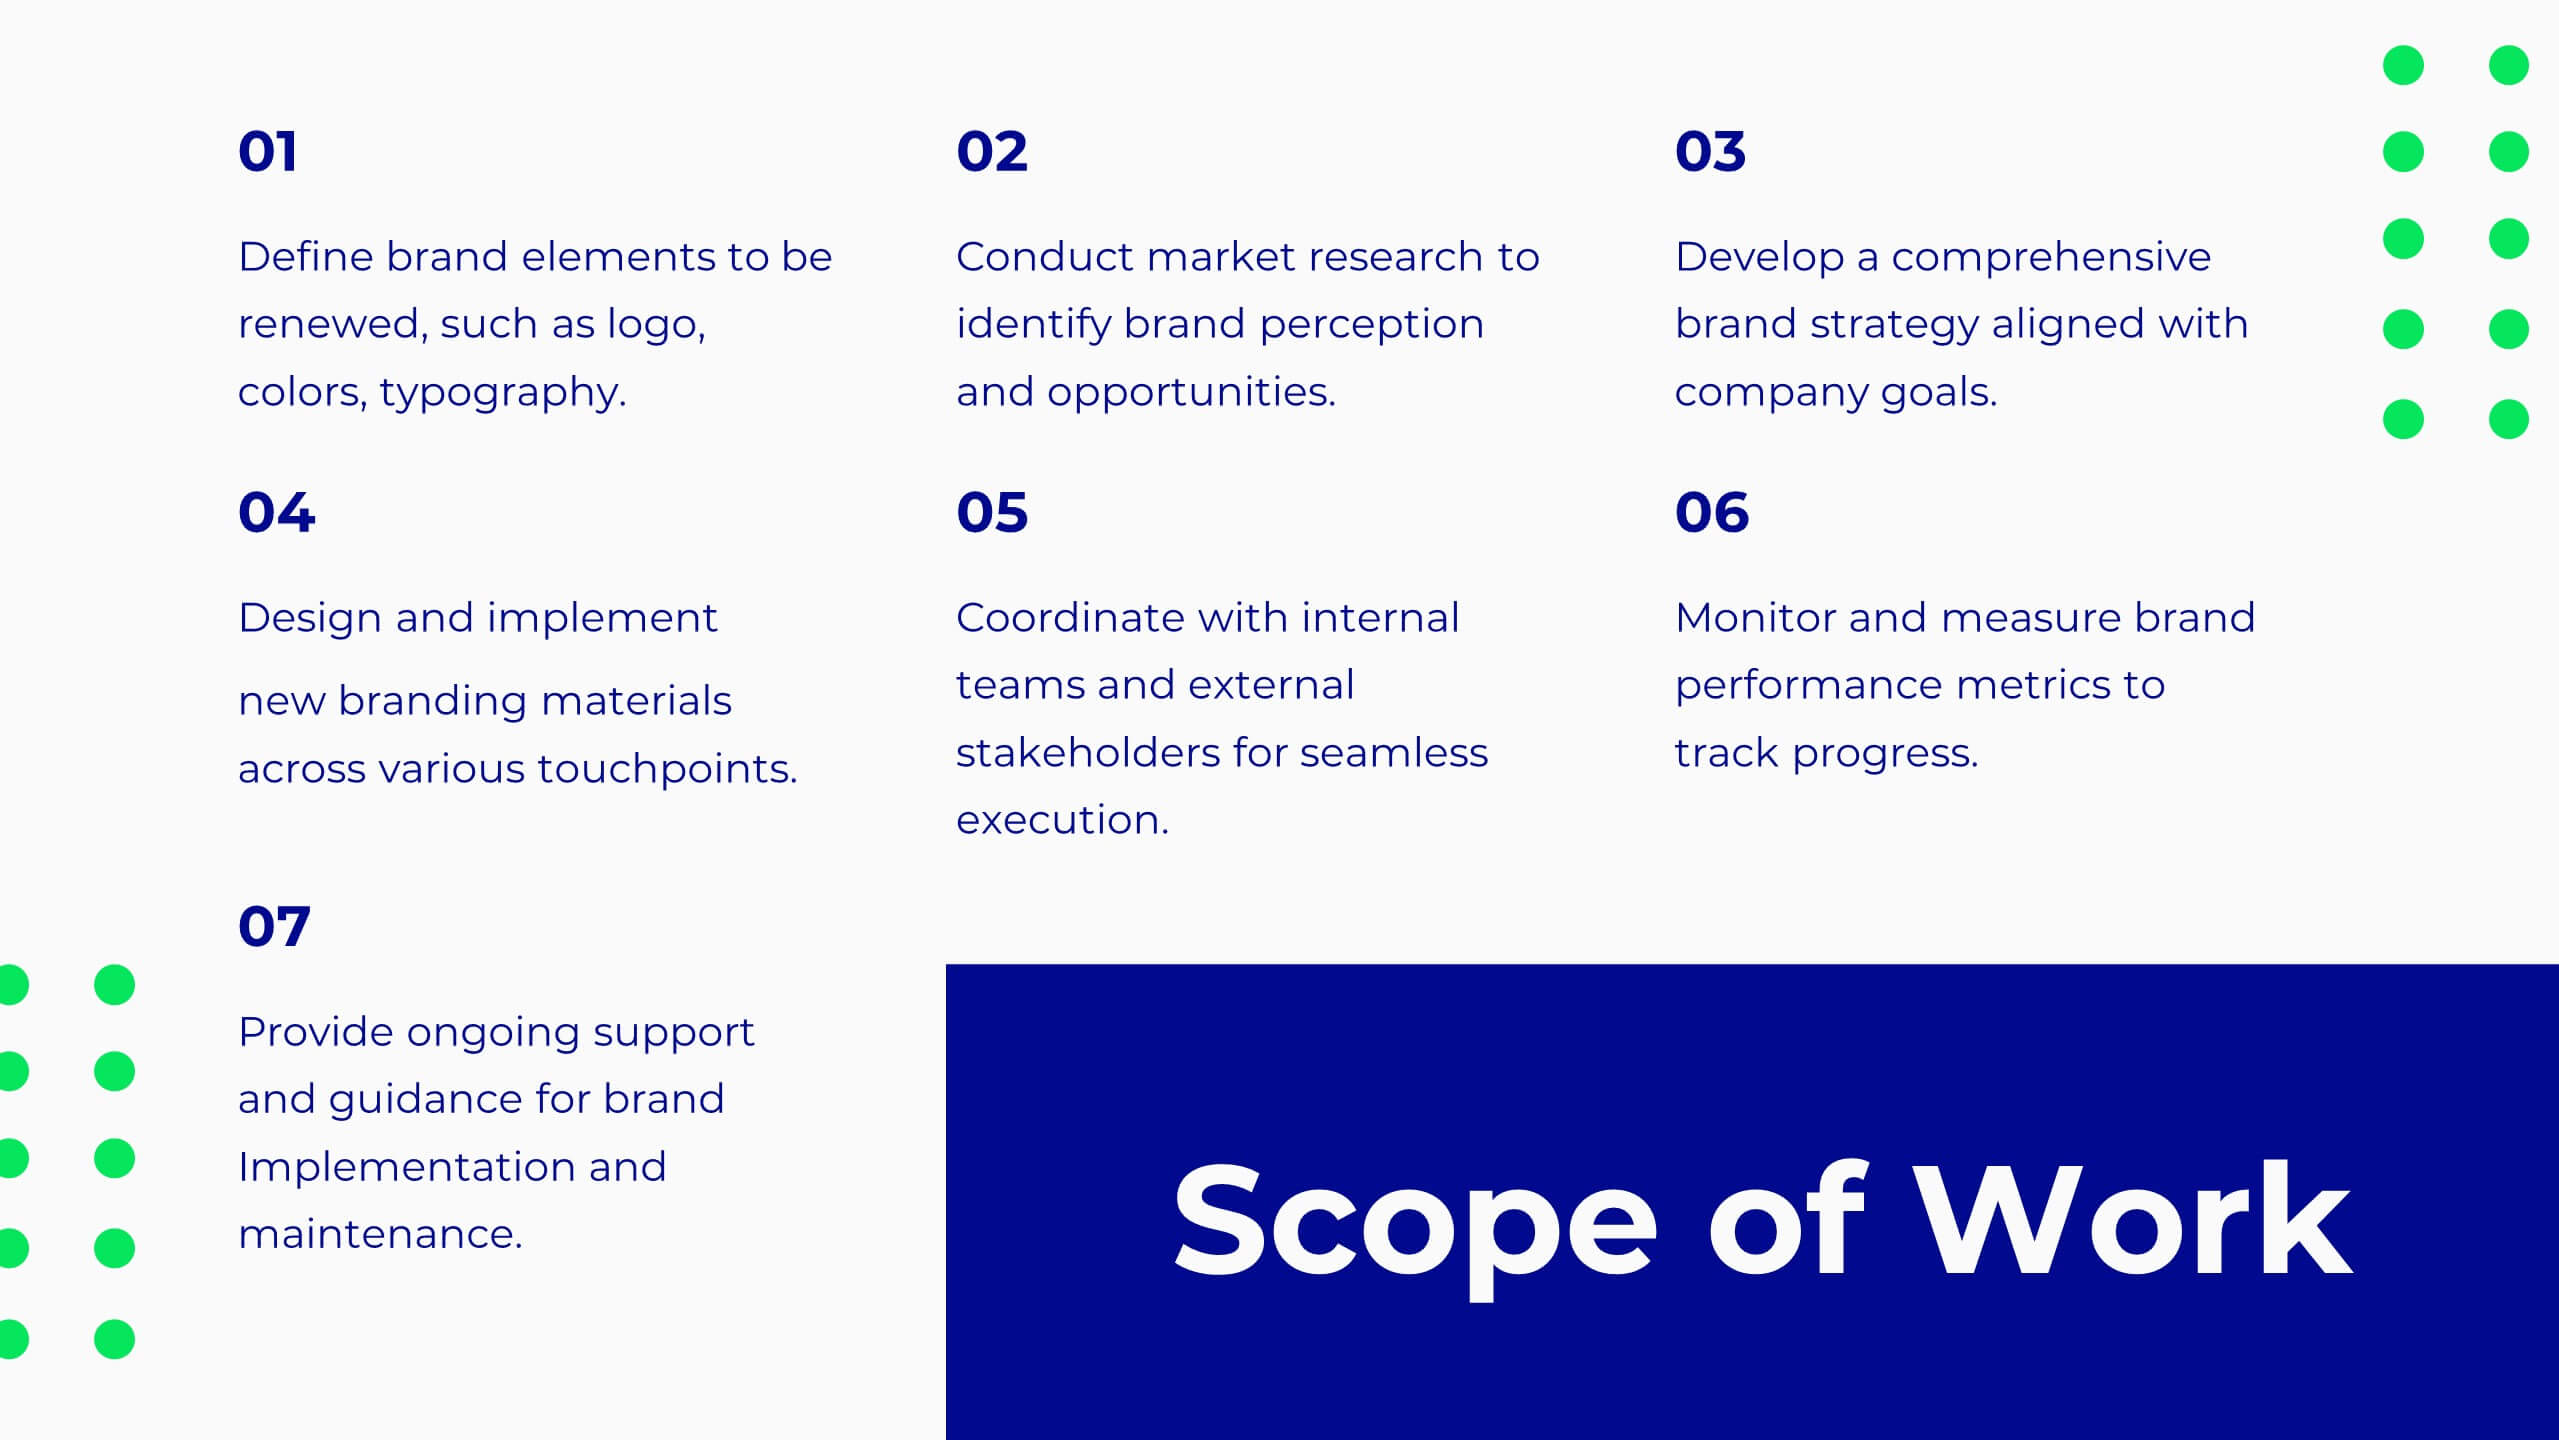
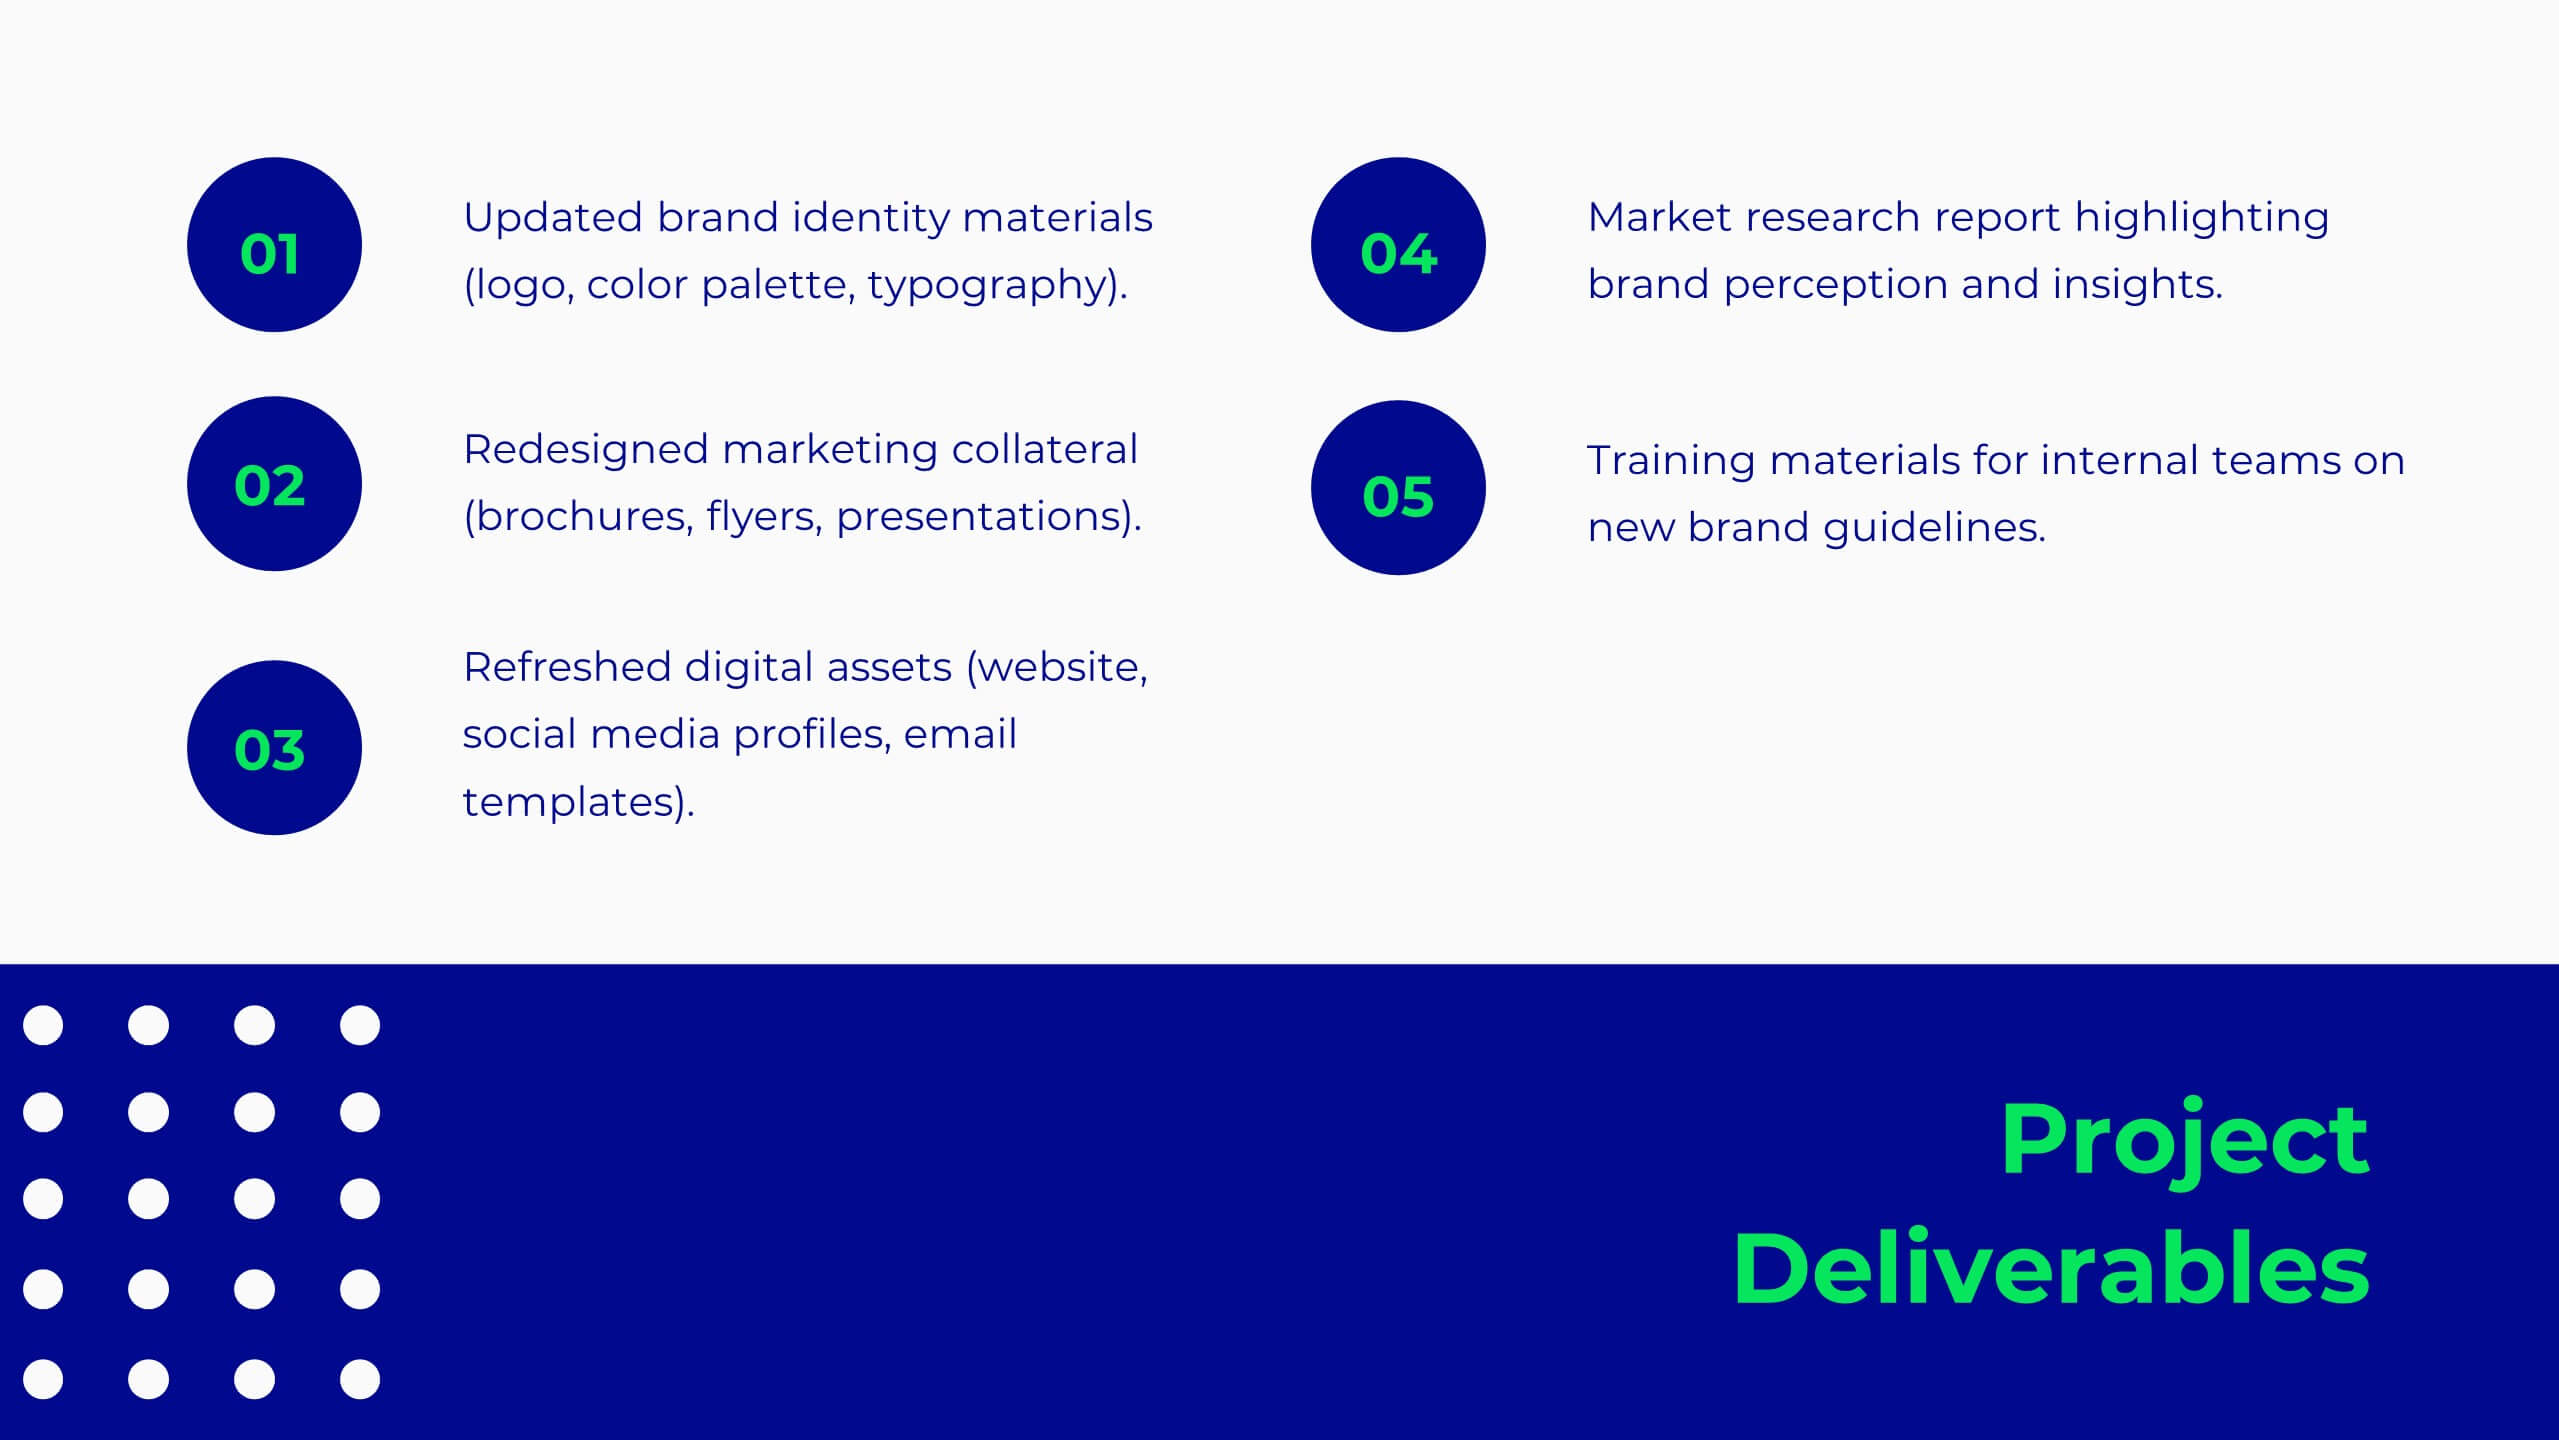
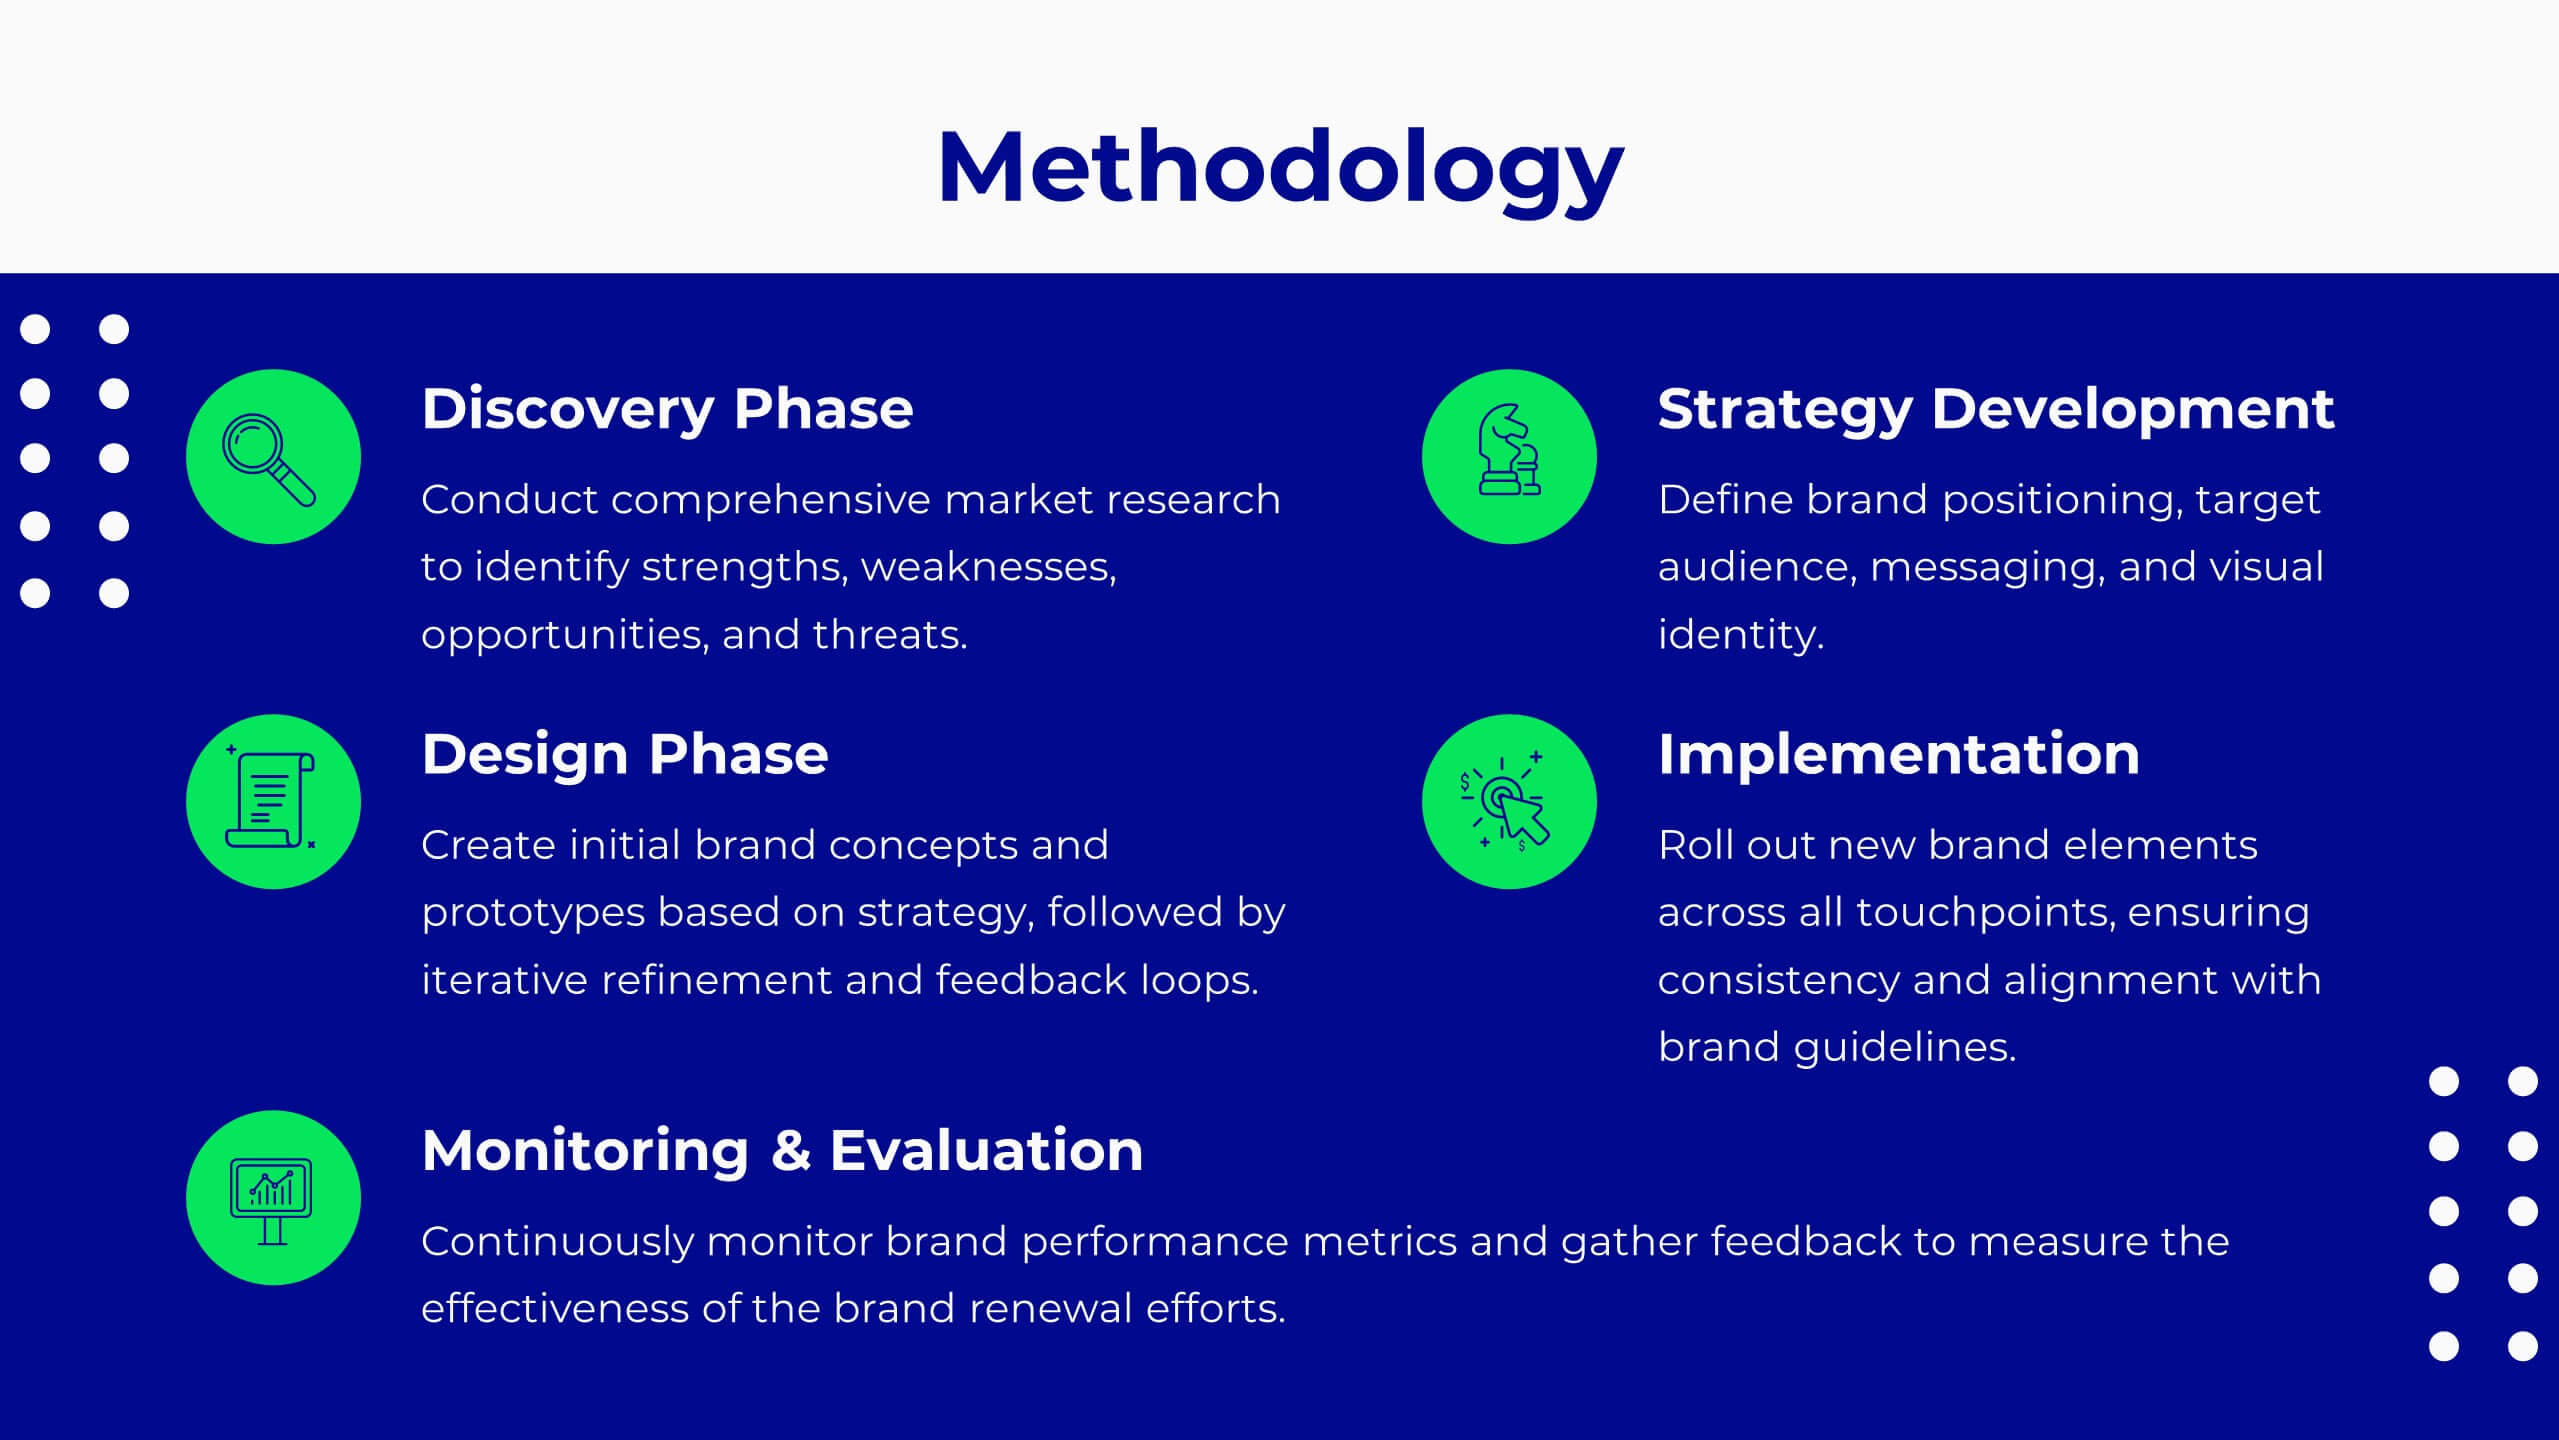
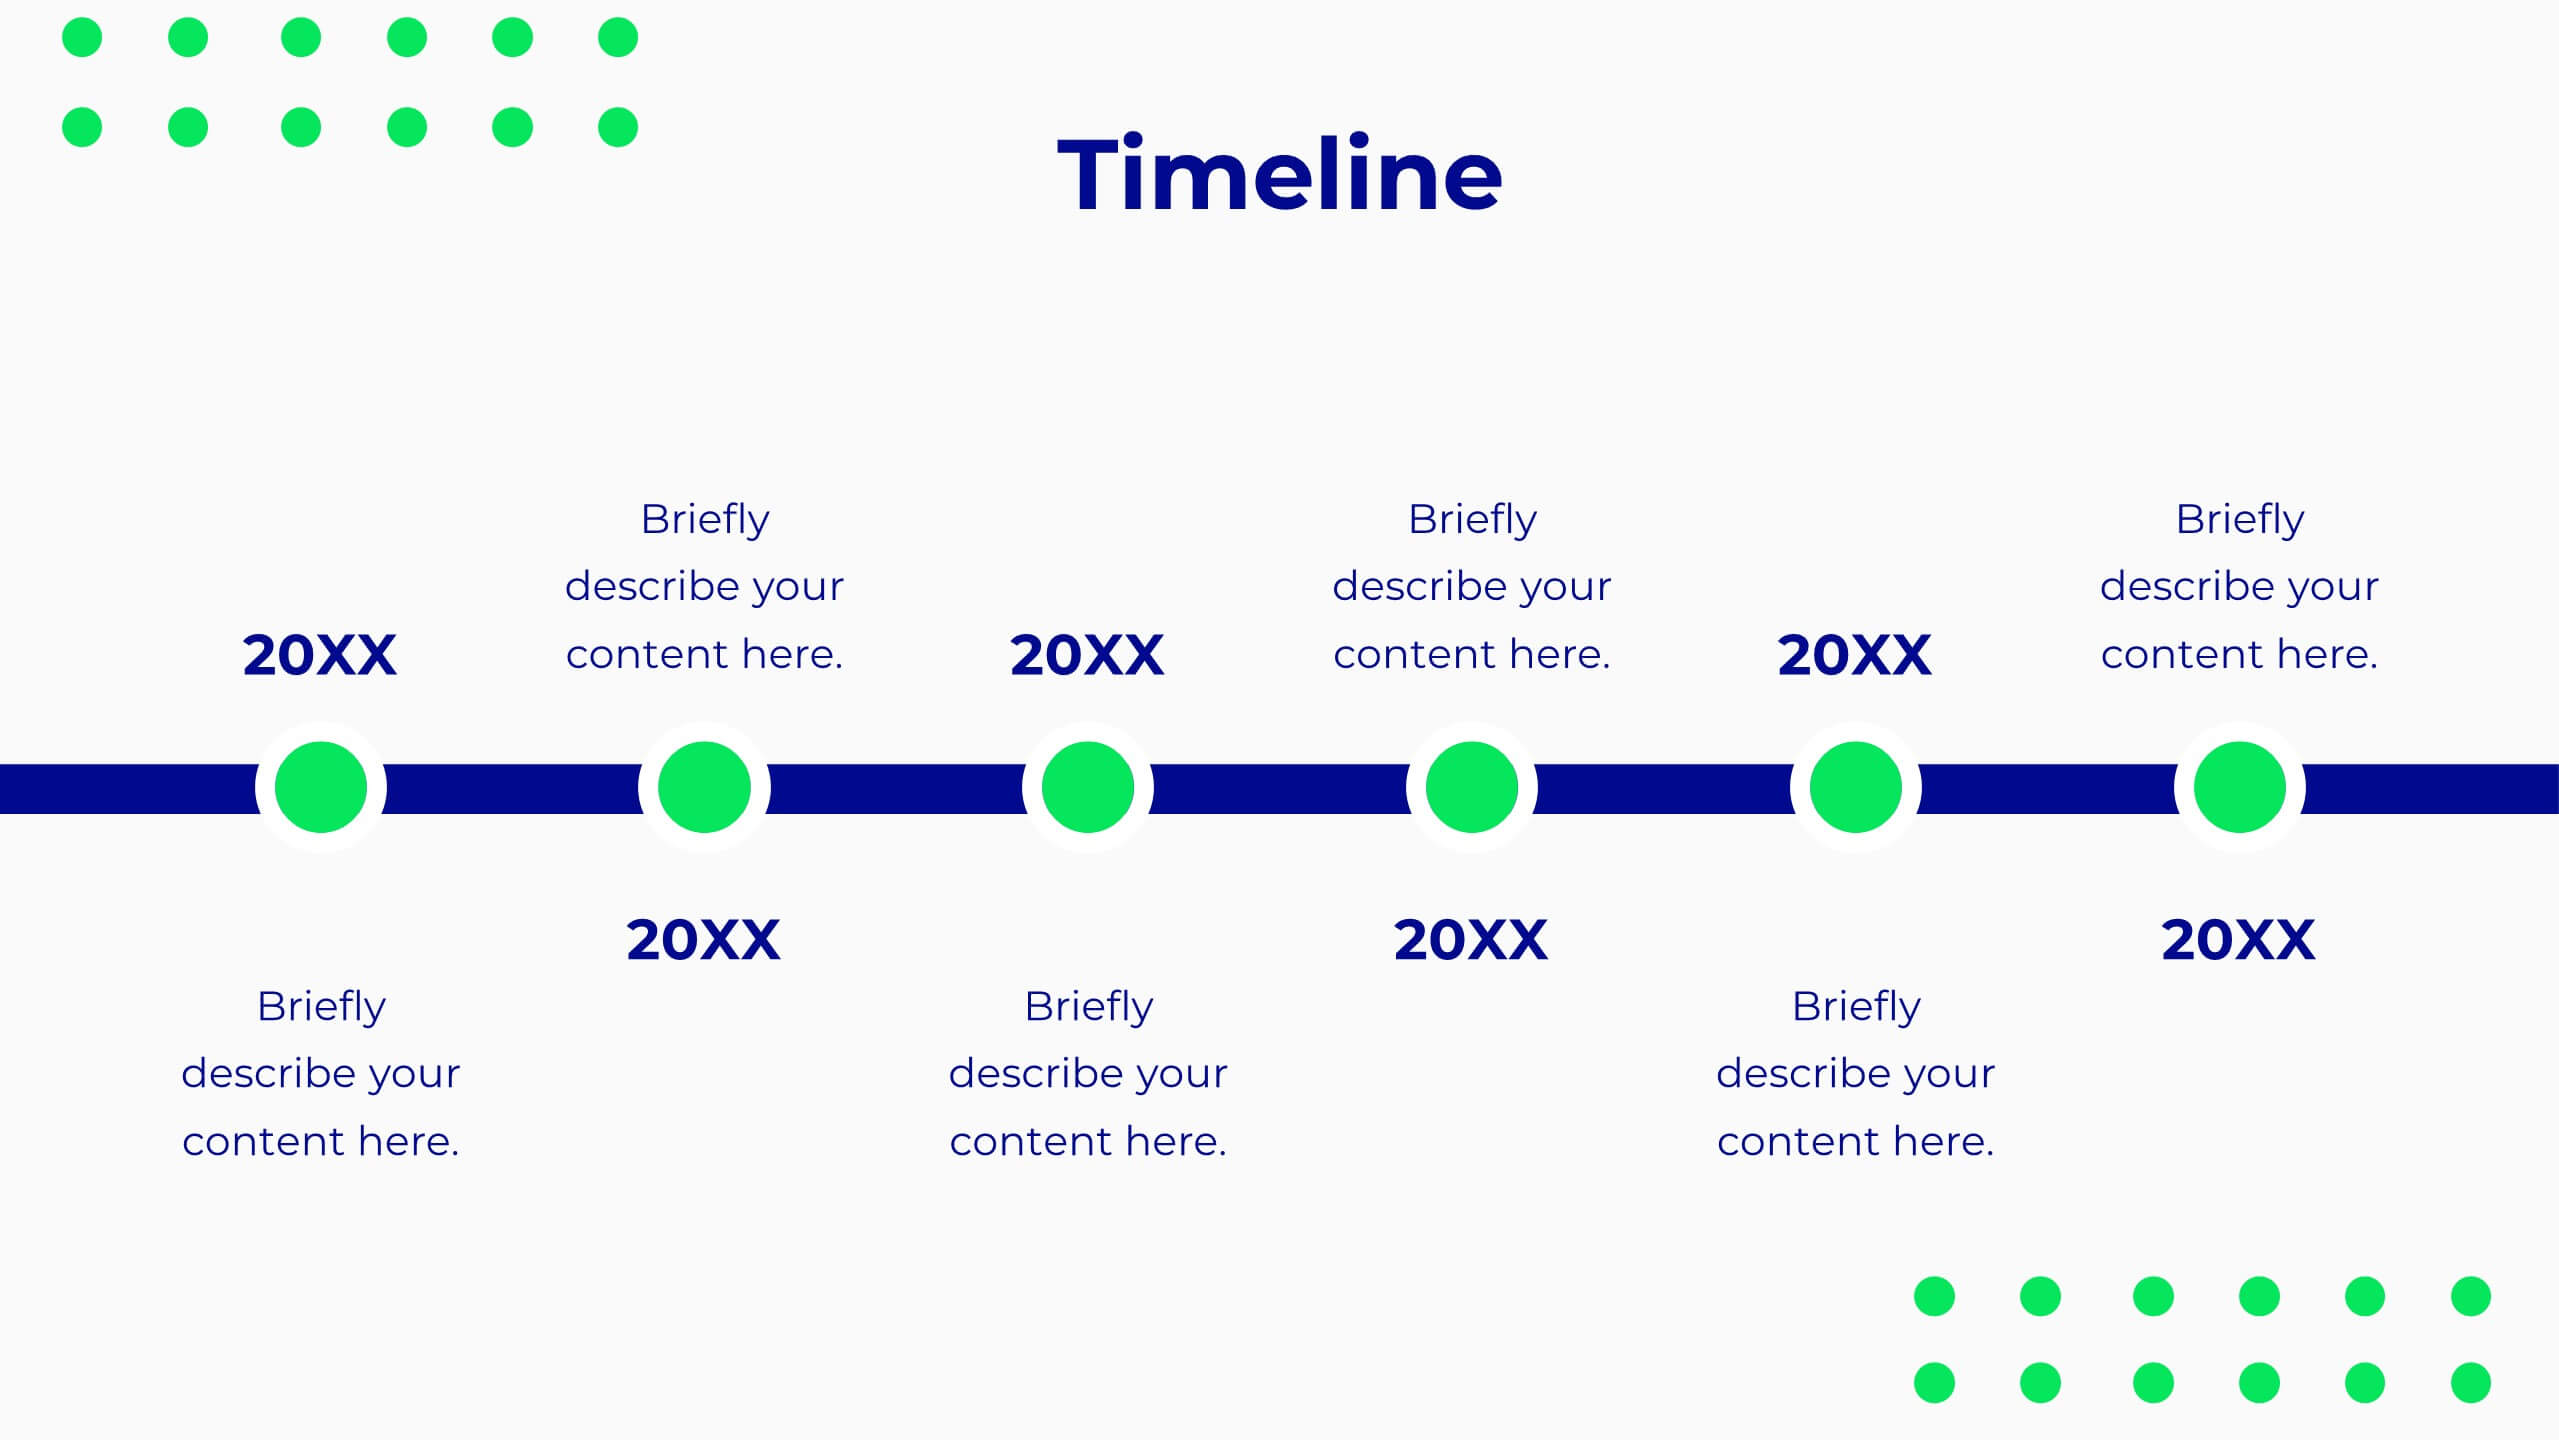
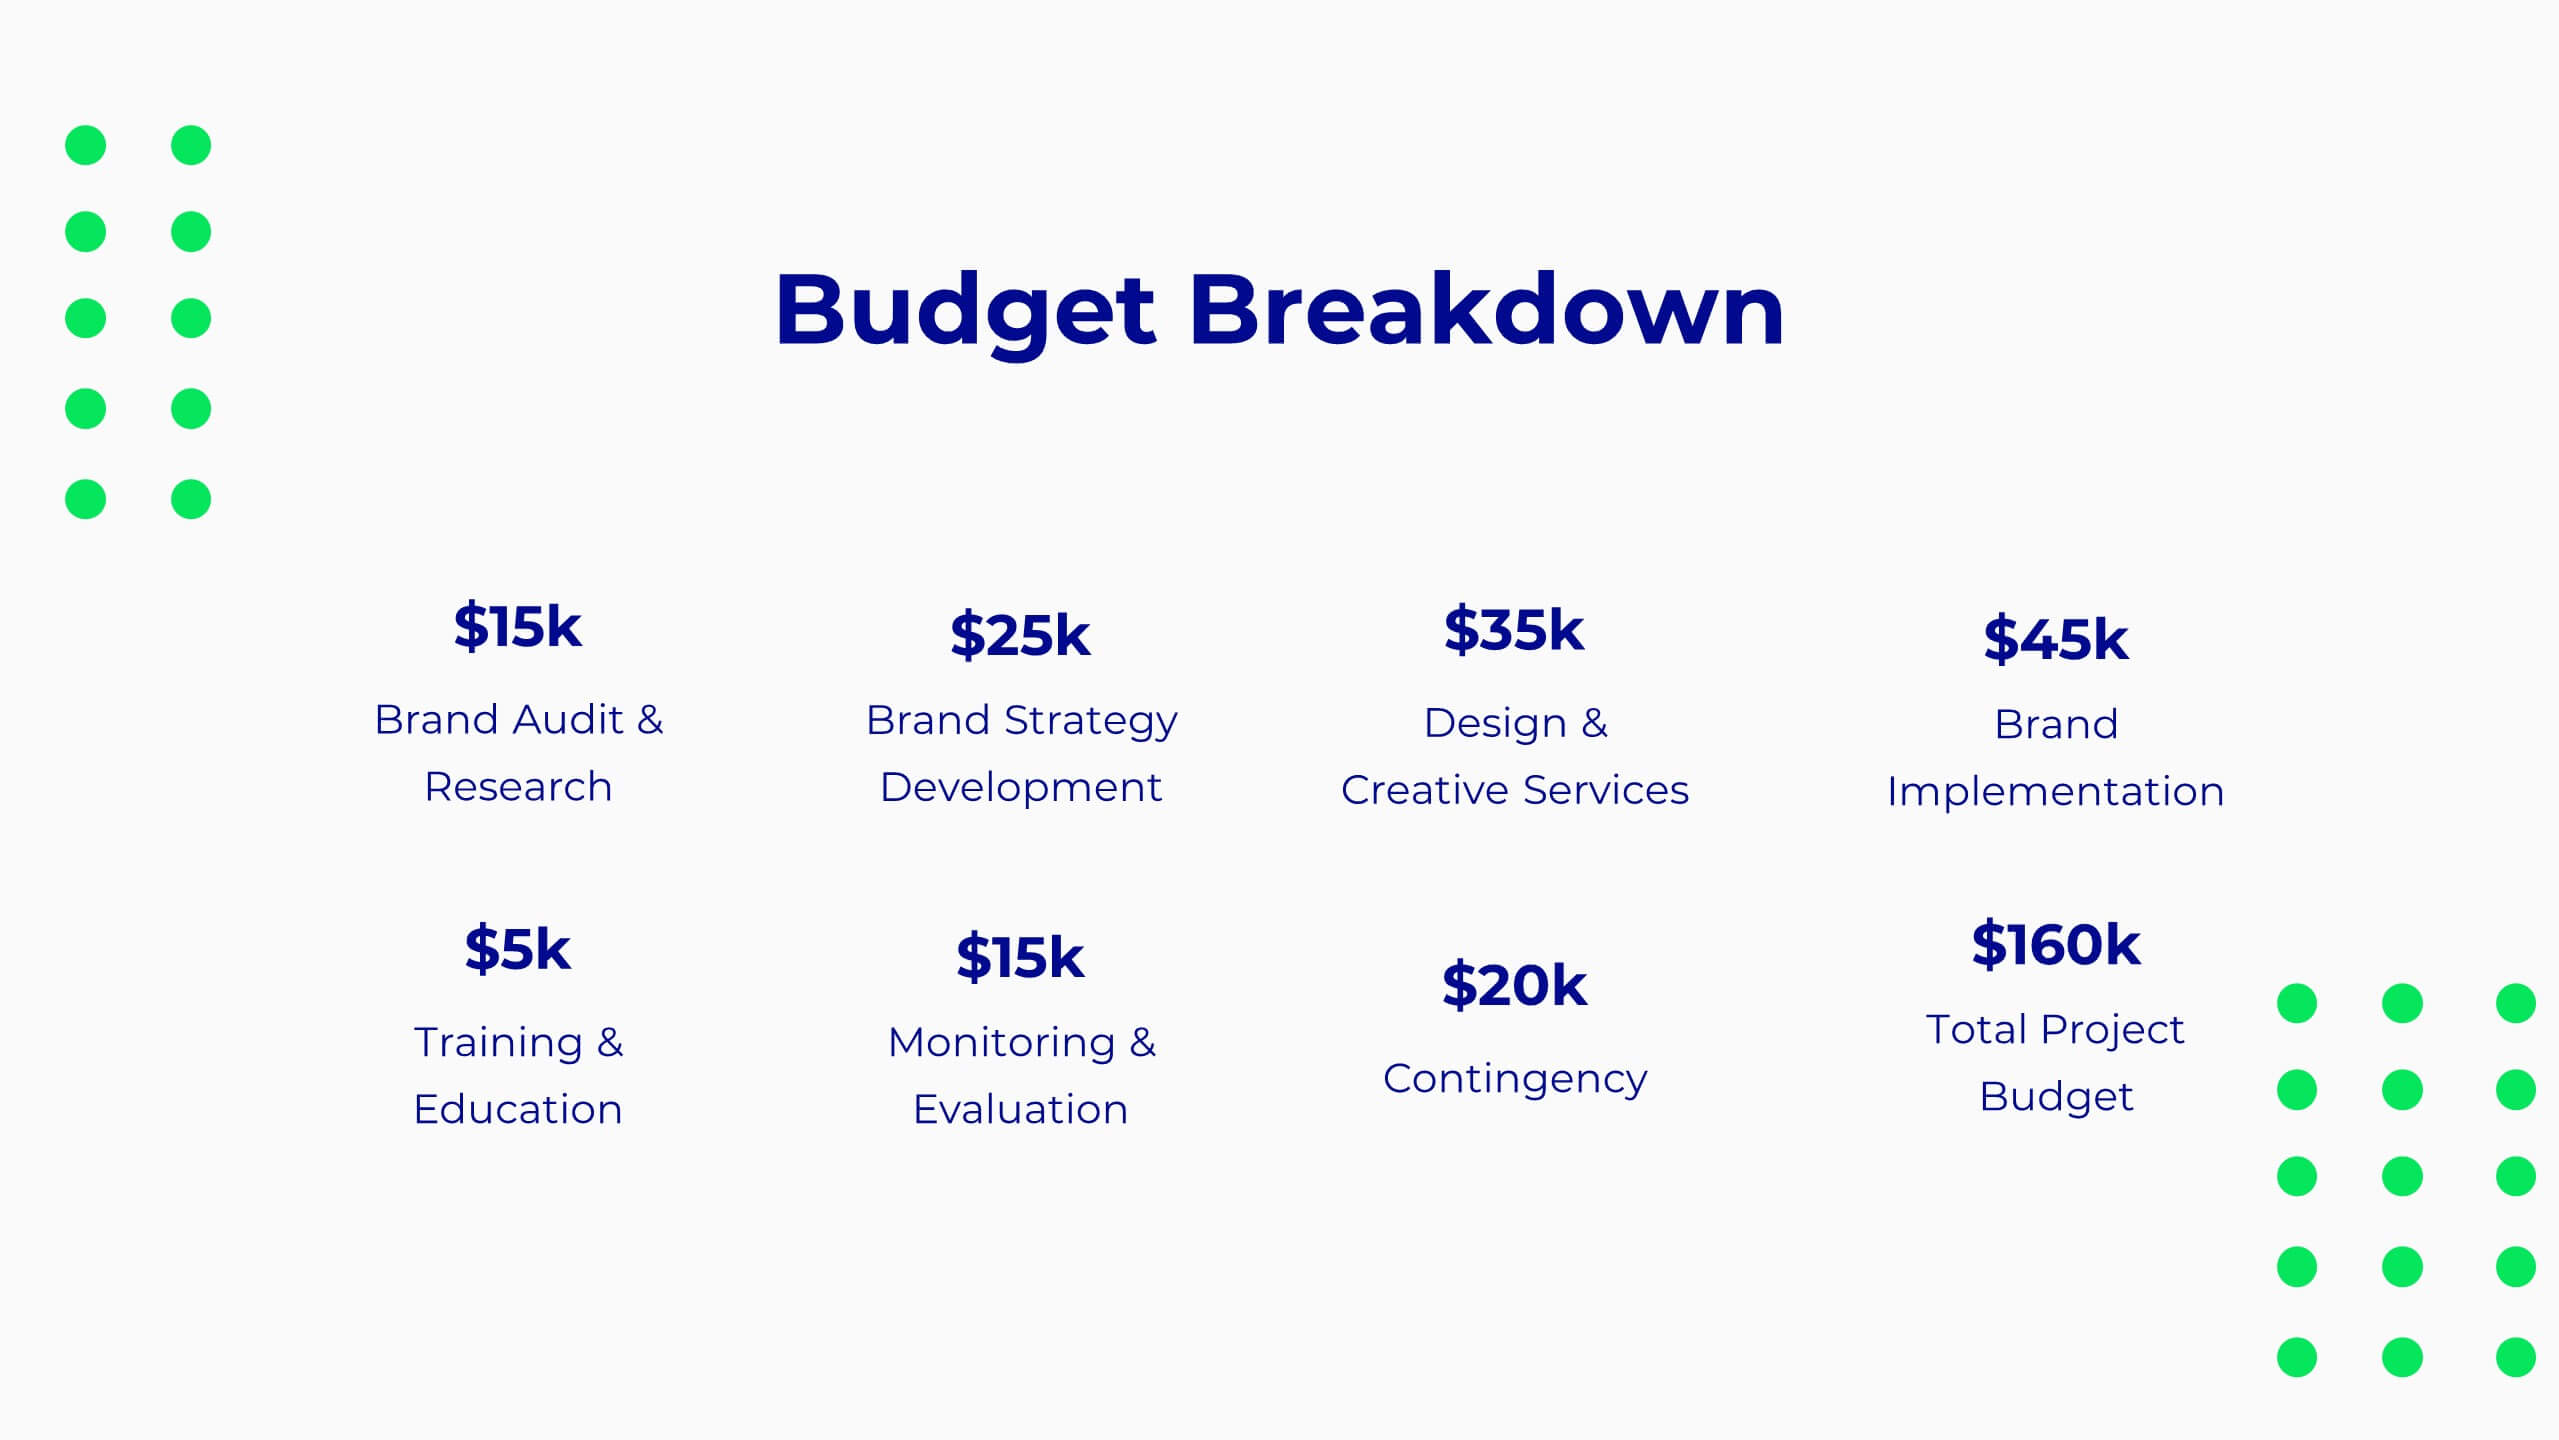
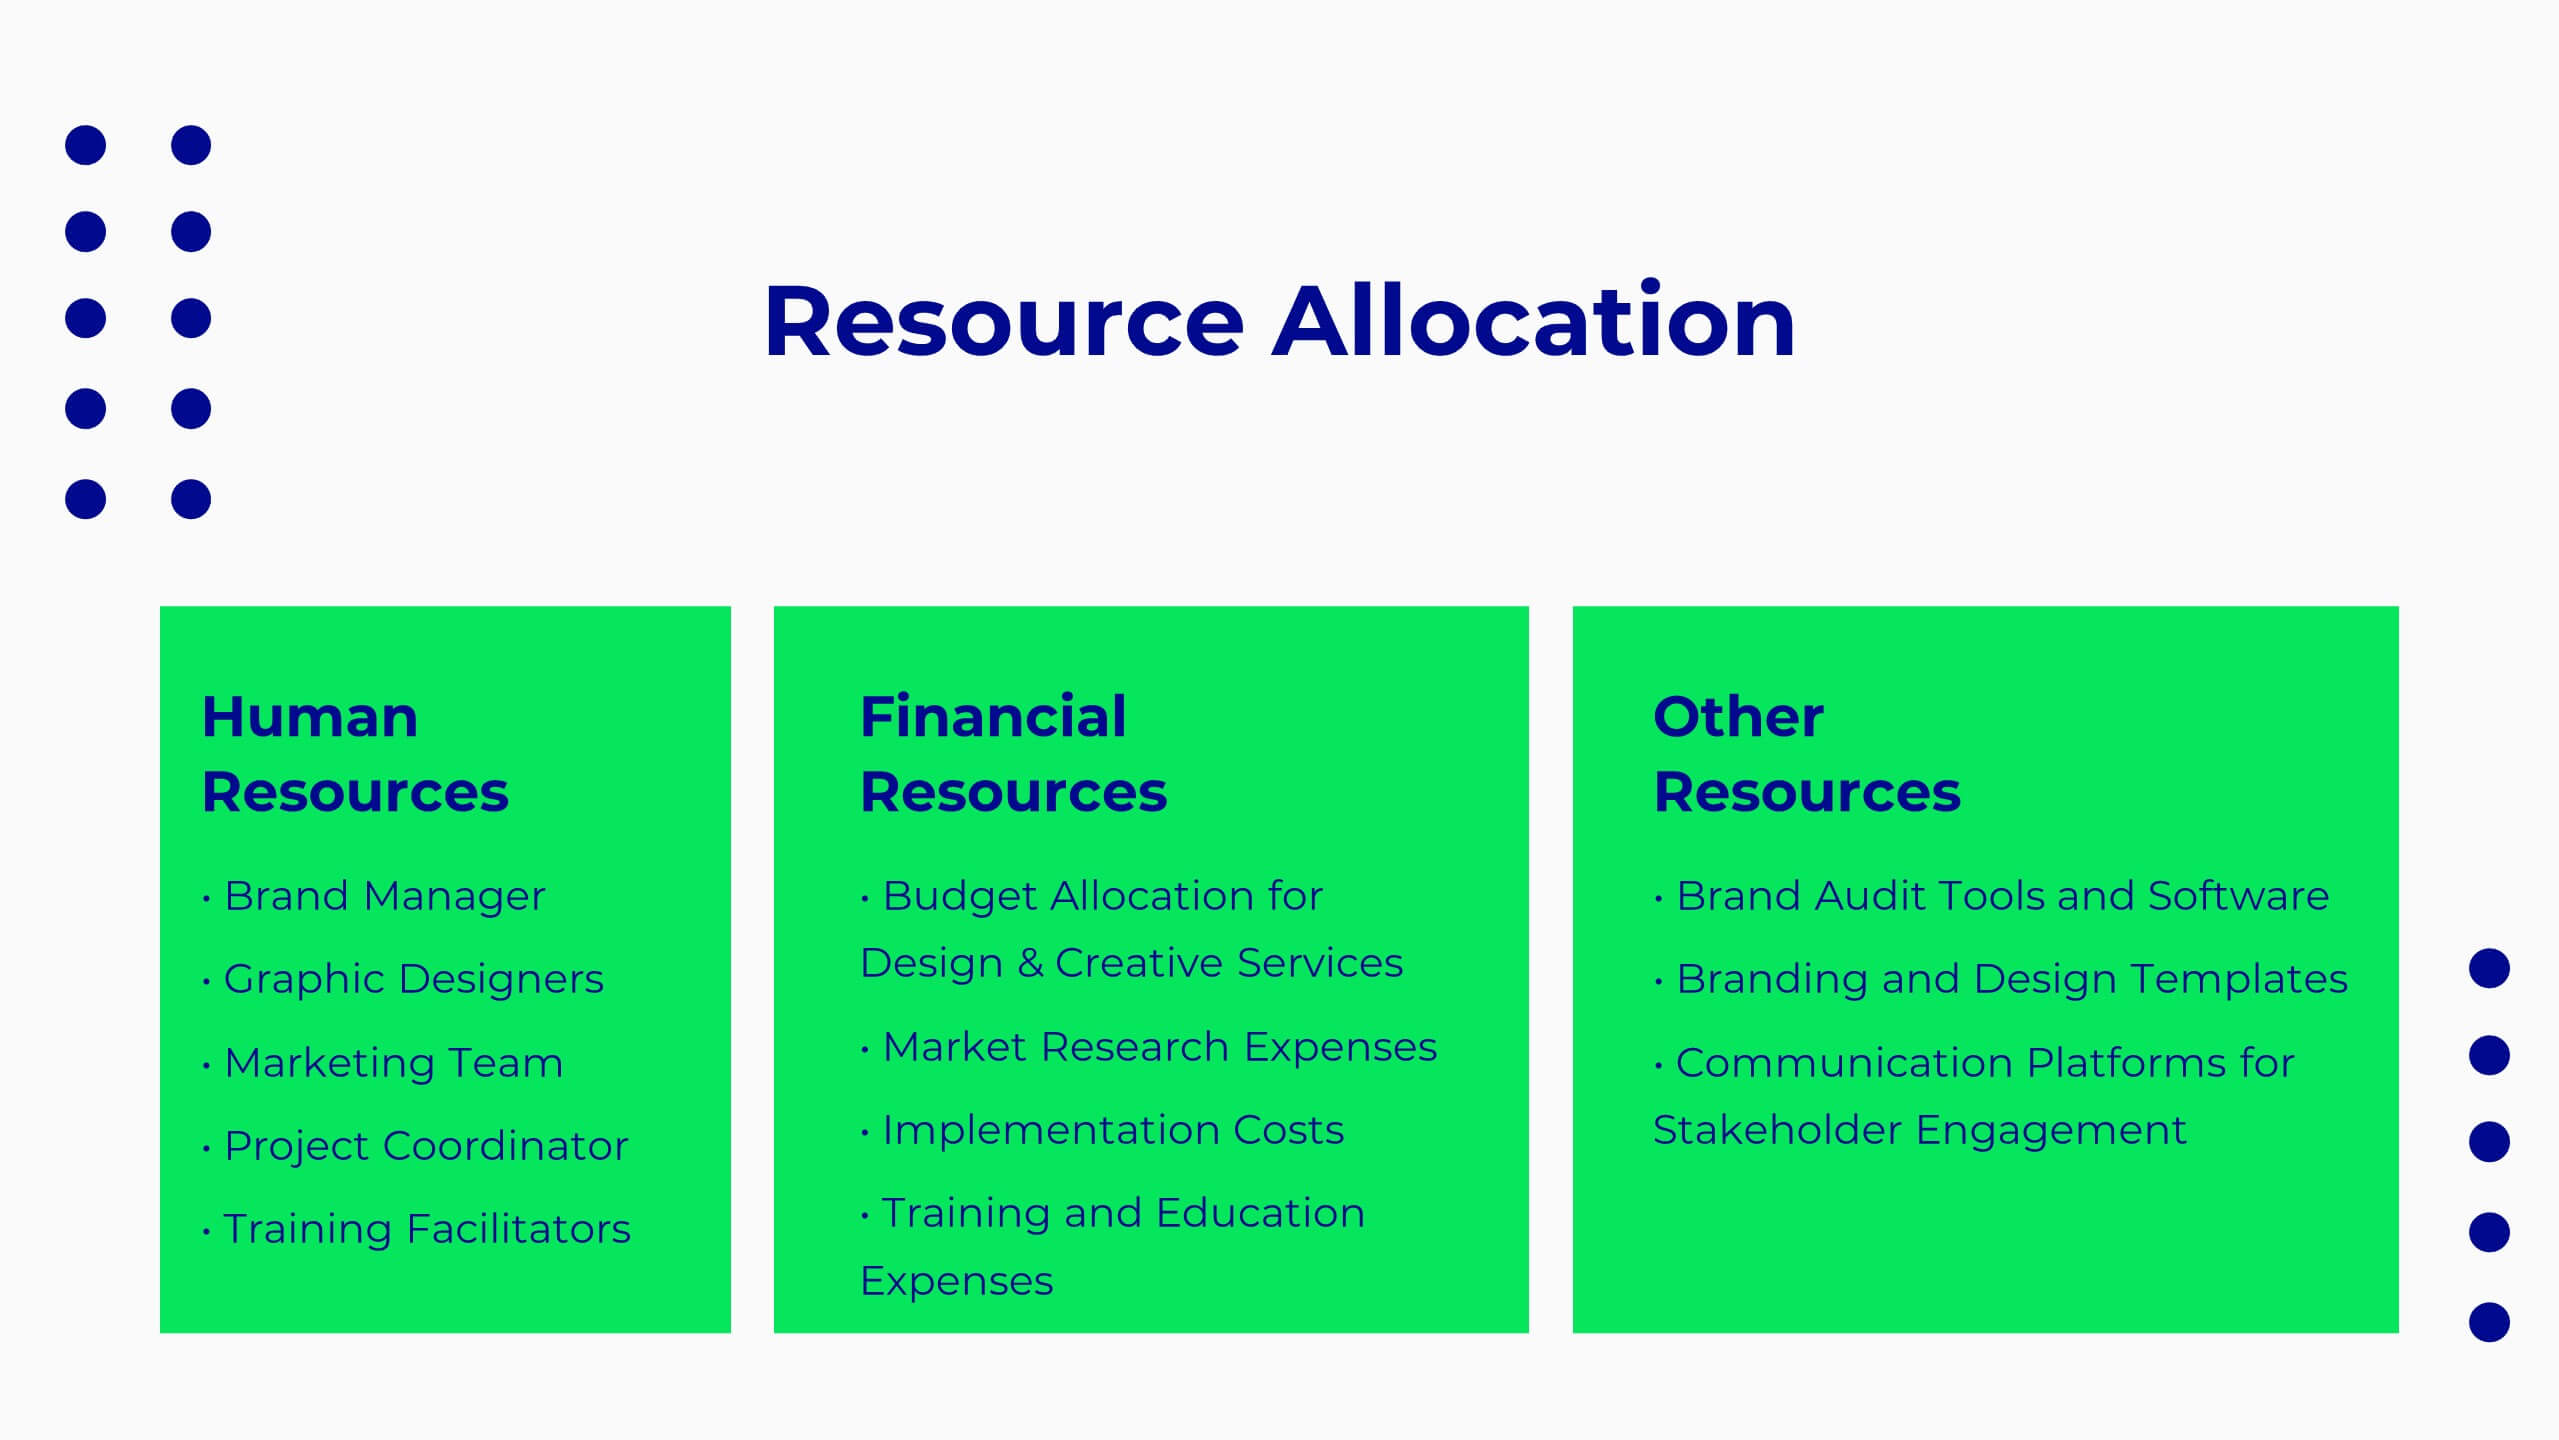
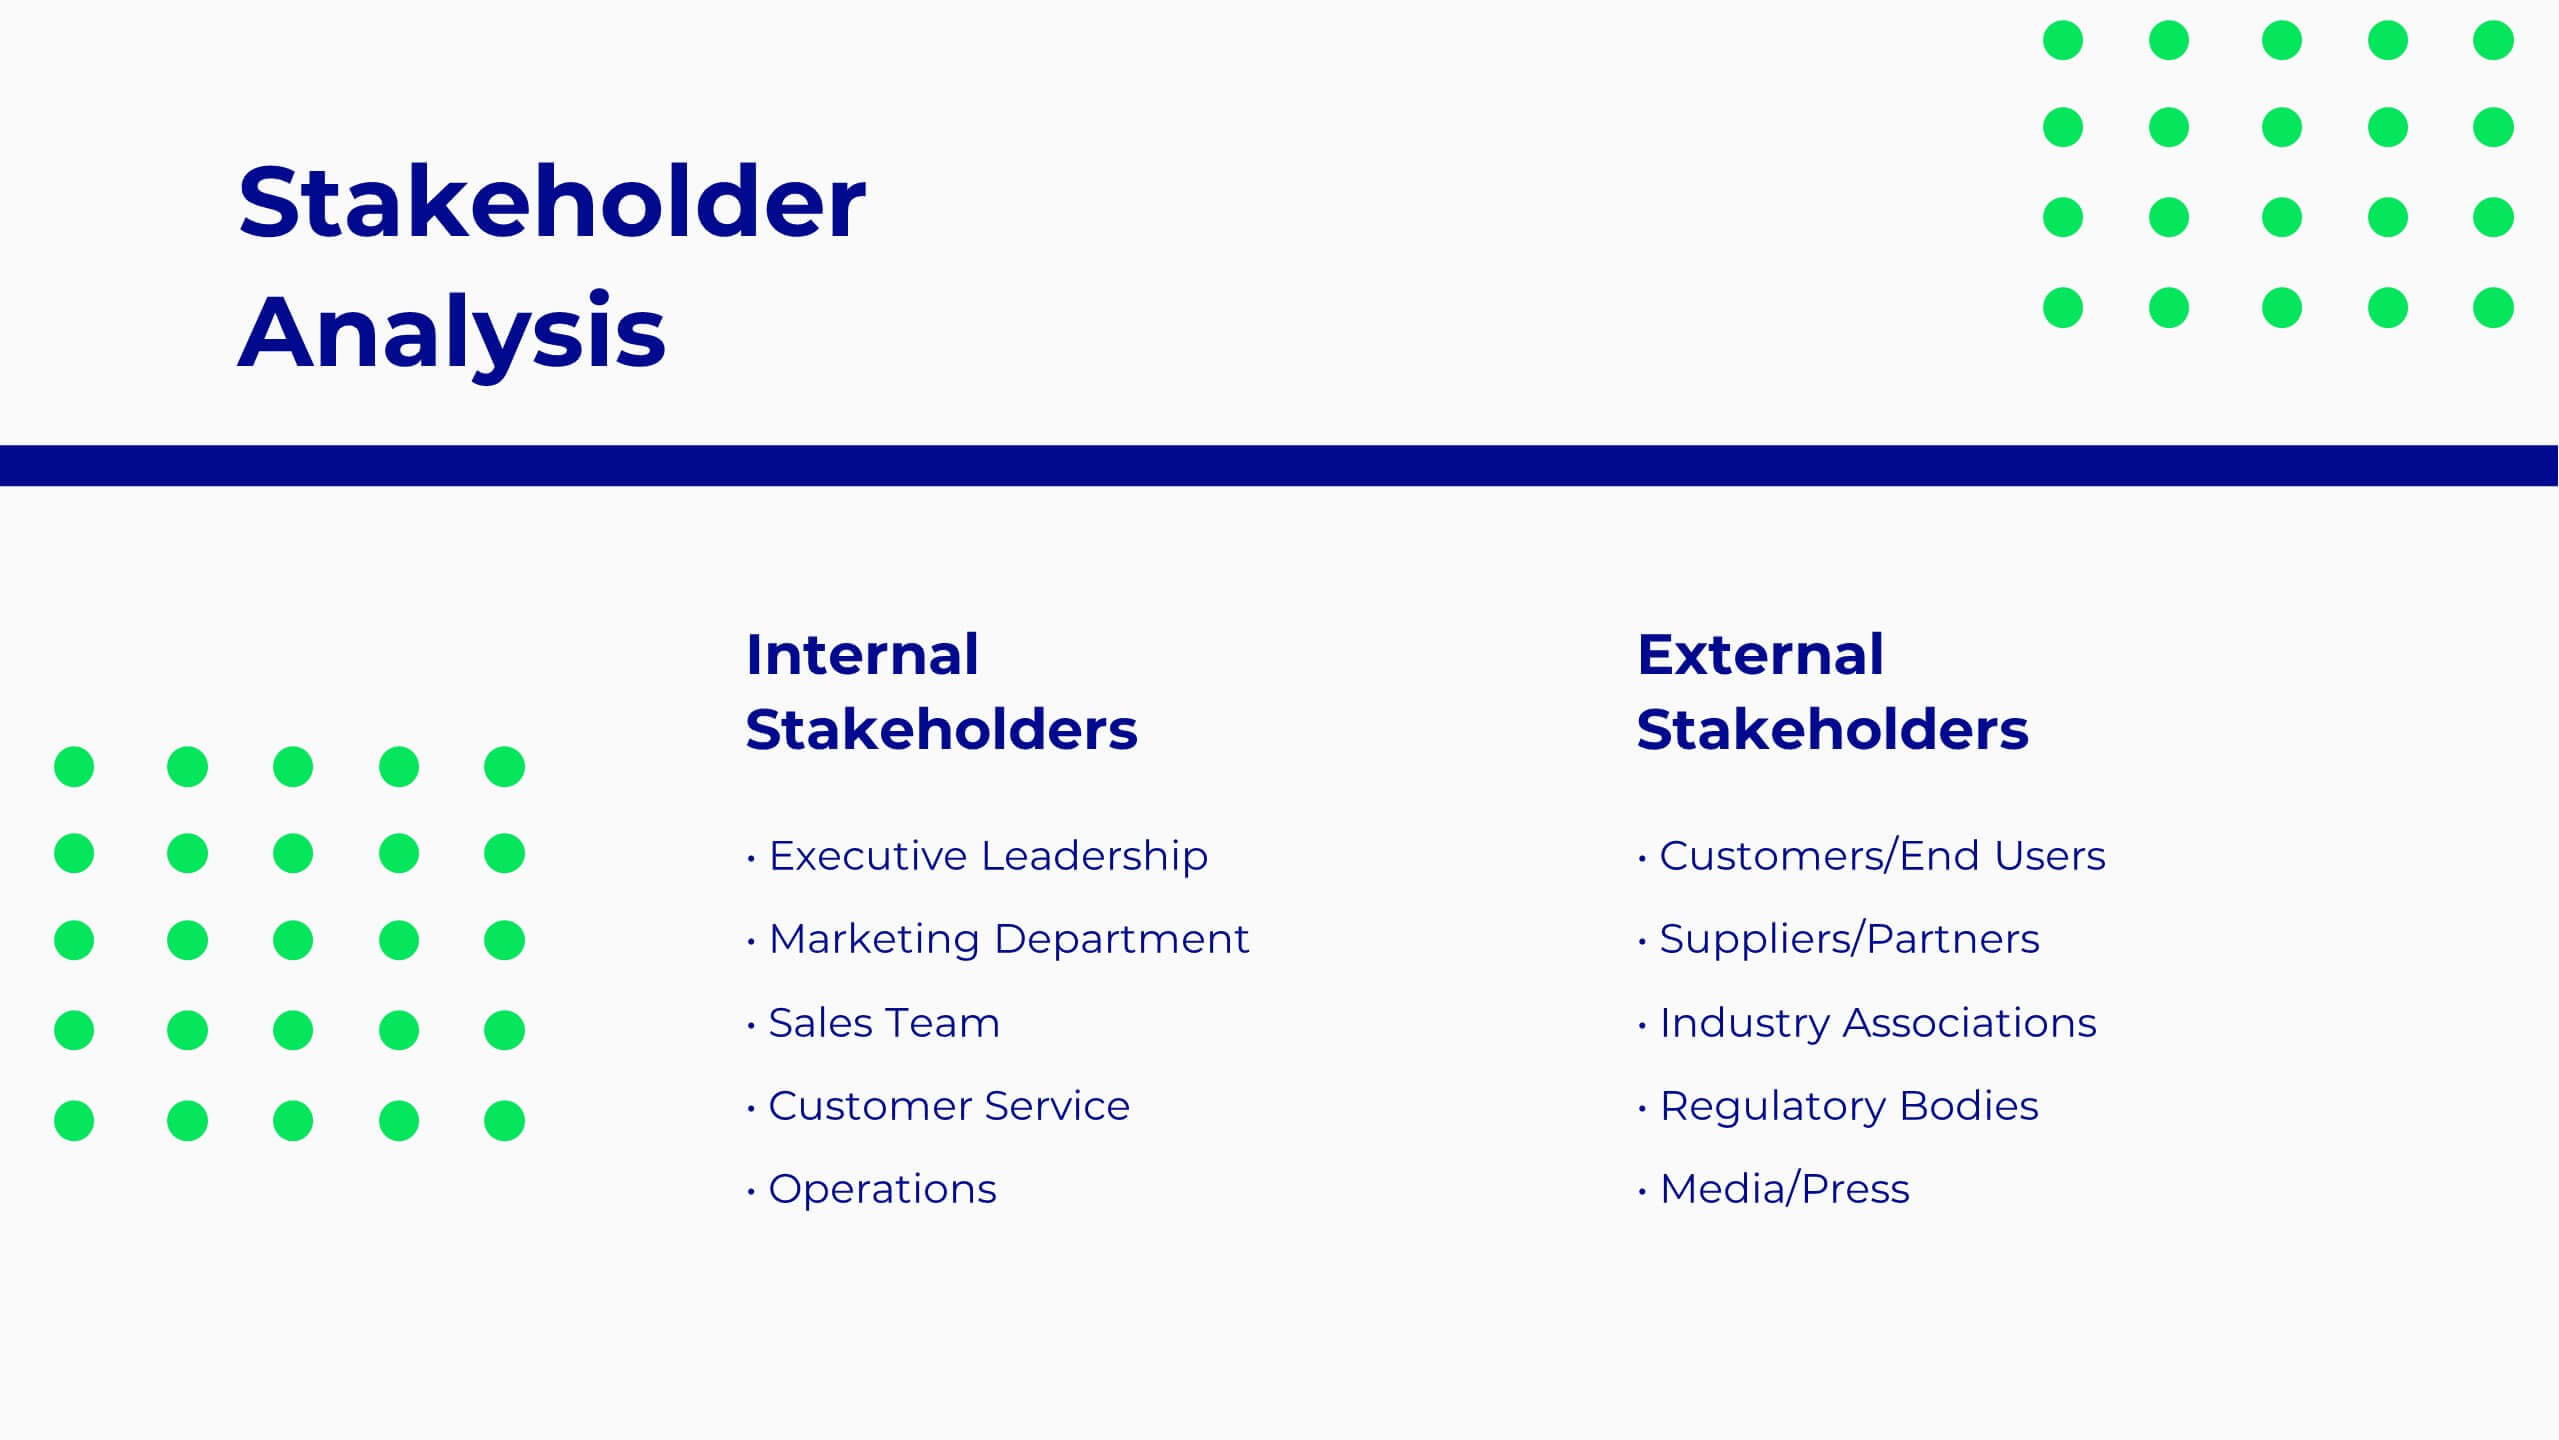
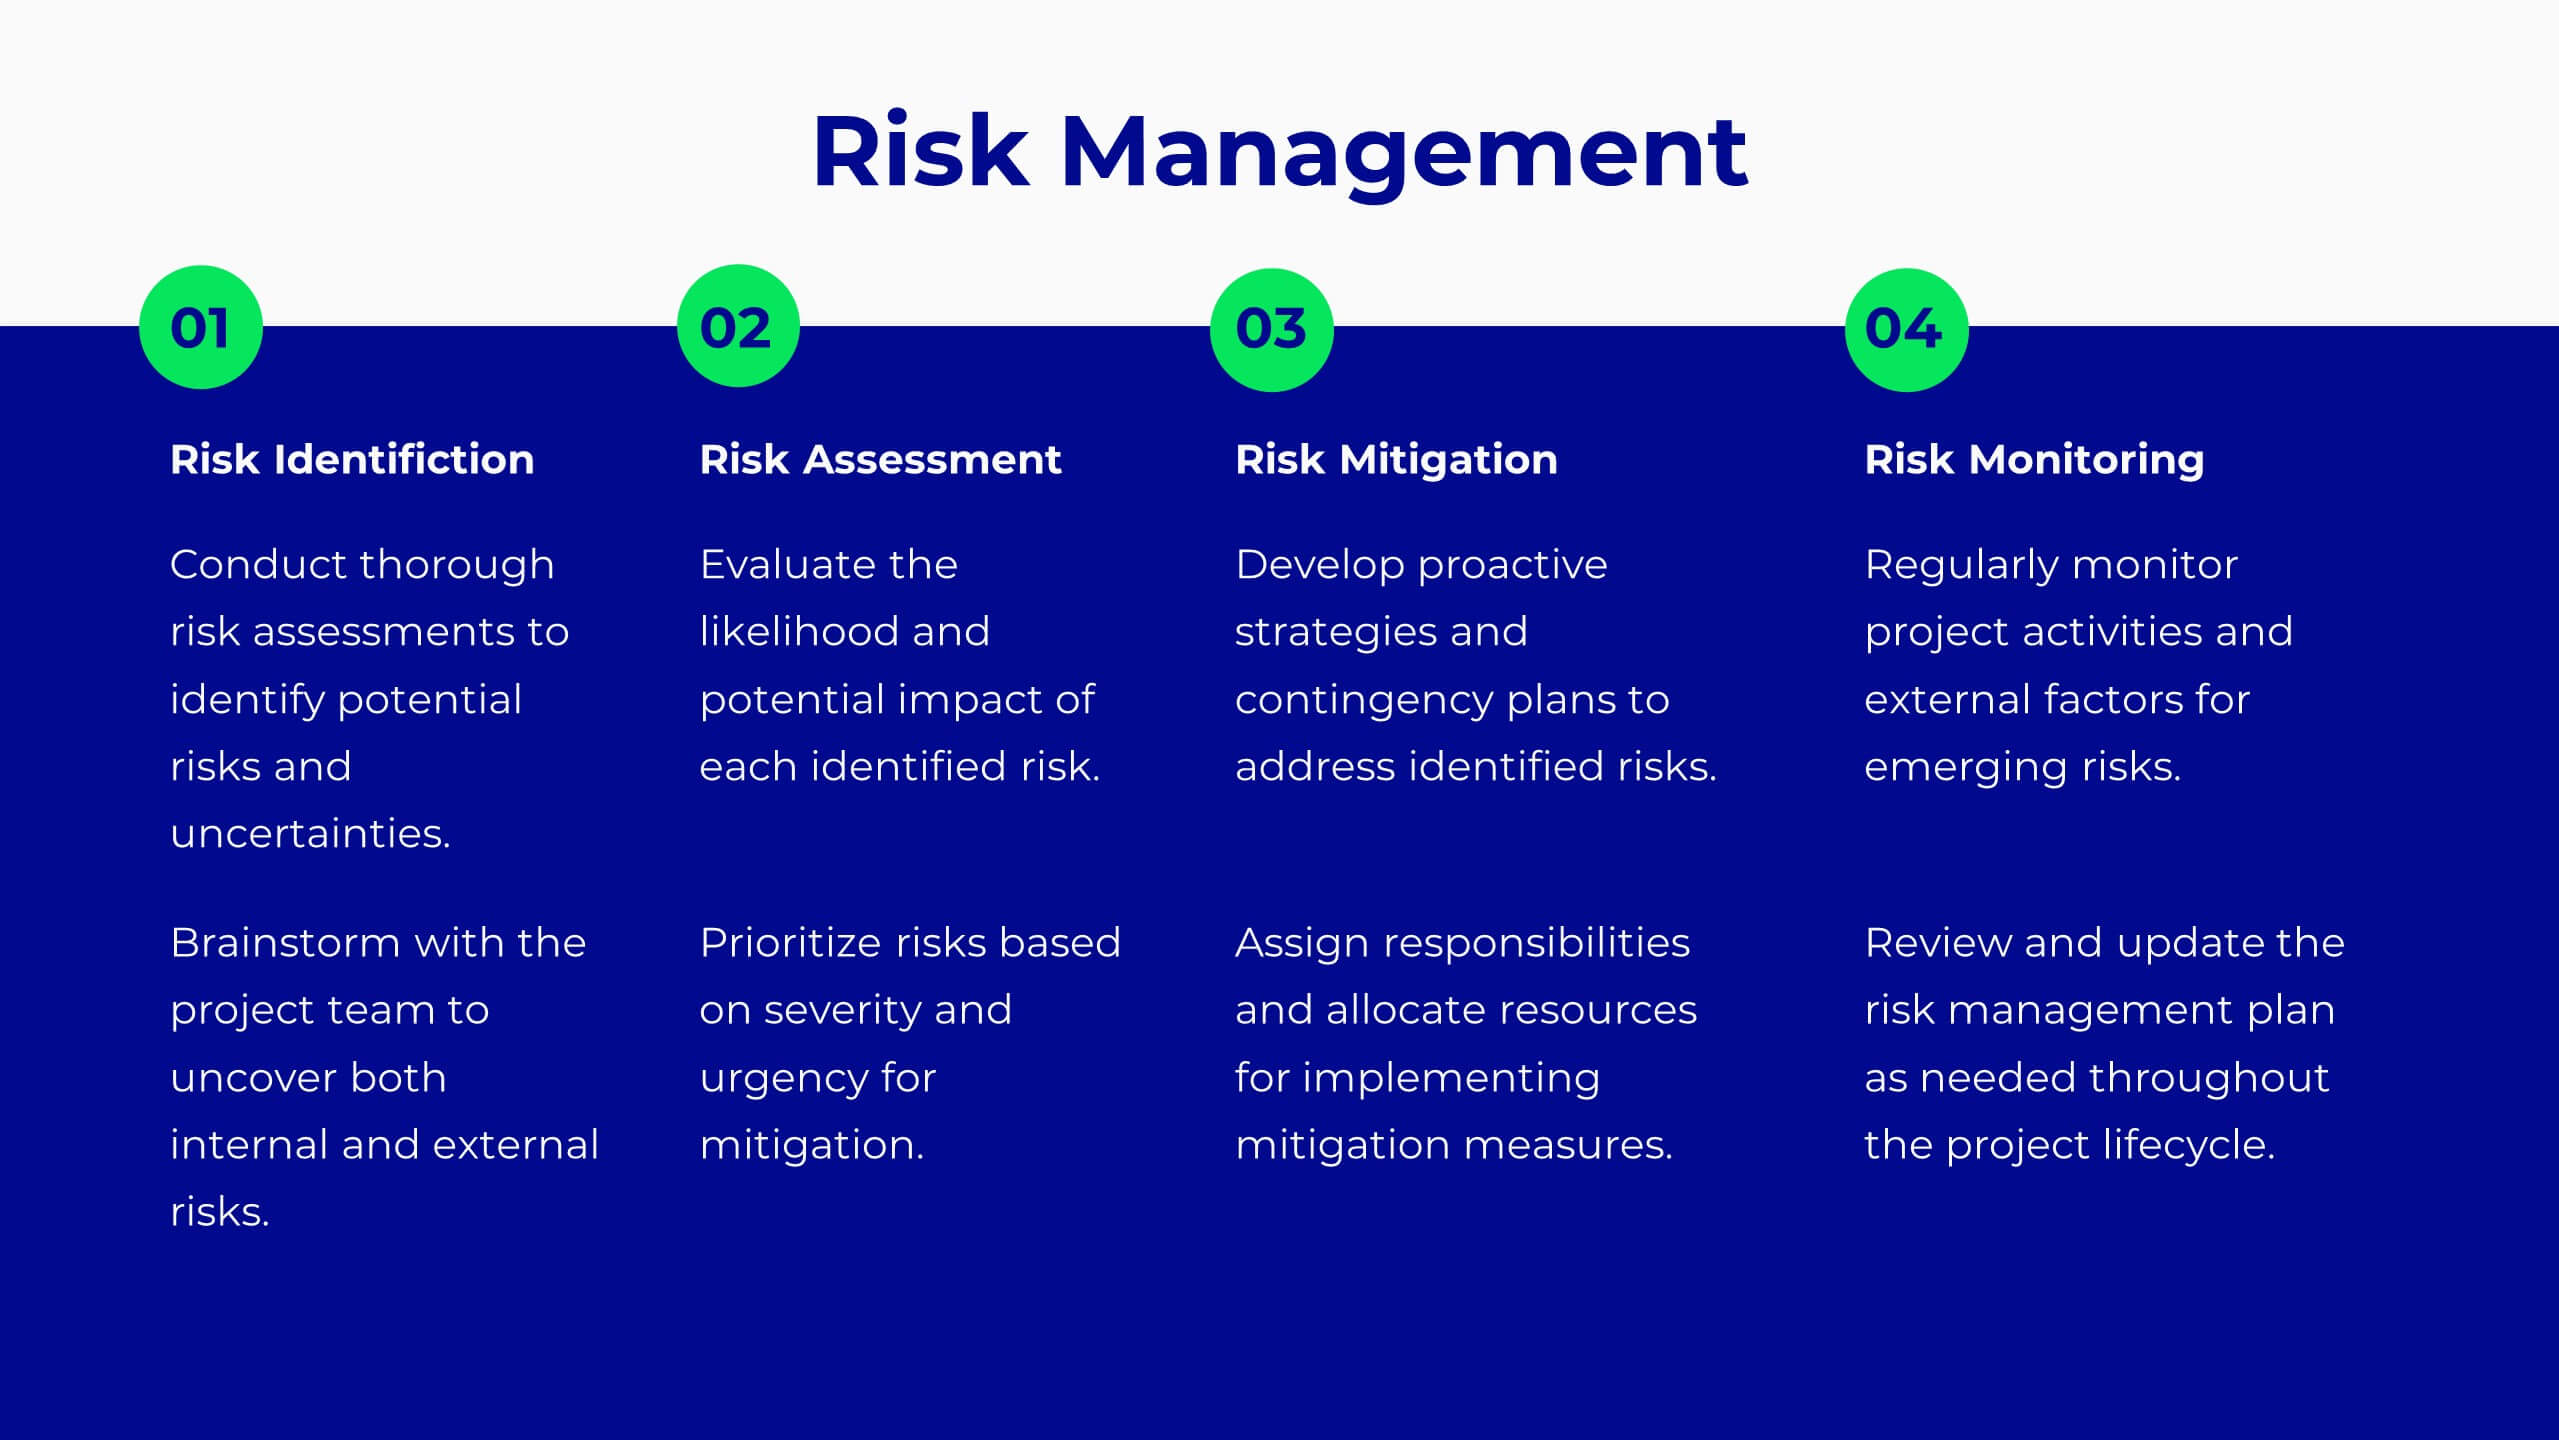
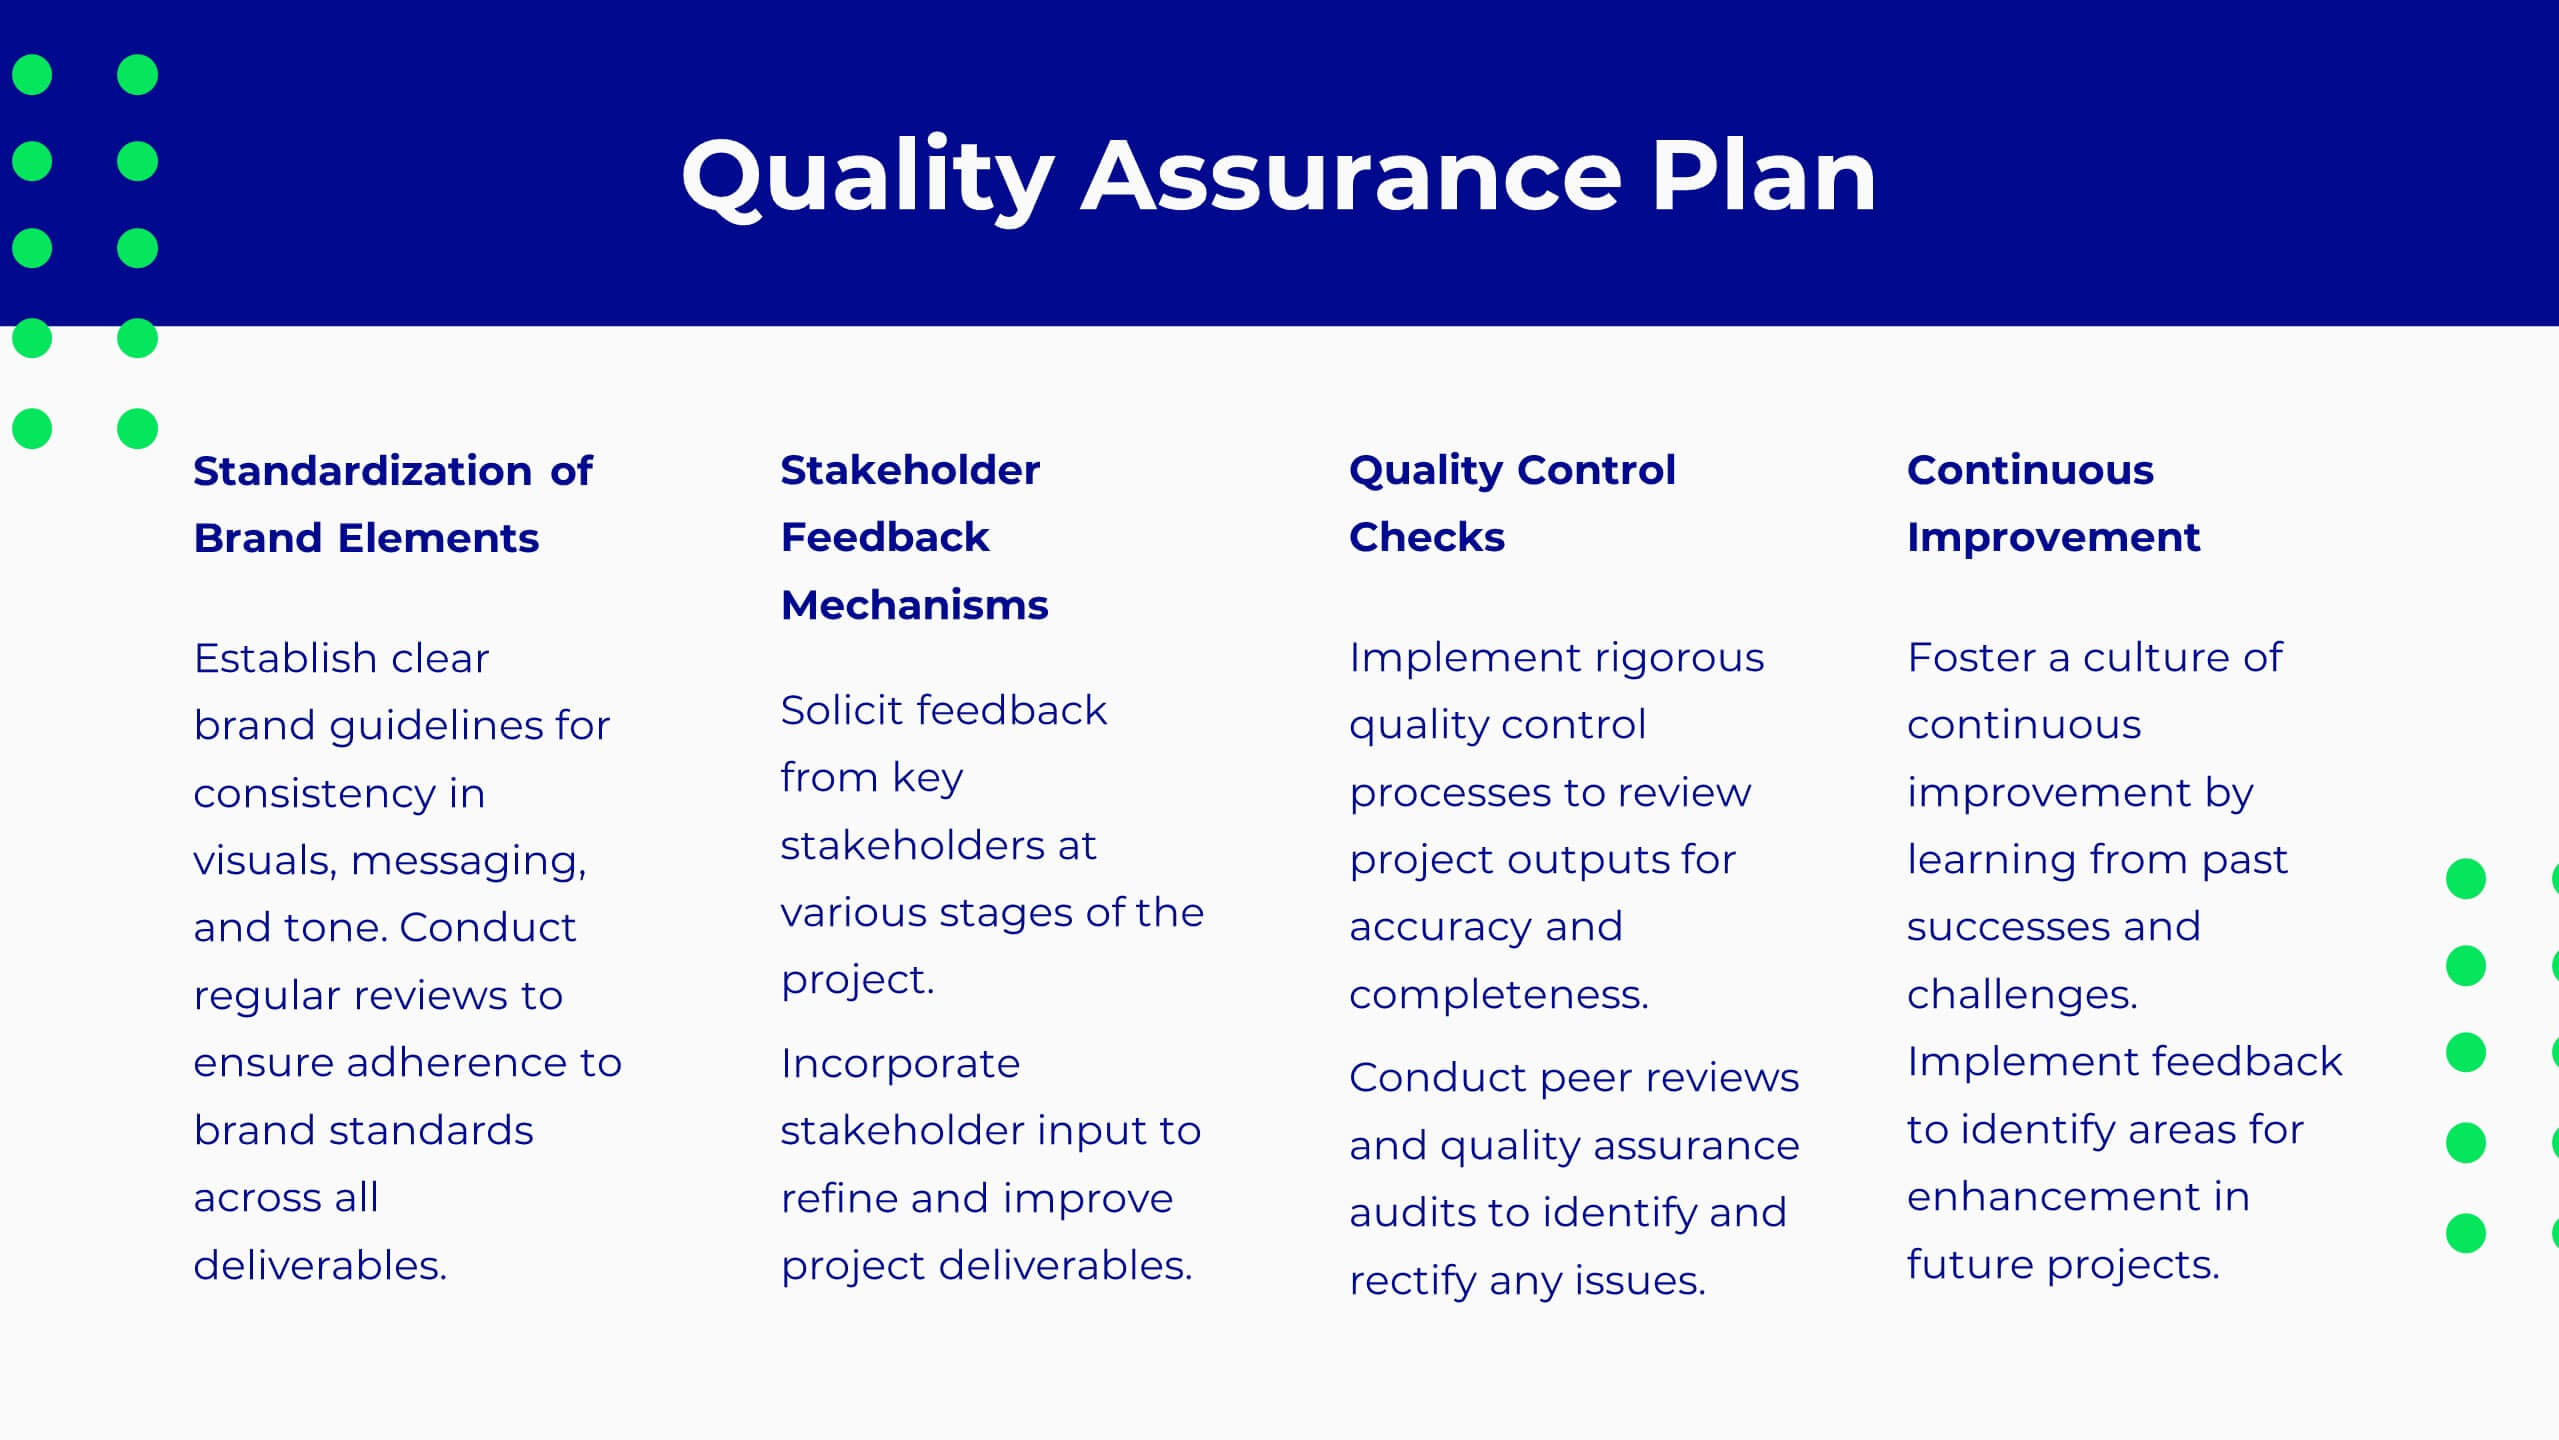
Pulse Project Milestones Report Presentation
Present project milestones effectively with this sleek, professional template. Cover project overview, timeline, and budget. Perfect for defining objectives, scope of work, and resource allocation. Highlight team introductions and stakeholder analysis. Ensure quality with risk management and assurance plans. Compatible with PowerPoint, Keynote, and Google Slides. Elevate your presentations today!