Overcoming Market Challenges Strategy Presentation
PowerPoint Template and Google Slides Theme
Features
- 6 Unique slides
- Fully editable and easy to edit in Microsoft Powerpoint, Keynote and Google Slides
- 16:9 widescreen layout
- Clean and professional designs
- Export to JPG, PDF or send by email
- Remove from favorites
Powerpoint Template
1 MB
Google Slides Template
External link
Keynote Template
2 MB
Recommend
- Remove from favorites
Powerpoint Template
1 MB
Google Slides Template
External link
Keynote Template
1 MB
4 slides
Cause-Effect Relationships Bowtie Format Presentation
Clearly illustrate the connection between causes and outcomes with the Cause-Effect Relationships Bowtie Format Presentation. Designed to simplify complex business logic, this layout uses a symmetrical bowtie shape to contrast contributing factors with resulting effects. Ideal for strategy, operations, or risk analysis. Fully editable in Canva, PowerPoint, Google Slides, and Keynote.
- Remove from favorites
Powerpoint Template
1 MB
Google Slides Template
External link
Keynote Template
1 MB
5 slides
Cryptocurrency Market Trends Presentation
Navigate the dynamic world of digital finance with our "Cryptocurrency Market Trends" presentation templates. Perfect for analysts and enthusiasts alike, these templates provide a clear, visual representation of market movements and trends. They are fully compatible with PowerPoint, Keynote, and Google Slides, making them an excellent resource for anyone keen on the pulse of cryptocurrency markets.
- Remove from favorites
Powerpoint Template
1 MB
Google Slides Template
External link
Keynote Template
2 MB
10 slides
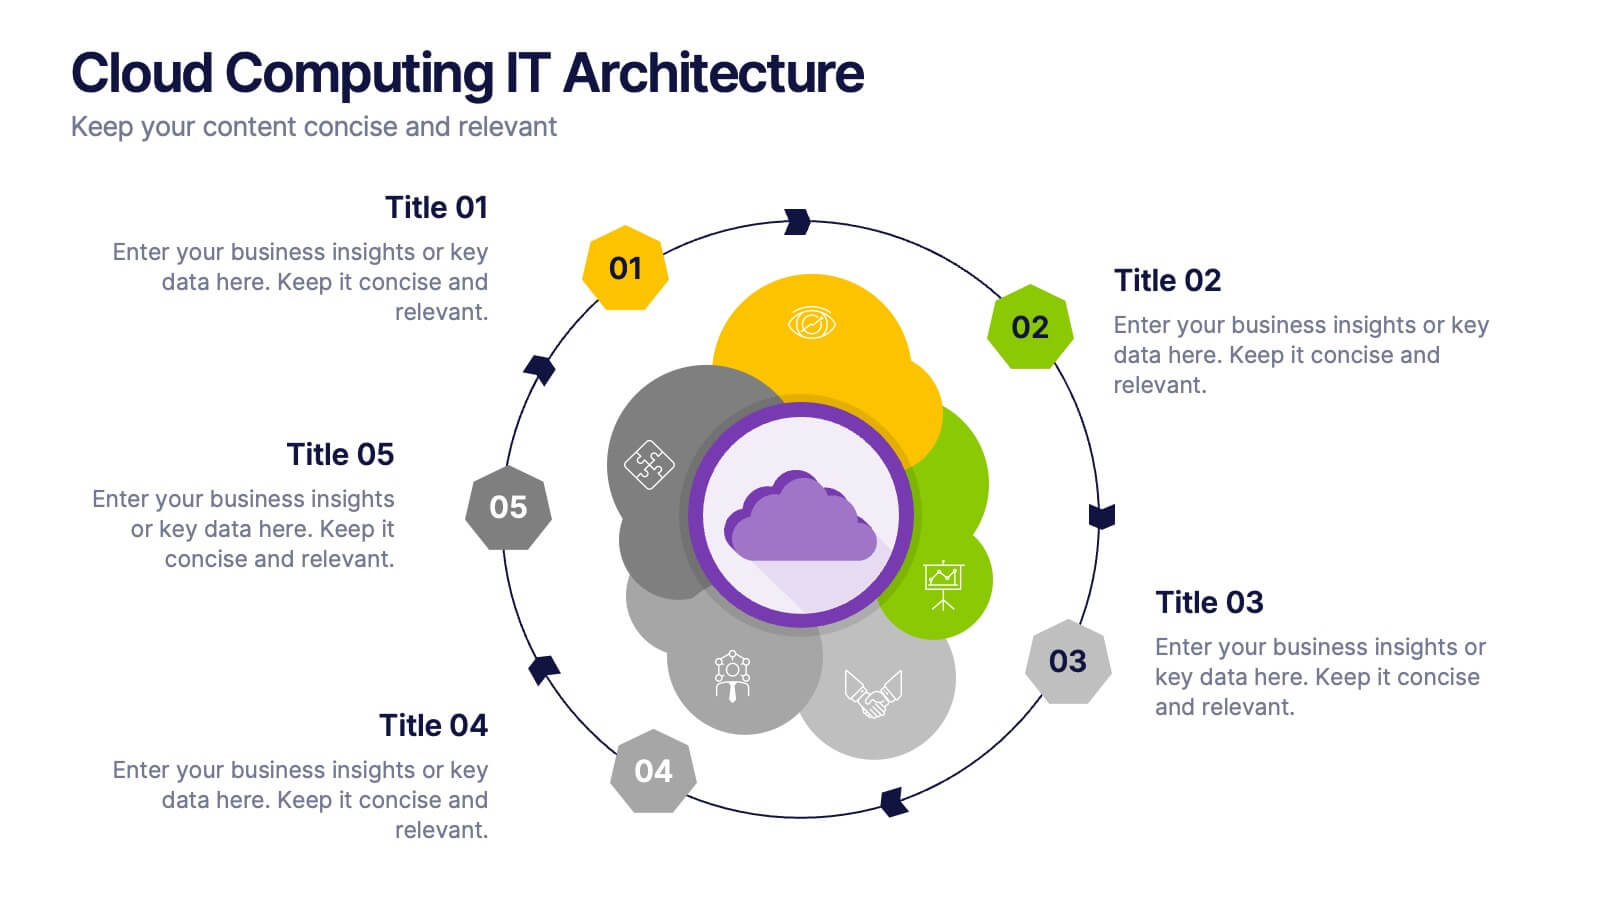
Cloud Computing IT Architecture
Showcase your cloud infrastructure with this layered circular diagram designed to highlight core services, storage, and computing components. Ideal for IT teams, SaaS providers, or tech consultants, these slides simplify complex cloud systems into 5 customizable sections. Fully editable in PowerPoint, Keynote, and Google Slides.
- Remove from favorites
Powerpoint Template
1 MB
Google Slides Template
External link
Keynote Template
2 MB
21 slides
Sable Detailed Project Execution Plan Presentation
Master your project planning with this comprehensive execution plan template! Perfect for detailing project overviews, objectives, and timelines, it includes slides for budget breakdowns, resource allocation, and risk management. Ensure every detail is covered with structured content and clear visuals. Compatible with PowerPoint, Keynote, and Google Slides for seamless presentations on any platform.
- Remove from favorites
Powerpoint Template
9 MB
Google Slides Template
External link
Keynote Template
2 MB
21 slides
Polaris Startup Strategy Presentation
Set your startup on a path to success with this bold and dynamic strategy presentation template. Featuring key sections like mission and vision, market analysis, business model, and growth plans, it’s perfect for entrepreneurs and teams. Fully compatible with PowerPoint, Keynote, and Google Slides for a seamless presentation experience.
- Remove from favorites
Powerpoint Template
1 MB
Google Slides Template
External link
Keynote Template
1 MB
5 slides
Workout Importance Infographics
Energize your audience with our dynamic workout importance infographics template. Bathed in the motivating shades of cream, blue, and orange, this collection is a powerhouse of fitness inspiration, perfect for personal trainers, fitness bloggers, health educators, and gym establishments. Compatible with Powerpoint, Keynote, and Google Slides. Its creative, fitness-oriented design showcases compelling graphics, icons, and image placeholders that vividly illustrate exercise routines, health stats, and motivational quotes. It's not just an infographic; it's your ally in promoting a healthy lifestyle, emphasizing the transformative power of physical activity.
- Remove from favorites
Powerpoint Template
1 MB
Google Slides Template
External link
Keynote Template
2 MB
6 slides
Travel Itinerary and Budget Planning Presentation
Plan trips with precision using this visually organized circle-based infographic. With six labeled sections and travel-themed icons, this layout helps you outline schedules, expenses, and key milestones clearly. Perfect for tour operators, travel bloggers, or itinerary services, this slide ensures information is both engaging and easy to follow. Fully editable in PowerPoint, Keynote, and Google Slides.
- Remove from favorites
Powerpoint Template
1 MB
Google Slides Template
External link
Keynote Template
1 MB
4 slides
Objectives and Key Results Overview Presentation
Set your goals, define success, and visualize progress with a sleek, easy-to-follow layout that connects objectives to measurable outcomes. Ideal for business strategy, team performance, or quarterly reviews, this presentation keeps your message clear and professional. Fully compatible with PowerPoint, Keynote, and Google Slides for effortless editing.
- Remove from favorites
Powerpoint Template
1 MB
Google Slides Template
External link
Keynote Template
1 MB
8 slides
Benefits Table Template
Optimize your presentation of complex options with our "Benefits Table Template." Designed to clearly distinguish between different plans, this template enables you to showcase Plan A, Plan B, and Plan C with ease. Each column is distinctively colored and detailed to ensure your audience can grasp the variances in benefits at a glance. Ideal for comparing packages, costs, or strategic choices in a corporate setting, this template helps clarify decision-making processes. Compatible with PowerPoint, Keynote, and Google Slides, it is an invaluable tool for business analysts, sales teams, and marketers aiming to communicate effectively with their stakeholders.
- Remove from favorites
Powerpoint Template
1 MB
Google Slides Template
External link
Keynote Template
2 MB
12 slides
Real Estate Business Proposal Presentation
Present your Real Estate Business Proposal with this structured and visually compelling template. Designed for real estate professionals, investors, and agencies, this slide helps communicate investment strategies, market opportunities, and property insights effectively. Fully customizable and compatible with PowerPoint, Keynote, and Google Slides for seamless editing.
- Remove from favorites
Powerpoint Template
1 MB
Google Slides Template
External link
Keynote Template
1 MB
5 slides
Work Schedule Overview Presentation
Keep your week perfectly organized with this clean and modern layout designed to simplify planning and scheduling. Ideal for presenting weekly goals, tasks, or project timelines, it helps teams stay aligned and productive. Fully customizable and compatible with PowerPoint, Keynote, and Google Slides for effortless professional presentations.
- Remove from favorites
Powerpoint Template
3 MB
Google Slides Template
External link
Keynote Template
5 MB
21 slides
Glimmer Product Roadmap Presentation
Illuminate your product's future with this vibrant glimmer-themed presentation template! Perfect for outlining your product roadmap, it allows you to present key milestones, features, and timelines in a visually engaging way. Captivate your audience and keep them informed about your exciting journey ahead. Compatible with PowerPoint, Keynote, and Google Slides.
- Remove from favorites
Powerpoint Template
1 MB
Google Slides Template
External link
Keynote Template
1 MB
7 slides
Progressive Growth Infographic
The Progressive Growth Infographic visually represents the stages of growth and development in a specific context, such as a business, project, or personal development. It is designed to convey the idea of progression, whether it be in revenue, skills, product development, or any area of improvement over time. This type of infographic is beneficial for illustrating a timeline of success, the step-by-step process of advancing through different stages, or the evolution of a concept from inception to maturity. It can be used in business presentations to investors or team members, educational materials for teaching growth concepts, or marketing materials to show company progress. The creative representation of growth using elements like plants, gears, or charts helps to engage viewers and make the concept of progression more tangible and relatable.
- Remove from favorites
Powerpoint Template
1 MB
Google Slides Template
External link
Keynote Template
1 MB
4 slides
Internal vs External Stakeholder Strategy Presentation
Clarify your stakeholder landscape with the Internal vs External Stakeholder Strategy Presentation. This slide features a clean quadrant design to distinguish internal and external stakeholders by priority or role. Ideal for strategy meetings, corporate communications, and stakeholder planning sessions. Fully customizable in PowerPoint, Keynote, and Google Slides.
- Remove from favorites
Powerpoint Template
1 MB
Google Slides Template
External link
Keynote Template
2 MB
10 slides
Cryptocurrency Market Trends
Highlight key movements in the crypto space with this 5-step 3D bar chart layout. Ideal for financial analysts, fintech startups, and blockchain professionals. Fully editable in PowerPoint, Keynote, or Google Slides—customize colors, text, and data to reflect your insights with precision.
- Remove from favorites
Powerpoint Template
1 MB
Google Slides Template
External link
Keynote Template
1 MB
3 slides
Customer Relationship Mapping Presentation
Visualize connections across your supply chain with the Customer Relationship Mapping Presentation. This slide helps illustrate how your group interacts with suppliers and customers, making it ideal for operational overviews, relationship management, or partner presentations. Fully editable in PowerPoint, Keynote, and Google Slides.
- Remove from favorites
Powerpoint Template
1 MB
Google Slides Template
External link
Keynote Template
2 MB
21 slides
Logos Content Marketing Pitch Deck Presentation
The Marketing Presentation Template is designed for impactful business storytelling. With 20+ slides, it features sections for company history, core values, target audience, competitive analysis, growth plans, and testimonials. Ideal for agencies and brands, it's fully customizable and compatible with PowerPoint, Keynote, and Google Slides. Perfect for pitching ideas effectively!


