


Features
- 6 Unique slides
- Fully editable and easy to edit in Microsoft Powerpoint, Keynote and Google Slides
- 16:9 widescreen layout
- Clean and professional designs
- Export to JPG, PDF or send by email


Do you have any questions?
Recommend


6 slides
6-Factor PESTEL Analysis Slide Deck Presentation
Spark fresh strategic insights with a vibrant hexagon layout that turns complex external factors into a clear, engaging story. This presentation helps teams explore key influences, compare trends, and guide smarter decision-making with confidence. Easy to edit and fully compatible with PowerPoint, Keynote, and Google Slides.


7 slides
Investment Group Infographic
An investment group, is a collective of individuals or entities that pool their financial resources to invest in various financial instruments or assets. This infographic template is a high-octane journey through the dynamic world of investments, designed to empower and energize your financial understanding. Prepare to take you audience through a thrilling ride through the investment cosmos, where your money takes center stage and financial growth is the ultimate goal. This Investment Infographic isn't just about numbers and charts, it's a thrilling expedition through the realms of finance.


7 slides
Loyalty Program Infographic Presentation Template
Loyalty programs are effective marketing tools that encourage consistent customers and offer an incentive for people to make more purchases from you. This template is perfect for you and your customers it helps present all your information in one presentation. This template is made to be displayed to your customers and workplace. You can use this to show your customers how they are given points or rewards every time they purchase from your store. The fun colorful illustrations used in this template are designed to help your customers understand how the program works and get them excited about it.


21 slides
Eureka Startup Growth Plan Presentation
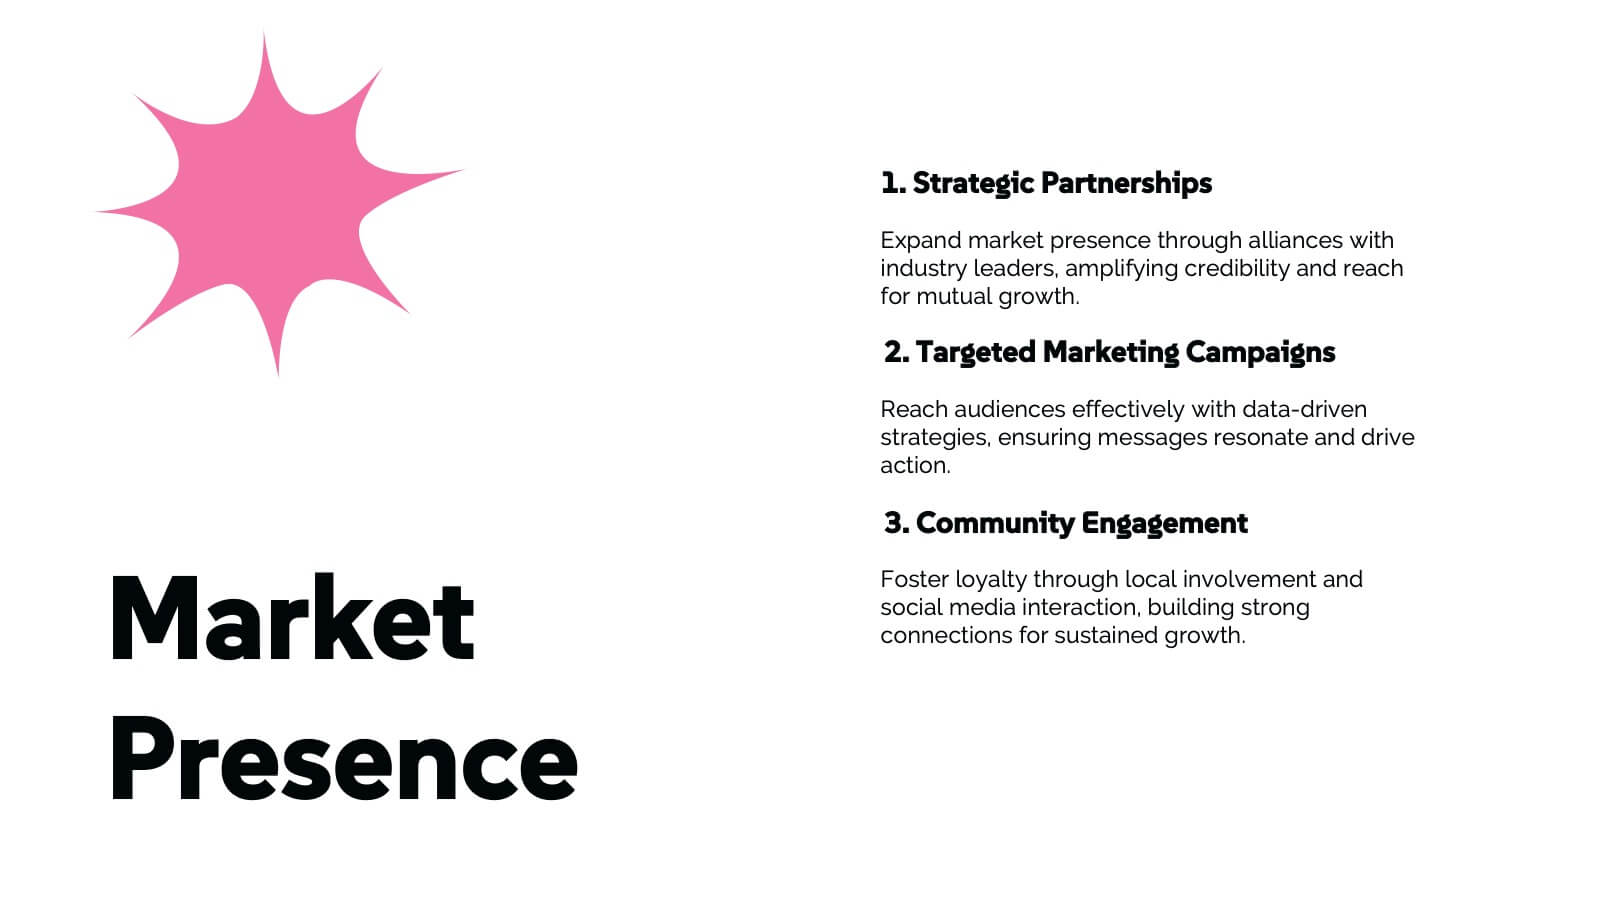
Present your startup growth plan effectively with this sleek, dynamic presentation template designed for innovators and entrepreneurs. With its vibrant color scheme and streamlined layout, it simplifies complex data, ensuring your audience stays engaged. The template offers slides for showcasing your mission, market analysis, business strategies, and revenue projections. Dedicated sections highlight team profiles, target audience insights, and funding goals, providing a comprehensive view of your growth trajectory. Use the timeline slides to map out milestones and visually articulate your progress. Fully customizable in PowerPoint, Google Slides, and Keynote, it adapts effortlessly to your specific needs, enabling you to communicate your vision with clarity. Ideal for pitching to investors, presenting at conferences, or internal strategic planning, this template equips you with the tools to drive home your ideas with professionalism and style. Empower your growth journey with a presentation that reflects your startup’s potential.


6 slides
Cyber Security Jobs Infographics
The "Cyber Security Jobs" infographic template, designed for PowerPoint, Keynote, and Google Slides, is a vital tool for career counselors, educational institutions, and cyber security professionals. This modern and informative template is specifically crafted to highlight career opportunities and pathways in the field of cyber security. Featuring key elements such as various job roles in cyber security, skill requirements, and career growth opportunities, the template is structured to provide a comprehensive overview of the industry. Its layout is ideal for presenting the diverse range of careers available in cyber security, making it an invaluable resource for career guidance and professional development presentations. The design is tech-themed with a color scheme that includes shades of blue, black, and gray. This not only gives the template a professional and engaging look but also reflects the technological and security aspects of the field. Whether it's used in job fairs, educational seminars, or corporate training sessions, this template ensures that information about cyber security jobs is presented clearly, effectively, and attractively.


5 slides
Startup Growth Roadmap and Milestones Presentation
Present your startup journey clearly with the Startup Growth Roadmap and Milestones Presentation. This timeline-style layout breaks down your key phases, from initial concept to market traction. Ideal for investor decks, pitch presentations, or internal planning. Fully editable in PowerPoint, Canva, and Google Slides for seamless customization.


5 slides
Medical Anatomy Chart Slide Presentation
Present body systems or organ-related topics with this anatomy chart slide. Designed with pinpoint callouts linked to a human silhouette, it helps explain up to four body parts or functions. Ideal for health, biology, or patient education presentations. Fully editable in PowerPoint, Keynote, or Google Slides for clean, visual storytelling.


6 slides
Resource Allocation and PM Strategy Deck Presentation
Break down project resources and team strategies using this dynamic visual dashboard. Track allocation, effort levels, or progress across roles in a clean, easy-to-follow layout. Fully editable in PowerPoint, Keynote, and Google Slides, this template helps project managers communicate priorities and responsibilities with clarity and impact.


21 slides
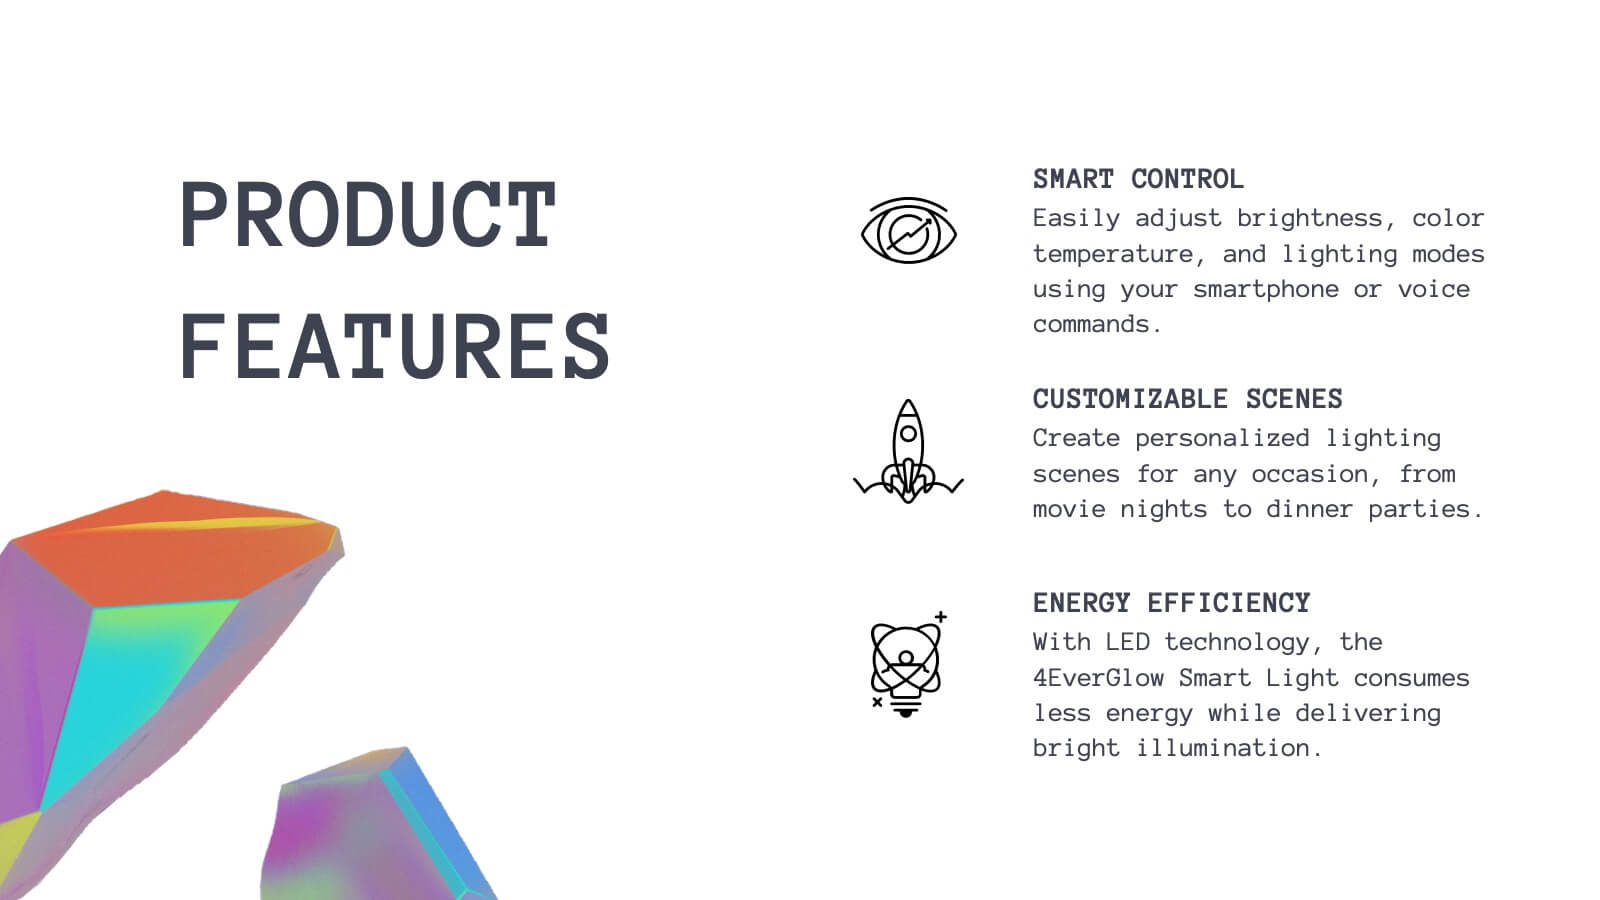
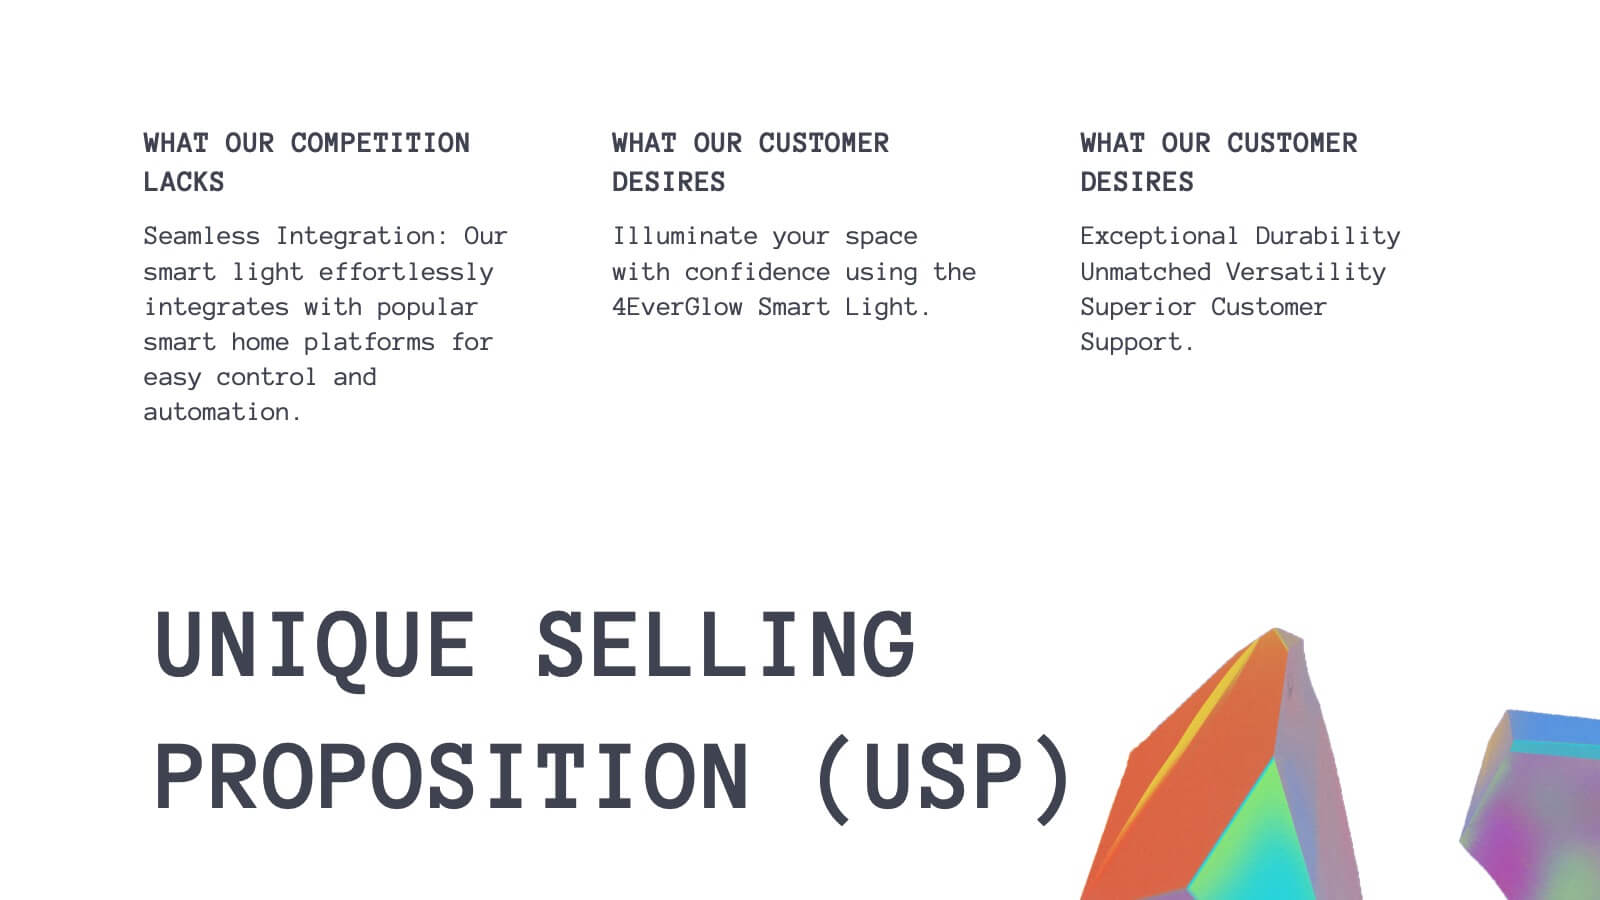
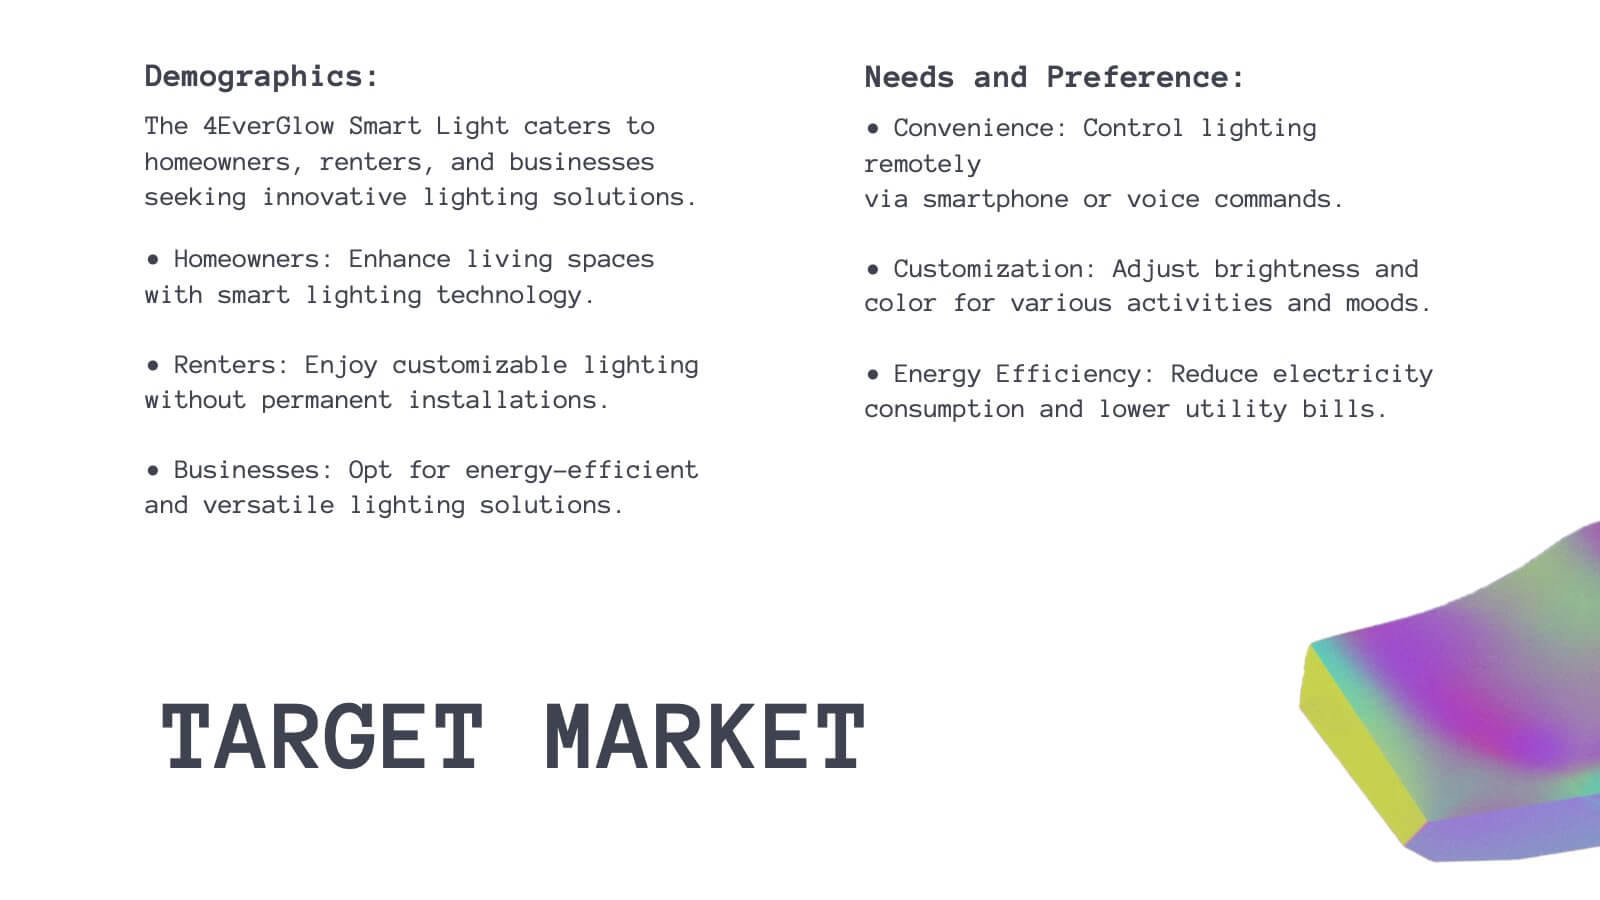
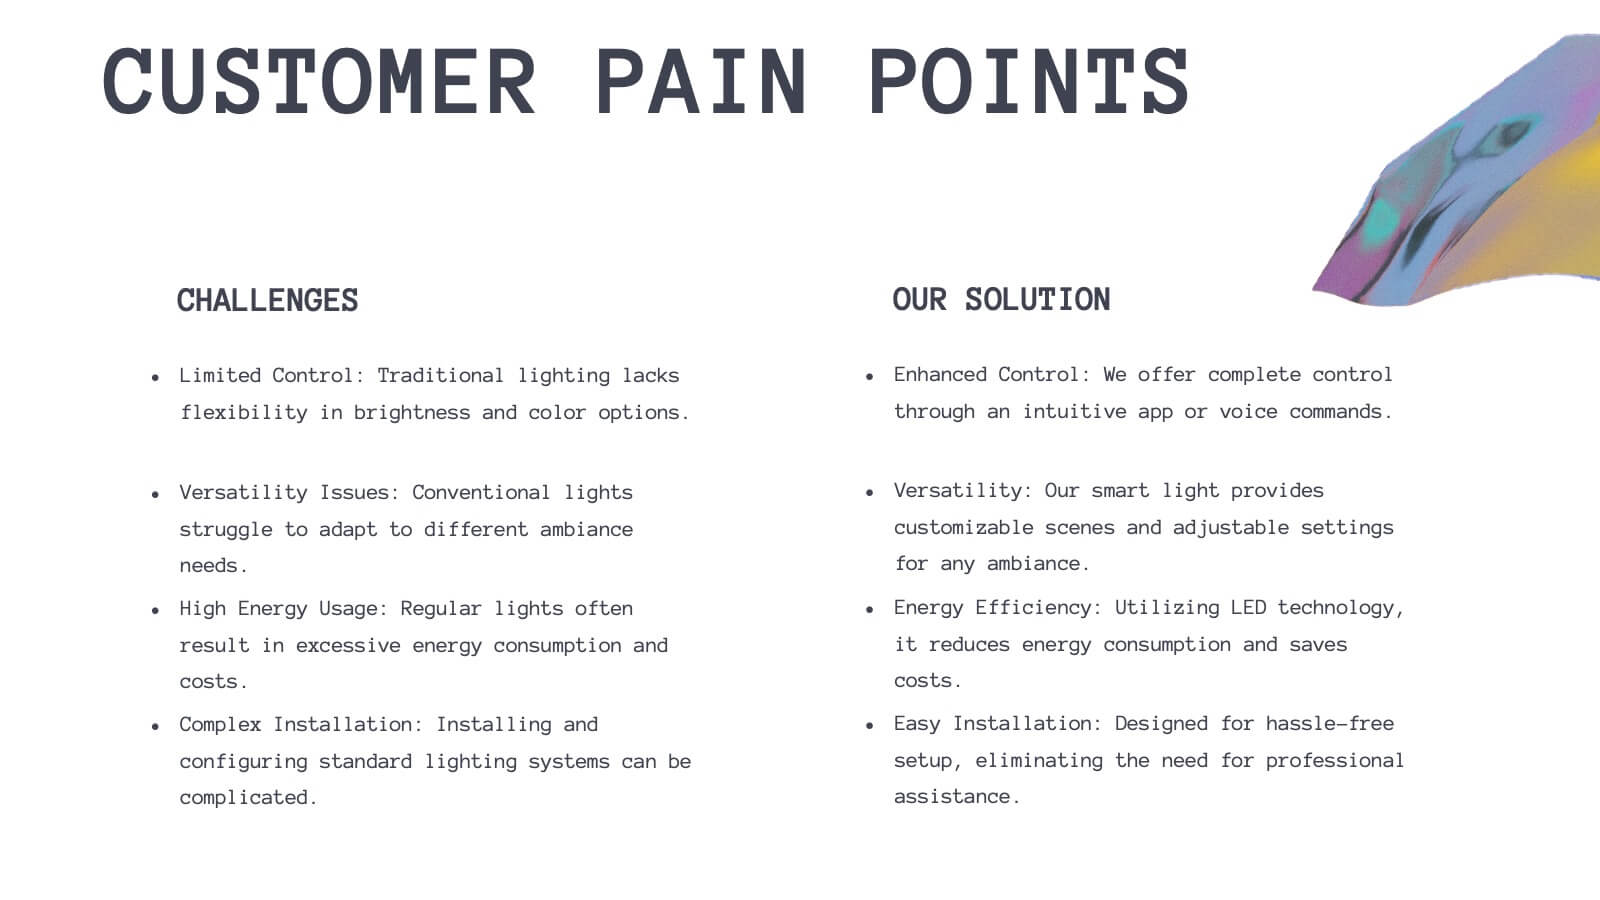
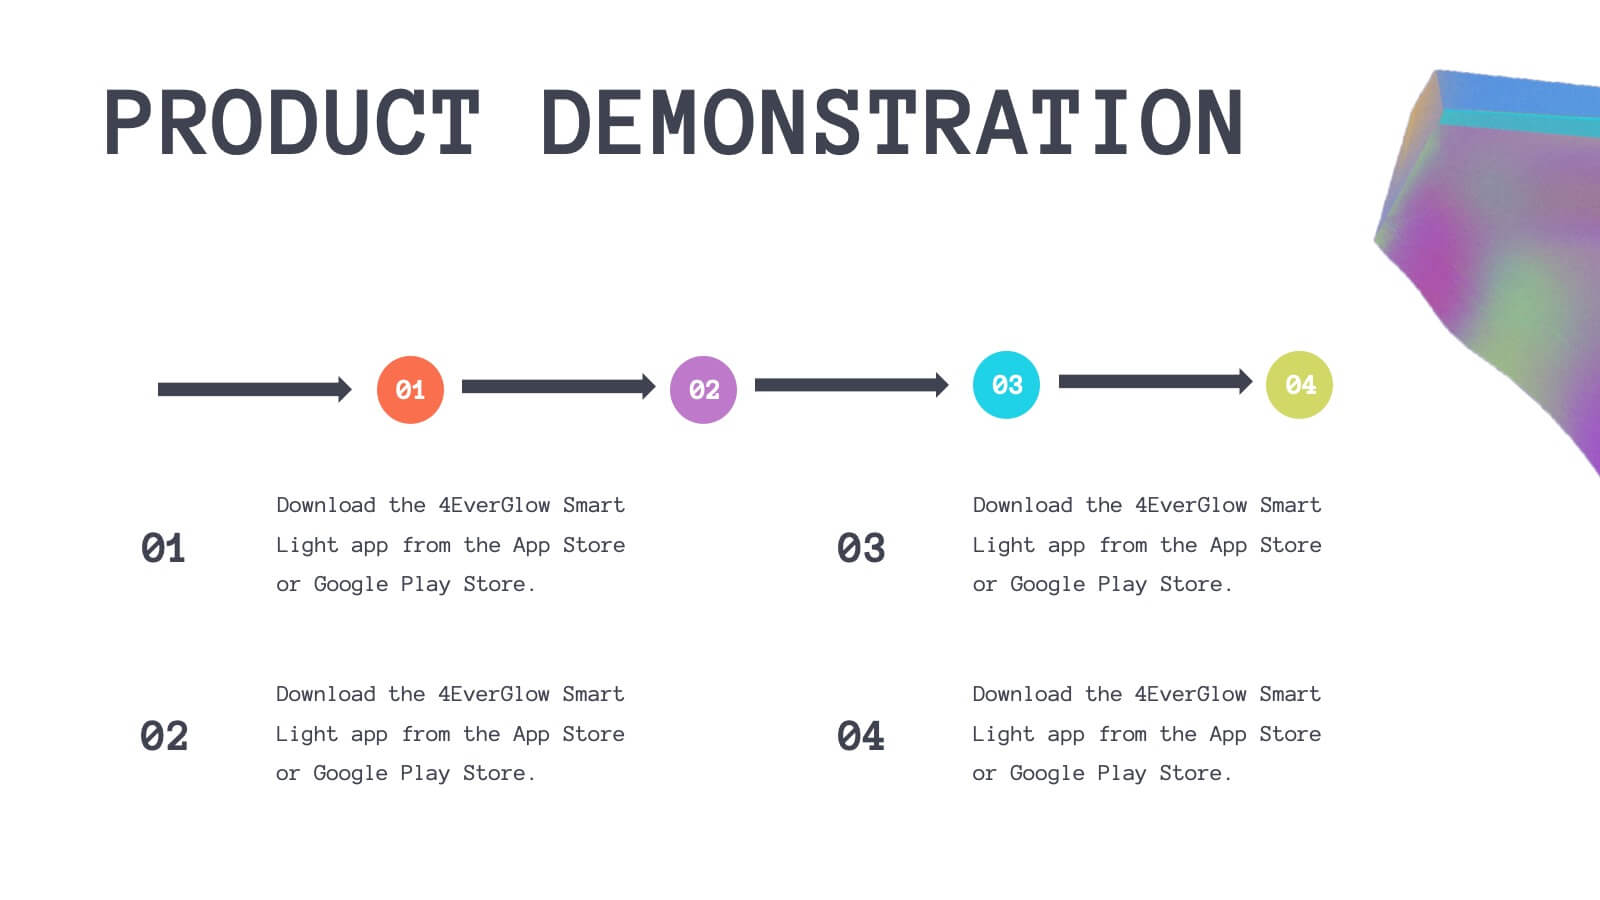
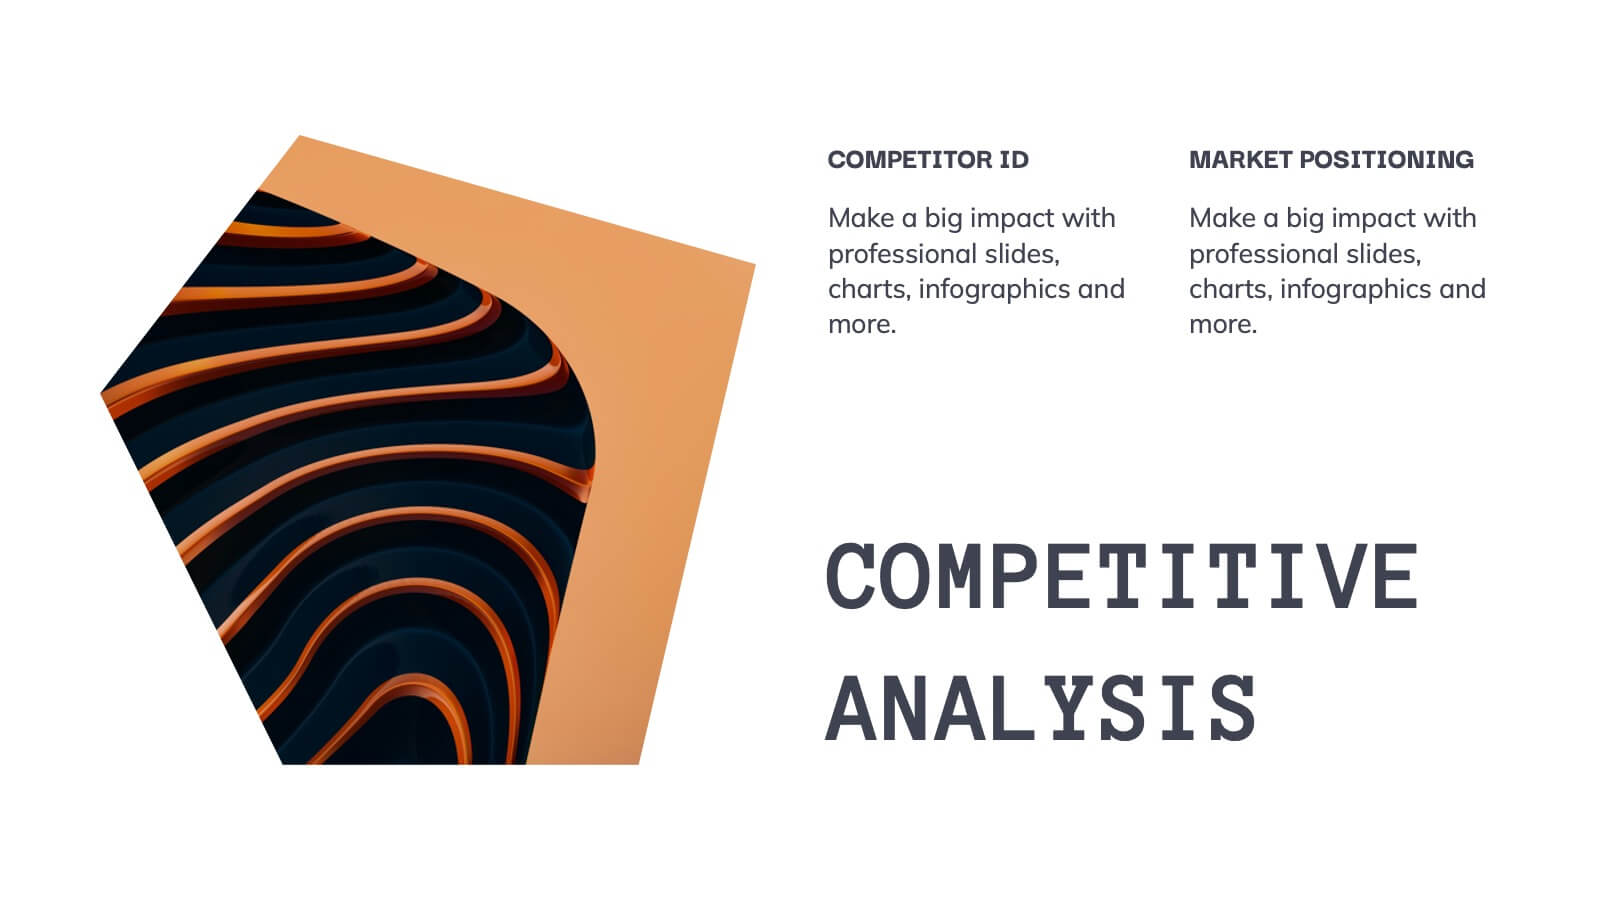
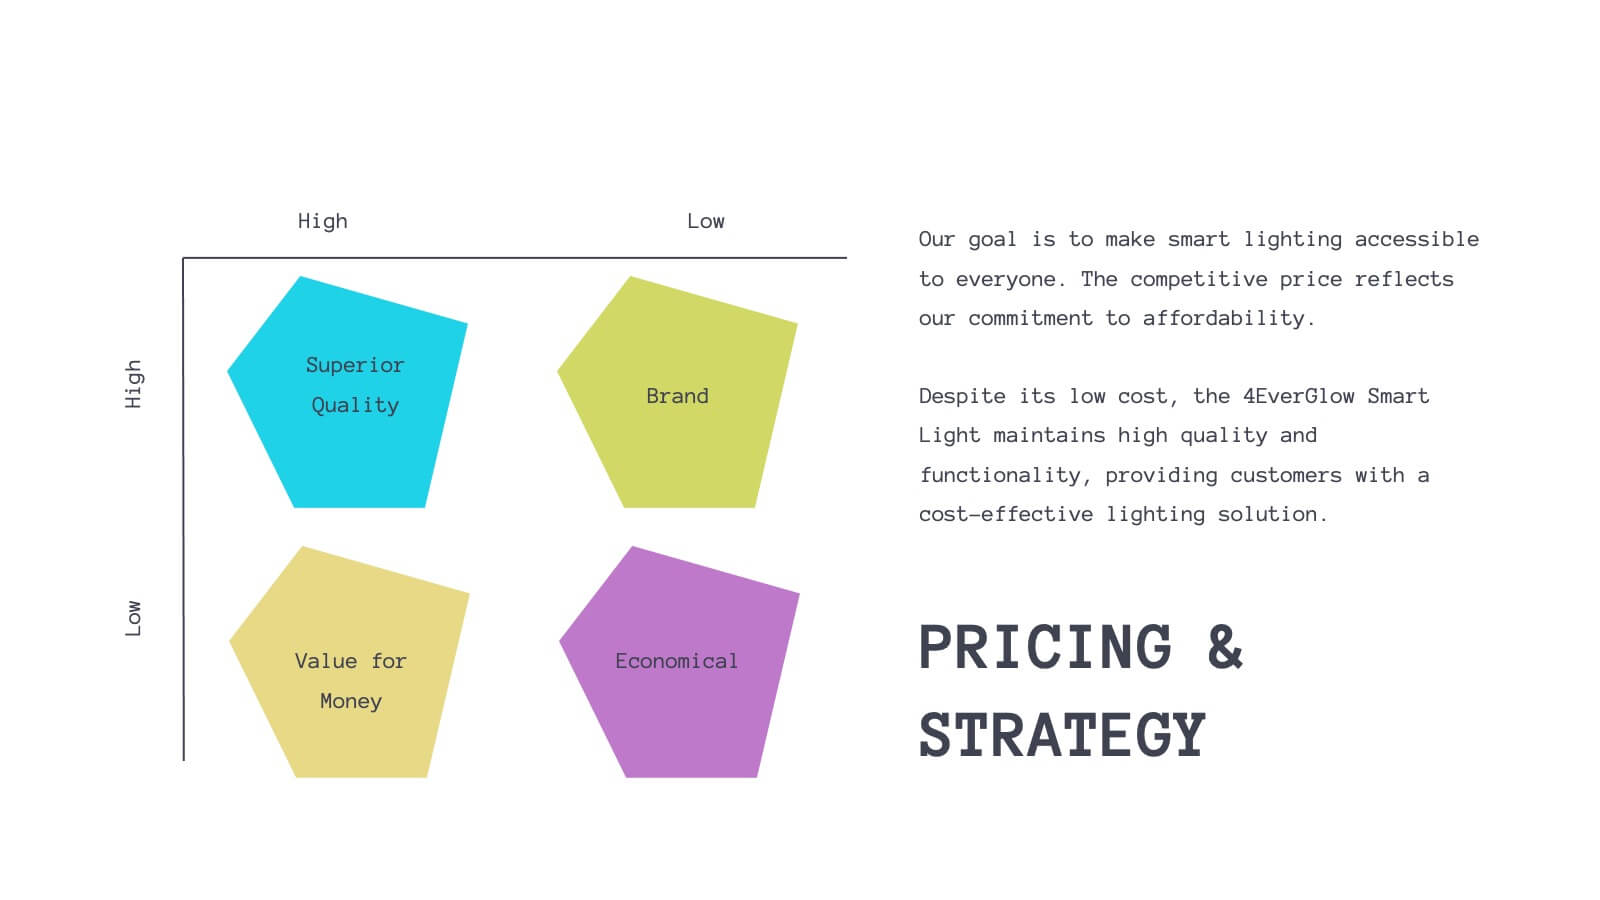
Luster Product Roadmap Presentation
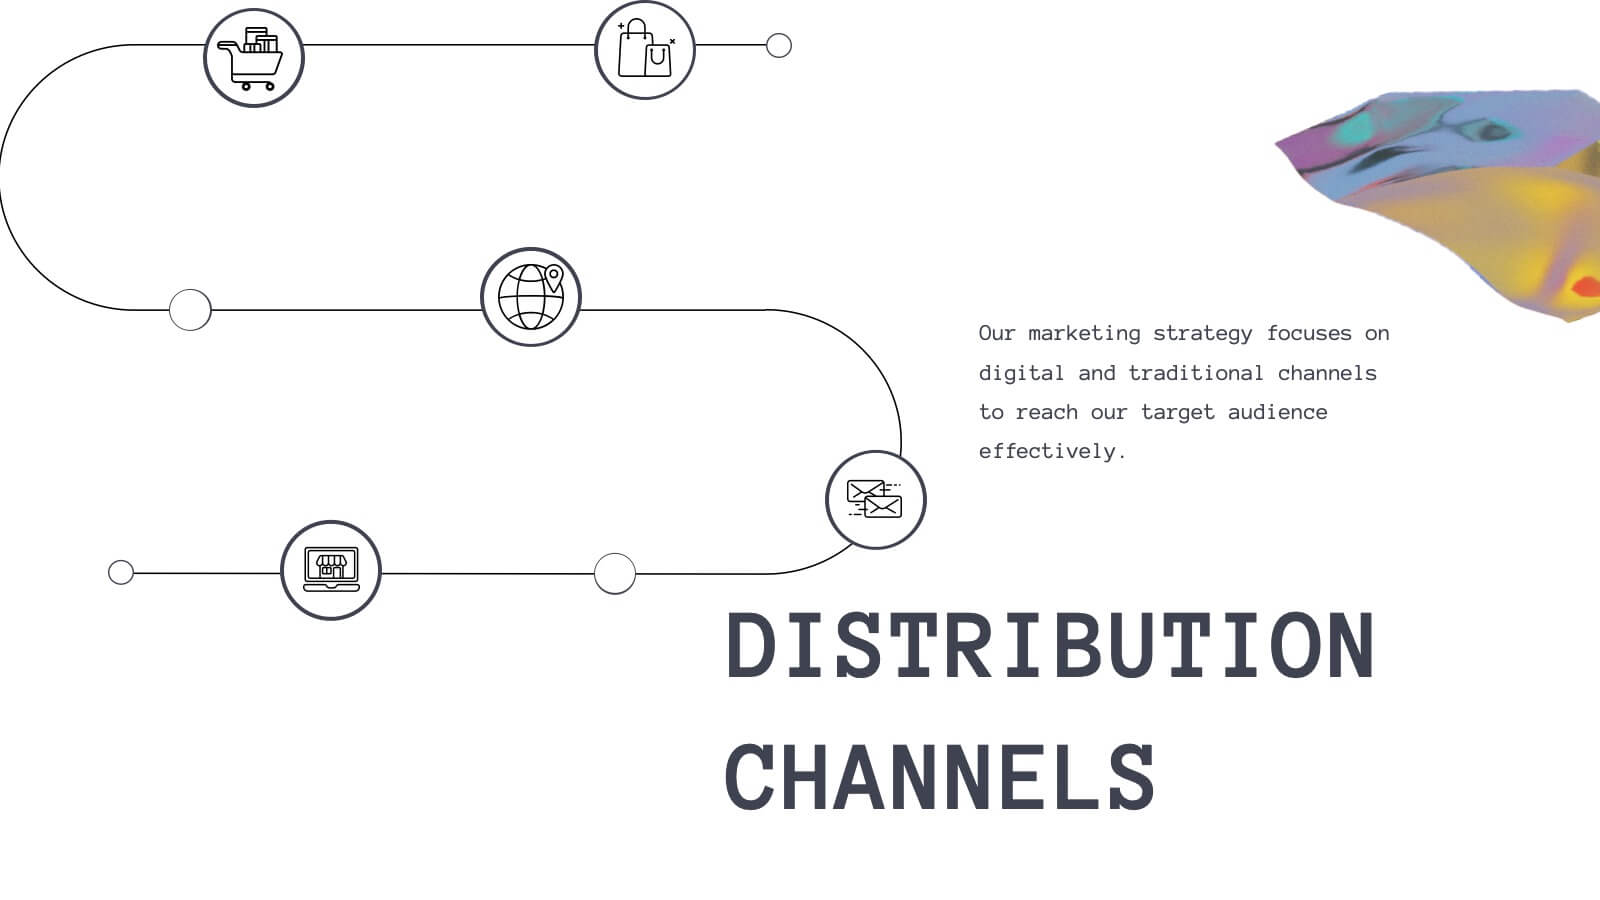
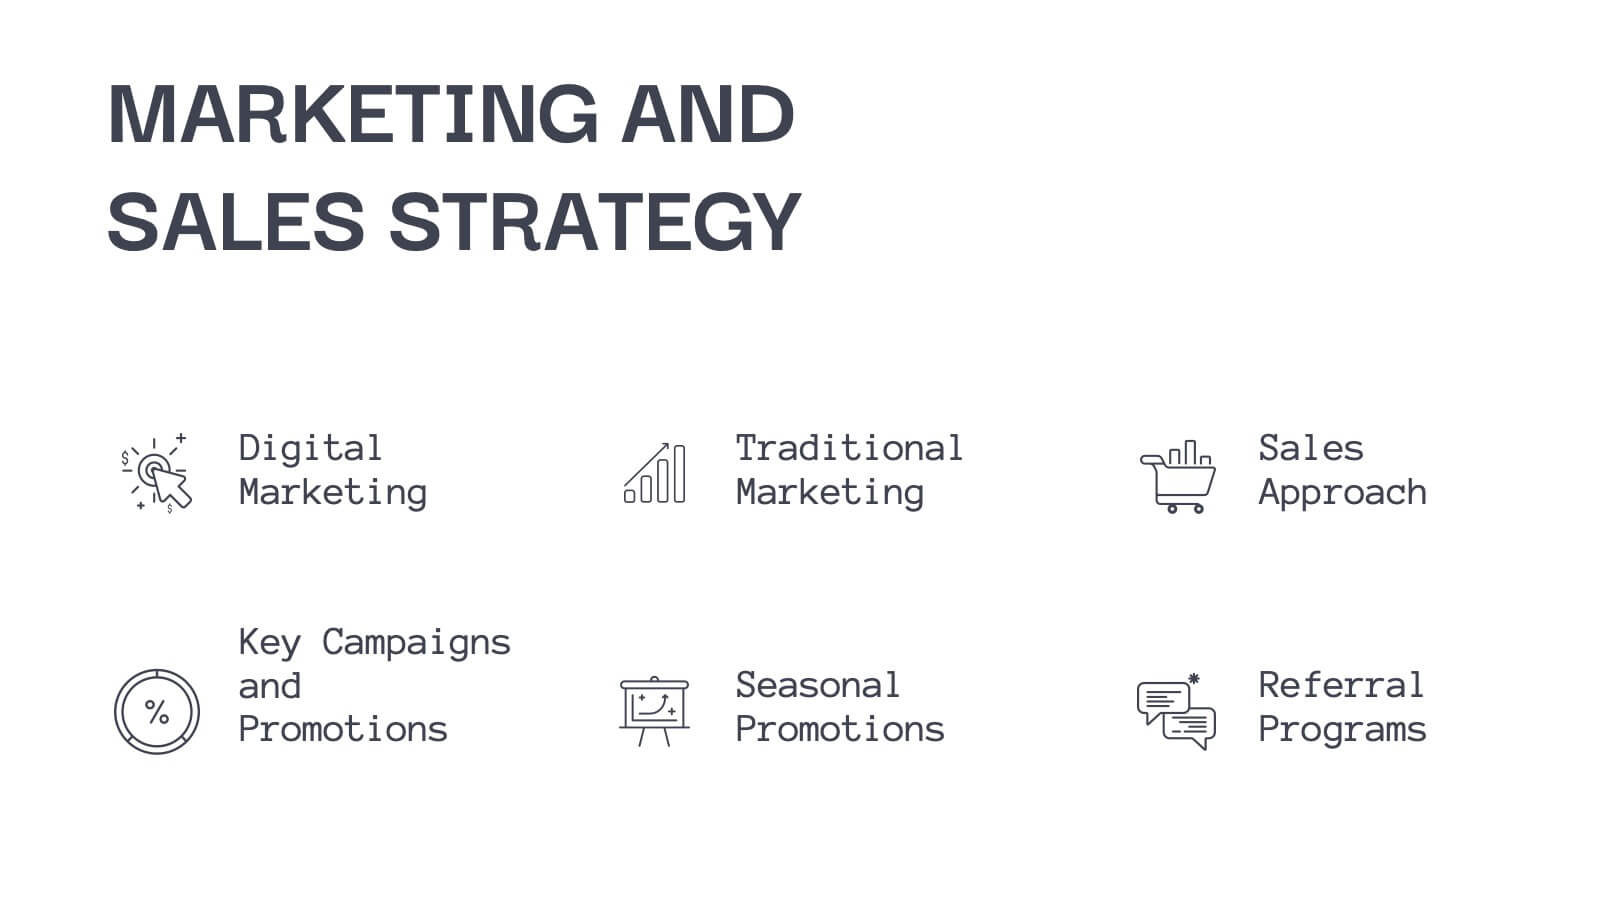
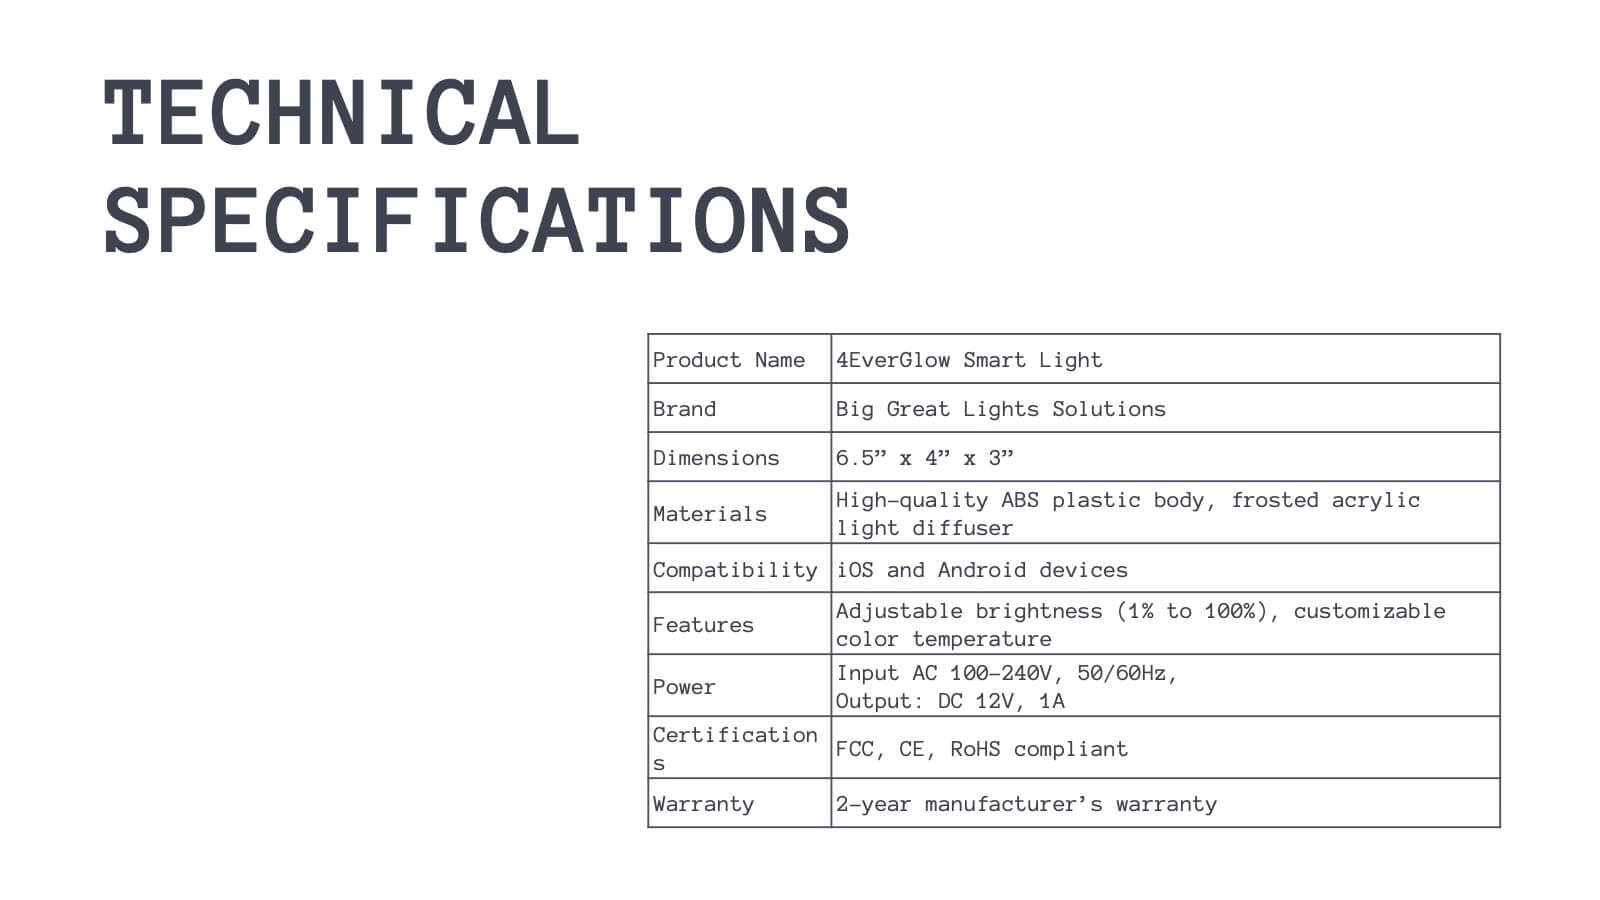
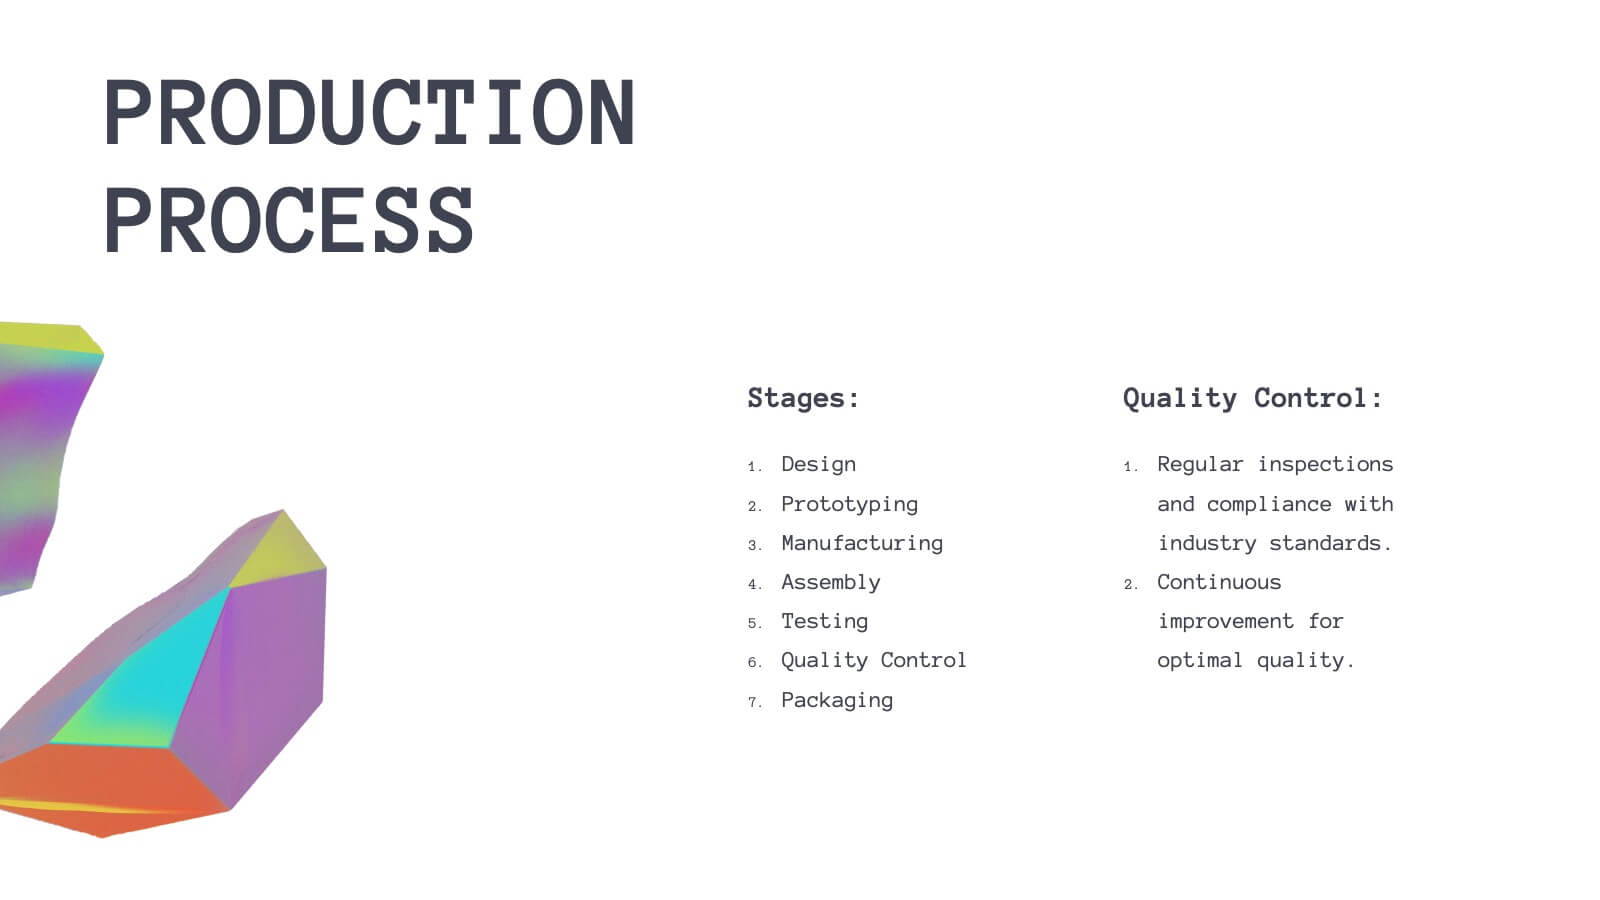
Bring your product journey to life with this vibrant, modern presentation template! Perfect for guiding your audience through product features, customer pain points, and competitive analysis, it’s designed for maximum clarity and engagement. Whether you’re showcasing technical specs or marketing strategies, this template fits all your needs. Compatible with PowerPoint, Keynote, and Google Slides.


7 slides
Loves Travel Infographic Presentation
Travel is an opportunity to get out of our comfort zones and be inspired to try new things, it changes our perspective on the world. Use this template to give your audience an overview of a trip and prepare them for what they will be experiencing. This template features an infographic style design, with plenty of room to describe the locations and activities as well as instructions and tips. Build your own infographic with this template, and add it to your presentations. You can easily add your own content in PowerPoint, Keynote, or Google slides and turn it into a fun presentation in minutes.


26 slides
Venture Capital Presentation
Perfect for investors and startups, this Venture Capital presentation template is designed to effectively communicate the nuances of funding and investment strategies. Its professional layout, highlighted with bold colors and clear graphics, sets the stage for impactful discussions on the intricacies of venture capital. The slides are structured to guide you through every aspect of the investment journey, from introducing key players to dissecting financial forecasts and market analyses. Engaging visuals aid in illustrating company growth potential, funding stages, and investor expectations, while specialized slides enable a deep dive into competitive comparisons and future financial projections. This template, adaptable across PowerPoint, Keynote, and Google Slides, is an essential tool for anyone in the venture capital arena looking to present their ideas with confidence and precision.


5 slides
How To Stop Fake News Infographics
Dive into the realm of media literacy with our how to stop fake news infographics. Crafted with striking shades of trust-inspiring blues and engaging, colorful accents, this vertical, informative, and creatively styled template is a beacon for journalists, educators, social media users, and advocates of truth. It is specifically designed to aid in the identification, debunking, and prevention of the spread of misinformation. Compatible with Powerpoint, Keynote, and Google Slides. The infographic encapsulates compelling graphics, easy-to-understand icons, and versatile image placeholders pertinent to the battle against fake news.


5 slides
Pet Clinic Business Strategy Presentation
Enhance your pet clinic's approach with our Pet Clinic Business Strategy presentation template. This layout is expertly designed to outline your clinic’s key strategies and enhance your operational excellence, making it perfect for meetings, stakeholder presentations, and strategic workshops.


7 slides
Innovation Technology Infographics
Innovation technology refers to the application of technology or the use of innovative approaches to create new products, services, processes, or business models. This infographic template is designed to showcase the cutting-edge technologies shaping our future. Let the vibrant visuals and insightful content guide you through the exciting realm of innovation and technology. Compatible with Powerpoint, Keynote, and Google Slides. Fully customizable, explore this infographic and step into the future. The visuals are designed to ignite your imagination and enlighten your audience about the limitless potential of innovation and technology.


6 slides
Role-Based Responsibility Matrix Presentation
Clarify team roles and accountability with this structured responsibility matrix. Perfect for RACI models and project task alignment, this template features customizable categories, color-coded rows, and editable role labels. Ideal for project managers and team leads. Fully compatible with PowerPoint, Google Slides, and Keynote for easy customization and collaboration.


6 slides
Target Audience Demographics Presentation
The "Target Audience Demographics" presentation employs an innovative spiral chart design to display key demographic data in an engaging and easy-to-understand format. Each segment of the spiral represents a different demographic characteristic with percentages clearly marked, enabling quick insights into audience composition. This design is well-suited for marketing presentations or any scenario where understanding audience segments is crucial. The placeholders are conveniently set up to add specific details or insights, making the template not only visually appealing but also highly functional for strategic planning and audience analysis.


21 slides
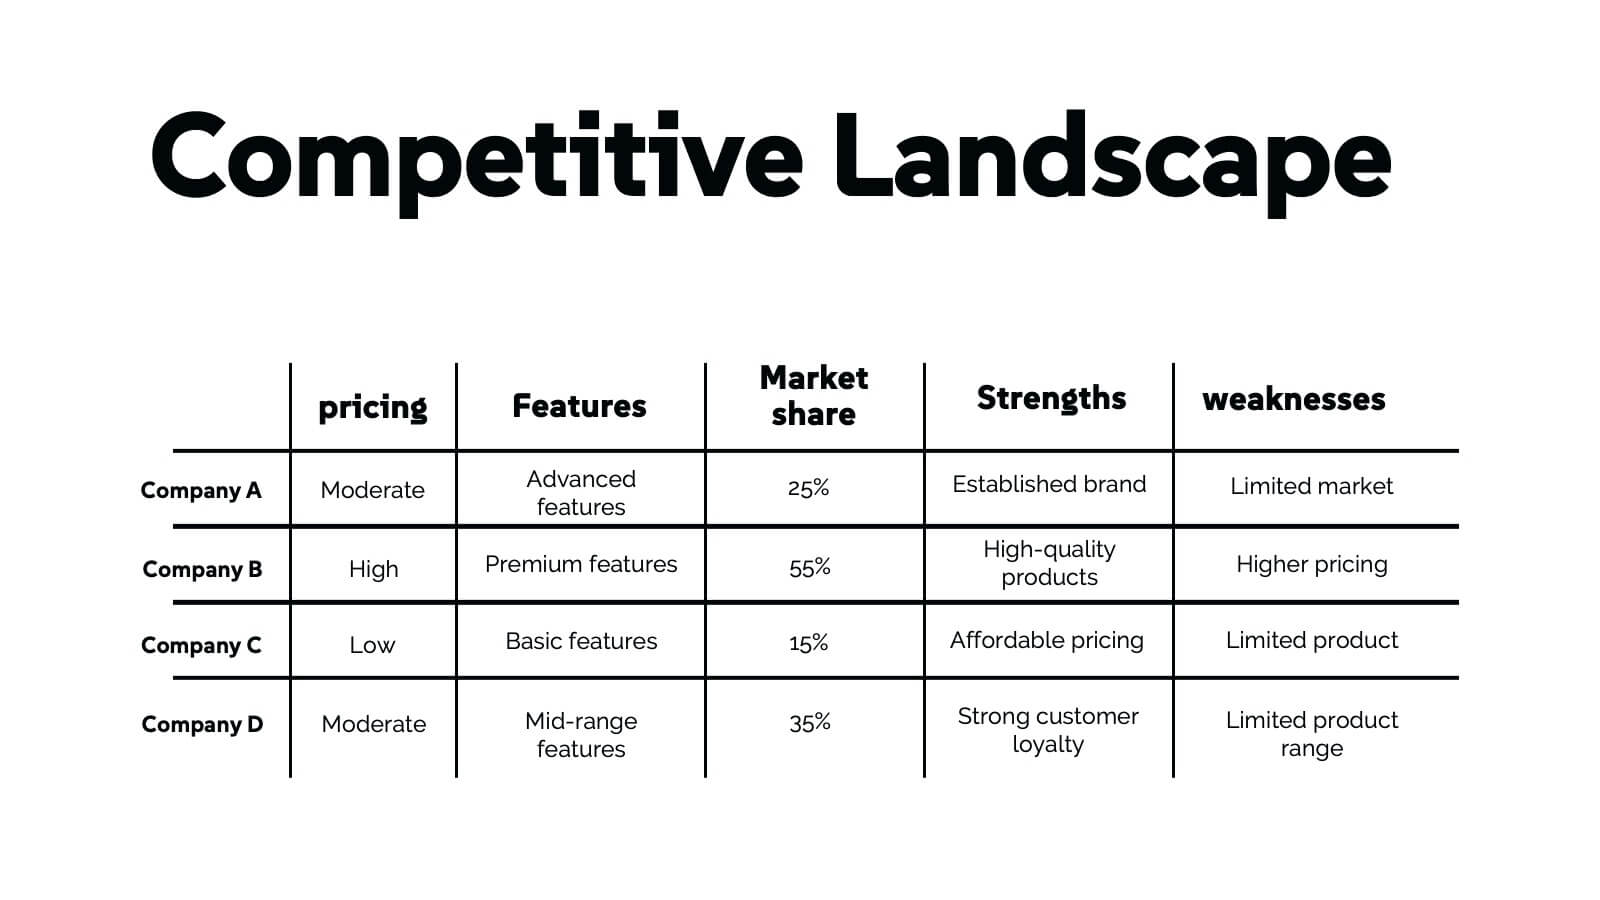
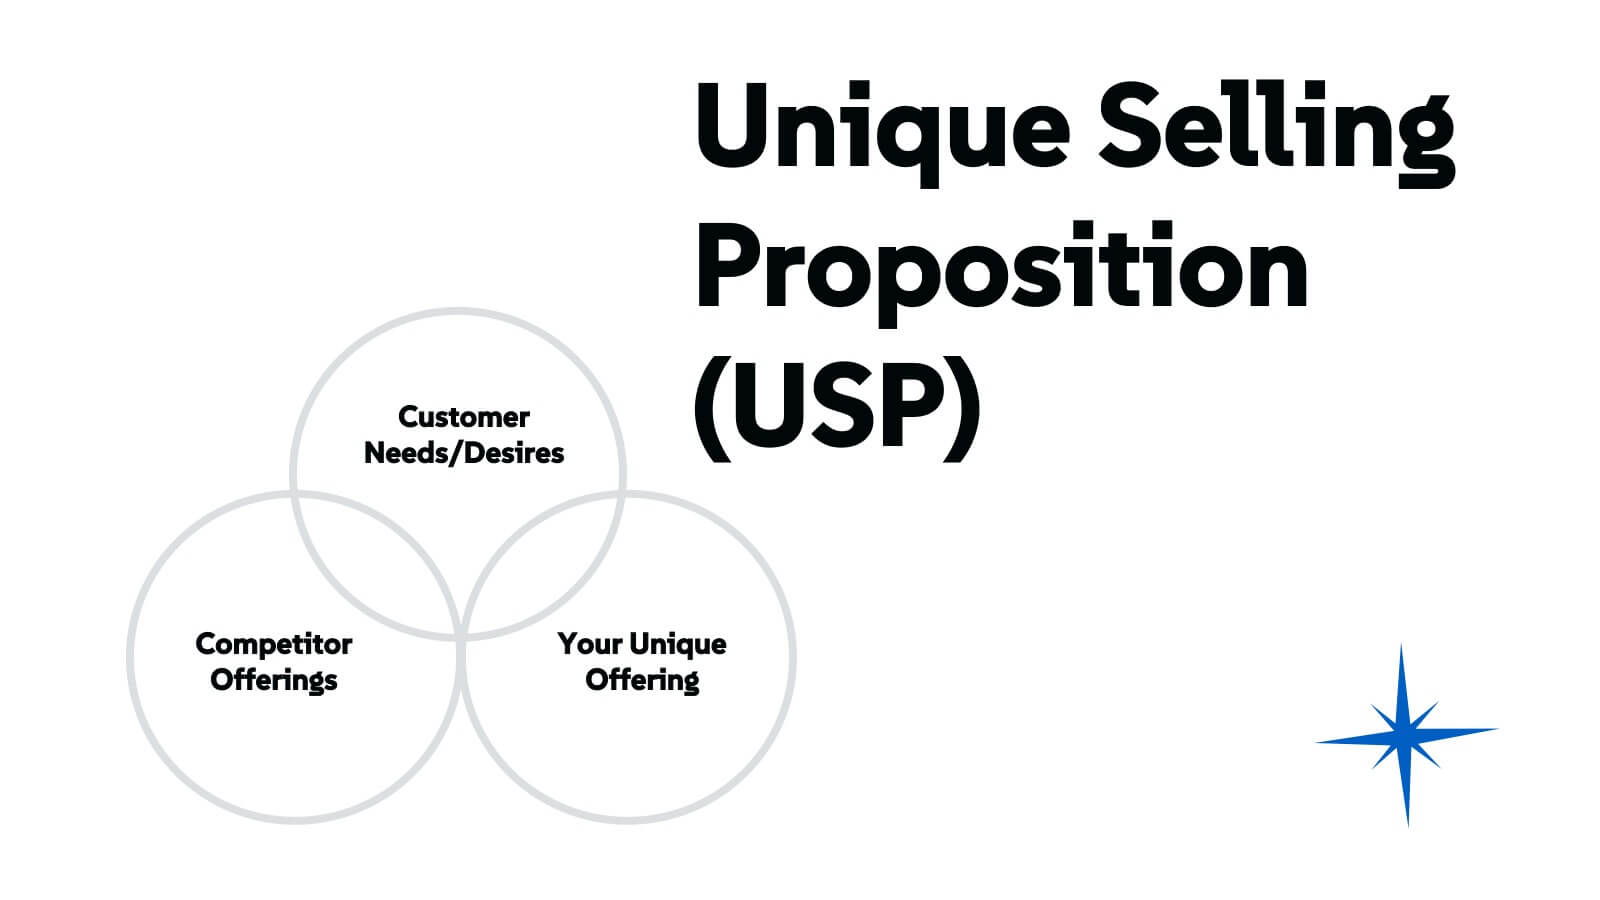
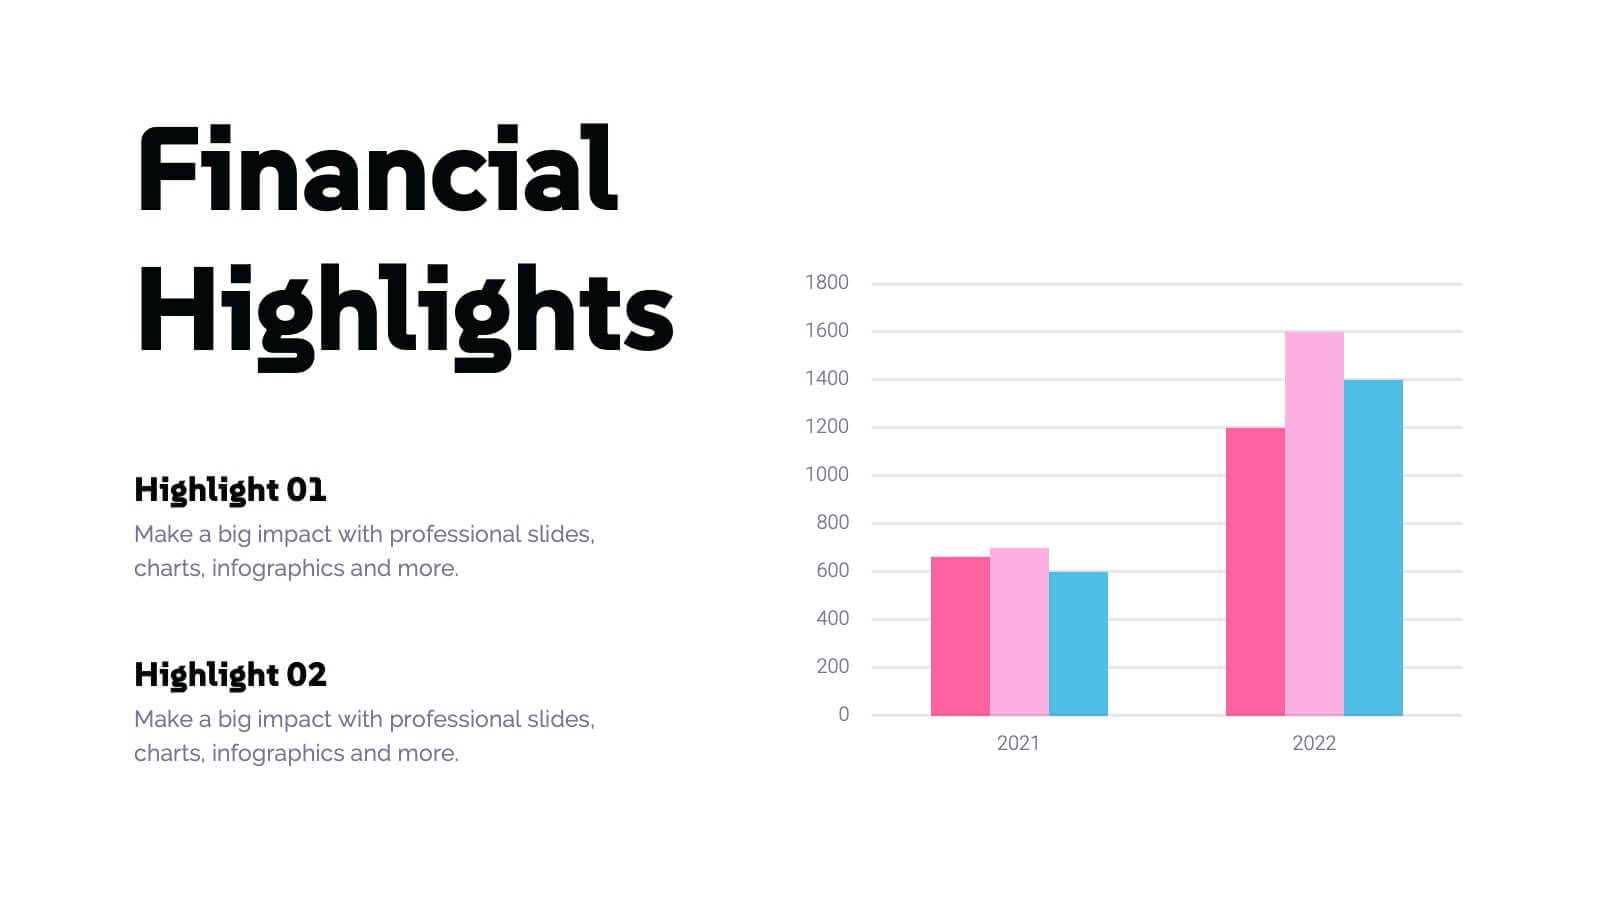
Chimera Marketing Campaign Presentation
Create a visually engaging digital marketing presentation with this modern template! Covering essential topics like company history, market presence, target audience, and competitive landscape, this template helps you showcase your marketing strategies effectively. Fully customizable, it works seamlessly with PowerPoint, Keynote, and Google Slides for professional presentations every time.