


Features
- 21 Unique slides
- Fully editable and easy to edit in Microsoft Powerpoint, Keynote and Google Slides
- 16:9 widescreen layout
- Clean and professional designs
- Export to JPG, PDF or send by email


Do you have any questions?
Recommend


3 slides
Clean Water Initiative Overview Presentation
Communicate sustainability goals with this clean, modern layout featuring water droplet and faucet visuals. Ideal for summarizing three core focus areas of your environmental or nonprofit program. The minimalist design keeps attention on your key points. Fully editable and compatible with PowerPoint, Keynote, and Google Slides for easy customization.


6 slides
Root Cause Analysis of Key Problems Presentation
Get to the heart of business issues with this Root Cause Analysis of Key Problems presentation. This template helps you break down complex challenges into actionable components: Who, What, When, Where, Why, and How. Clean, color-coded arrows ensure clarity. Ideal for strategic reviews and process optimization. Fully editable in Canva, PowerPoint, and Google Slides.


21 slides
Duskflare Corporate Strategy Proposal Presentation
Present your corporate strategy effectively with this comprehensive template, featuring sections on market trends, SWOT analysis, strategic initiatives, and risk management. Designed for clarity and impact, it’s ideal for outlining high-level goals and action plans. Compatible with PowerPoint, Keynote, and Google Slides for seamless presentations.


20 slides
Nightshade Design Portfolio Presentation
The Design Portfolio Presentation Template offers 20 slides to showcase your creative work, including design briefs, elements, processes, and feedback. Perfect for professionals to highlight projects with a modern, vibrant layout. Fully editable and compatible with PowerPoint, Keynote, and Google Slides.


8 slides
Green Business Sustainability Strategy Presentation
Promote eco-friendly business strategies with the Green Business Sustainability Strategy infographic. Featuring a circular flow diagram, this template highlights key sustainable initiatives, resource management, and environmental impact strategies. Fully editable and compatible with PowerPoint, Keynote, and Google Slides.


6 slides
Six Sigma DMAIC Cycle Overview Presentation
Present each phase of the DMAIC methodology with the Six Sigma DMAIC Cycle Overview Presentation. This clean and professional layout walks through Define, Measure, Analyze, Improve, and Control in a clear, easy-to-follow structure. Perfect for Six Sigma professionals, quality managers, and operational teams. Fully editable in Canva, PowerPoint, Keynote, and Google Slides.


6 slides
Checklist and To-Do List Presentation
Bring order and elegance to your presentation with this sleek, easy-to-edit layout perfect for summarizing ideas, listing features, or outlining processes. Its balanced design ensures clarity and flow while keeping your slides visually engaging. Fully compatible with PowerPoint, Keynote, and Google Slides for effortless customization and professional results.


3 slides
Medical Report Summary and Review Deck Presentation
Present health data clearly with this Medical Report Summary and Review Deck. Designed for healthcare professionals, this layout features checklist icons, charts, and clinical visuals to highlight reports or patient insights. Fully editable in PowerPoint, Keynote, and Google Slides, it ensures your medical updates remain professional, concise, and easy to follow.


28 slides
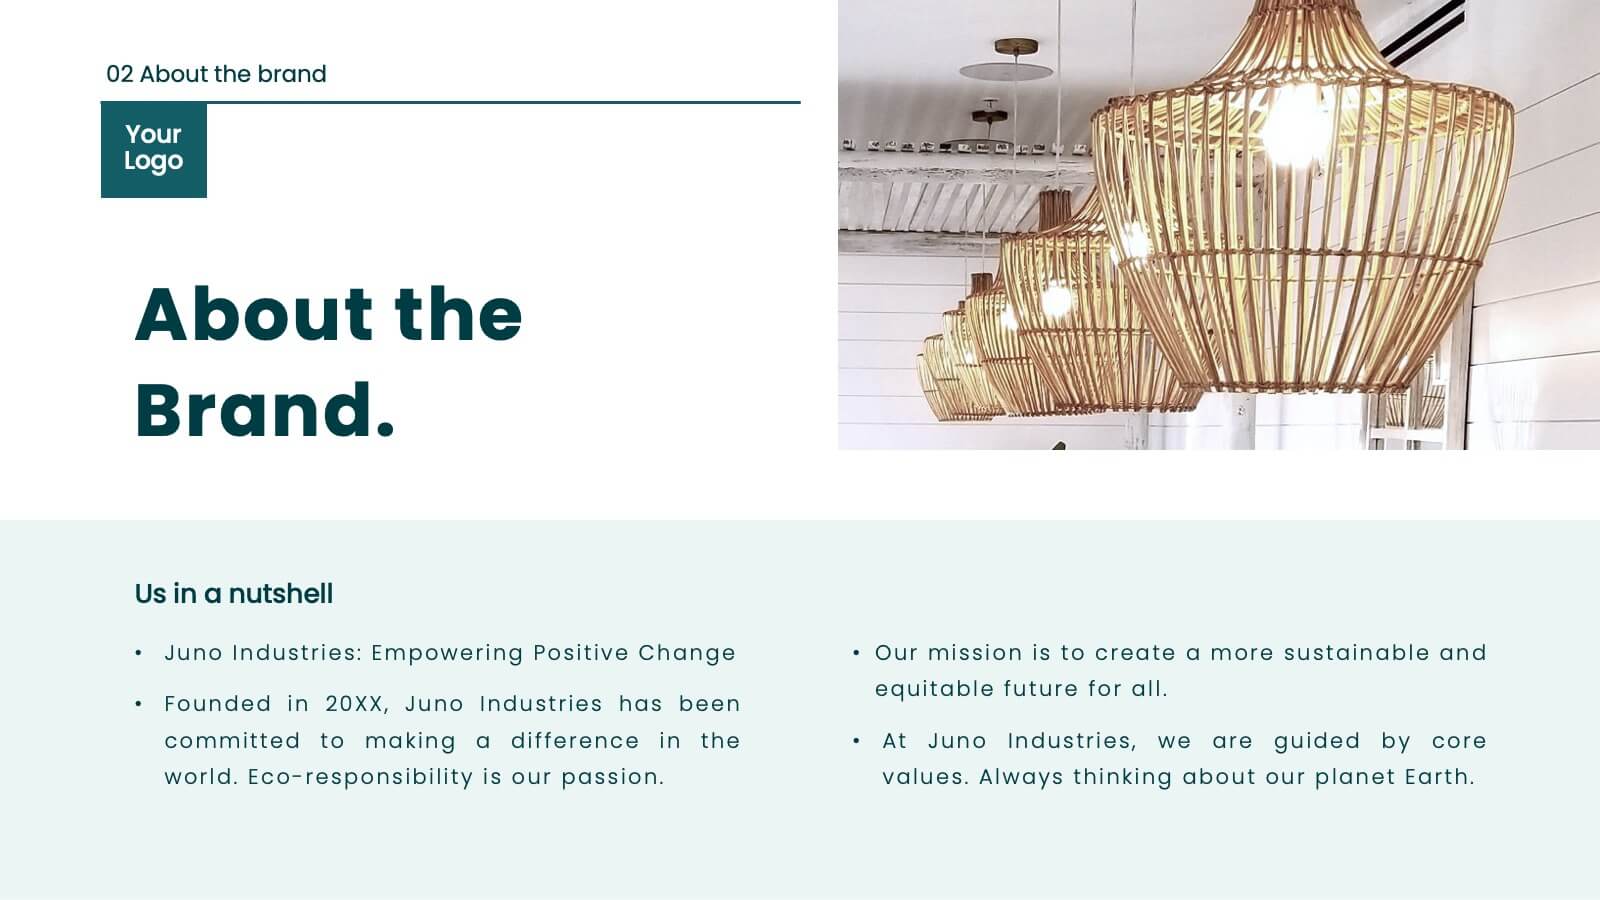
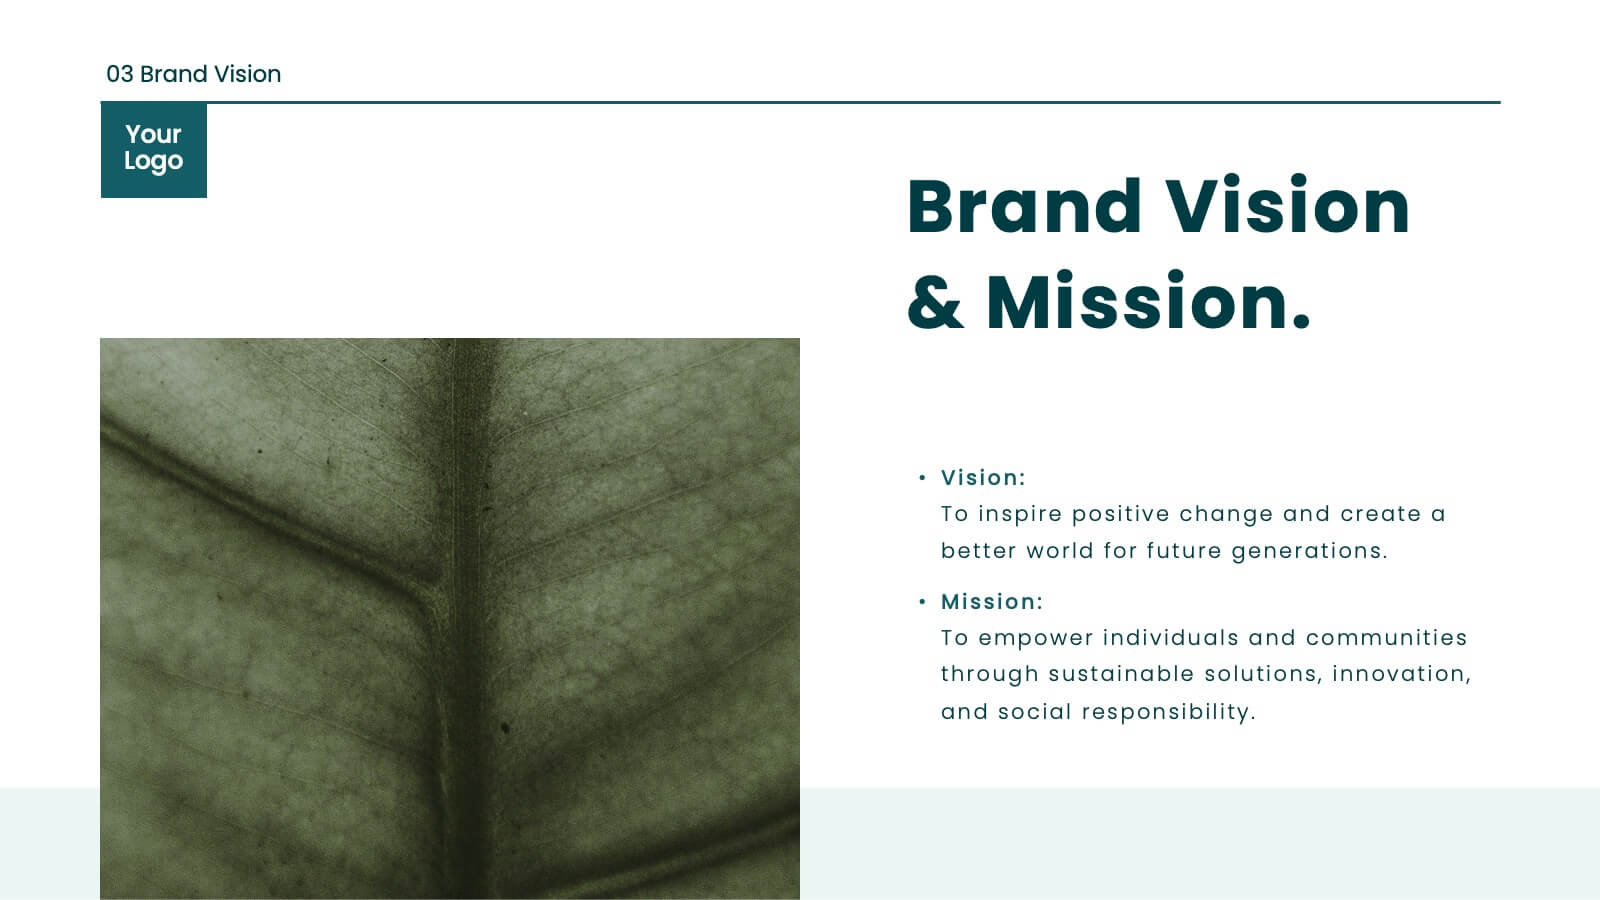
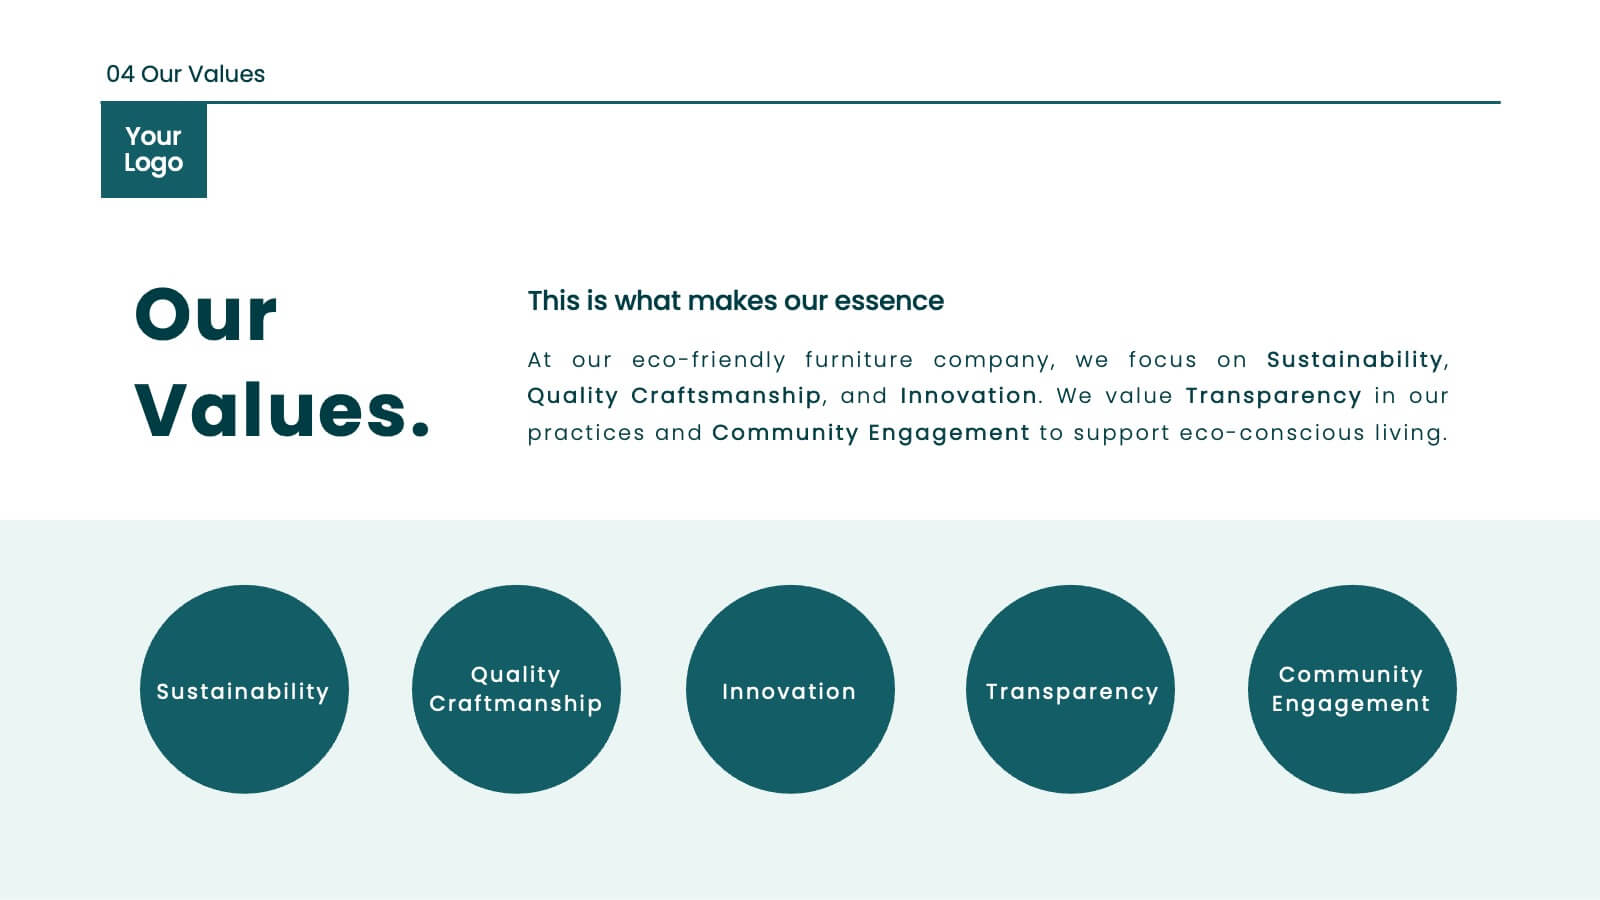
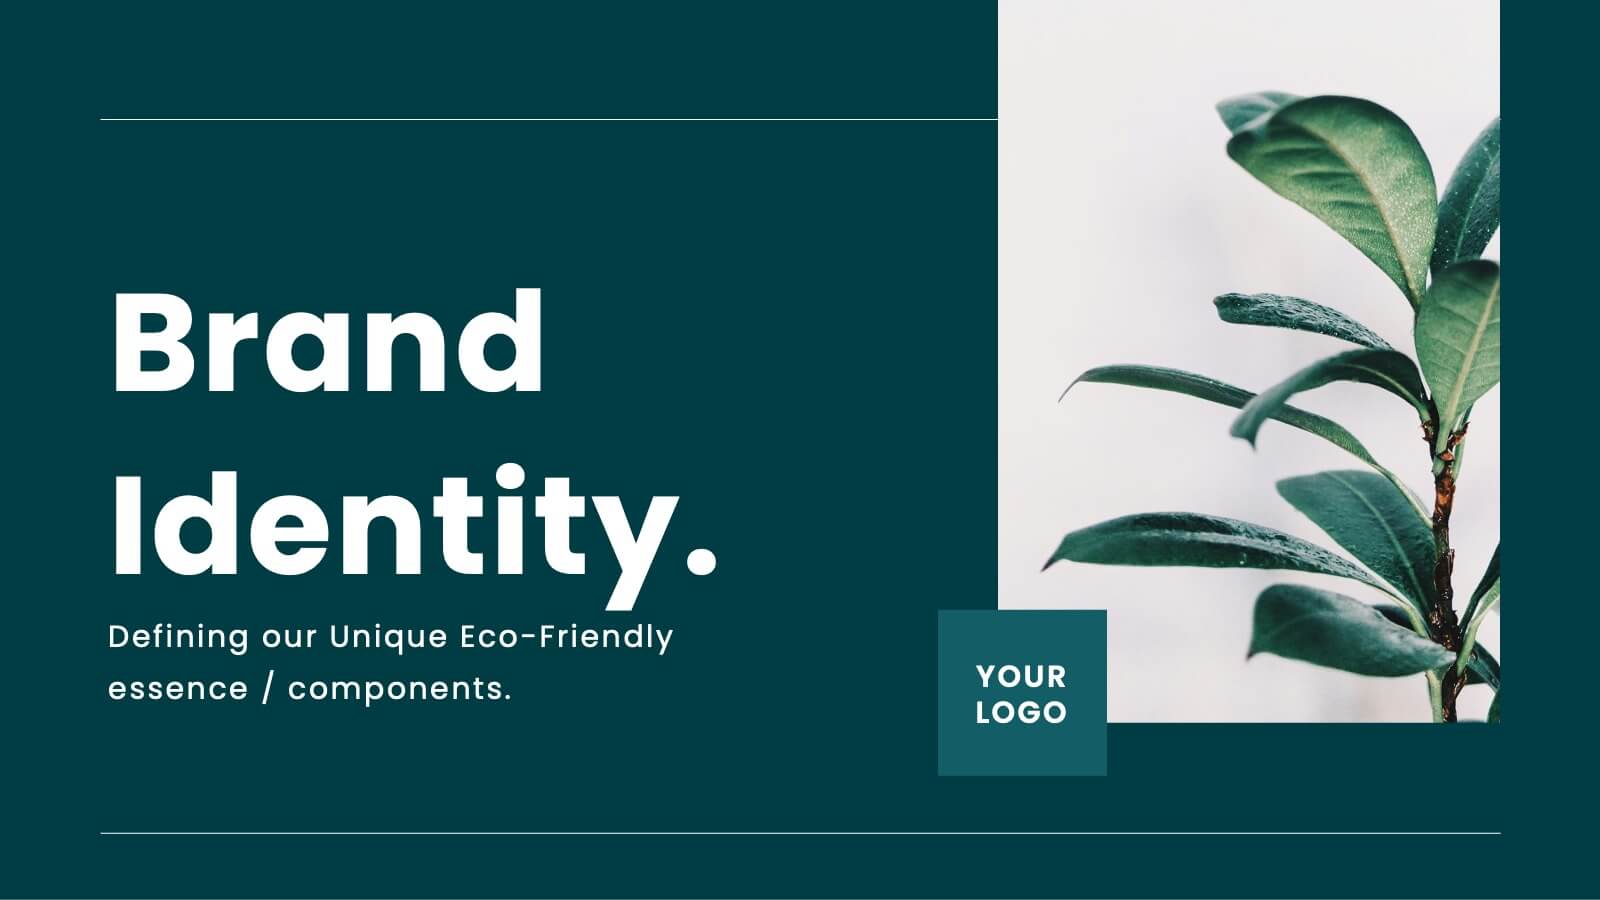
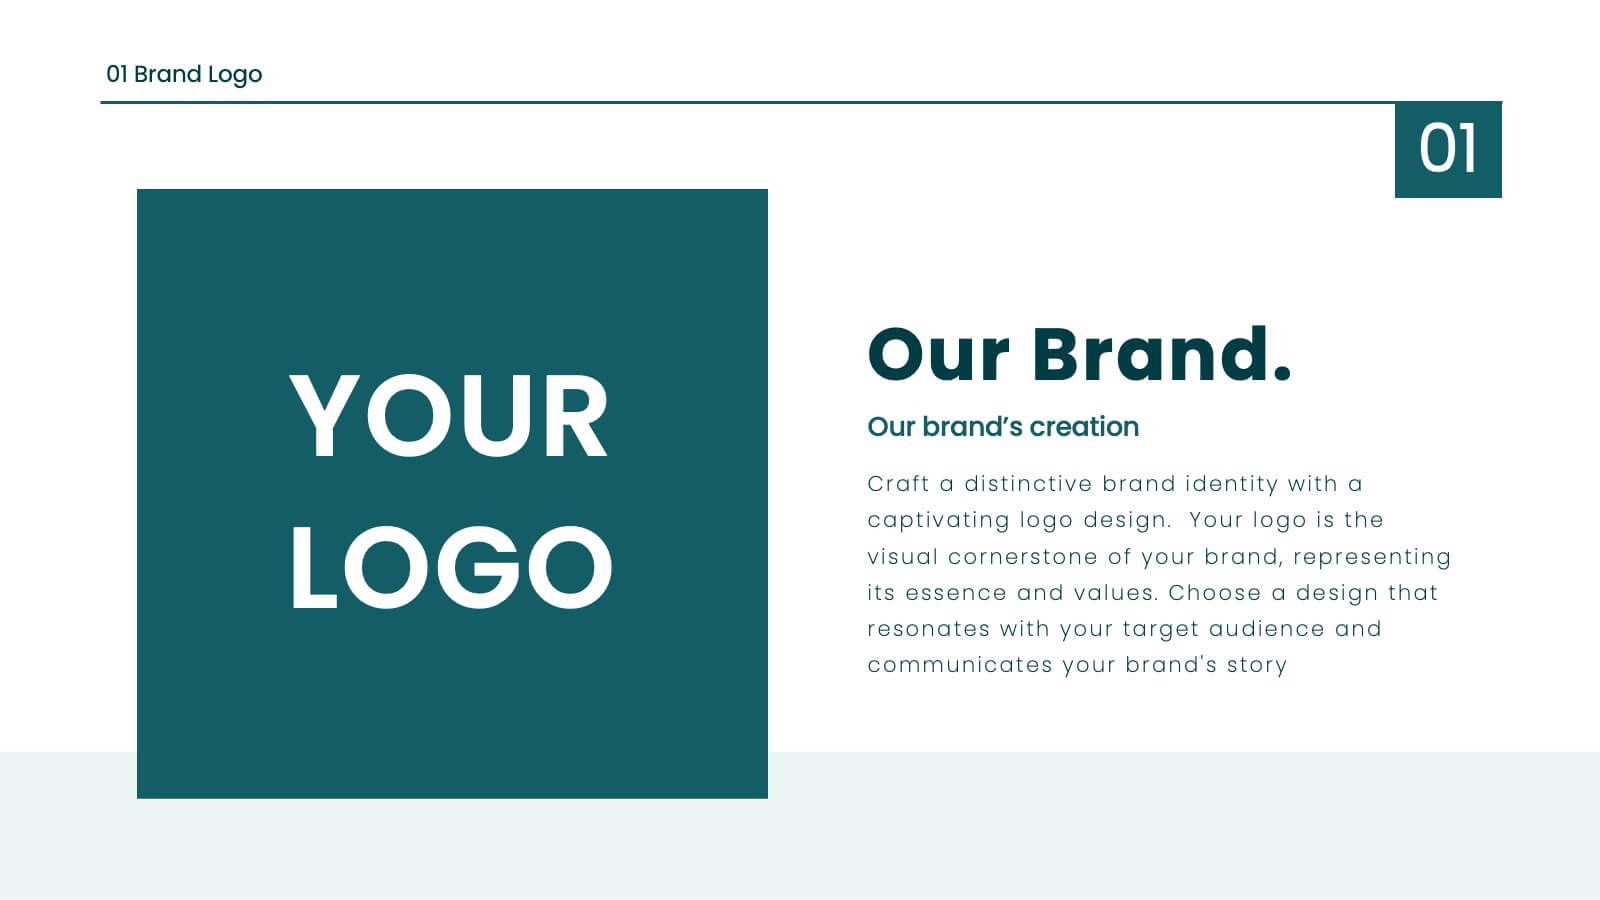
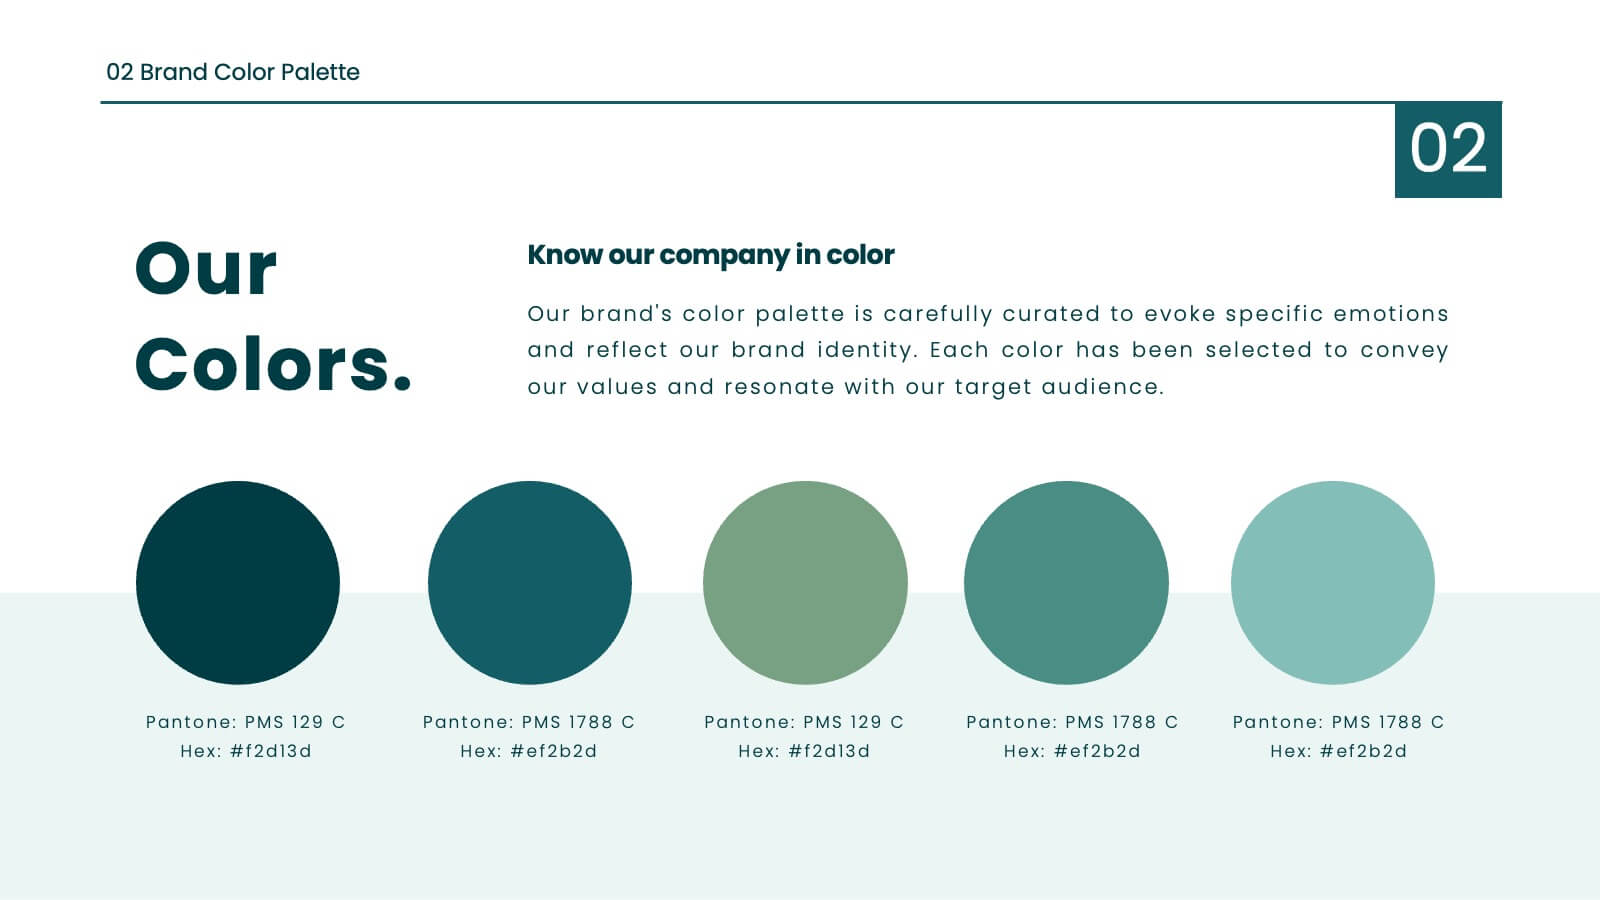
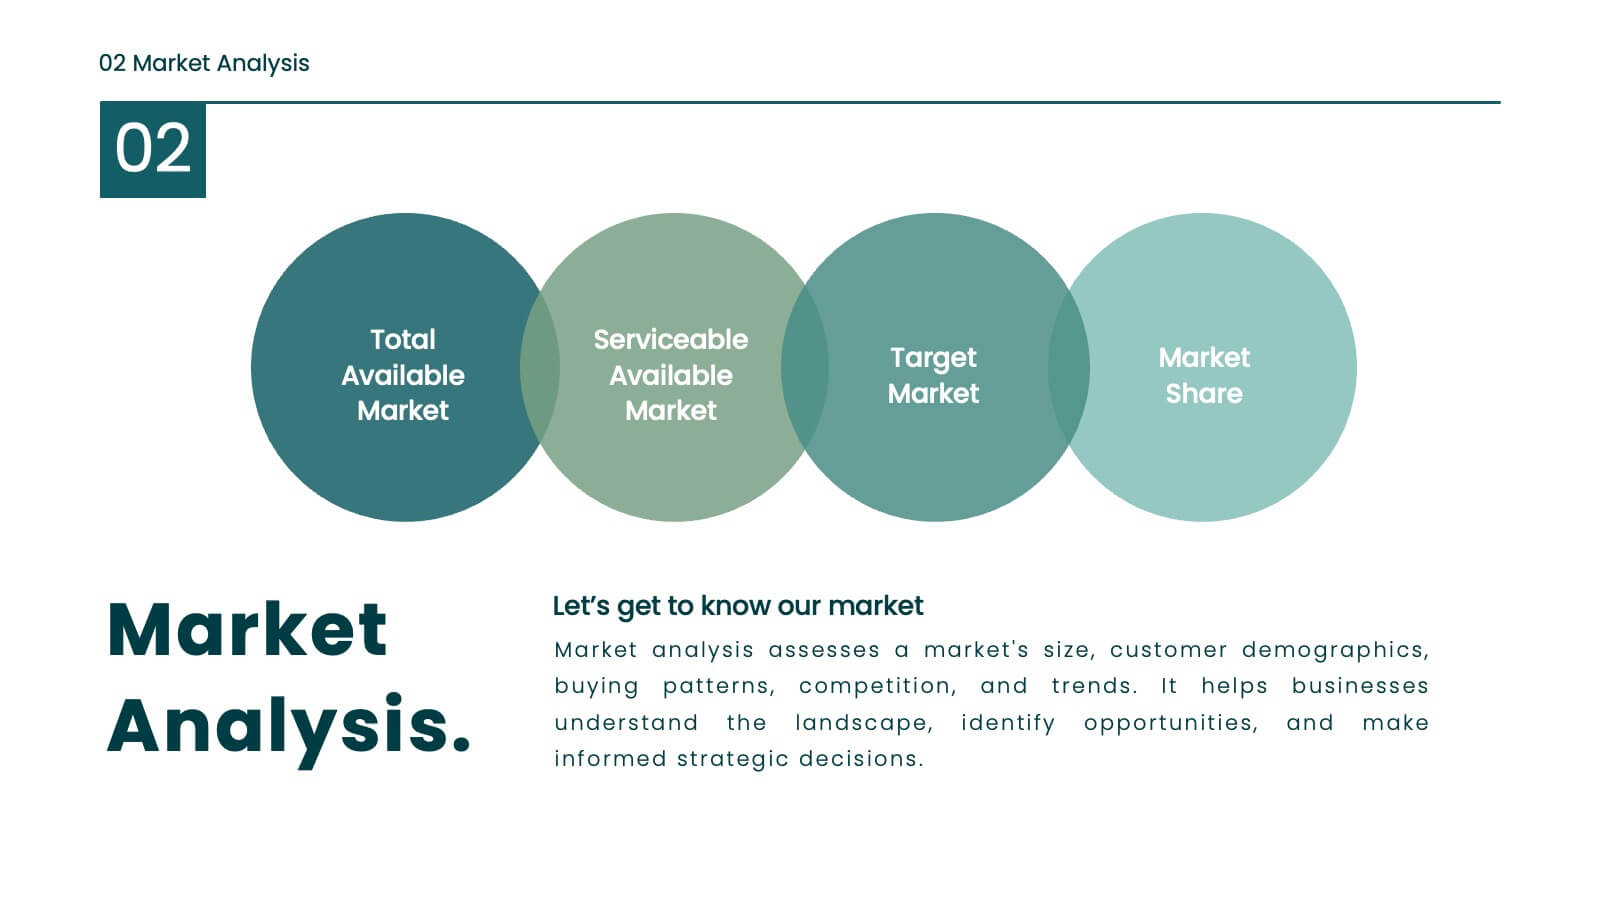
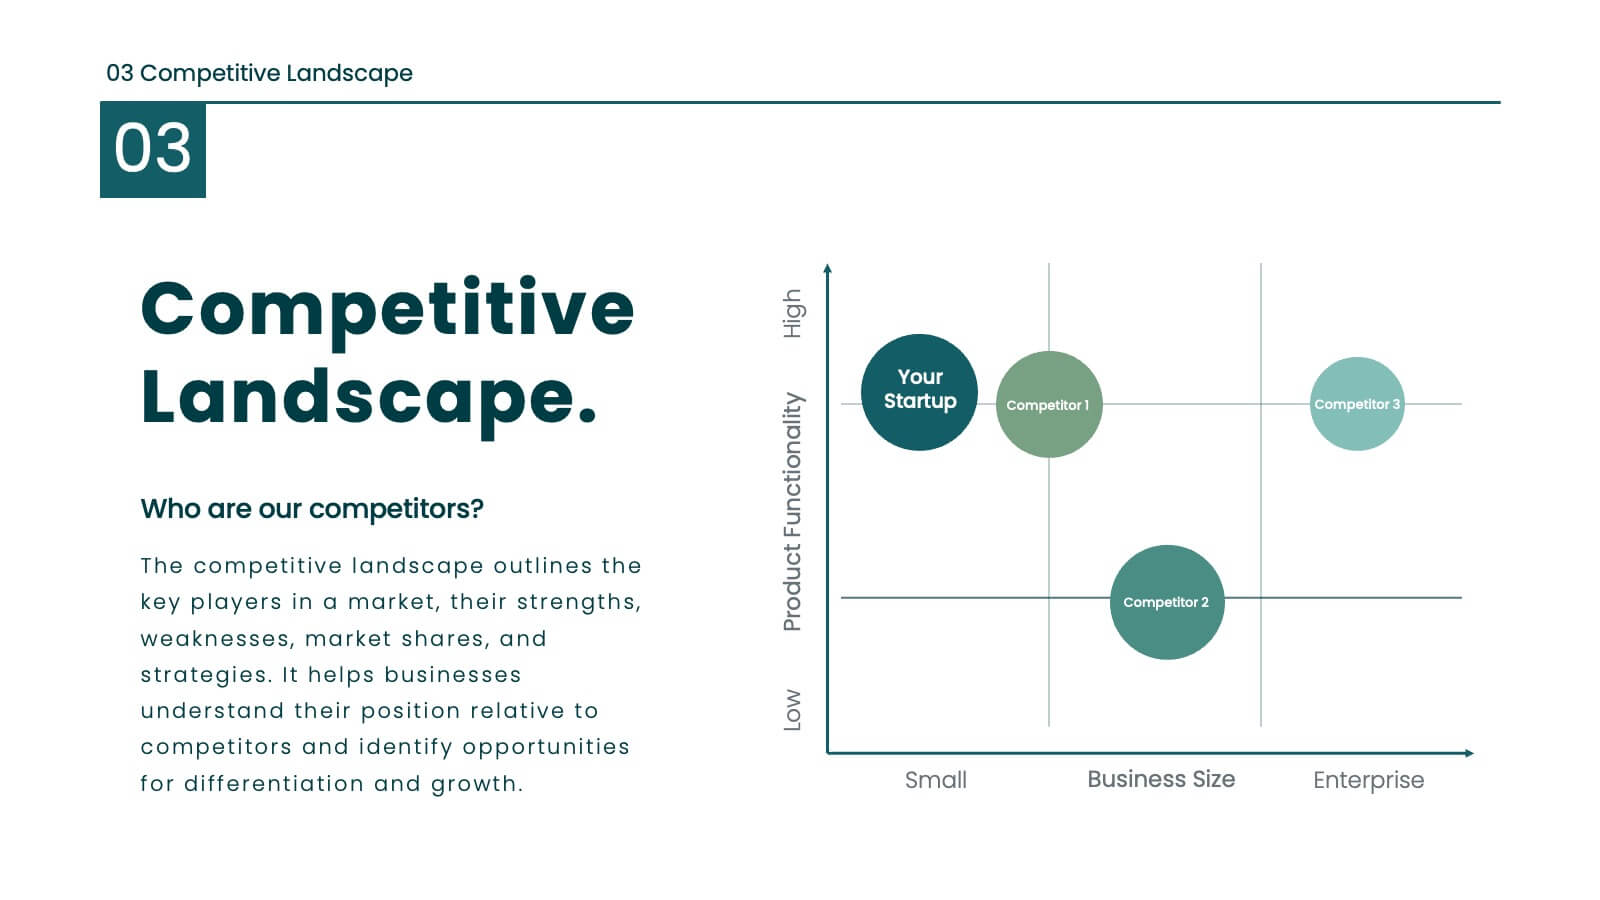
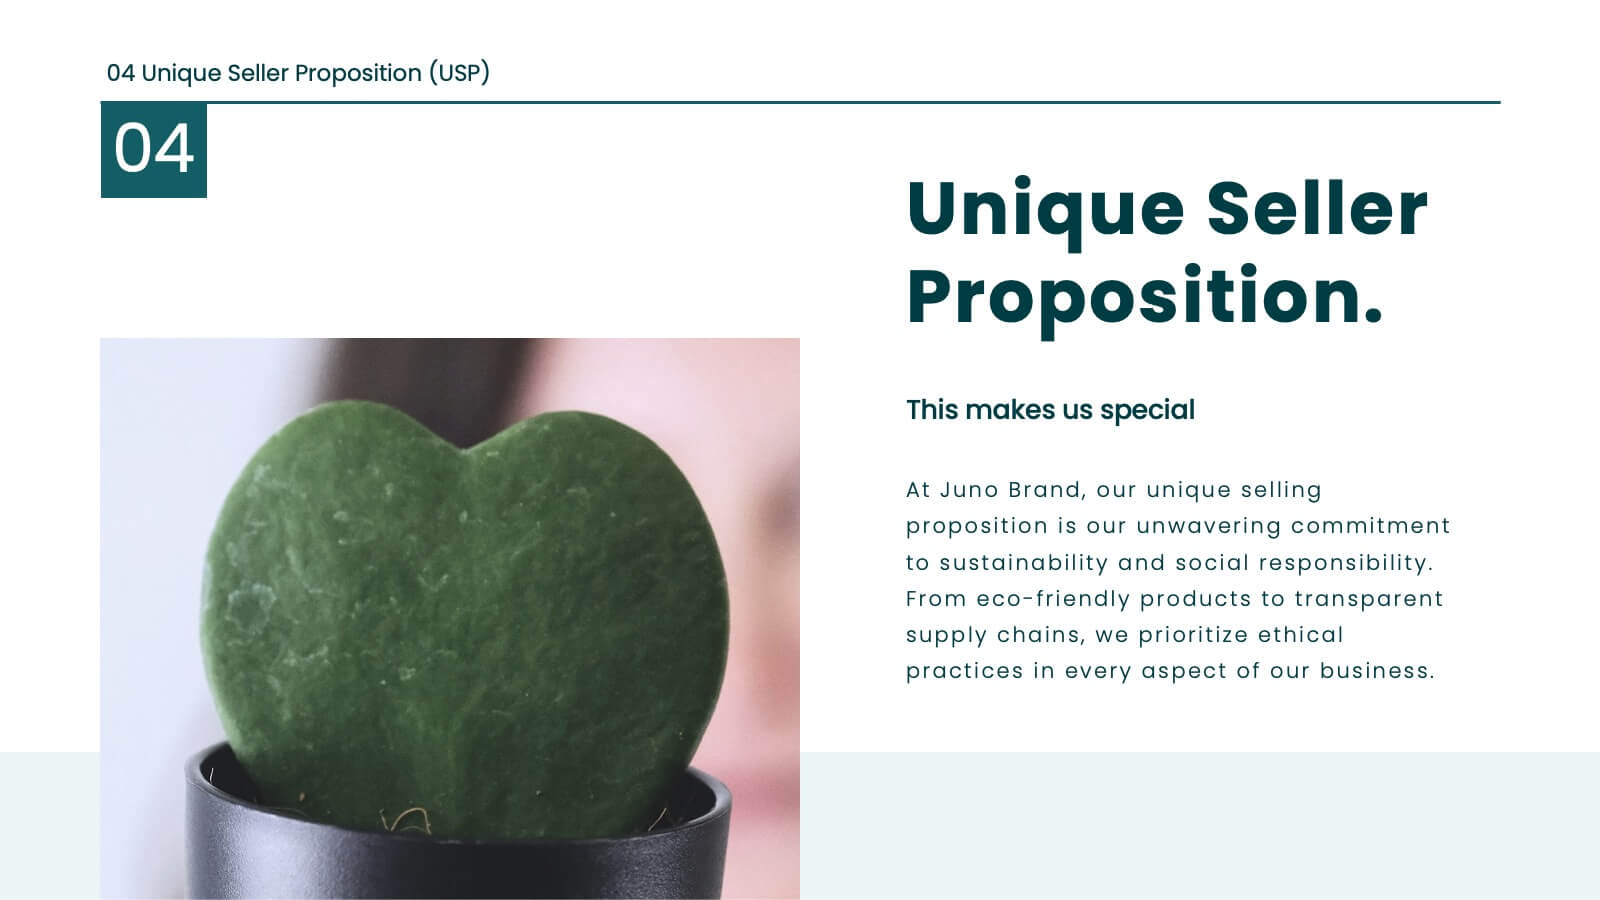
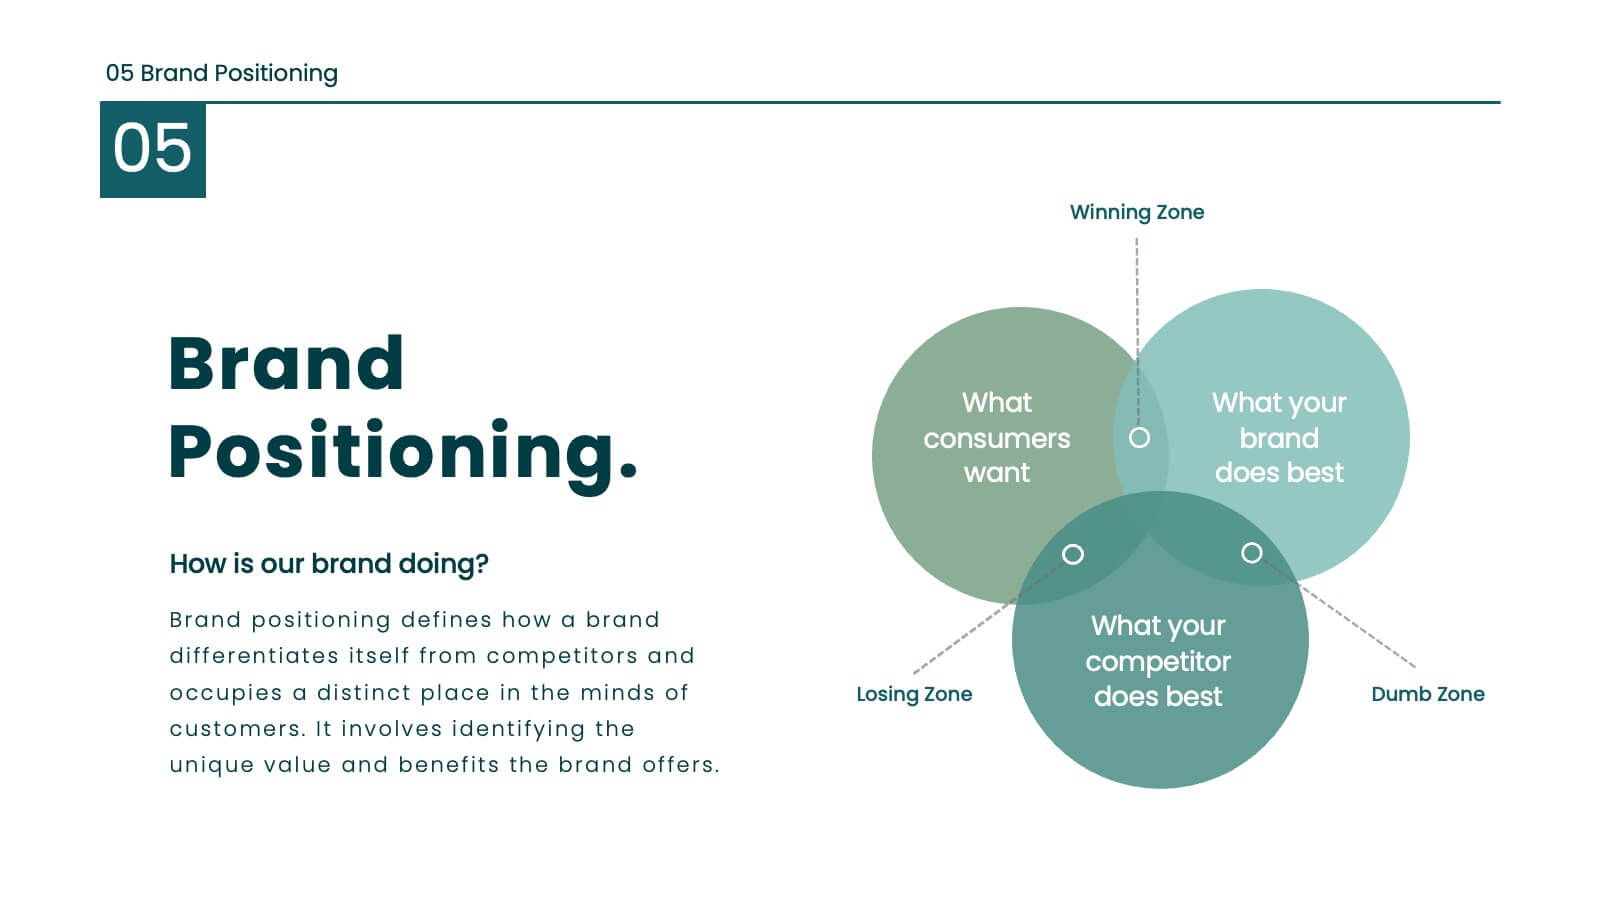
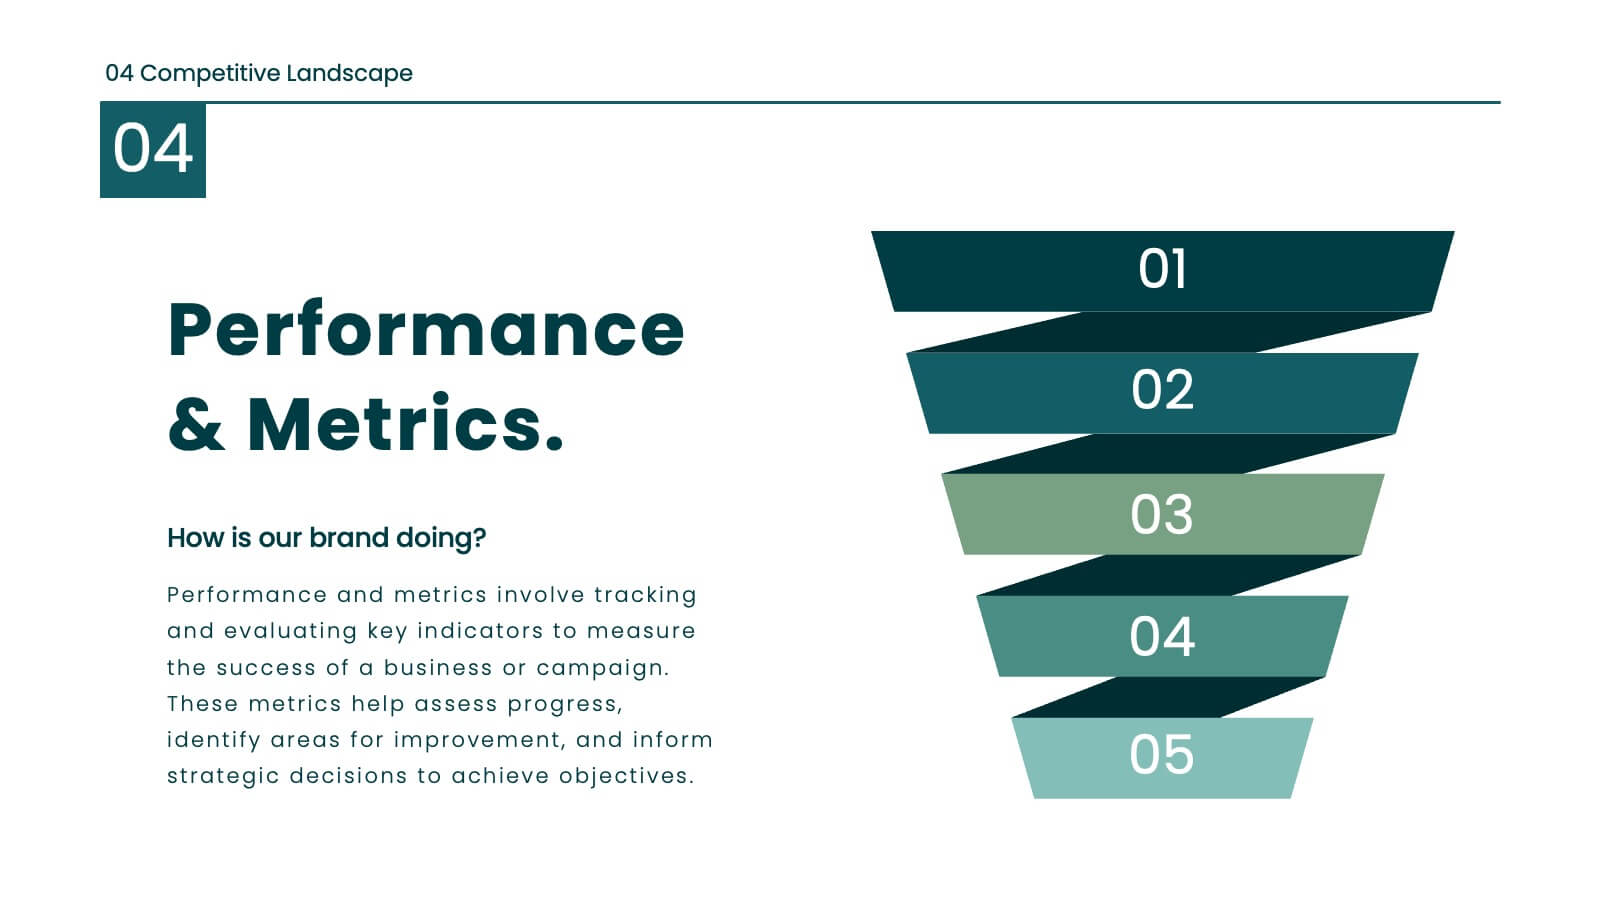
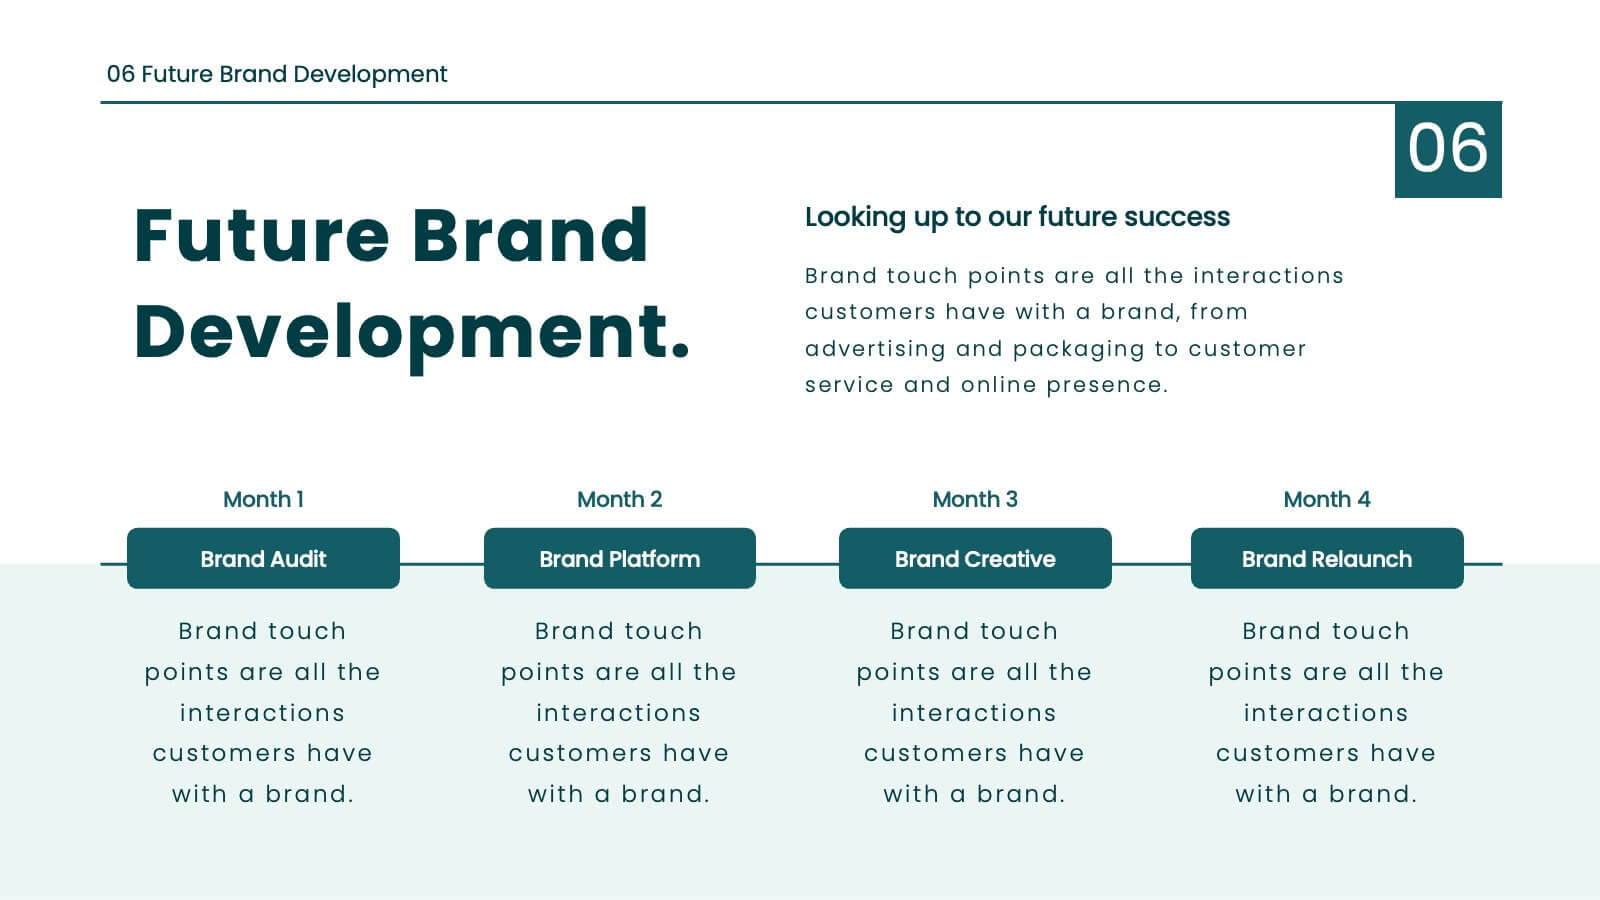
Juno Brand Guidelines Proposal Presentation
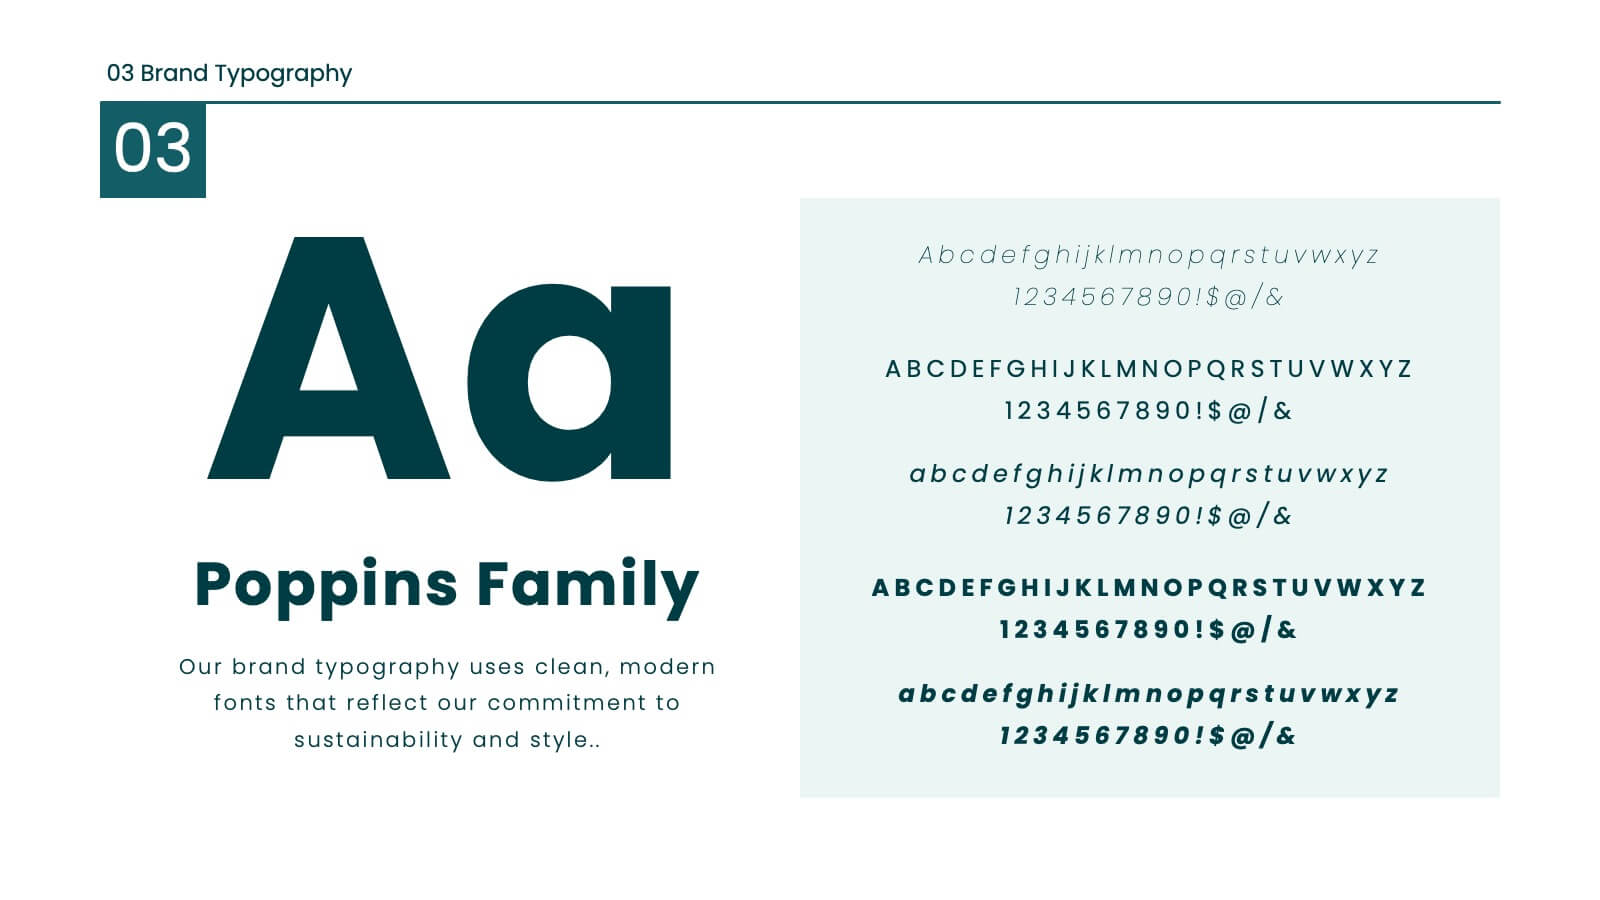
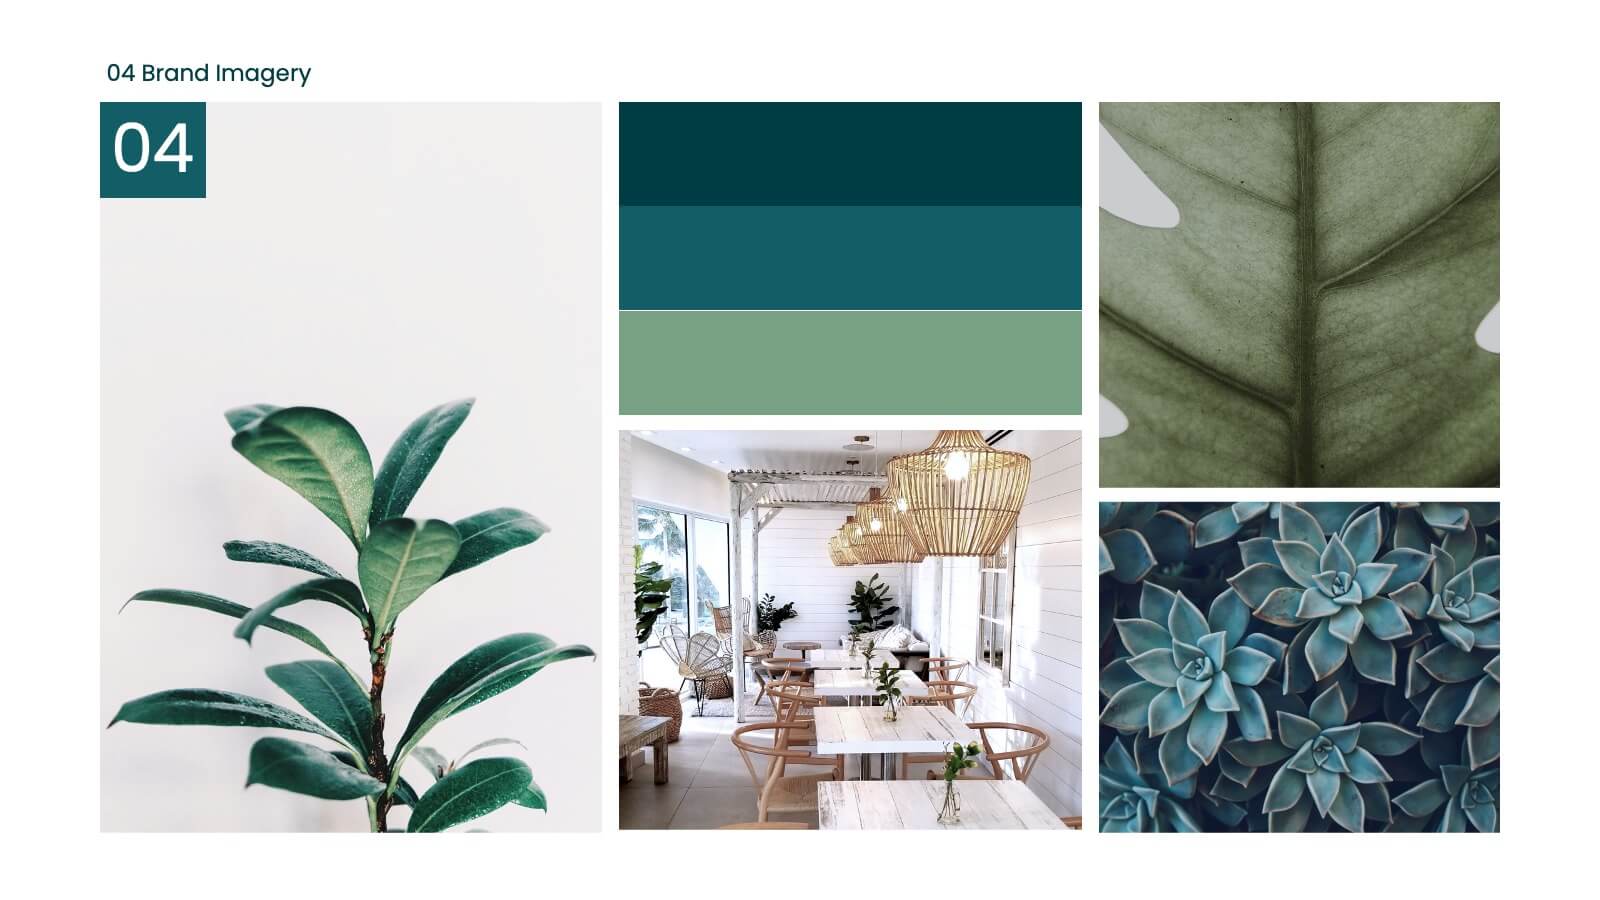
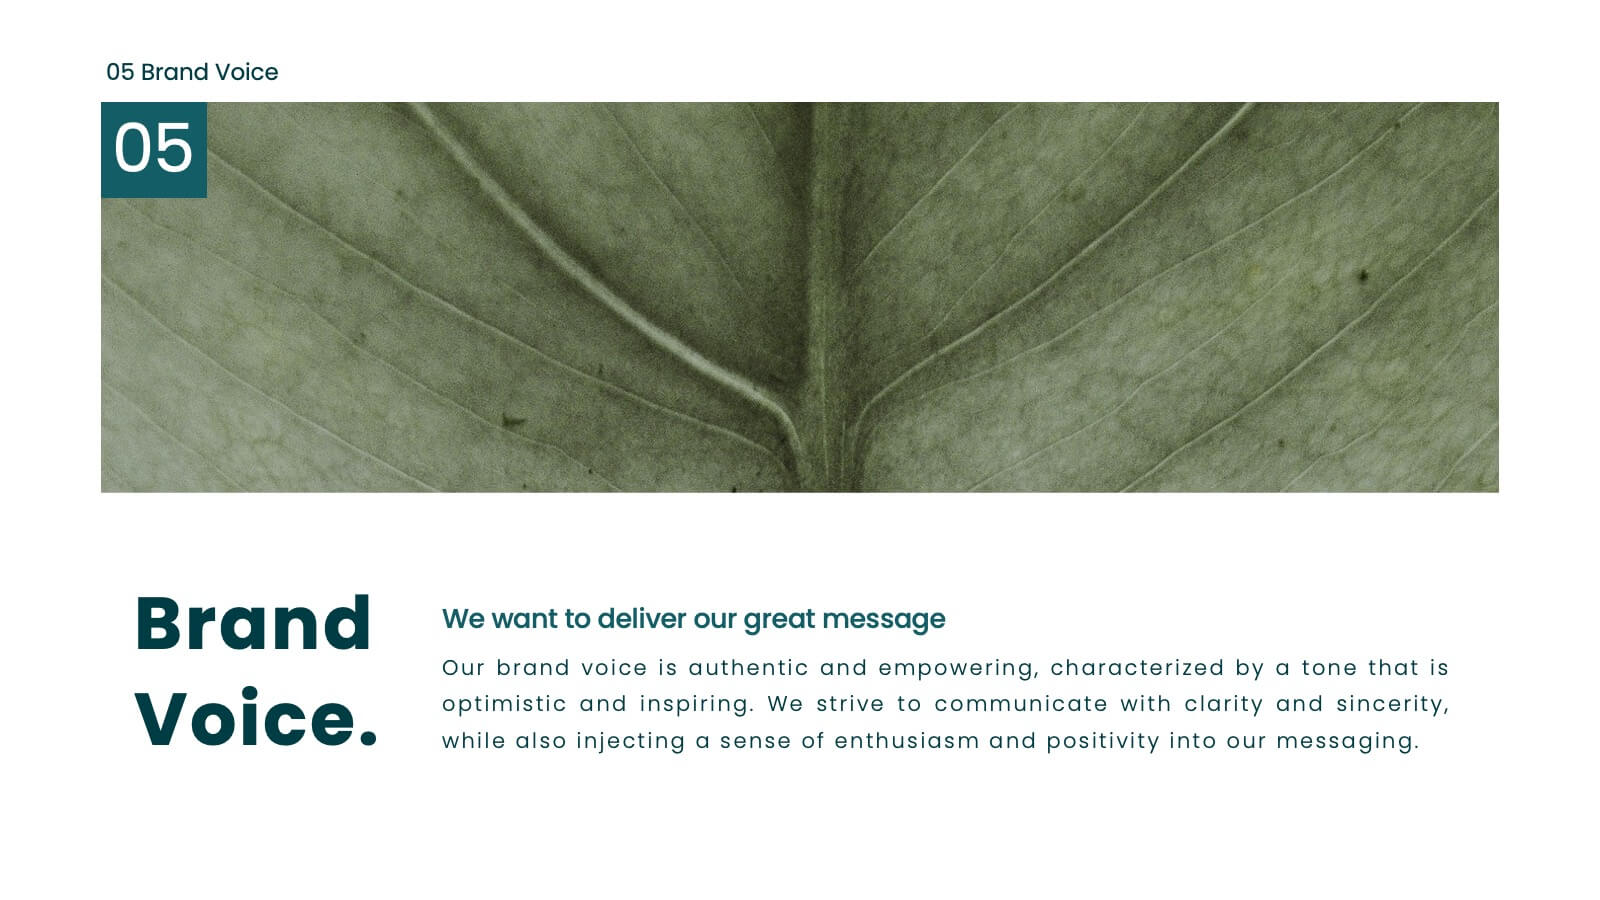
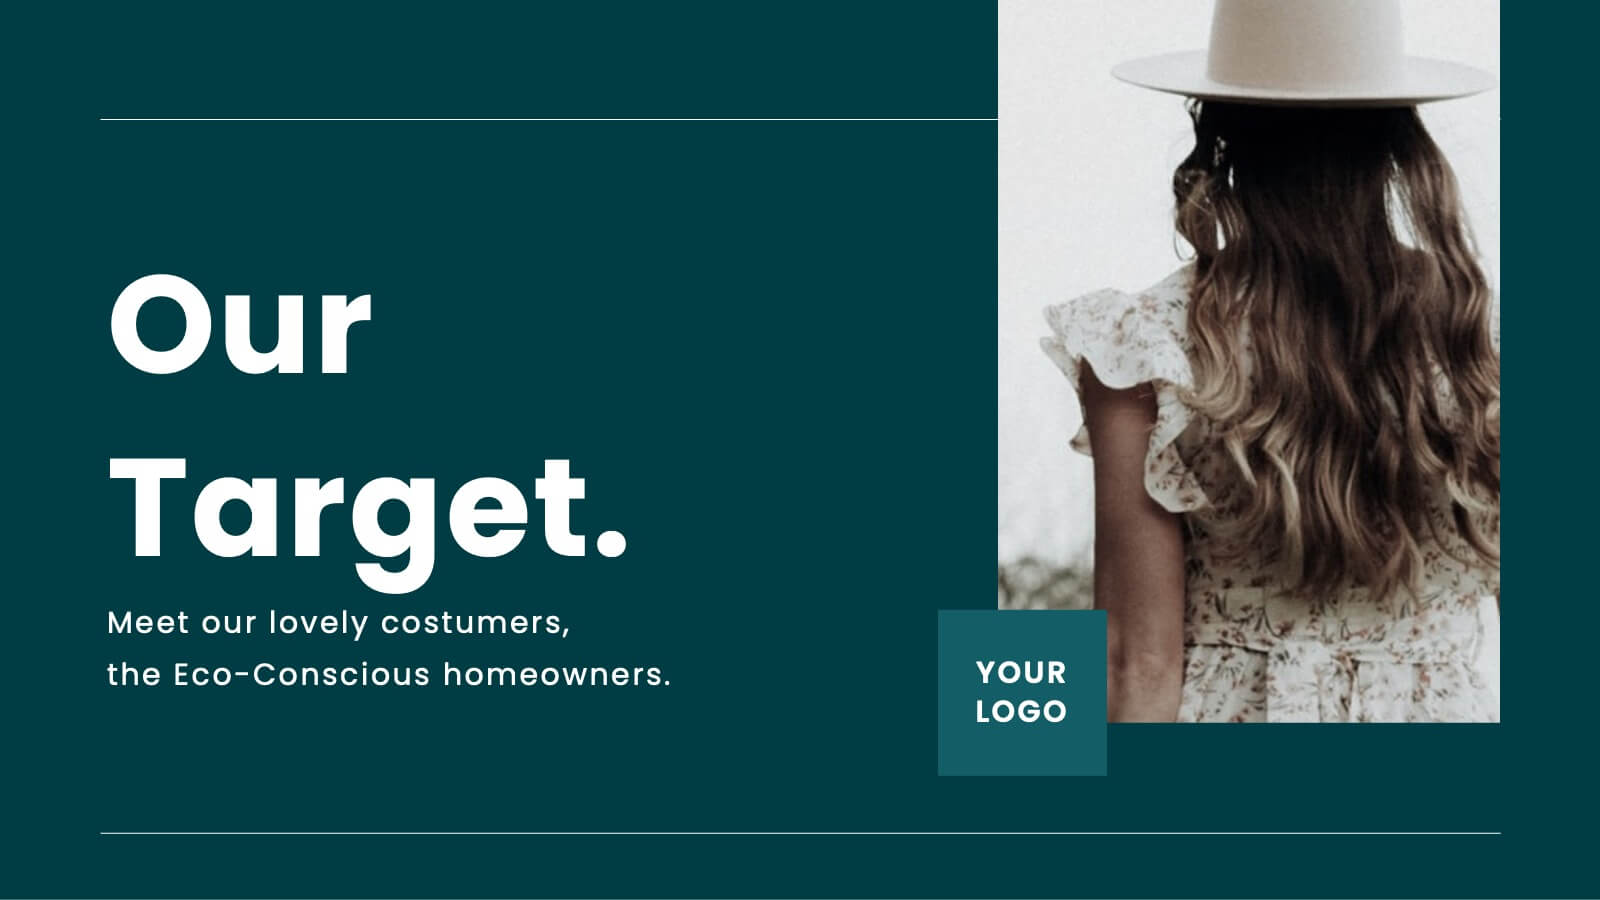
Define your brand's identity with this comprehensive, stylish presentation template. Perfect for detailing brand guidelines, vision, mission, and market analysis, it features a clean design with a professional layout. Highlight key elements like color palettes, typography, and unique selling propositions to ensure consistency and clarity. Compatible with PowerPoint, Keynote, and Google Slides, it’s ideal for any platform.
20 slides
Beacon Content Marketing Pitch Deck Presentation
Ignite your marketing strategies with this dynamic and sleek content marketing pitch deck! Filled with modern design and comprehensive insights, this template is perfect for showcasing trends, influencer marketing, and emerging technologies. Make your brand's story stand out while captivating your audience. Fully compatible with PowerPoint, Keynote, and Google Slides!


4 slides
Modern Company Profile Layout Presentation
Bring your brand to life with this clean and modern layout built to highlight your company’s mission, values, and team. Its balanced design and easy-to-read sections make every detail stand out beautifully. Fully editable and compatible with PowerPoint, Keynote, and Google Slides for smooth customization and professional presentations.


5 slides
Customer Behavior and Demographics Presentation
Break down customer segments with clarity using this behavior and demographics infographic set. Featuring colorful cylinder diagrams and intuitive labels, these slides are ideal for presenting consumer insights, age groups, behavior trends, and buyer types. Fully editable in PowerPoint, Keynote, and Google Slides—perfect for marketers, analysts, and business development teams.


22 slides
Vivid Creative Agency Pitch Deck Presentation
This sleek creative agency template is ideal for presenting your company's mission, services, and success stories. With a minimalist design, it offers a professional yet stylish approach to showcase case studies, industry trends, and partnership opportunities. It’s perfect for PowerPoint, Keynote, and Google Slides, making your agency stand out with every slide.


5 slides
Hierarchical Pyramid Chart Presentation
Bring structure to your ideas with a clean, layered visual that makes complexity feel easy to navigate. This presentation helps you explain levels, priorities, and organizational breakdowns with clarity and flow. Ideal for planning, strategy, and reporting. Fully compatible with PowerPoint, Keynote, and Google Slides.


12 slides
Personal Portfolio Presentation
Our Personal Portfolio Presentation template is designed for professionals looking to make a strong impression with a sleek and engaging portfolio. This comprehensive template provides an excellent framework to showcase your personal brand, professional journey, and achievements. The opening slide, with your name boldly presented, acts as your introduction. It's followed by a 'Get to know me' section that offers a glimpse into your personality and work ethic. The 'Skills' slide is a visually impactful way to present your competencies, while the 'Experience' slide chronologically outlines your professional milestones. Featuring sections for detailed case studies, showcased projects, and educational background, this template helps you tell your story in a cohesive and captivating manner. The 'Recognitions' slide allows you to highlight awards and honors, adding credibility to your profile. Ending with a compelling 'Let's work together!' call-to-action, this template is adaptable to PowerPoint, Keynote, and Google Slides, perfect for anyone looking to stand out in their field.


8 slides
Economic Improvement in South America Map Presentation
Highlight regional performance with this South America economic growth map. Featuring 3D bar charts and country-specific markers, it’s ideal for visualizing financial progress, investments, or development trends. Fully editable in PowerPoint, Google Slides, and Keynote, this layout is perfect for reports, forecasts, and business reviews with a geographic focus.


4 slides
Workforce Adaptation Through Change Management Presentation
Show how your team evolves and thrives through transformation with this visual journey up the change curve. This template uses a clear mountain-climb illustration to highlight workforce progression and adaptation. Ideal for HR, change leaders, and organizational development professionals. Fully compatible with PowerPoint, Keynote, and Google Slides.