


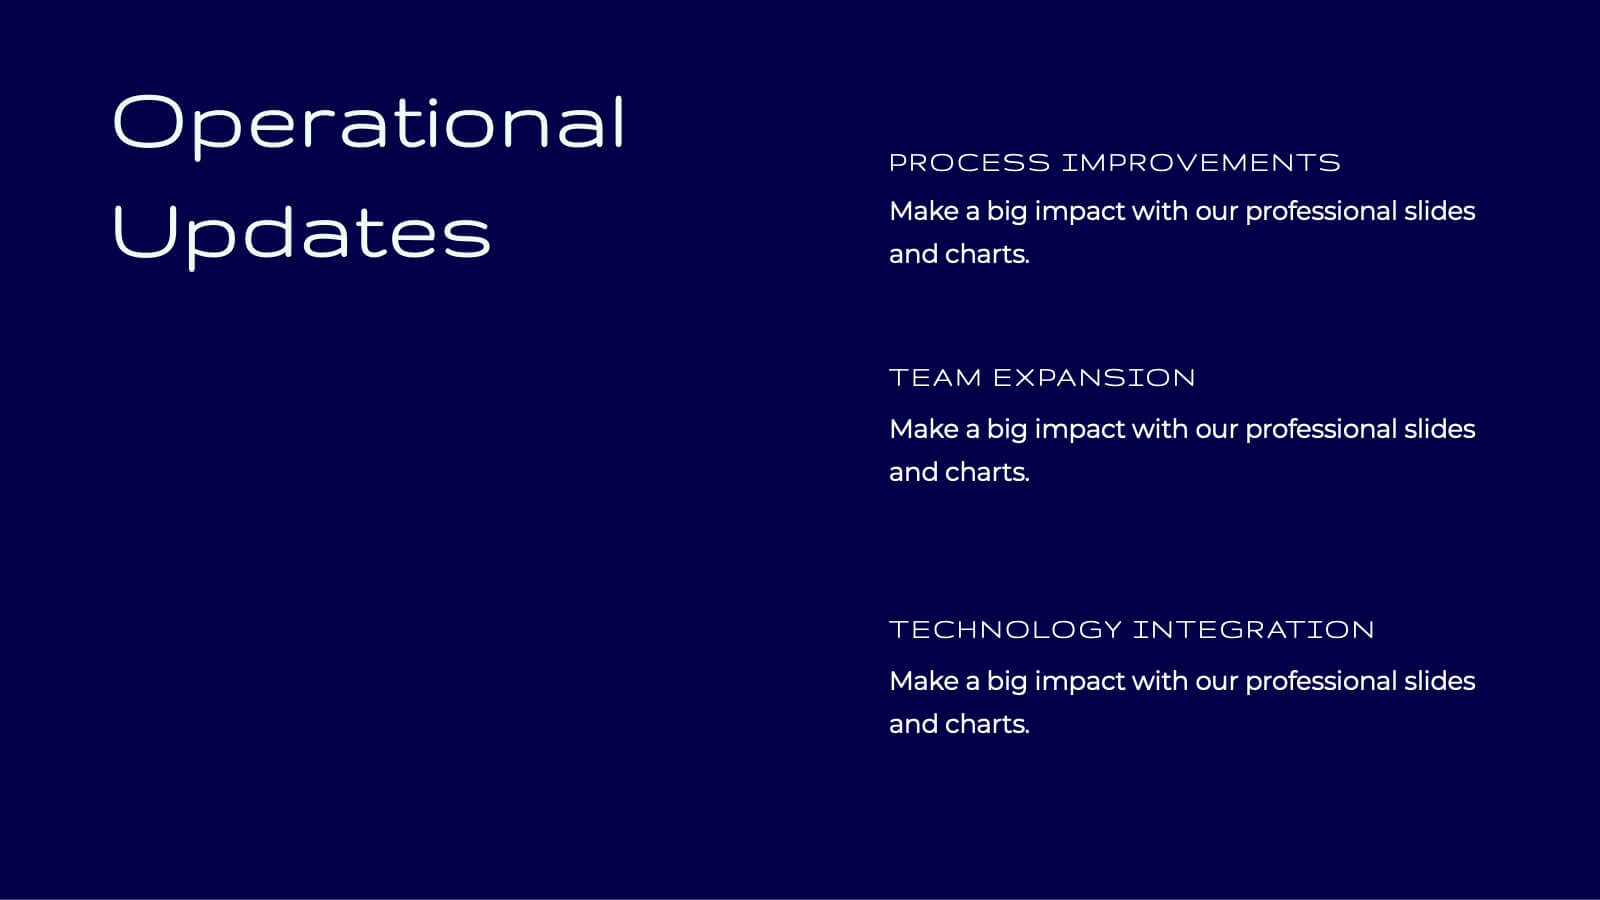
Features
- 5 Unique slides
- Fully editable and easy to edit in Microsoft Powerpoint, Keynote and Google Slides
- 16:9 widescreen layout
- Clean and professional designs
- Export to JPG, PDF or send by email


Do you have any questions?
Recommend


6 slides
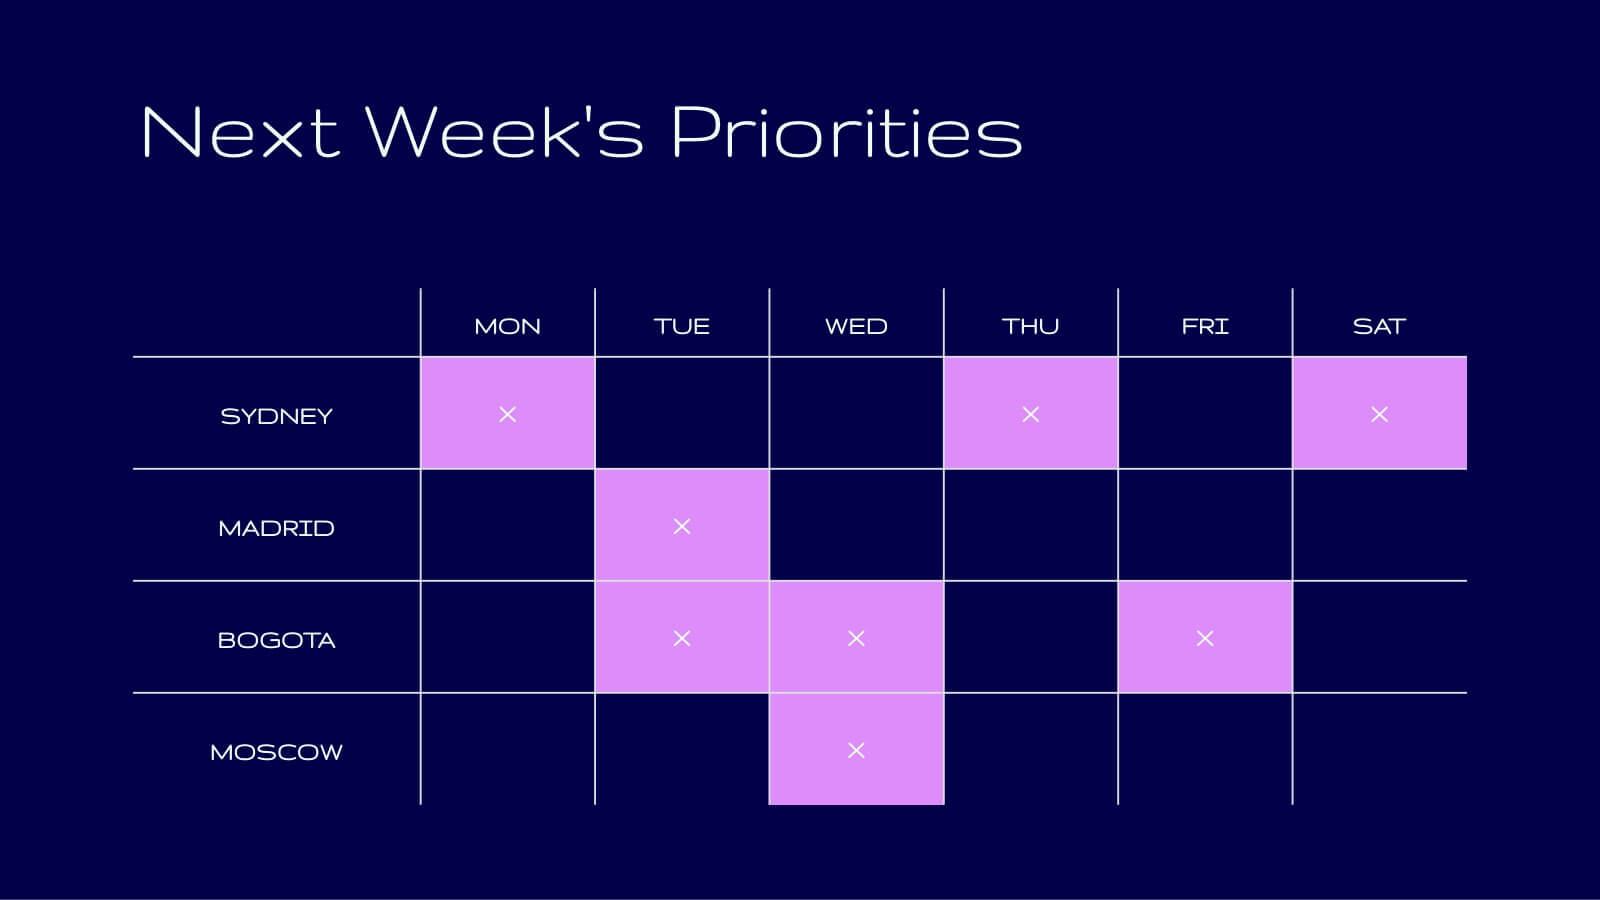
Business Milestone Roadmap
Visualize key achievements and future goals with this dynamic Business Milestone Roadmap. Perfect for project planning, annual reviews, or startup timelines, this layout walks through five key years or phases with clear markers and icons. Fully editable in PowerPoint, Keynote, and Google Slides.


5 slides
Editable Circular Flow Presentation
Streamline your presentations with this Editable Circular Flow template. Ideal for processes, workflows, and strategic planning, this diagram visually represents key steps in a structured format. Fully customizable and compatible with PowerPoint, Keynote, and Google Slides, it ensures clarity and professionalism for engaging, data-driven presentations.


4 slides
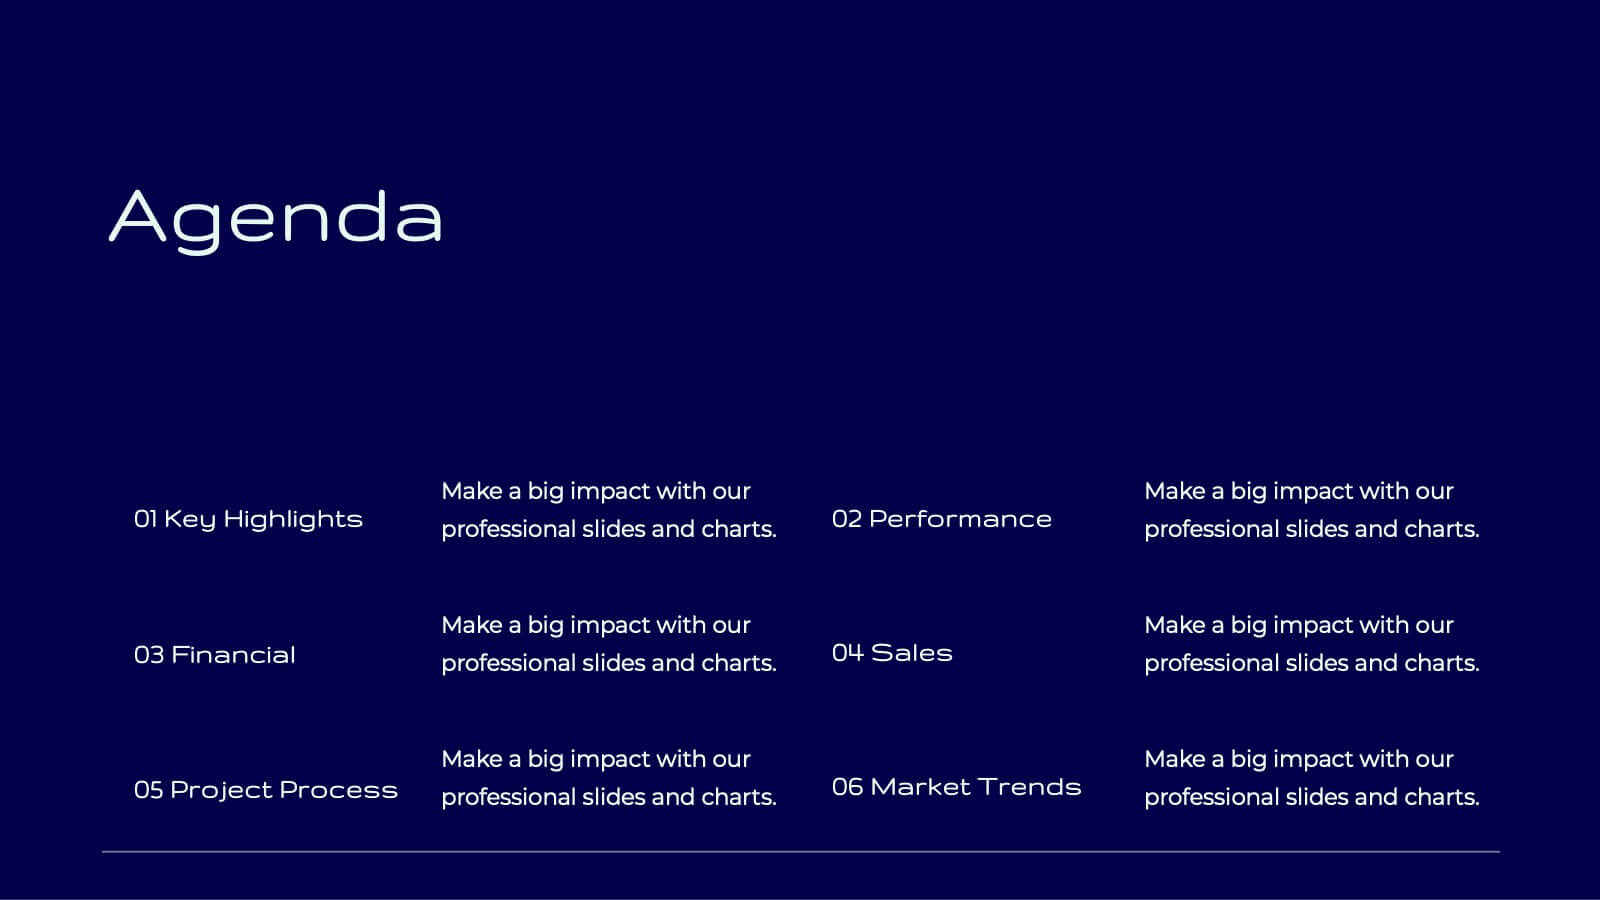
Professional Business Meeting Agenda Presentation
Efficiently structure your next corporate gathering with the "Professional Business Meeting Agenda" presentation template. Its geometrically appealing layout organizes discussion points in a visually captivating manner, encouraging effective communication and engagement. Perfect for strategizing sessions, this template ensures that every item on your agenda is highlighted with clarity. Compatible across PowerPoint, Keynote, and Google Slides, it’s designed to make every meeting more productive.


26 slides
Dariux Presentation Template
Travel is one of the most popular themes for businesses, Dariux template is the perfect solution for presentations on travel and tourism. It's tan and blue background makes the right graphical impression and photo templates with a simple but fun design make your presentation perfect. Colorful charts and an animation will make your presentation livelier as well as attract more attention in the audience's mind. Inside this template, you'll find a wealth of material for anything related to beach destinations and travel generally — there are even multiple slides dedicated to give you so many tips!


20 slides
Aurumix Agency Portfolio Presentation
Make a lasting impression with this bold and creative agency portfolio presentation. Designed to showcase your services, case studies, client success stories, and campaign strategies, this template helps highlight your agency’s expertise with confidence. Fully customizable and compatible with PowerPoint, Keynote, and Google Slides for a seamless, professional presentation experience.


10 slides
Project Lifecycle Planning Overview Presentation
Guide your team through every project stage with the Project Lifecycle Planning Overview Presentation. Featuring a four-phase circular flow layout, this template helps visualize key milestones—from initiation to completion. Ideal for project managers, consultants, and strategic teams. Fully customizable and compatible with PowerPoint, Keynote, Google Slides, and Canva.


7 slides
Pyramid Infographic Presentation Template
A Pyramid Infographic is a type of representation that uses a pyramid shape to organize and present information in a hierarchical manner. The top of the pyramid represents the most important or main idea and the levels below it represent sub-ideas or details that support the main idea. With this template you can show the relationship between different levels of information or to illustrate the main points of a topic in a simple and easy way, perfect for business, education, and marketing. This template will help you organize your information and make it more understandable.


4 slides
Brain Function Breakdown Chart Presentation
Bring clarity to complex thinking with a visual layout that highlights key mental processes in a clean, engaging way. This presentation helps you explain cognitive functions, organize insights, and break down information into easy-to-follow sections. Perfect for education, training, or research. Fully compatible with PowerPoint, Keynote, and Google Slides.


7 slides
Change Management Process Infographic Presentation
Change Management is the process of managing and guiding an organization or individual through a planned and deliberate change. This template is perfect for discussing change management and allows you to customize the design and add your own tips. Designed in Powerpoint, Keynote, and Google Slides it is easy to use with helpful illustrations. Use this change management template to report on current practices, issues and reasons for change, along with how these changes can improve your organization's performance. The perfect tool to share your vision and plan, or align an entire organization!


22 slides
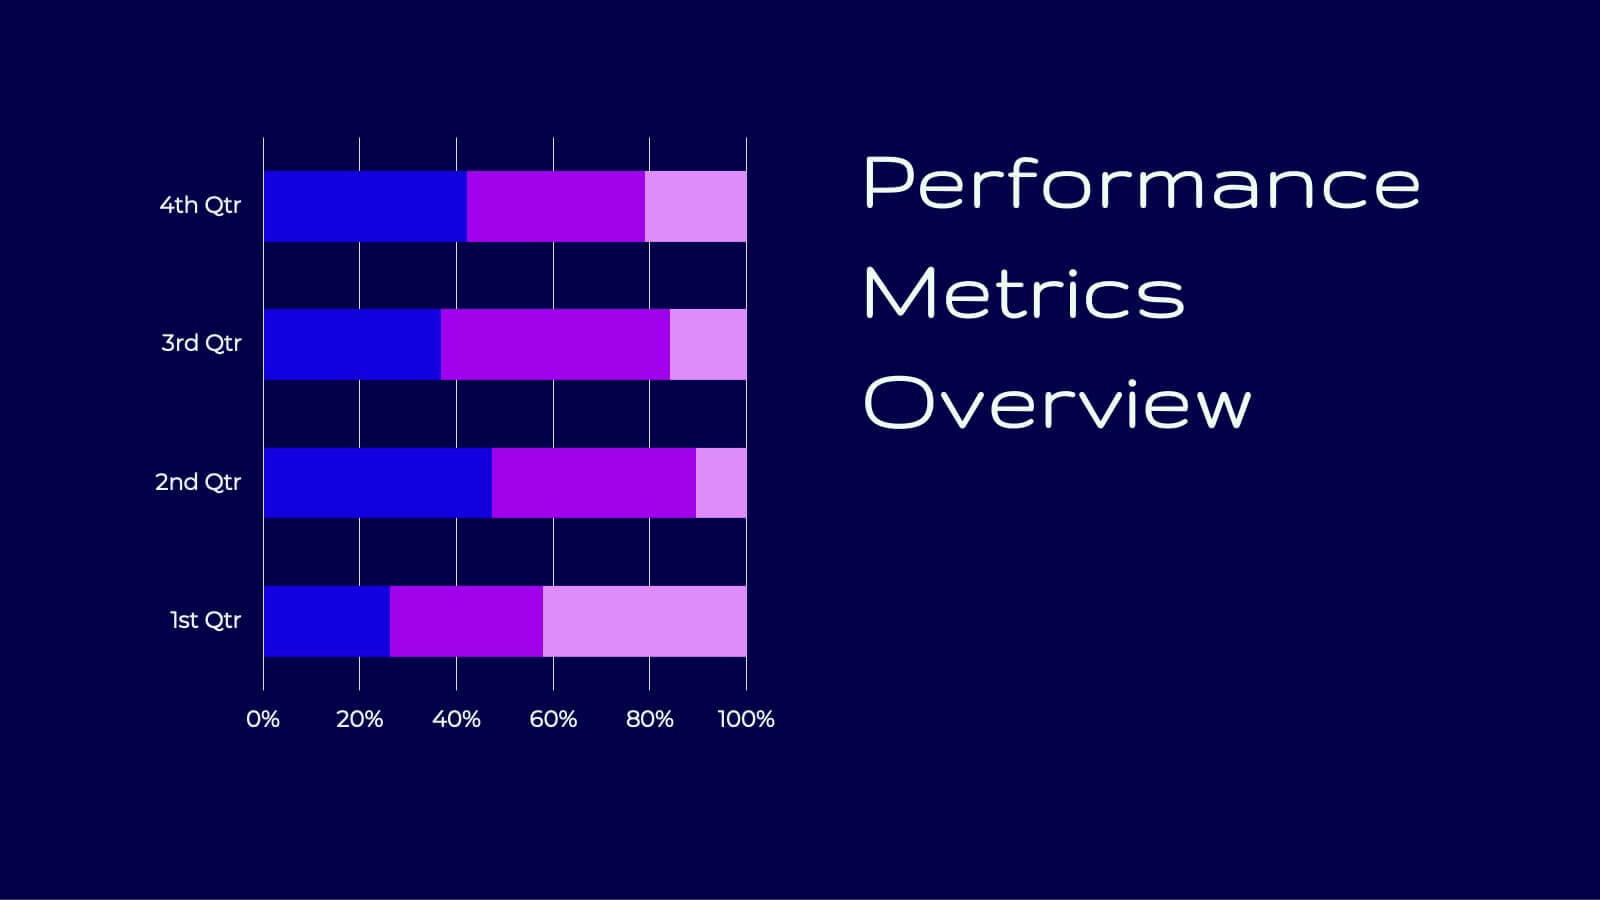
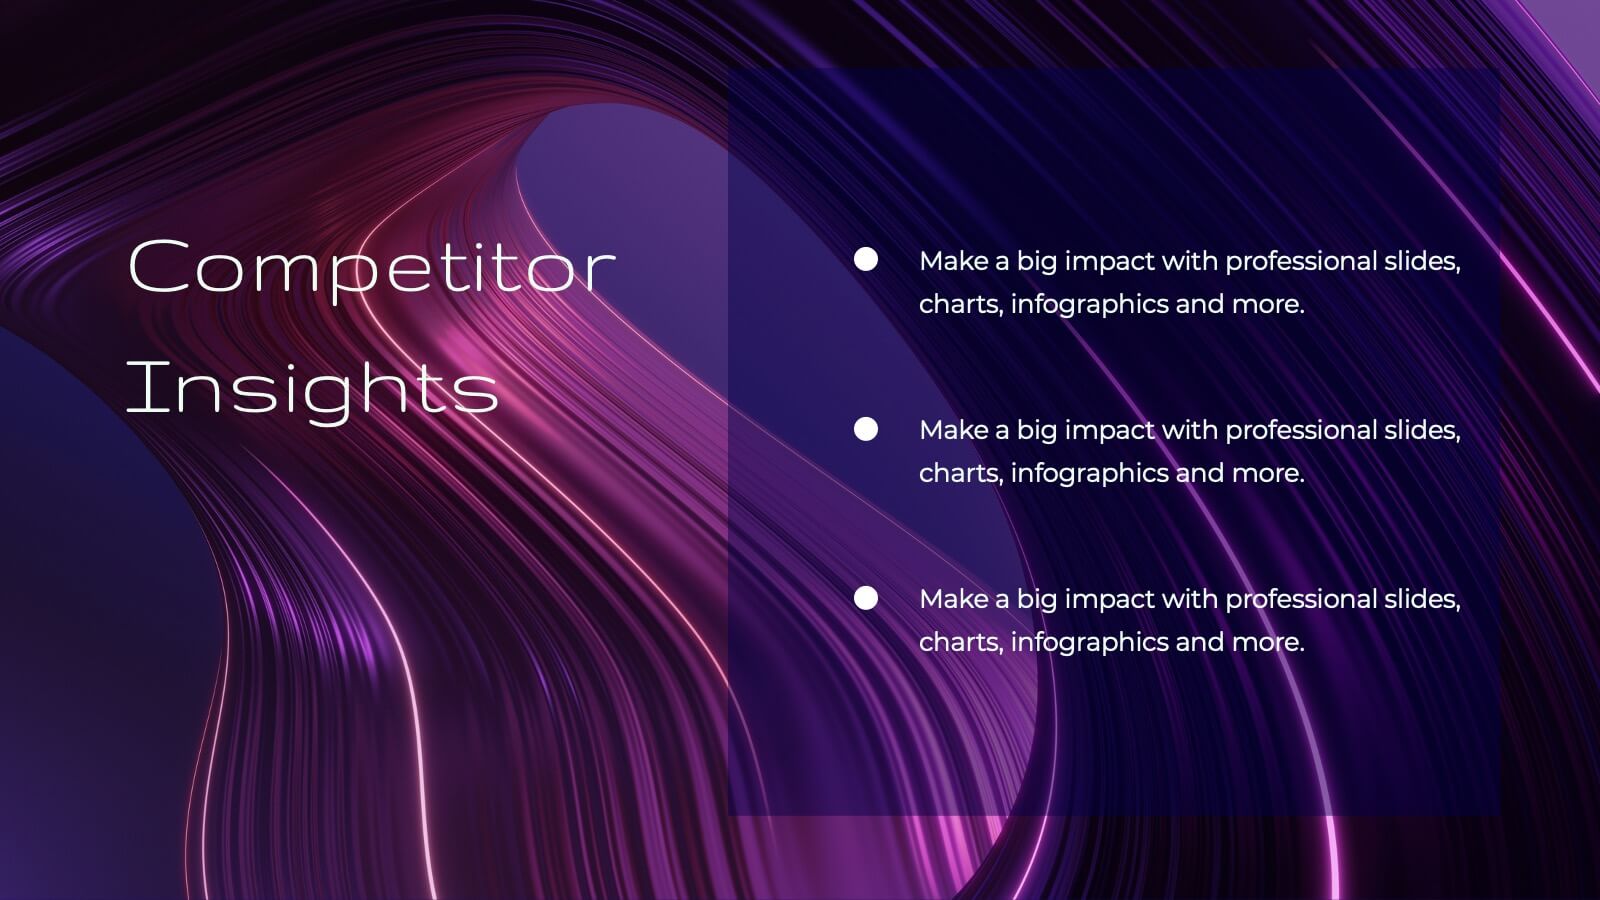
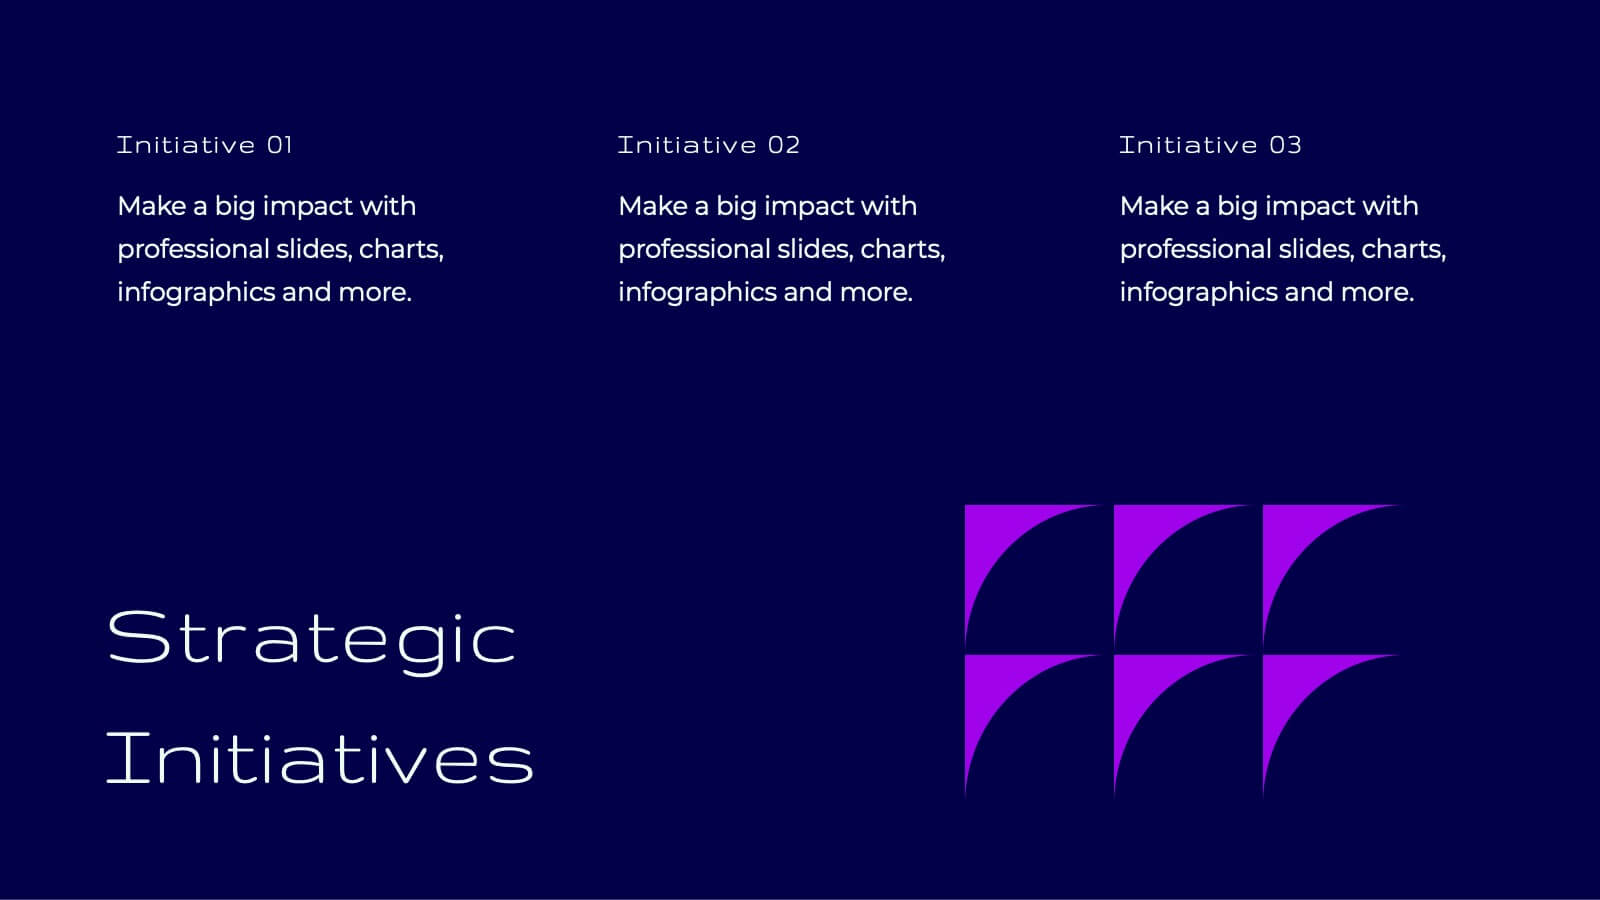
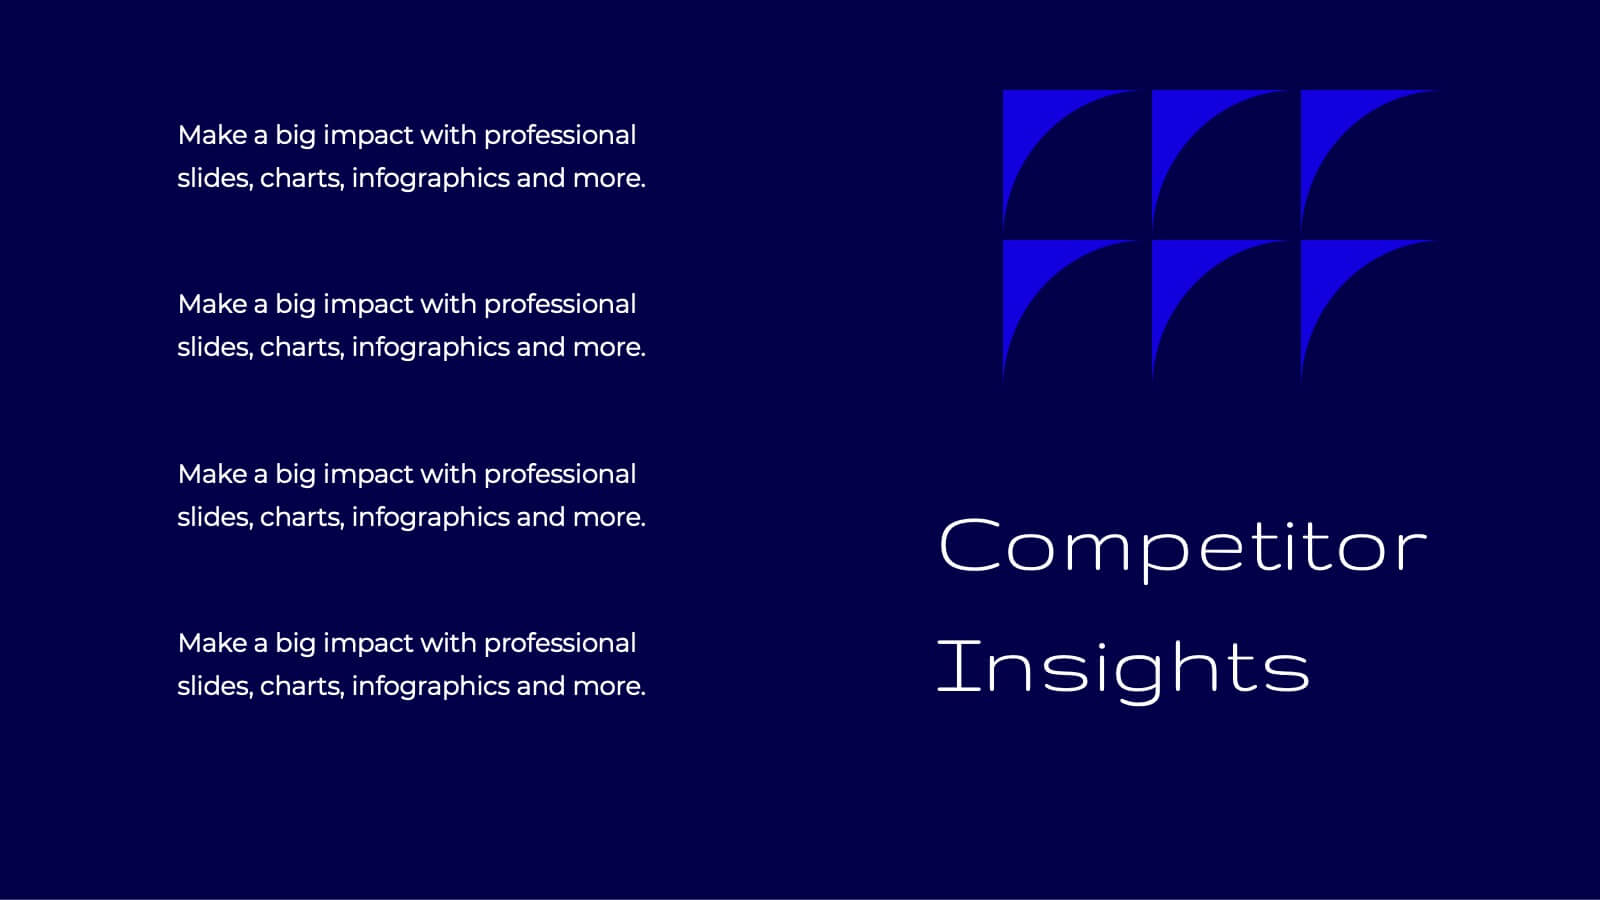
Tidal Research Findings Report Presentation
Deliver your research findings with impact using this sleek and modern report template! It covers key highlights, performance metrics, project progress, and competitor insights, making it ideal for clear, professional presentations. Perfect for summarizing challenges, solutions, and strategic initiatives. Compatible with PowerPoint, Keynote, and Google Slides for seamless reporting.


10 slides
Organizational Hierarchy Infographic Presentation
Clearly define your Organizational Hierarchy with this structured infographic template. Designed for business presentations, HR teams, and corporate strategy, this visual layout simplifies reporting structures, leadership roles, and team organization. Fully customizable and easy to edit in PowerPoint, Keynote, and Google Slides, making it perfect for internal communications and management reports.


3 slides
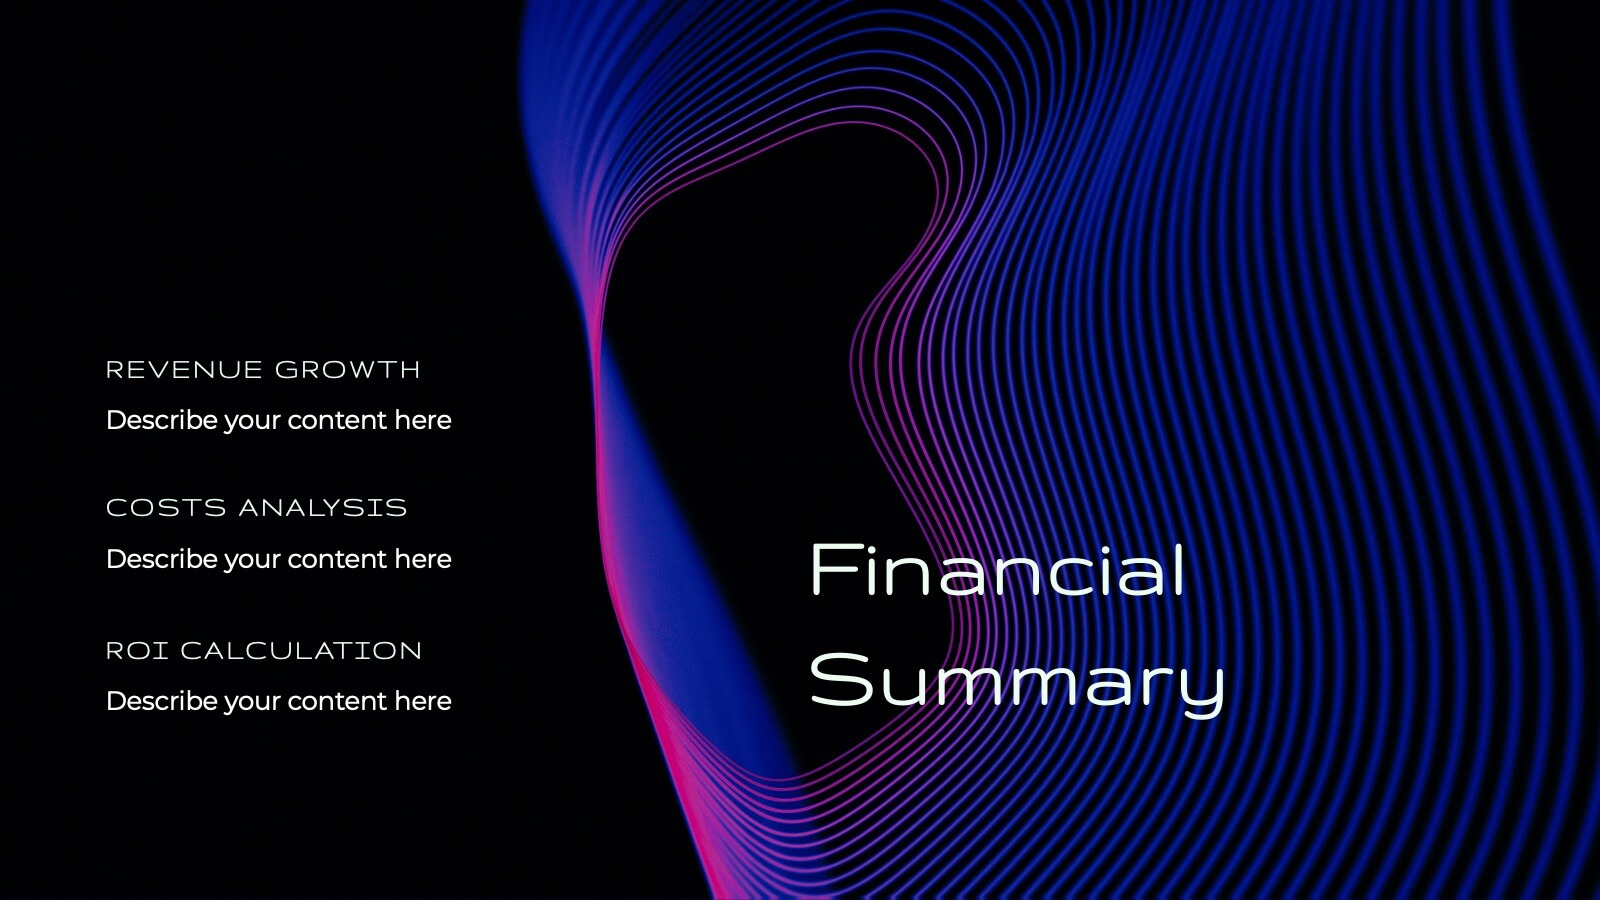
Break Even Financial Model Presentation
Bring your financial story to life with this sleek and professional presentation design. Ideal for illustrating profit margins, cost recovery, or growth potential, it helps visualize when investments start to pay off. Fully customizable and compatible with PowerPoint, Keynote, and Google Slides for effortless editing and impactful presentations.


26 slides
Fitness Company Profile Dark Presentation
Dive into the pulsating realm of fitness, where every sweat drop carves the path to chiseled abs. Imbued in shades of black with electrifying neon accents, our template captures the dark, motivating ambiance of late-night gym sessions. Featuring dynamic graphics, empowering icons, and inspiring image placeholders, it's a testament to determination and grit. Flawlessly curated for Powerpoint, Keynote, or Google Slides. The ultimate asset for fitness trainers, gym enthusiasts, health bloggers, or anyone aiming to inspire a journey towards physical excellence. Push your limits; let every rep ignite your passion.


5 slides
Ideal Customer Profile Breakdown
Shine a light on your perfect customer with this bright, idea-inspired layout—designed to guide you through the essential traits, needs, and behaviors that define your ideal client. Perfect for marketing strategy, sales enablement, or persona creation. Fully compatible with PowerPoint, Keynote, and Google Slides.


6 slides
Children's Smile Rating Infographic
Smile Rating refers to a method of evaluating customer satisfaction or user experience by measuring the positive emotional response elicited, often in the form of a smile. This infographic template is a visually engaging way to showcase customer satisfaction or feedback using smiley faces to represent different levels of happiness or contentment. This type of infographic is commonly used in customer service, user experience, and feedback analysis. This can provide valuable insights into emotional engagement and satisfaction. This infographic is designed to focus on providing services or products that are intended to create a positive and enjoyable experience.


7 slides
Personal SWOT Infographic
Evaluate your individual potential with our personal SWOT infographic. Set against a clean white backdrop, and punctuated with optimistic yellow, intuitive blue, and assertive red, this template meticulously breaks down strengths, weaknesses, opportunities, and threats on a personal level. Adorned with concise infographics, suggestive icons, and adaptable image placeholders, it offers a panoramic introspection into personal growth avenues. Flawlessly designed for Powerpoint, Keynote, or Google Slides. An invaluable asset for career counselors, personal coaches, individuals looking for self-improvement, or anyone aiming for personal development.


6 slides
Risk and Return Investment
Illustrate the delicate balance between risk and reward with this visual concept. This presentation uses a see-saw metaphor to compare investment risk versus financial return, ideal for finance professionals, consultants, and educators. Fully customizable in PowerPoint, Keynote, and Google Slides.