


Features
- 4 Unique slides
- Fully editable and easy to edit in Microsoft Powerpoint, Keynote and Google Slides
- 16:9 widescreen layout
- Clean and professional designs
- Export to JPG, PDF or send by email


Do you have any questions?
Recommend


23 slides
Meteor New Product Proposal Presentation
The Meteor New Product Proposal template is the perfect tool for presenting your innovative ideas in a bold and professional manner. With its striking yellow and black color scheme, this template grabs attention while maintaining a clean and modern aesthetic. It’s designed to help you effectively communicate your product’s potential, covering key aspects such as problem statement, solution, market opportunity, competitive landscape, and unique selling proposition. The template also includes sections for financials, growth projections, and risk analysis, ensuring that every critical detail is covered. Ideal for startups, product managers, and marketers, this template is fully compatible with PowerPoint, Keynote, and Google Slides, making it easy to customize and present on any platform. Impress investors, stakeholders, or team members with a comprehensive and visually compelling proposal that highlights the strengths and opportunities of your new product.


5 slides
Managing Product Maturity and Decline
Effectively visualize each phase of a product’s lifecycle with this curve-style infographic—from introduction to decline. Ideal for business strategy, product development, or market lifecycle planning. Fully editable in PowerPoint, Keynote, or Google Slides for seamless customization.


3 slides
Business Report Summary Slides Presentation
Kick off your report with a slide that feels clean, modern, and effortlessly clear. This presentation helps you summarize key insights, highlight performance updates, and present essential findings in a structured, visual format. It’s ideal for monthly reviews, strategy reports, and stakeholder updates. Fully compatible with PowerPoint, Keynote, and Google Slides.


7 slides
Property Market Forecast and Trends Presentation
Present your real estate insights clearly with this Property Market Forecast and Trends Presentation. Featuring a central isometric house graphic surrounded by six editable segments, this layout is perfect for highlighting key indicators like market trends, pricing shifts, and investment zones. Use the icons and color-coded areas to enhance clarity. Ideal for housing reports and investor decks. Fully compatible with PowerPoint, Canva, Keynote, and Google Slides.


6 slides
Africa Population Map Infographics
Discover the flexibility of our Africa Population Map infographic template, a dynamic tool for illustrating population distribution across the African continent. This template is compatible with widely used presentation software like PowerPoint, Keynote, and Google Slides, allowing you to effortlessly customize it according to your specific requirements. The Africa Population Map infographic template provides a solid foundation for visualizing population data, highlighting densely populated areas, urban centers, and demographic trends. Whether you're an educator, researcher, or simply curious about Africa's demographics, this template offers a user-friendly platform to create engaging presentations and informative materials. Impress your audience with this SEO-optimized Africa Population Map infographic template, thoughtfully designed for clarity and ease of use. Tailor it to showcase population variations, growth patterns, and regional insights, making it a valuable asset for your projects and presentations. Start crafting your personalized infographic today!


10 slides
Workplace Health and Safety Guidelines Presentation
Present your safety protocols with clarity and impact using this circular infographic layout. Ideal for showcasing four key safety principles, this slide design features a central helmet icon surrounded by safety icons, each paired with editable text boxes. Perfect for onboarding, training sessions, or compliance updates. Fully customizable and compatible with PowerPoint, Keynote, and Google Slides.


7 slides
Concept Development for Great Ideas Presentation
Bring your ideas to life with the Concept Development for Great Ideas Presentation. This visually engaging layout features a central lightbulb icon surrounded by six customizable segments—ideal for breaking down key phases of ideation, planning, or innovation strategy. Clean, color-coded elements help guide your audience through your thought process. Compatible with Canva, PowerPoint, Keynote, and Google Slides.


5 slides
Project Management Plan Presentation
Bring structure and clarity to every phase of your workflow with this clean, arrow-based layout designed to outline tasks, milestones, and key deliverables. This presentation makes planning feel organized, engaging, and easy to follow for any audience. Fully editable and ready to use in PowerPoint, Keynote, and Google Slides.


4 slides
Mind Mapping for Idea Expansion Presentation
Visualize your concepts clearly with this Mind Mapping for Idea Expansion presentation. Designed to help structure brainstorming sessions or strategic planning, this template organizes ideas around a central theme with clean, radial layouts. Ideal for creative teams and professionals. Fully editable in Canva, PowerPoint, and Google Slides.


4 slides
4-Quadrant SWOT Matrix Presentation
Spark strategic clarity with a bold, visual layout designed to organize strengths, weaknesses, opportunities, and threats in a clean, engaging way. This presentation helps teams analyze key factors, compare insights, and plan smarter with structured guidance. Ideal for business strategy and decision-making. Fully compatible with PowerPoint, Keynote, and Google Slides.


5 slides
Manufacturing Insights Infographics
Manufacturing insights refer to valuable information, analysis, and observations derived from the manufacturing industry. These vertical set of infographics are designed to provide valuable insights and data related to the manufacturing industry. This template is ideal for manufacturing companies and researchers looking to present complex data in an engaging manner. The template includes infographics that break down the manufacturing process into easily understandable steps, using simple graphics and icons. This template is easily editable, allowing users to adjust colors, charts, and data to match their specific manufacturing insights.


6 slides
Pyramid Triangle Diagram Presentation
Build your ideas from the ground up with this bold, layered layout that turns complex hierarchies into simple, engaging visuals. Perfect for illustrating processes, priorities, or business frameworks, it gives your message a clear structure and flow. Fully compatible with PowerPoint, Keynote, and Google Slides for smooth customization.


7 slides
Circle Process Infographic
A Circle Process is a method used to involve a group of people in problem-solving and decision-making. The process is based on a circle shape, where everything is in a circle facing each other. The template includes vibrant colors and circle process charts that you can customize to make just right for your project. This template is perfect for any project or presentation school or business related. This circle process template works with Powerpoint, Keynote, and Google Slides, so you can use it on any device. This template is great for teamwork, community building, and conflict resolution.


7 slides
Business People Management Infographic
Business people refer to individuals involved in the world of commerce and trade, encompassing various roles within the business landscape. This Infographic is an illuminating and dynamic template designed to guide you through the art and science of managing human capital within the business sphere. Explore the key aspects of effective people management and elevate your organizational success by harnessing the power of your workforce. Compatible with Powerpoint, Keynote, and Google Slides. Discover the art of leading and engaging your team, and witness the transformation as your organization excels and grows, driven by the power of effective people management!


4 slides
Elegant Watercolor Background Presentation
Add a touch of sophistication to your presentation with soft watercolor textures that create a calming, professional atmosphere. Perfect for creative projects, proposals, or portfolios, this elegant design blends artistry with clarity. Fully compatible with PowerPoint, Keynote, and Google Slides for seamless customization and a refined visual finish.


6 slides
Numbered Steps Diagram Presentation
Watch your workflow come to life as each step rises in a clean, structured path that makes progress easy to follow. This presentation guides audiences through sequential actions with clarity, helping simplify processes, plans, or instructions. Perfect for business, training, or project teams. Fully compatible with PowerPoint, Keynote, and Google Slides.
5 slides
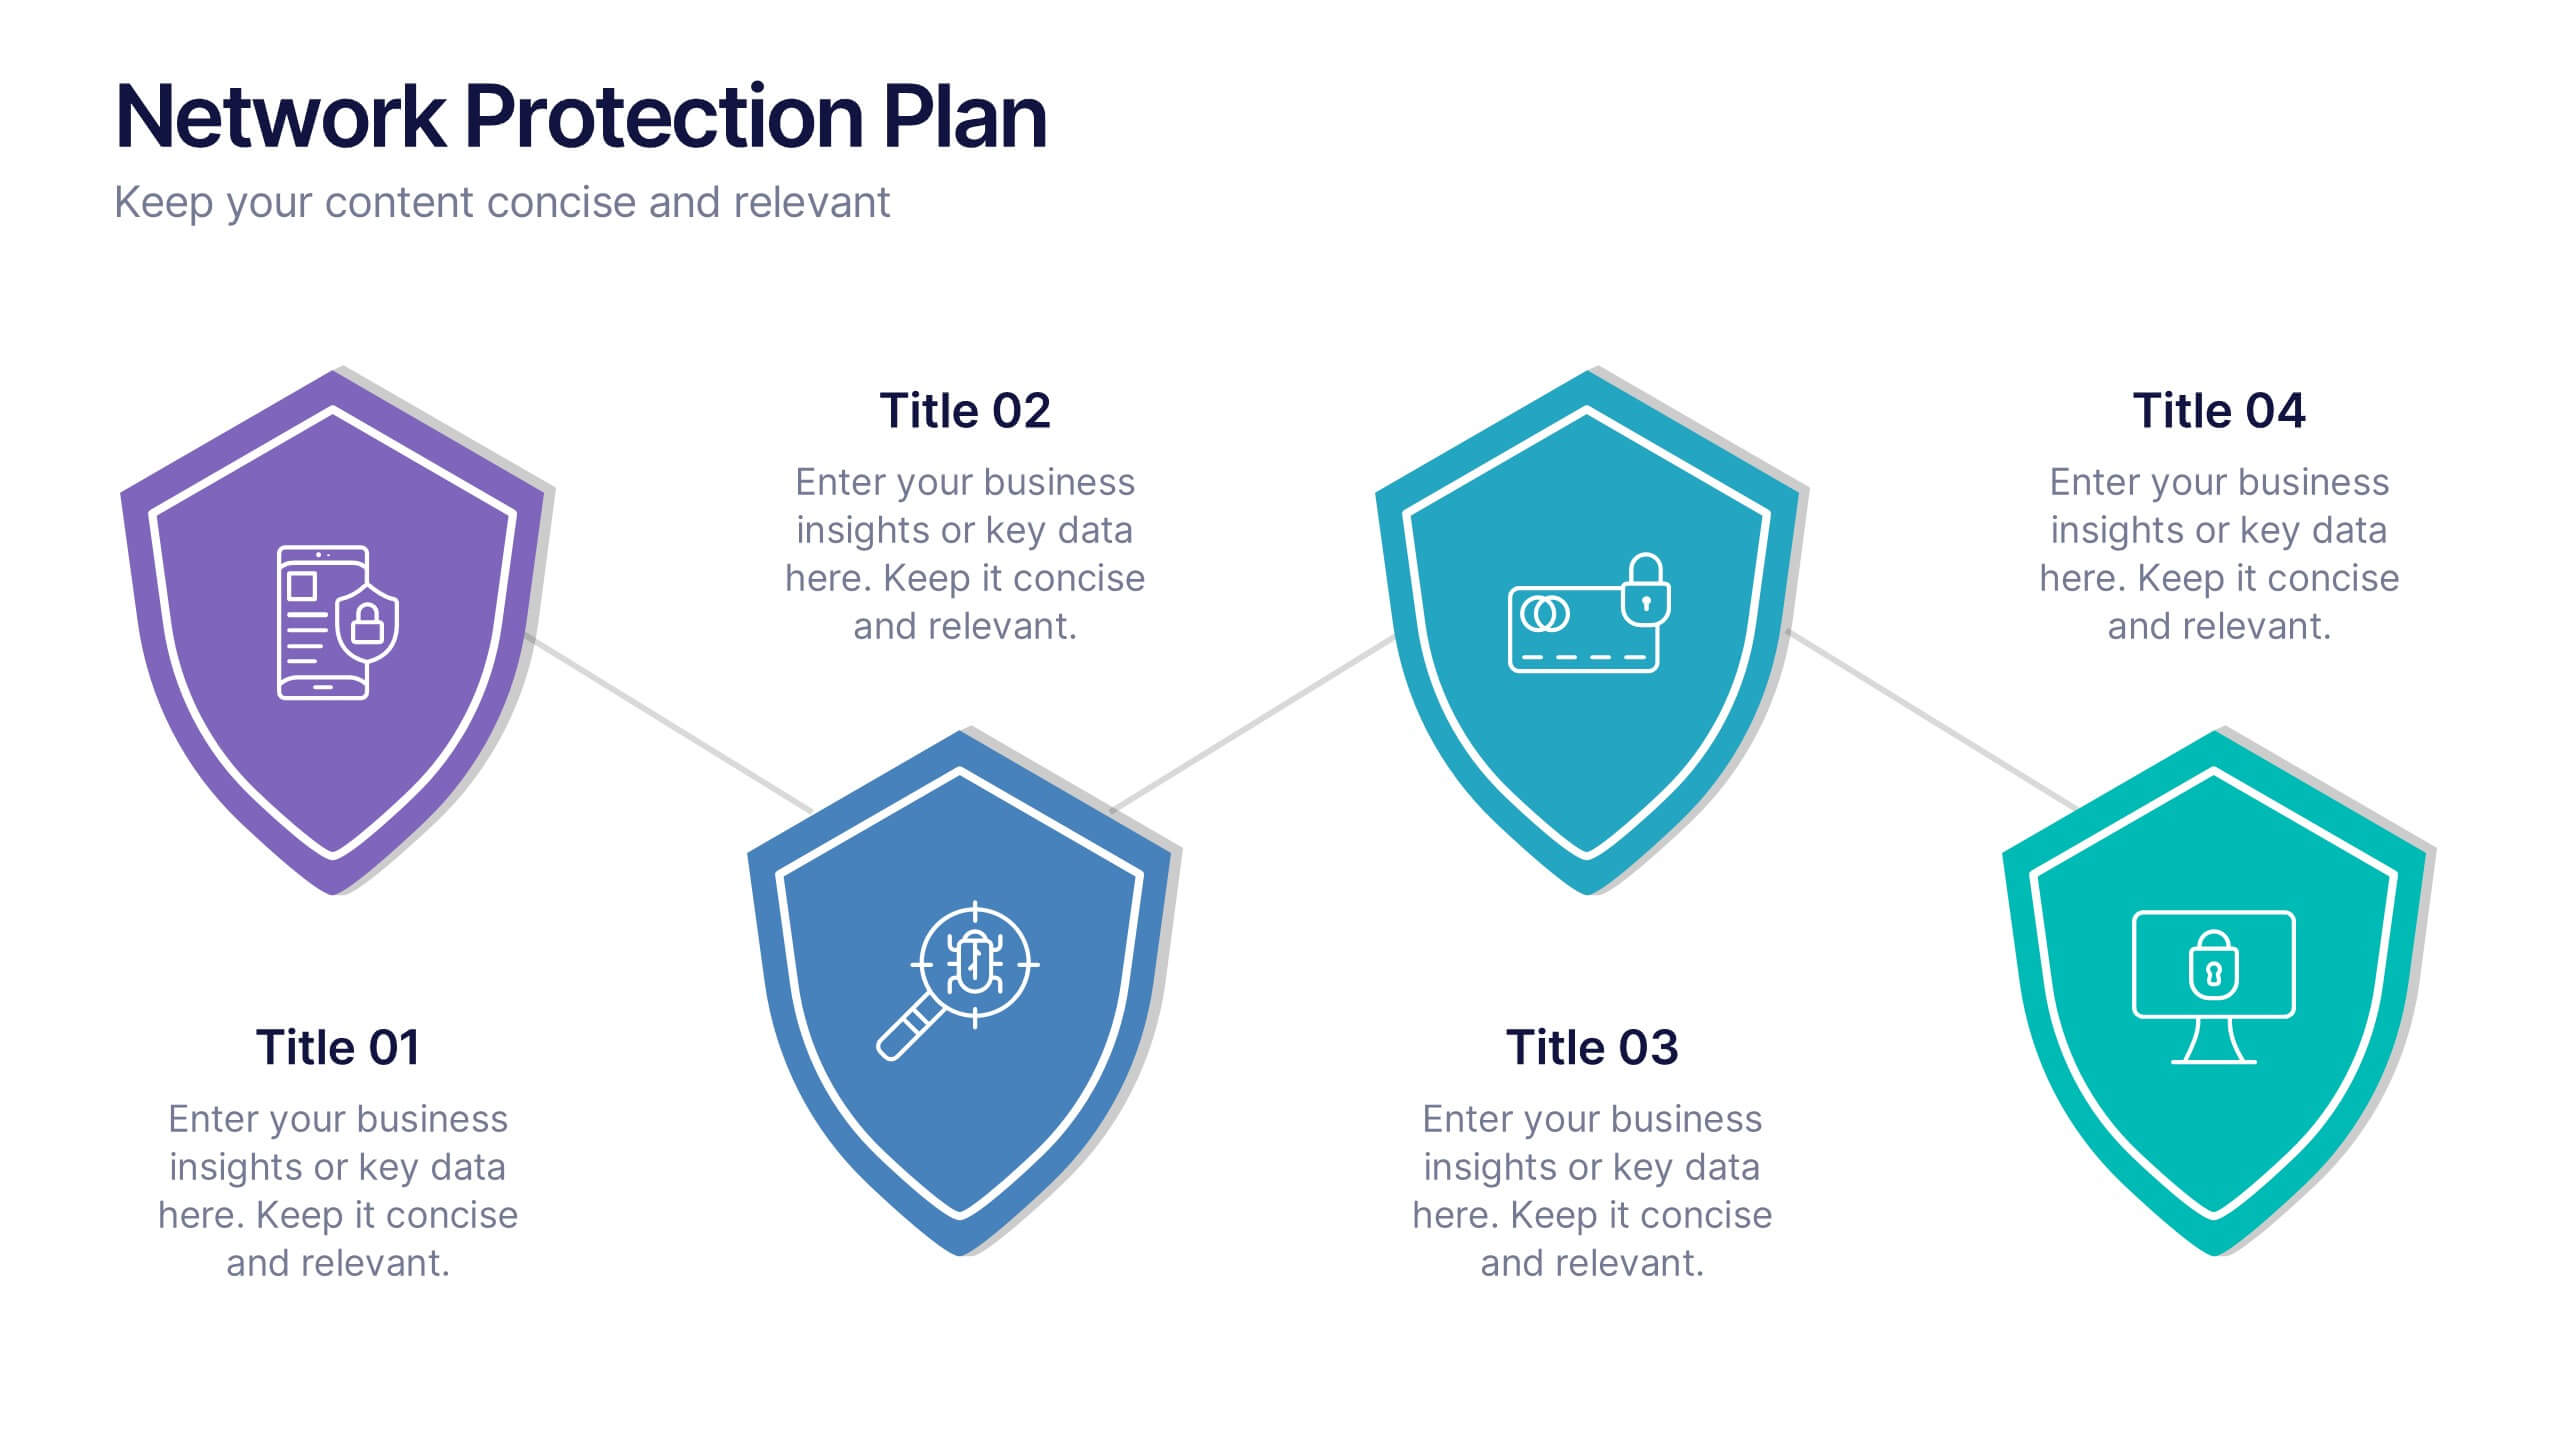
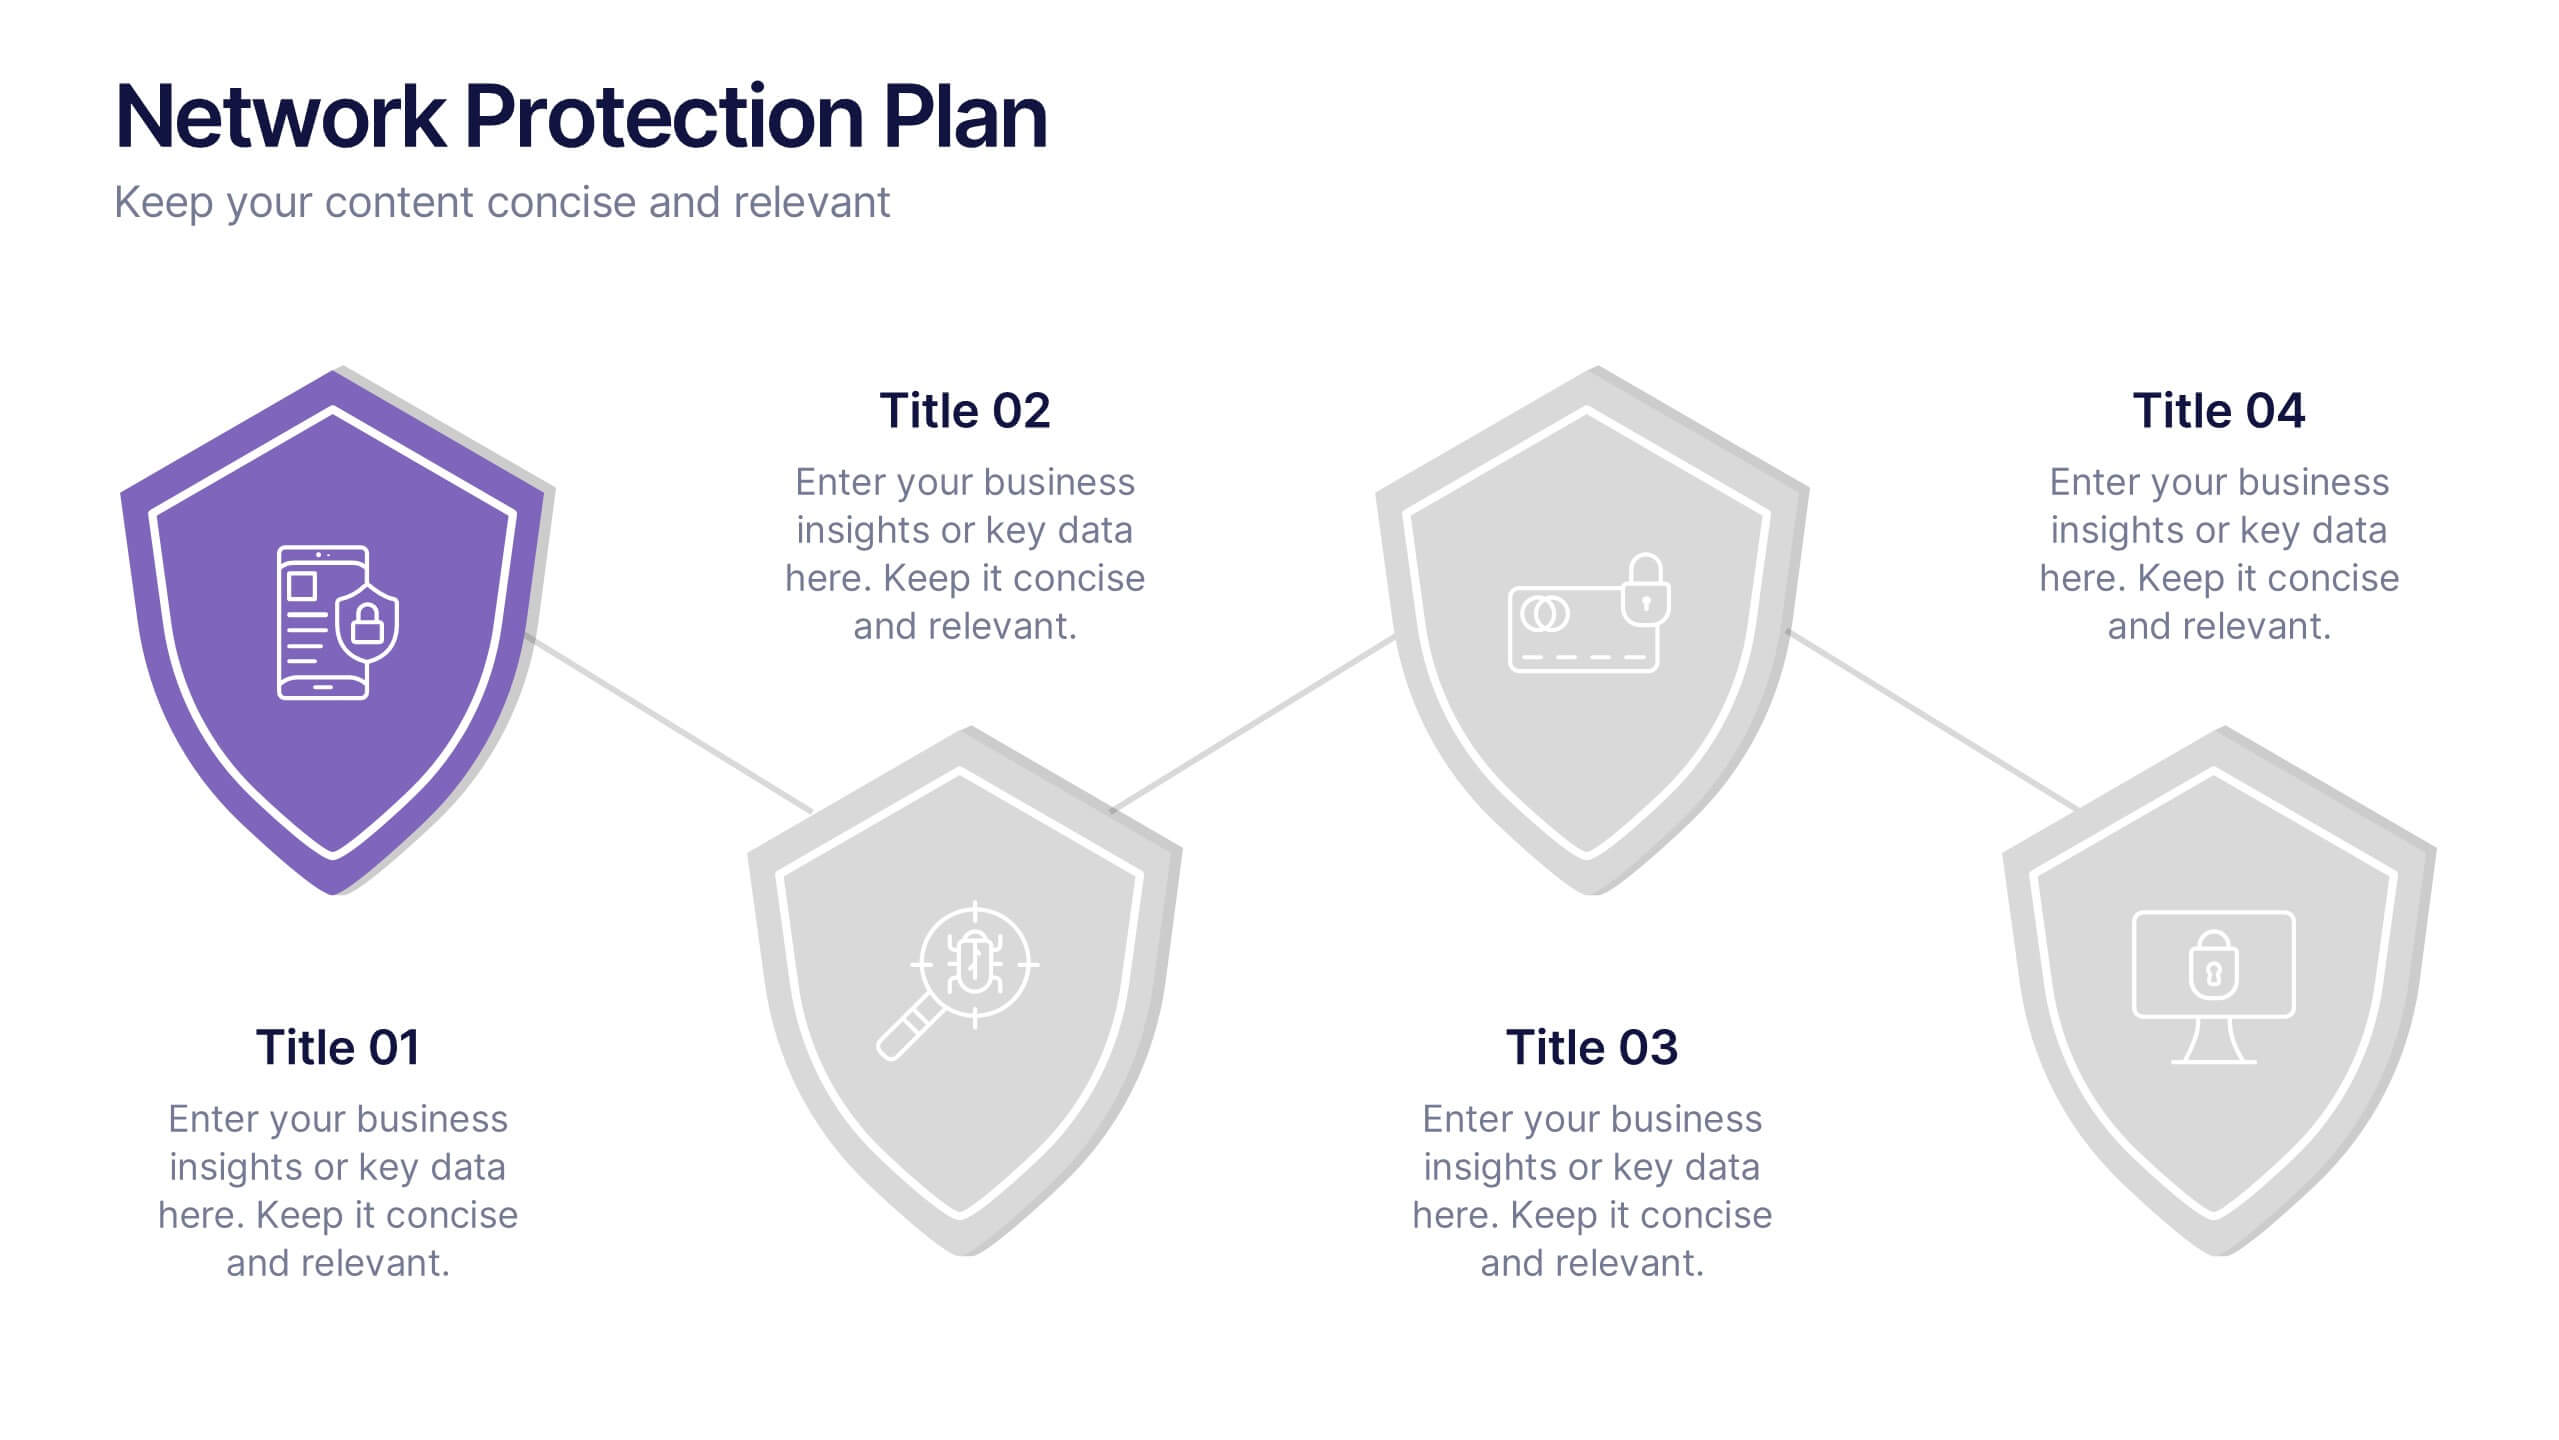
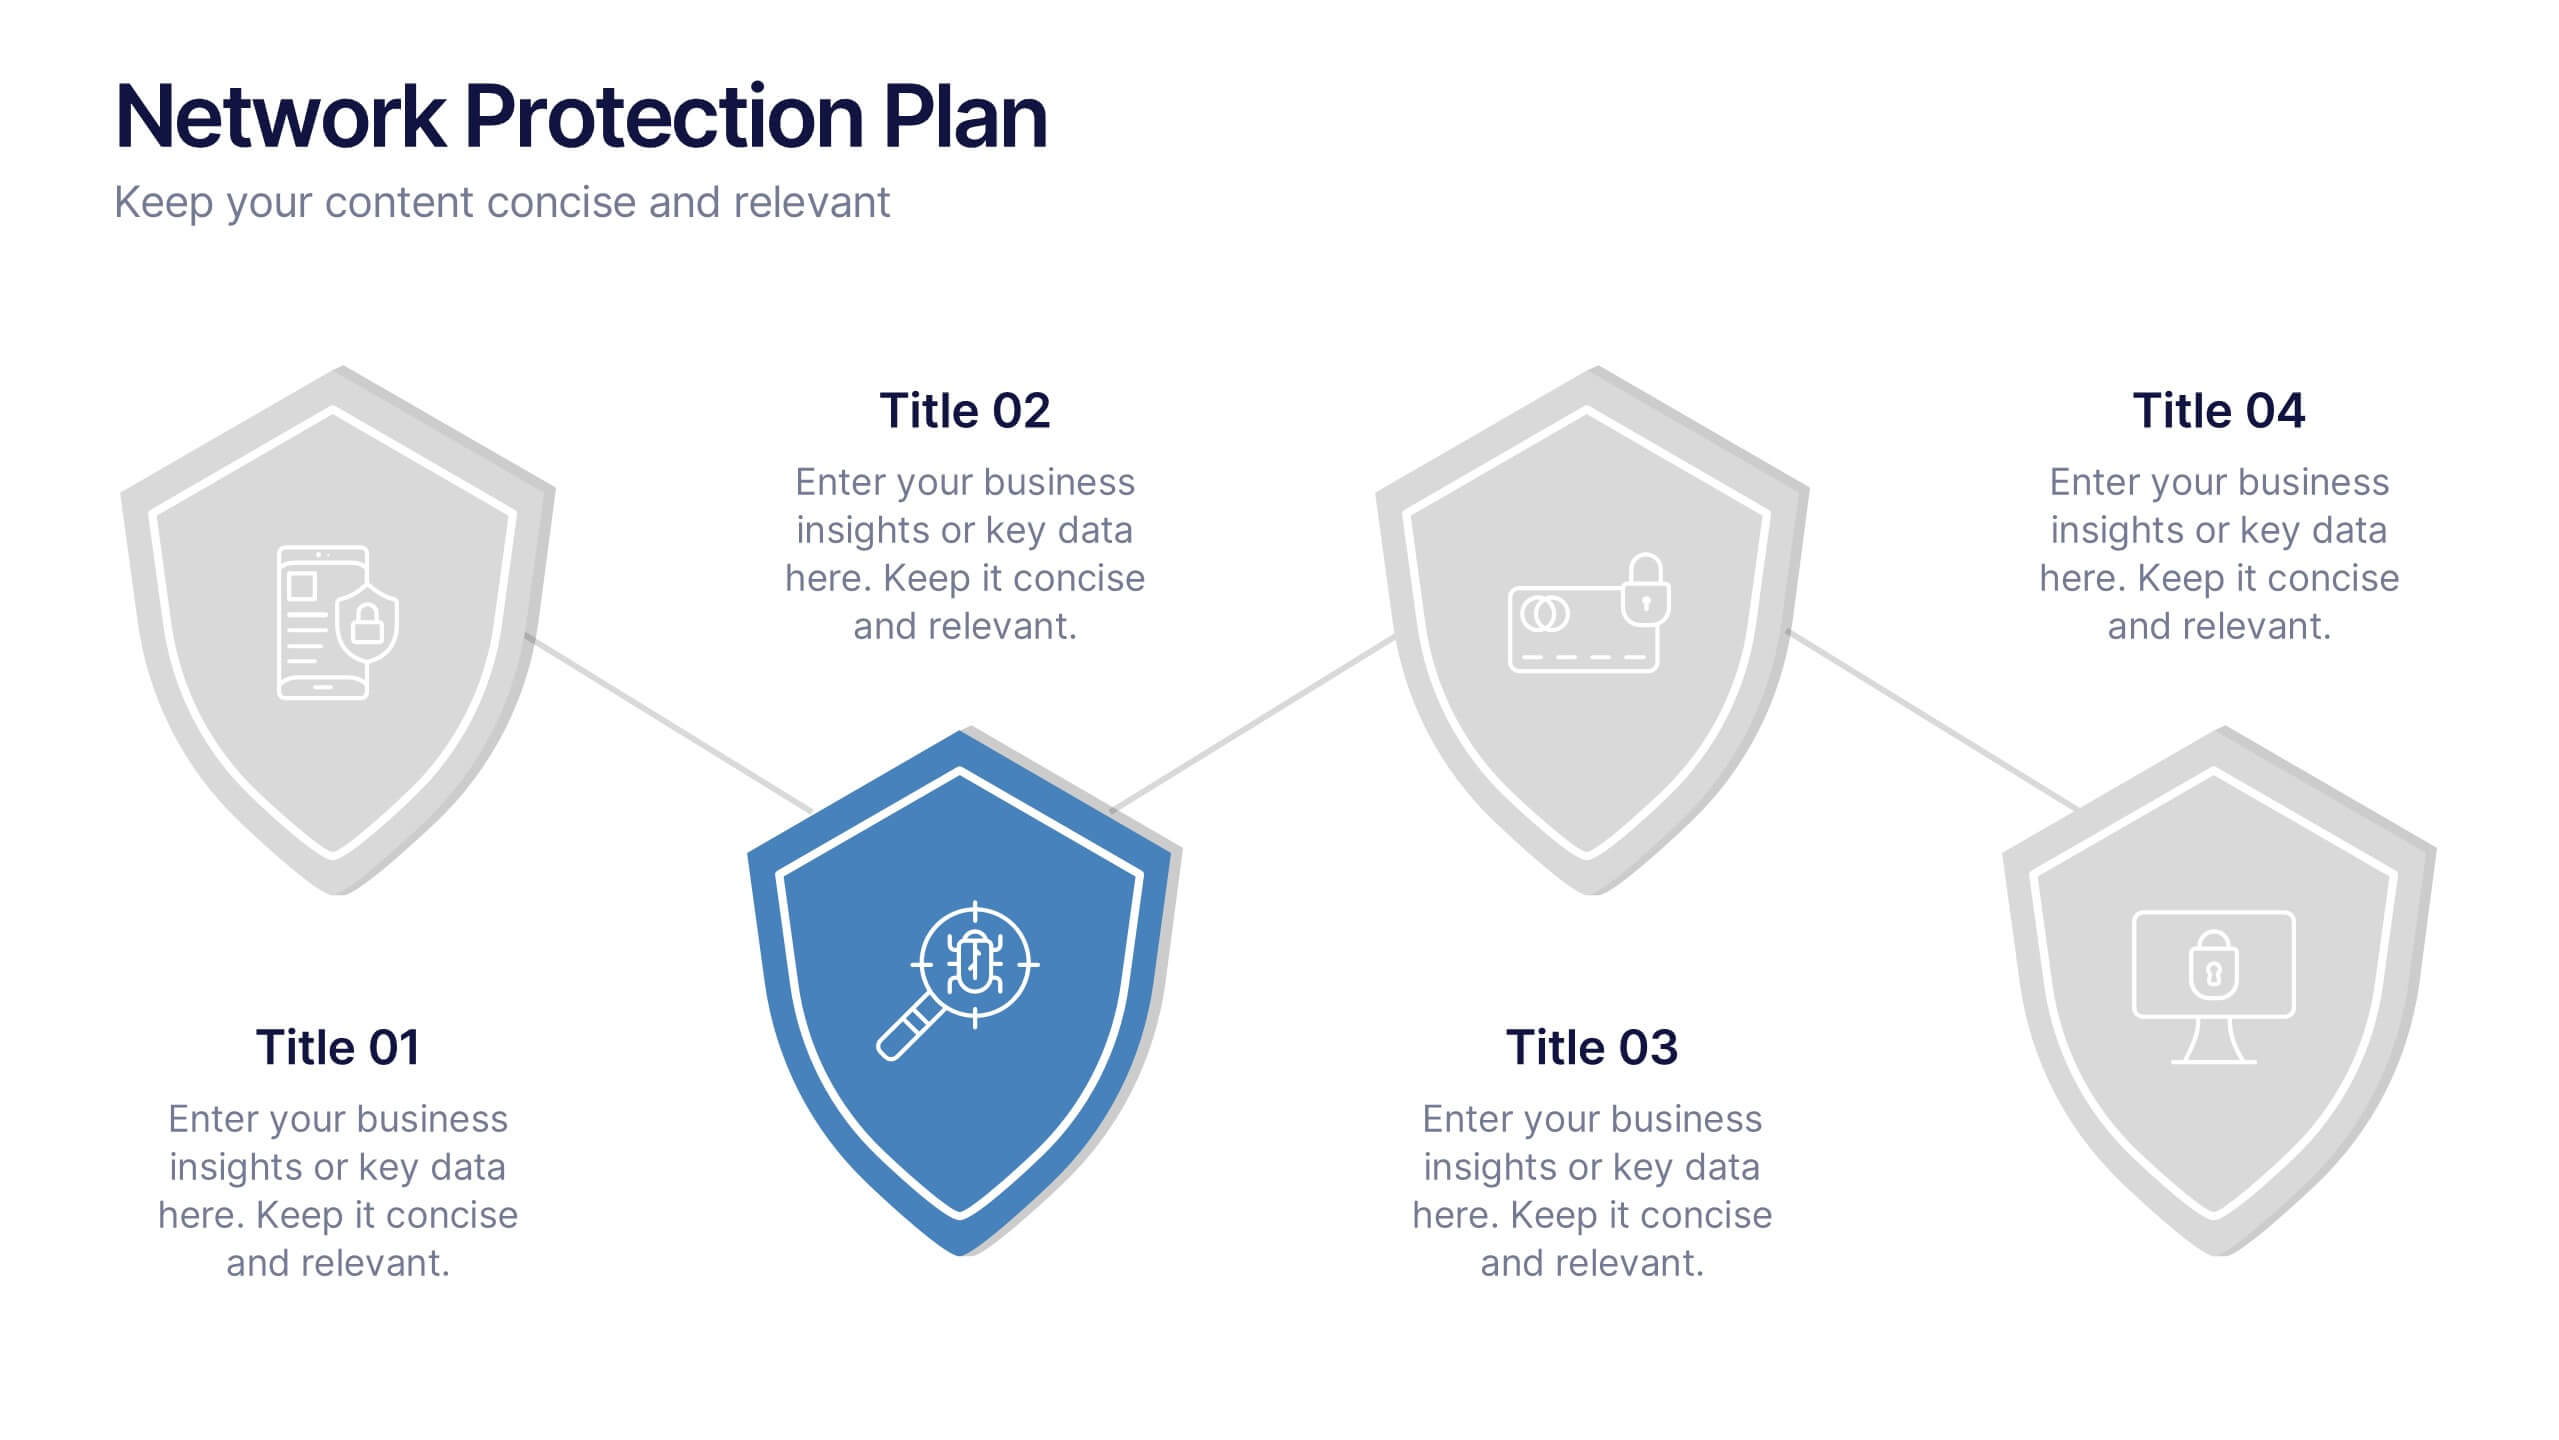
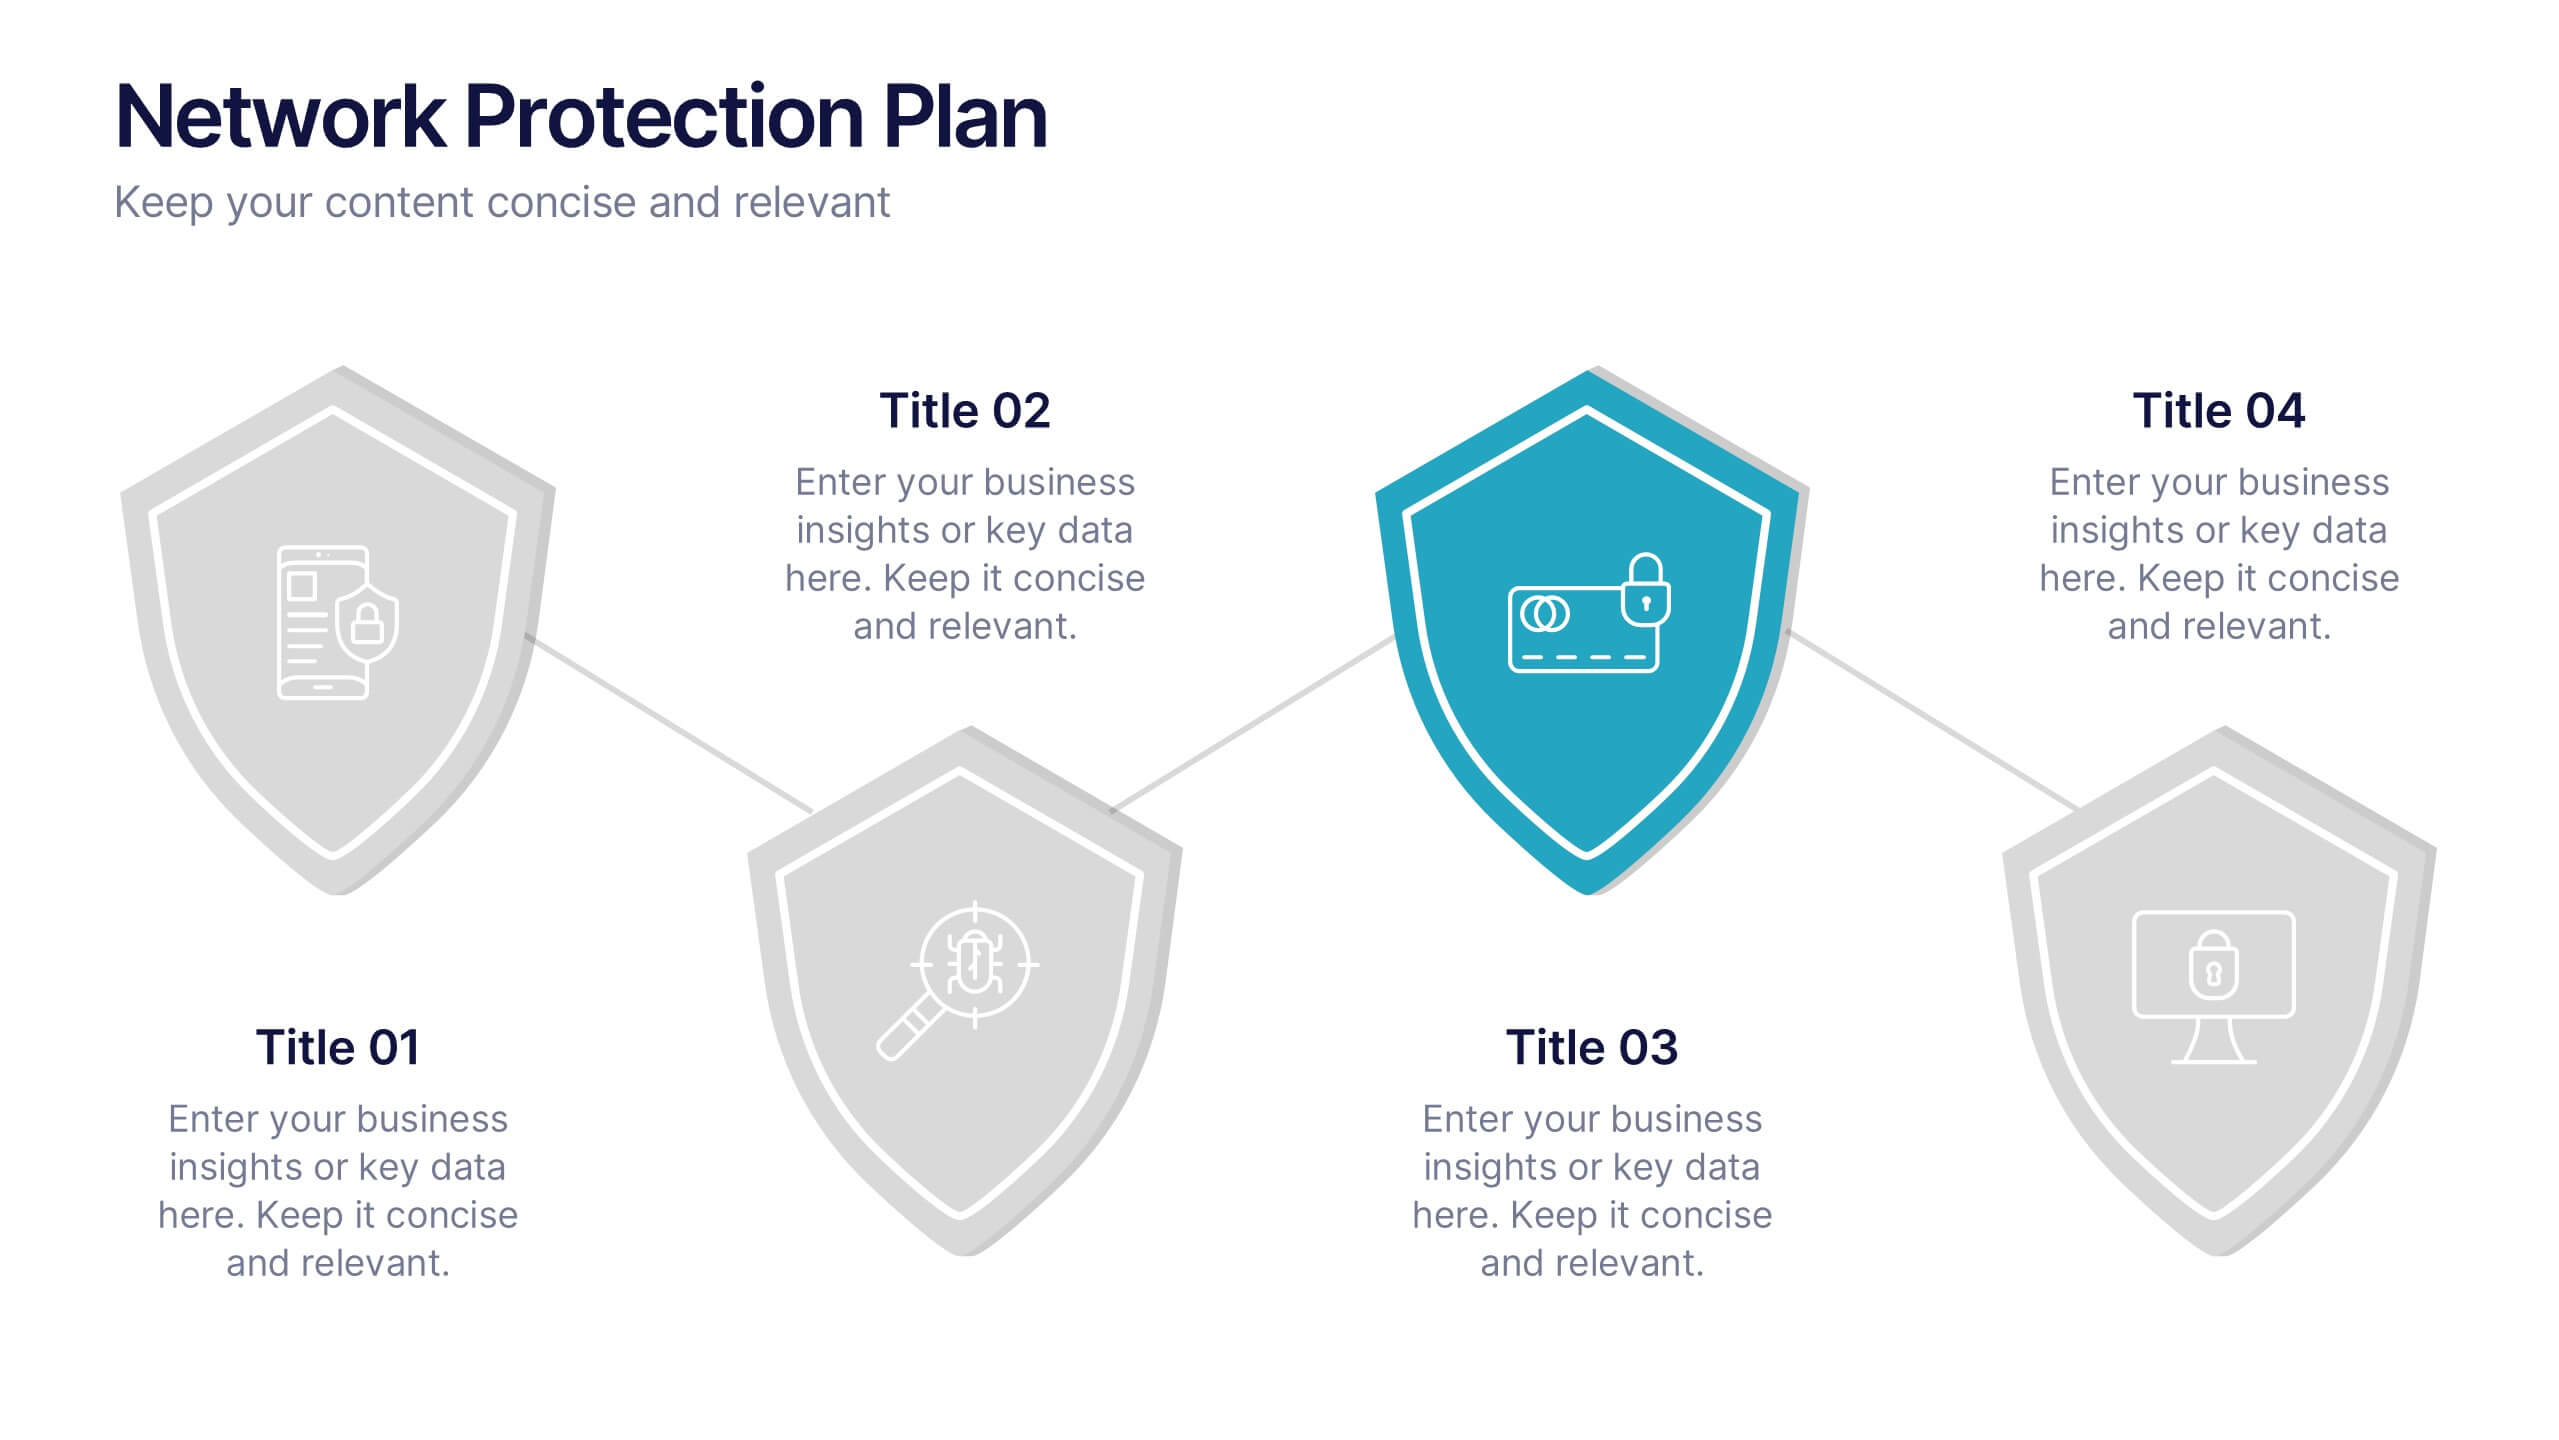
Network Protection Plan Presentation
Bold visuals and clean structure make this presentation a powerful way to communicate your protection strategy with clarity and confidence. It helps you break down key security stages, outline responsibilities, and show how each layer strengthens overall network resilience. Fully compatible with PowerPoint, Keynote, and Google Slides.