Professional Cover Slide Design Presentation
PowerPoint Template and Google Slides Theme
Features
- 2 Unique Slides
- Fully editable and easy to edit in Microsoft Powerpoint, Keynote and Google Slides
- 16:9 widescreen layout
- Clean and professional designs
- Export to JPG, PDF or send by email
- Remove from favorites
Powerpoint Template
1 MB
Google Slides Template
External link
Keynote Template
2 MB
Recommend
- Remove from favorites
Powerpoint Template
1 MB
Google Slides Template
External link
Keynote Template
1 MB
8 slides
Social Media Engagement Report Presentation
Deliver impactful campaign reviews with the Social Media Engagement Report Presentation. This dynamic layout uses a megaphone visual to amplify your messaging and organize engagement data into four key segments. Perfect for tracking audience reactions, measuring reach, or presenting content performance. Compatible with PowerPoint, Keynote, and Google Slides for seamless customization.
- Remove from favorites
Powerpoint Template
1 MB
Google Slides Template
External link
Keynote Template
1 MB
6 slides
Effective Team Structure Guide Presentation
Visualize your team's structure with clarity using this team guide presentation. Designed for highlighting roles, connections, and reporting lines, each slide helps communicate responsibilities and hierarchy efficiently. Ideal for HR, managers, and team leads. Fully editable in PowerPoint, Keynote, and Google Slides—customize colors, names, and positions with ease.
- Remove from favorites
Powerpoint Template
1 MB
Google Slides Template
External link
Keynote Template
1 MB
6 slides
SMART Goals Breakdown Presentation
Bring clarity and momentum to your planning with this clean, easy-to-follow slide that breaks down each step of the SMART framework. It helps audiences understand how goals become actionable through structure and measurement. Perfect for training, strategy, or coaching sessions. Fully compatible with PowerPoint, Keynote, and Google Slides.
- Remove from favorites
Powerpoint Template
1 MB
Google Slides Template
External link
Keynote Template
1 MB
4 slides
Artificial Intelligence Use Cases Overview Presentation
Navigate a maze of insights with this creative template designed to showcase real-world tech applications in a visually engaging way. Whether you're covering machine learning in healthcare or automation in customer service, this AI use case infographic keeps your points clear and organized. Works seamlessly in PowerPoint, Keynote, and Google Slides.
- Remove from favorites
Powerpoint Template
1 MB
Google Slides Template
External link
Keynote Template
2 MB
7 slides
SEO Agency Infographic
A Search Engine Optimization (SEO) agency is a company or organization that provides specialized services aimed at improving a website's visibility in search engines like Google, Bing, and Yahoo. The primary goal of this infographic is to help businesses increase their online presence and drive more organic traffic to their website, ultimately leading to higher visibility, increased website visitors, and potential customers. Compatible with Powerpoint, Keynote, and Google Slides. This vibrant, energetic template is tailor-made for the modern-day digital warrior, ready to conquer the realm of online visibility.
- Remove from favorites
Powerpoint Template
1 MB
Google Slides Template
External link
Keynote Template
2 MB
6 slides
Corporate Governance Strategy
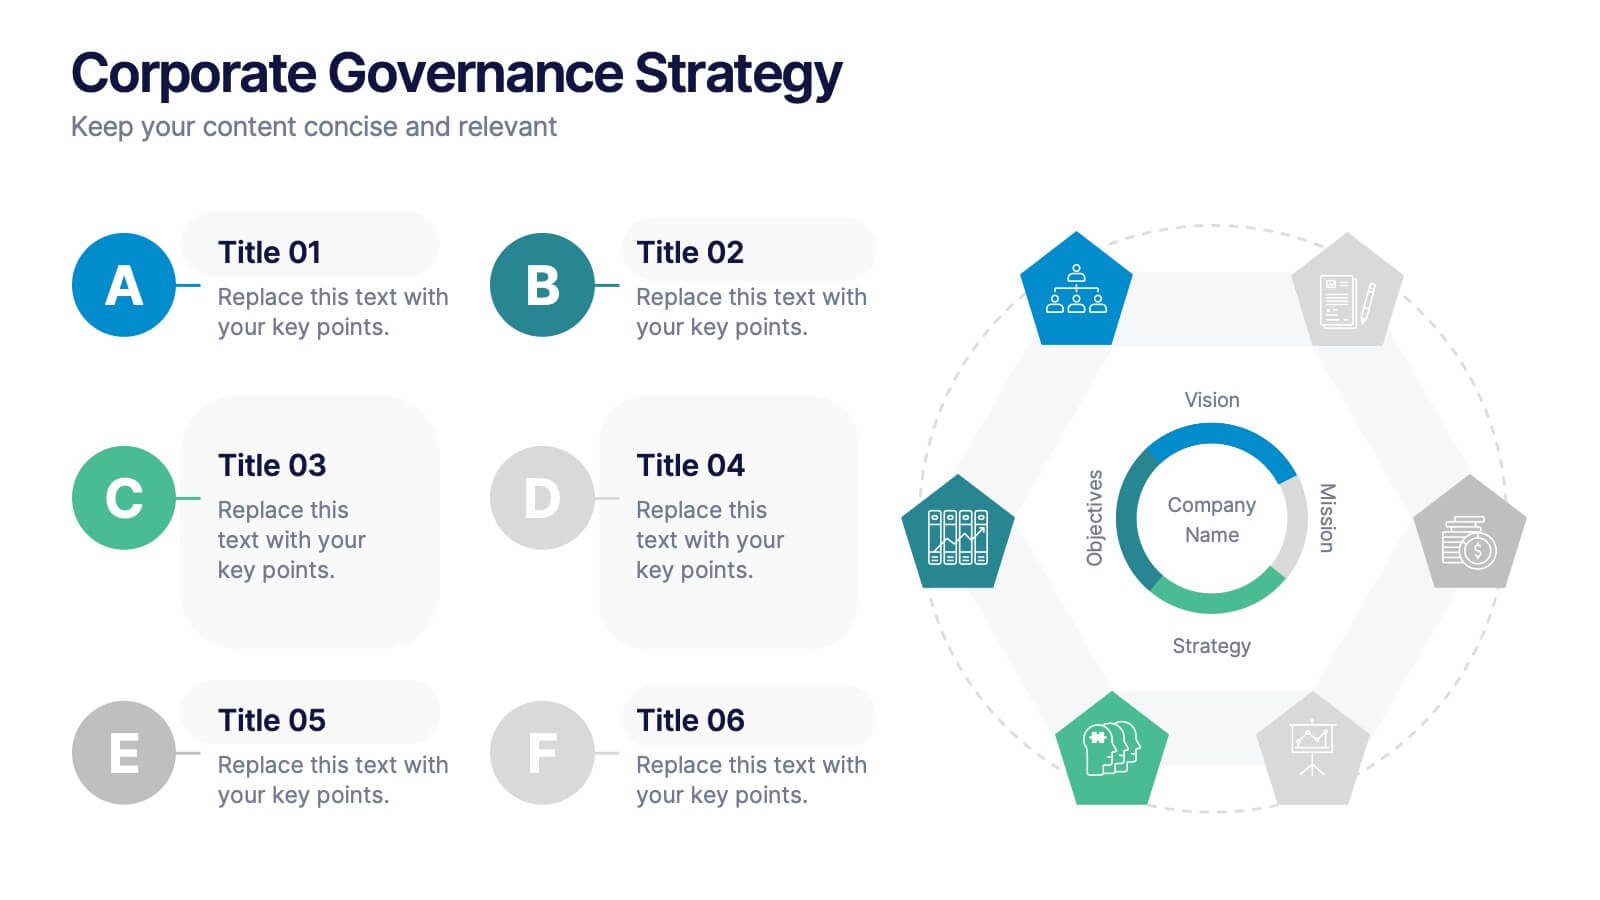
Present your company’s leadership structure with clarity using this corporate governance strategy slide. This hexagonal framework highlights key areas such as vision, objectives, and strategy—surrounded by six supporting pillars. Each section includes editable icons and text for board responsibilities, ethics, oversight, and more. Ideal for executive updates, policy reviews, and stakeholder reports. Fully customizable in PowerPoint, Keynote, and Google Slides.
- Remove from favorites
Powerpoint Template
3 MB
Google Slides Template
External link
Keynote Template
4 MB
2 slides
Business Briefing Executive Summary Presentation
Summarize your strategy with impact using this Business Briefing Executive Summary Presentation. Featuring modern layout options, photo placeholders, and bold typography, this cover slide is ideal for team updates, pitch decks, or project reports. Fully editable in PowerPoint, Google Slides, Keynote, and Canva.
- Remove from favorites
Powerpoint Template
1 MB
Google Slides Template
External link
Keynote Template
2 MB
5 slides
Comparative Assessment Using Harvey Ball Chart
Showcase multiple data points with clarity using this Comparative Assessment Using Harvey Ball Chart presentation template. Designed for visualizing progress, performance, or preference across 5 categories, each slide features Harvey Balls with percentage indicators, icons, and explanatory text sections. Ideal for business reviews, audits, or strategy discussions, this template helps communicate variances in an intuitive, side-by-side format. Fully editable in PowerPoint, Google Slides, and Keynote.
- Remove from favorites
Powerpoint Template
2 MB
Google Slides Template
External link
Keynote Template
2 MB
2 slides
Professional Thank You Closing Slide Presentation
Make your last impression count with a clean, modern closing slide that wraps up your presentation in style. This template is designed to help you leave a professional mark while displaying contact info, brand visuals, or a thank-you note. Fully compatible with PowerPoint, Keynote, and Google Slides for flexible use.
- Remove from favorites
Powerpoint Template
1 MB
Google Slides Template
External link
Keynote Template
1 MB
5 slides
Pet Clinic Business Strategy Presentation
Enhance your pet clinic's approach with our Pet Clinic Business Strategy presentation template. This layout is expertly designed to outline your clinic’s key strategies and enhance your operational excellence, making it perfect for meetings, stakeholder presentations, and strategic workshops.
- Remove from favorites
Powerpoint Template
1 MB
Google Slides Template
External link
Keynote Template
1 MB
4 slides
Banking Products and Credit Overview Presentation
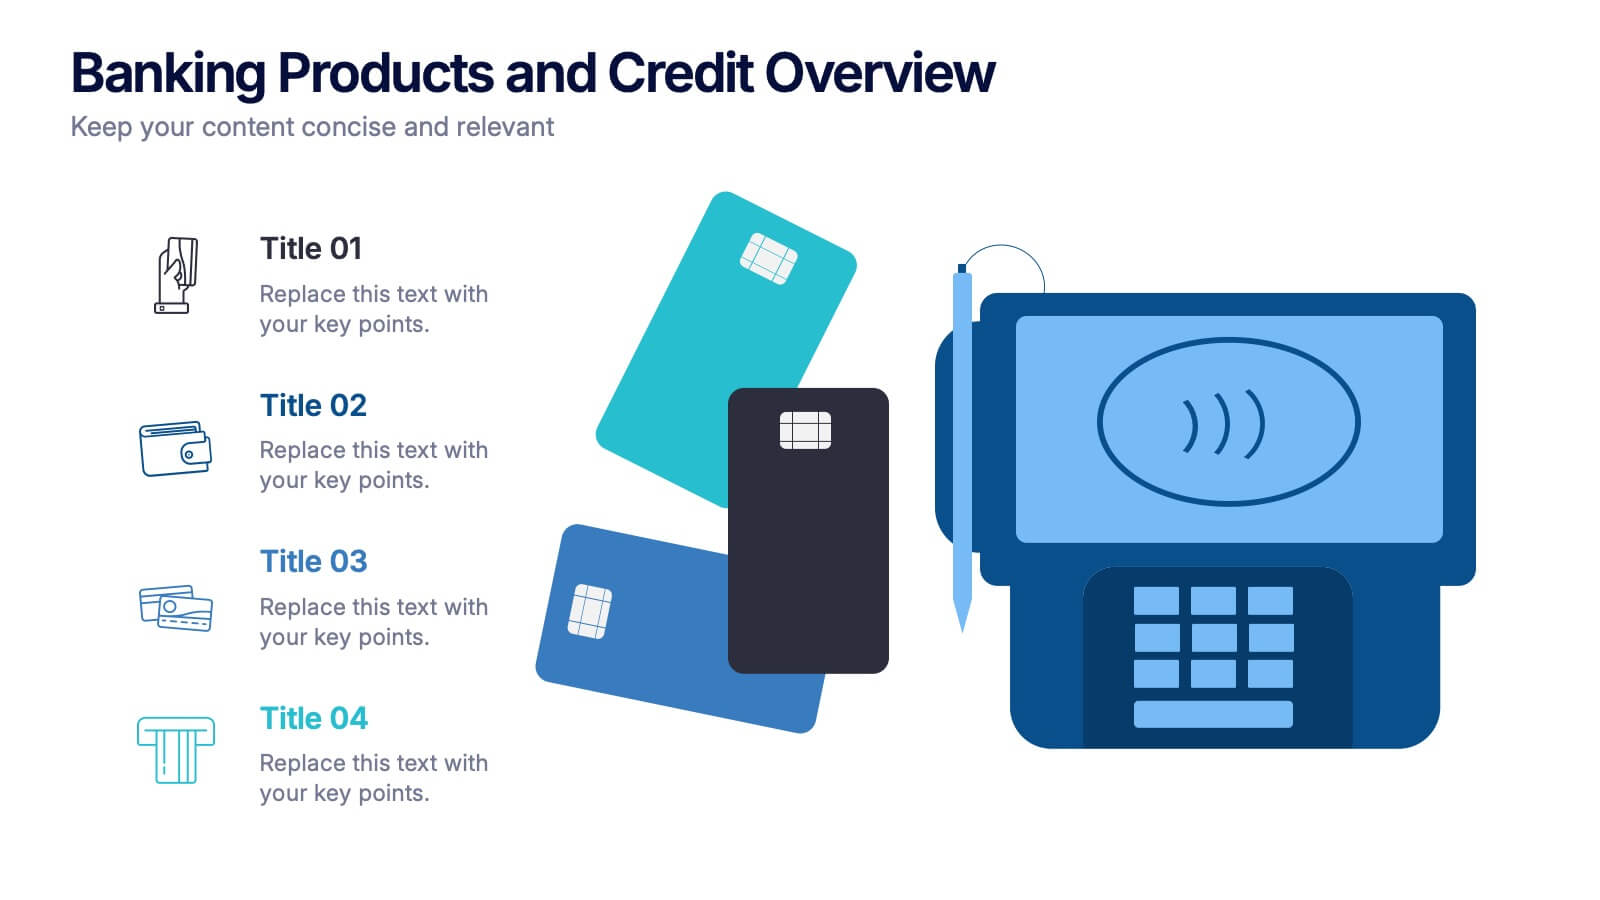
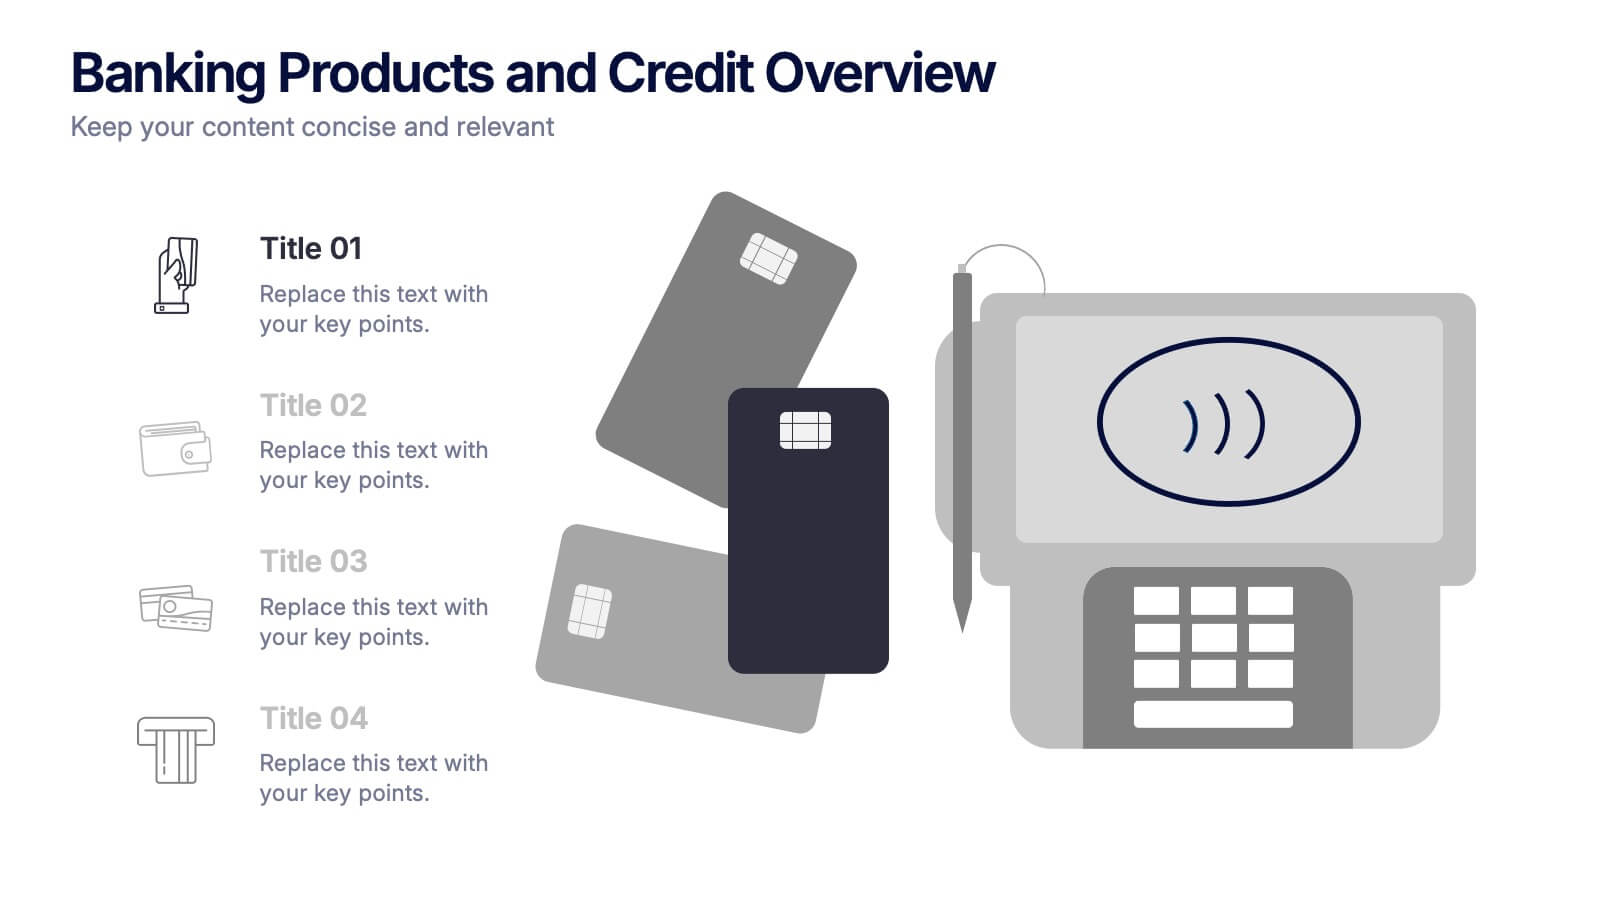
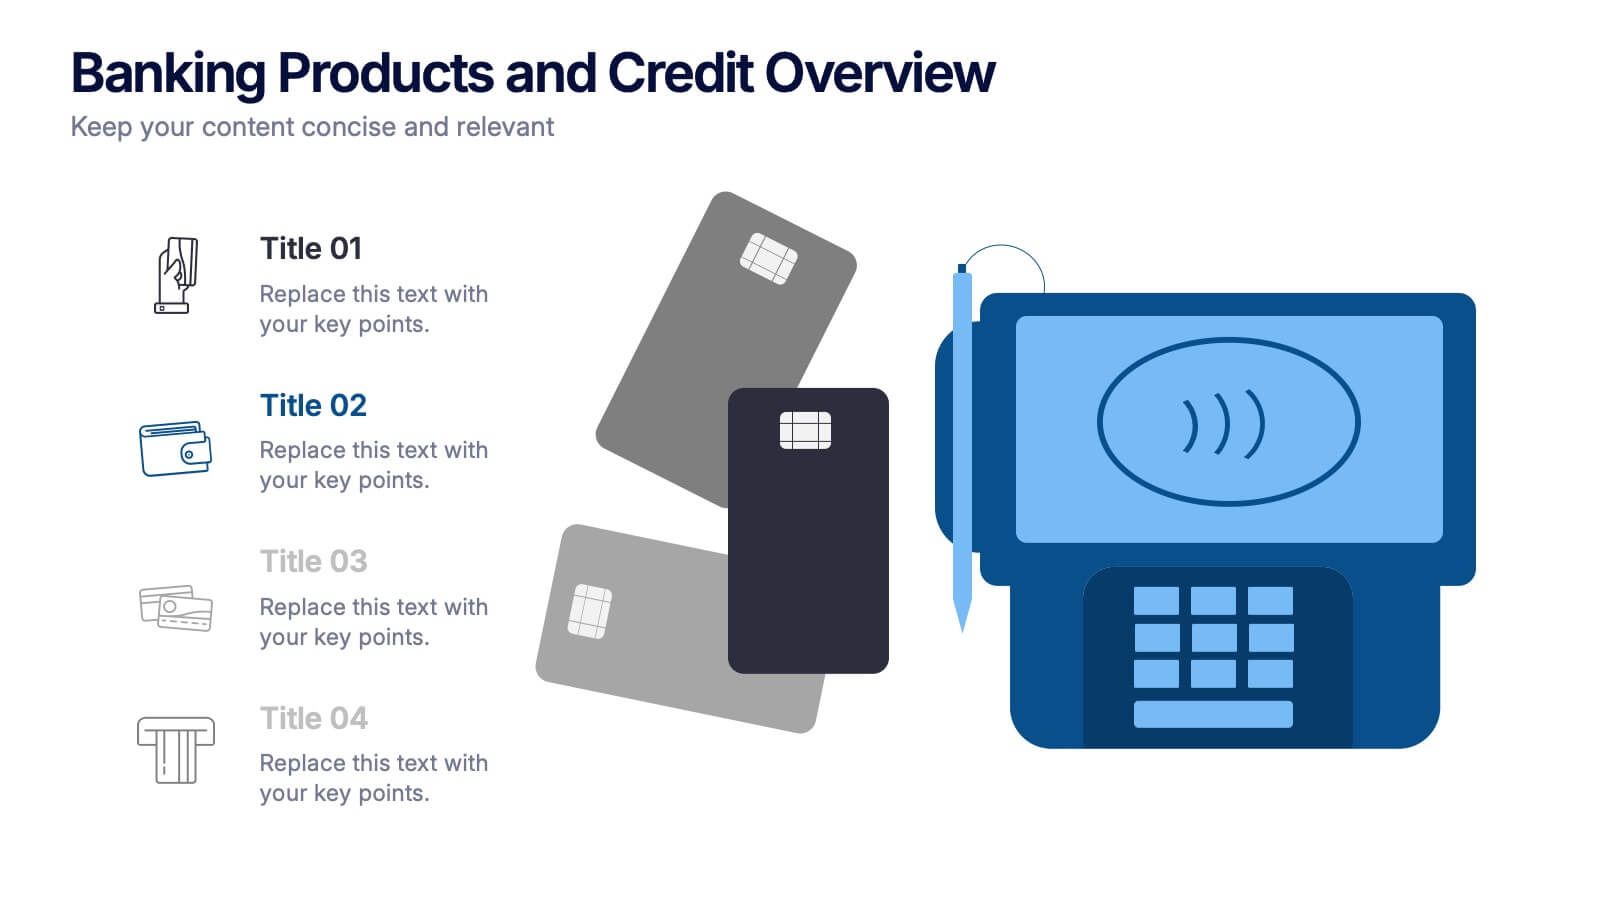
Make your next presentation feel like a swipe of a card—clear, sleek, and purposeful. This layout is perfect for explaining the differences between financial products, highlighting banking services, and breaking down credit-related insights. Fully customizable and professionally designed for PowerPoint, Keynote, and Google Slides, it's ideal for any financial overview presentation.
- Remove from favorites
Powerpoint Template
1 MB
Google Slides Template
External link
Keynote Template
2 MB
6 slides
Real Estate and Building Development
Visualize the complete property development process with this modern, keyhole-inspired presentation design. Ideal for real estate developers, architects, and construction planners, this slide clearly outlines six project stages—from concept to completion—using bold icons and a radial layout. Editable in PowerPoint, Keynote, and Google Slides.
- Remove from favorites
Powerpoint Template
1 MB
Google Slides Template
External link
Keynote Template
1 MB
10 slides
Work-Life Balance and Time Planning Presentation
Showcase strategies for harmony and productivity with this scale-themed presentation template. Designed to highlight balance, prioritization, and goal-setting, this visual layout divides your content into four clear parts—perfect for wellness initiatives, HR planning, or personal productivity talks. Fully editable in PowerPoint, Keynote, and Google Slides.
- Remove from favorites
Powerpoint Template
1 MB
Google Slides Template
External link
Keynote Template
1 MB
7 slides
Project Status Summary Infographic
A Project Status Summary is an overview or report that provides key information about the progress, performance, and current state of a project. This infographic template is a visual tool designed to provide a quick and comprehensive overview of your project's progress, empowering you to track milestones, anticipate roadblocks, and ensure project success. This template is ideal for project management and communication, allowing stakeholders to quickly grasp the project's status without delving into detailed project documents. The goal of this Project Status is to present a snapshot of your project's progress in an easily understandable format.
- Remove from favorites
Powerpoint Template
1 MB
Google Slides Template
External link
Keynote Template
1 MB
4 slides
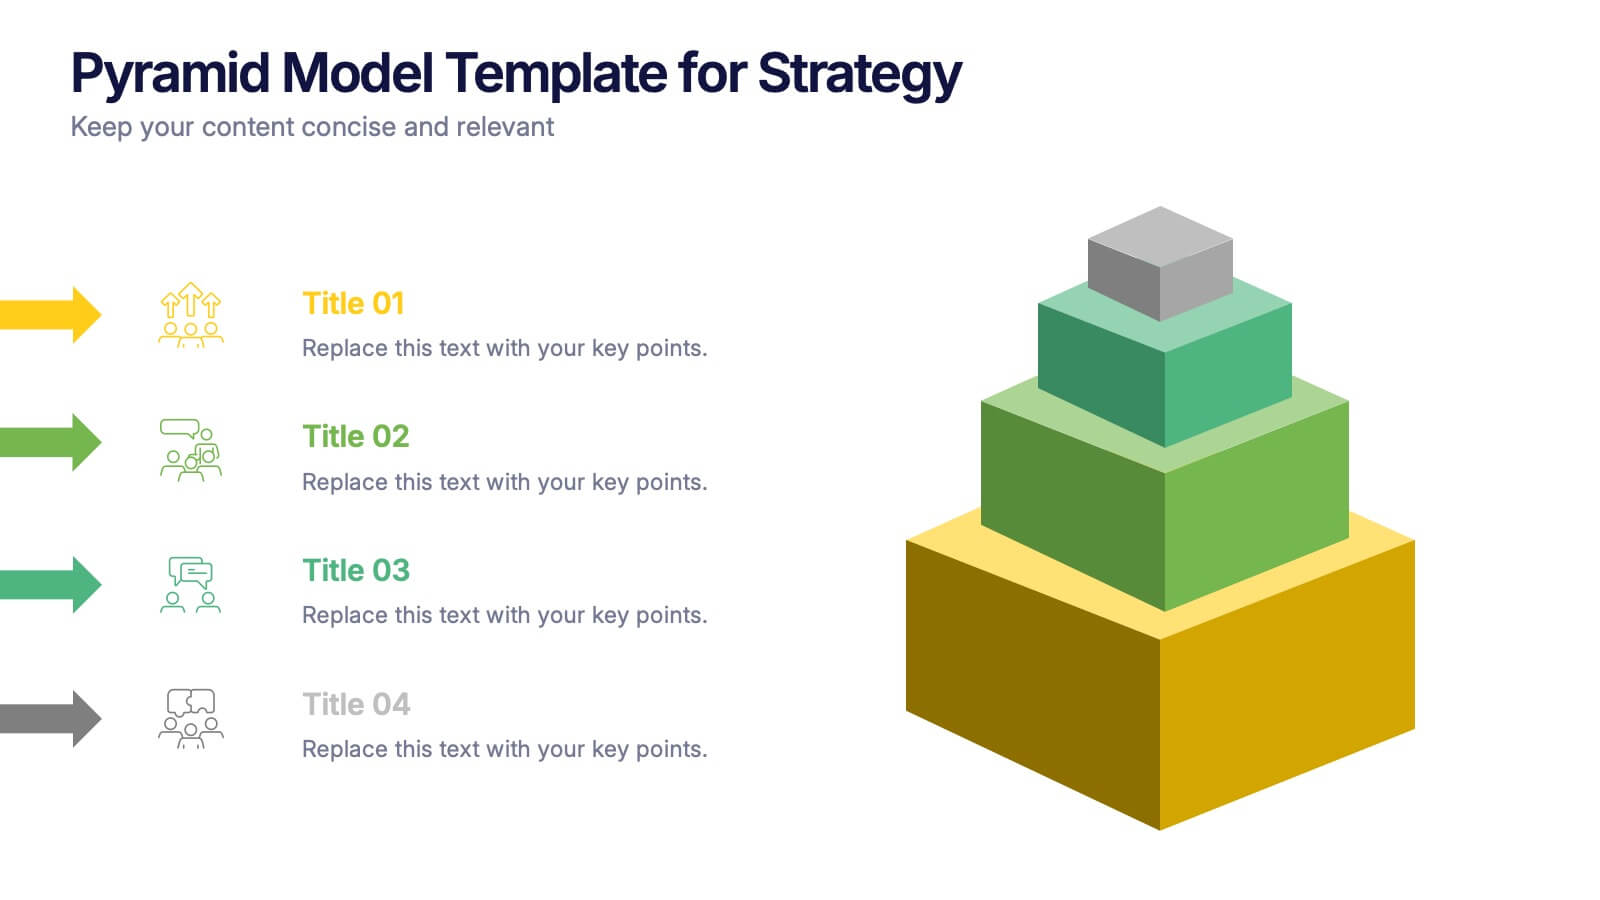
Pyramid Model Template for Strategy Presentation
Bring your strategic ideas to life with a bold layered visual that makes priorities and planning feel instantly clear. This presentation helps you break down concepts, illustrate hierarchy, and communicate long-term direction with confidence and simplicity. Fully compatible with PowerPoint, Keynote, and Google Slides.
- Remove from favorites
Powerpoint Template
1 MB
Google Slides Template
External link
Keynote Template
2 MB
7 slides
Marketing Team Infographic
This collection showcases a series of slides dedicated to optimizing marketing team operations and strategies. Each template is designed to cater to various facets of marketing planning and execution, featuring layouts that help articulate team roles, campaign timelines, budget allocations, and performance metrics. The slides incorporate diverse visual elements, such as hierarchical diagrams, flow charts, and graphs, to ensure complex information is accessible and engaging. Customizable color palettes and design elements allow for seamless integration into existing corporate branding, making these templates not only functional but also aesthetically aligned with company standards. Ideal for marketing strategy presentations, team meetings, and stakeholder briefings, these slides facilitate a comprehensive overview of marketing efforts, pinpointing achievements and areas for improvement. The adaptability of these templates makes them an essential tool for marketing professionals aiming to communicate effectively and drive results.
- Remove from favorites
Powerpoint Template
1 MB
Google Slides Template
External link
Keynote Template
2 MB
7 slides
Food Recipes Infographic Presentation
Food is a source of energy, nutrients and other substances. These are the basic necessities for growth and development of the body. Help your audience take a closer look at the ingredients of your food with this infographic! This template will allow you to easily convey the healthy benefits of certain foods and what to avoid. It features a variety of visual styles and easy to use editing tools like text boxes, shapes, icons and other editable elements. It is completely customizable and compatible with Powerpoint, Keynote, and Google Slides, so you can change colors, fonts and more.


