


Features
- 4 Unique Slides
- Fully editable and easy to edit in Microsoft Powerpoint, Keynote and Google Slides
- 16:9 widescreen layout
- Clean and professional designs
- Export to JPG, PDF or send by email


Do you have any questions?
Recommend


5 slides
Project Planning and Rollout Timeline
Stay on track from kickoff to delivery with the Project Planning and Rollout Timeline Presentation. This curved roadmap layout visually guides your audience through five sequential stages—perfect for illustrating workflows, rollout phases, or go-to-market strategies. Easily customizable in PowerPoint, Keynote, and Google Slides to suit any project.


5 slides
Data Breach Infographics
A data breach refers to an incident where unauthorized individuals gain access to sensitive, confidential, or protected information. This infographic is designed to educate and raise awareness about data breaches, their causes, impacts, and preventive measures. It presents complex information in an understandable way, making it accessible to a wide range of audiences. The template incorporates relevant statistics and data to provide a comprehensive understanding of the prevalence and scale of data breaches. It includes graphs, charts, and infographics to visualize the frequency, magnitude, and industries most affected by data breaches.


5 slides
Target Audience Analysis Slide Presentation
Discover who your audience truly is with this clear and visually balanced layout designed to simplify audience insights. Perfect for marketing plans, presentations, and strategy reports, it helps you visualize key demographics and behaviors effortlessly. Fully customizable and compatible with PowerPoint, Keynote, and Google Slides for easy editing.


7 slides
South America Political Map Infographic
Dive into the vibrant landscapes of South America with our detailed map infographic. Infused with the pure essence of white, the depth of blue, and the vivacity of green, our template beautifully mirrors South America's diverse topography and culture. Enhanced with spot-on infographics, representative icons, and country-centric image placeholders, it offers a panoramic view of this dynamic continent. Seamlessly constructed for Powerpoint, Keynote, or Google Slides. An indispensable asset for educators, travelers, geographers, or businesses eyeing the South American market. Venture with clarity; let every slide be an exploration of South America's wonders.


5 slides
Supply Chain Management Plan Presentation
Streamline your presentation with a sleek and organized design built to illustrate process flow and logistics. Perfect for explaining production stages, delivery systems, or business operations, this visual layout brings clarity and structure to your message. Compatible with PowerPoint, Keynote, and Google Slides for effortless customization and use.


7 slides
Loves Travel Infographic Presentation
Travel is an opportunity to get out of our comfort zones and be inspired to try new things, it changes our perspective on the world. Use this template to give your audience an overview of a trip and prepare them for what they will be experiencing. This template features an infographic style design, with plenty of room to describe the locations and activities as well as instructions and tips. Build your own infographic with this template, and add it to your presentations. You can easily add your own content in PowerPoint, Keynote, or Google slides and turn it into a fun presentation in minutes.


4 slides
Europe Market Expansion Visualization Presentation
Showcase your European growth strategy with the Europe Market Expansion Visualization Presentation. This map-based slide design allows you to clearly highlight regional opportunities, new market entries, and key expansion zones using icons and color-coded country markers. Ideal for strategic planning, investor updates, and sales overviews. Fully editable in PowerPoint, Keynote, Google Slides, and Canva.


5 slides
Project Boundaries and Deliverables Presentation
Visualize key checkpoints with the Project Boundaries and Deliverables Presentation. This flag-style timeline infographic clearly marks each phase of your project journey—ideal for outlining scope, goals, and delivery milestones. Designed for clarity and progress tracking, this template works seamlessly in PowerPoint, Keynote, and Google Slides.


6 slides
Blue Ocean Trade Infographic
The Blue Ocean strategy is a concept that focuses on creating uncontested market spaces rather than competing in existing market segments. This captivating infographic template showcases the concept of blue ocean trade and its impact on business growth and innovation. It provides an engaging and informative overview of the blue ocean strategy, highlighting its key principles and benefits for businesses. This template provides a comprehensive overview of blue ocean trade and serves as an inspiring resource for those seeking innovative business strategies. Fully compatible with Powerpoint, keynote, and Google Slides.


4 slides
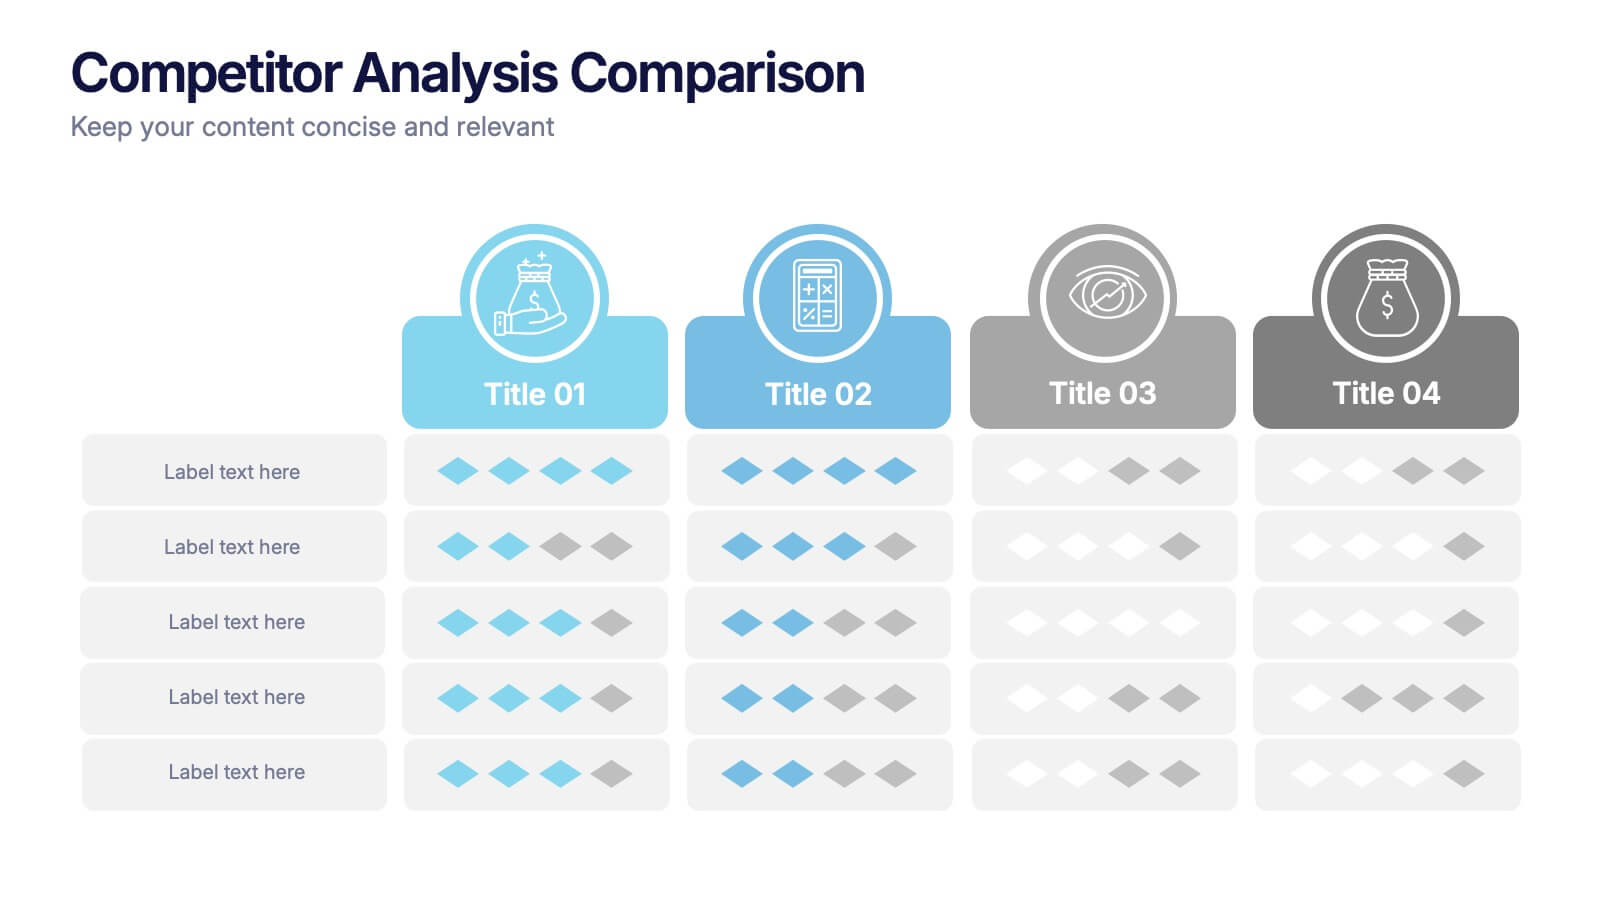
Competitor Analysis Comparison Presentation
Quickly evaluate strengths and weaknesses across your market landscape with this Competitor Analysis Comparison Presentation. Featuring clean tables, icons, and rating visuals, it's ideal for highlighting where your brand stands out. Fully editable in PowerPoint, Keynote, and Google Slides.


10 slides
Territorial Insights with South America Map Presentation
Unlock regional clarity with the Territorial Insights with South America Map Presentation. This editable slide visualizes country-specific highlights using a modern grid-based map layout, customizable color zones, and label connectors to break down key insights. Ideal for sales analysis, market entry strategies, or logistics reporting. Compatible with PowerPoint, Keynote, Google Slides, and Canva.


4 slides
3-Tier Pricing Table Layout Presentation
Make your pricing pitch pop with this bold and modern layout! This presentation template is perfect for showcasing product or service plans with clear comparisons across three tiers. Designed to streamline pricing communication, it’s ideal for SaaS, consulting, or digital services. Fully compatible with PowerPoint, Keynote, and Google Slides.


5 slides
Multiphase Planning with Strategy Wheel Presentation
Visualize your project’s lifecycle with this five-part strategy wheel layout. Each labeled segment highlights a phase in your planning process, ideal for showcasing sequential steps or stages. Fully editable in PowerPoint, Keynote, and Google Slides, this template simplifies complex workflows while maintaining a clean, professional design for strategic presentations.


6 slides
Remote Work Productivity Presentation
The "Remote Work Productivity" presentation template features a clean and modern design, ideal for showcasing strategies and statistics related to remote work efficiency. Each slide allows for the display of key data points and statistics, supported by visual elements like percentage indicators and progress bars that enhance the presentation’s readability and impact. This template is perfect for businesses looking to improve remote operations or present data-driven insights into remote work performance, making it easier for viewers to grasp the effectiveness of remote work policies and tools.


7 slides
Europe Countries Map Infographic
This Europe Countries Map infographic template is a versatile presentation tool for showcasing various data across European nations. The template is fully compatible with PowerPoint, Google Slides, and Keynote and features different infographic styles, such as color-coded maps, bar charts, and statistical representations. It is perfect for displaying country-specific information like population size, economic statistics, or any other relevant data. The clear and concise design ensures that viewers can easily interpret the information, making it suitable for educators, students, business professionals, and anyone needing to present European data in an engaging and informative manner.


7 slides
Environmental Specialist Infographic
An Environmental Specialist, is a professional who focuses on environmental issues and challenges, aiming to develop solutions and strategies to address them. This engaging infographic template is designed to shed light on the critical role of environmental specialists, presenting data, facts, and strategies to inspire and educate on the path towards a sustainable and eco-friendly world. Fully customizable and compatible with Powerpoint, Keynote, and Google Slides. This infographic is your guide to understanding and appreciating the invaluable work of environmental specialists.


4 slides
Social and Professional Networking
Visualize global connections and collaborative ecosystems with this Social and Professional Networking presentation. Ideal for HR teams, marketers, or networking strategists, it showcases relationship-building and engagement across key hubs. Fully customizable in PowerPoint, Keynote, and Google Slides for maximum flexibility in any professional setting.