


Features
- 4 Unique slides
- Fully editable and easy to edit in Microsoft Powerpoint, Keynote and Google Slides
- 16:9 widescreen layout
- Clean and professional designs
- Export to JPG, PDF or send by email


Do you have any questions?
Recommend


6 slides
Environmental Policy and Sustainability Plan Presentation
Bring your sustainability message to life with a visual that flows as smoothly as your plan. This infographic presentation template helps explain your environmental goals, action steps, and policy structure using a dynamic, easy-to-follow circular layout. Perfect for eco reports and green strategy briefs. Compatible with PowerPoint, Keynote, and Google Slides.


10 slides
Medical Anatomy Overview Presentation
Bring your audience into the world of medical insight with a slide that makes anatomy feel clear, modern, and easy to follow. This presentation highlights key organs and body systems in a clean visual layout, helping you explain health data with confidence. Fully compatible with PowerPoint, Keynote, and Google Slides.


4 slides
Sales Performance Heat Map Overview Presentation
Get a quick visual pulse on your data with the Sales Performance Heat Map Overview Presentation. Ideal for showing activity levels or trends across time, this slide uses a gradient color scale to help teams identify high and low performance instantly. Fully editable in Canva, PowerPoint, Keynote, and Google Slides—great for sales managers, team leads, and marketing analysts.


4 slides
90-Day Success Plan for New Hires Presentation
Set your team up for success with this 90-Day Success Plan for New Hires Presentation. This template is perfect for onboarding workflows, outlining key milestones at 30, 60, and 90 days. Help managers and HR professionals communicate expectations clearly and track new employee progress. Fully editable in PowerPoint, Keynote, and Google Slides.


5 slides
Professional Relationship Network Presentation
Map out key business connections using this Professional Relationship Network template. Ideal for showcasing client relationships, internal team dynamics, or communication hierarchies. This clean, modern design helps clarify roles and links across stakeholders. Fully editable and compatible with PowerPoint, Keynote, and Google Slides for flexible use in any setting.


6 slides
Work Flow Chart Infographic
Enhance process understanding with our Workflow Chart Infographic, suitable for Powerpoint, Google Slides, and Keynote. Ideal for project managers, team leads, and operational managers, this infographic simplifies the visualization of workflow processes. With customizable shapes representing different stages, tasks, or decisions, this template helps clearly demonstrate the flow of tasks from start to completion. It's an effective tool for illustrating sequences, responsibilities, and handoffs in business processes. Use this infographic to streamline your operations and communicate processes with clarity to your team and stakeholders.


5 slides
SMART Objective Planning for Success Presentation
Turn your goal-setting process into a clear, actionable strategy with this SMART Objective Planning slide. Designed around the SMART framework—Specific, Measurable, Achievable, Relevant, Time-bound—this layout helps you articulate objectives with clarity and focus. Each segment features a bold letter with icons and editable descriptions beneath. Ideal for planning sessions, strategic reviews, and team alignment meetings. Compatible with PowerPoint, Keynote, and Google Slides.


10 slides
Territorial Insights with South America Map Presentation
Unlock regional clarity with the Territorial Insights with South America Map Presentation. This editable slide visualizes country-specific highlights using a modern grid-based map layout, customizable color zones, and label connectors to break down key insights. Ideal for sales analysis, market entry strategies, or logistics reporting. Compatible with PowerPoint, Keynote, Google Slides, and Canva.


20 slides
Cometis Small Business Pitch Deck Presentation
Introduce your business effectively with this pitch deck template, crafted for small businesses seeking impactful presentations. From company overview to objectives and strategies, this design is tailored to highlight your key messages. Dive into sections such as business highlights, team introductions, and future goals while maintaining a professional flow. This template includes callout slides, break announcements, and customizable placeholders for your brand visuals and content. Ideal for pitching ideas to stakeholders or presenting at workshops, it ensures clarity and engagement. Compatible with PowerPoint, Google Slides, and Keynote, it offers flexibility across platforms.


6 slides
McKinsey 7S Advantage Infographic
The McKinsey 7S model is a strategic management framework developed by consulting firm McKinsey & Company in the 1980s. This infographic template helps explain and understand the McKinsey 7S framework, a widely used management model for organizational effectiveness. This template provides an informative overview of the seven key elements of the framework, their interrelationships, and their impact on organizational performance. This template is designed for professionals, consultants, or anyone interested in understanding and applying the McKinsey 7S framework. Fully customizable and compatible with Powerpoint, Keynote, and Google Slides.


6 slides
Company Profile Insights Infographic
This set of templates is designed to convey critical company insights through a visually engaging presentation, ideal for showcasing a company’s core strengths and operational highlights. Each layout provides a structured approach to display key data points and insights that are vital to understanding the company's market position and strategic direction. The templates feature a variety of elements, such as statistical displays, financial summaries, and operational benchmarks, that provide a comprehensive snapshot of company performance. By integrating graphical representations like bar charts, pie charts, and progress indicators, these templates make complex data accessible and easily understandable. The color schemes and design elements can be customized to align with company branding, ensuring a cohesive look throughout the presentation. These are excellent tools for annual meetings, investor briefings, or internal reviews, enabling businesses to effectively communicate their achievements, identify trends in their operations, and guide strategic planning discussions. By utilizing these templates, companies can highlight their successes, areas for improvement, and future outlook in a clear and professional manner, fostering transparency and confidence among stakeholders.


21 slides
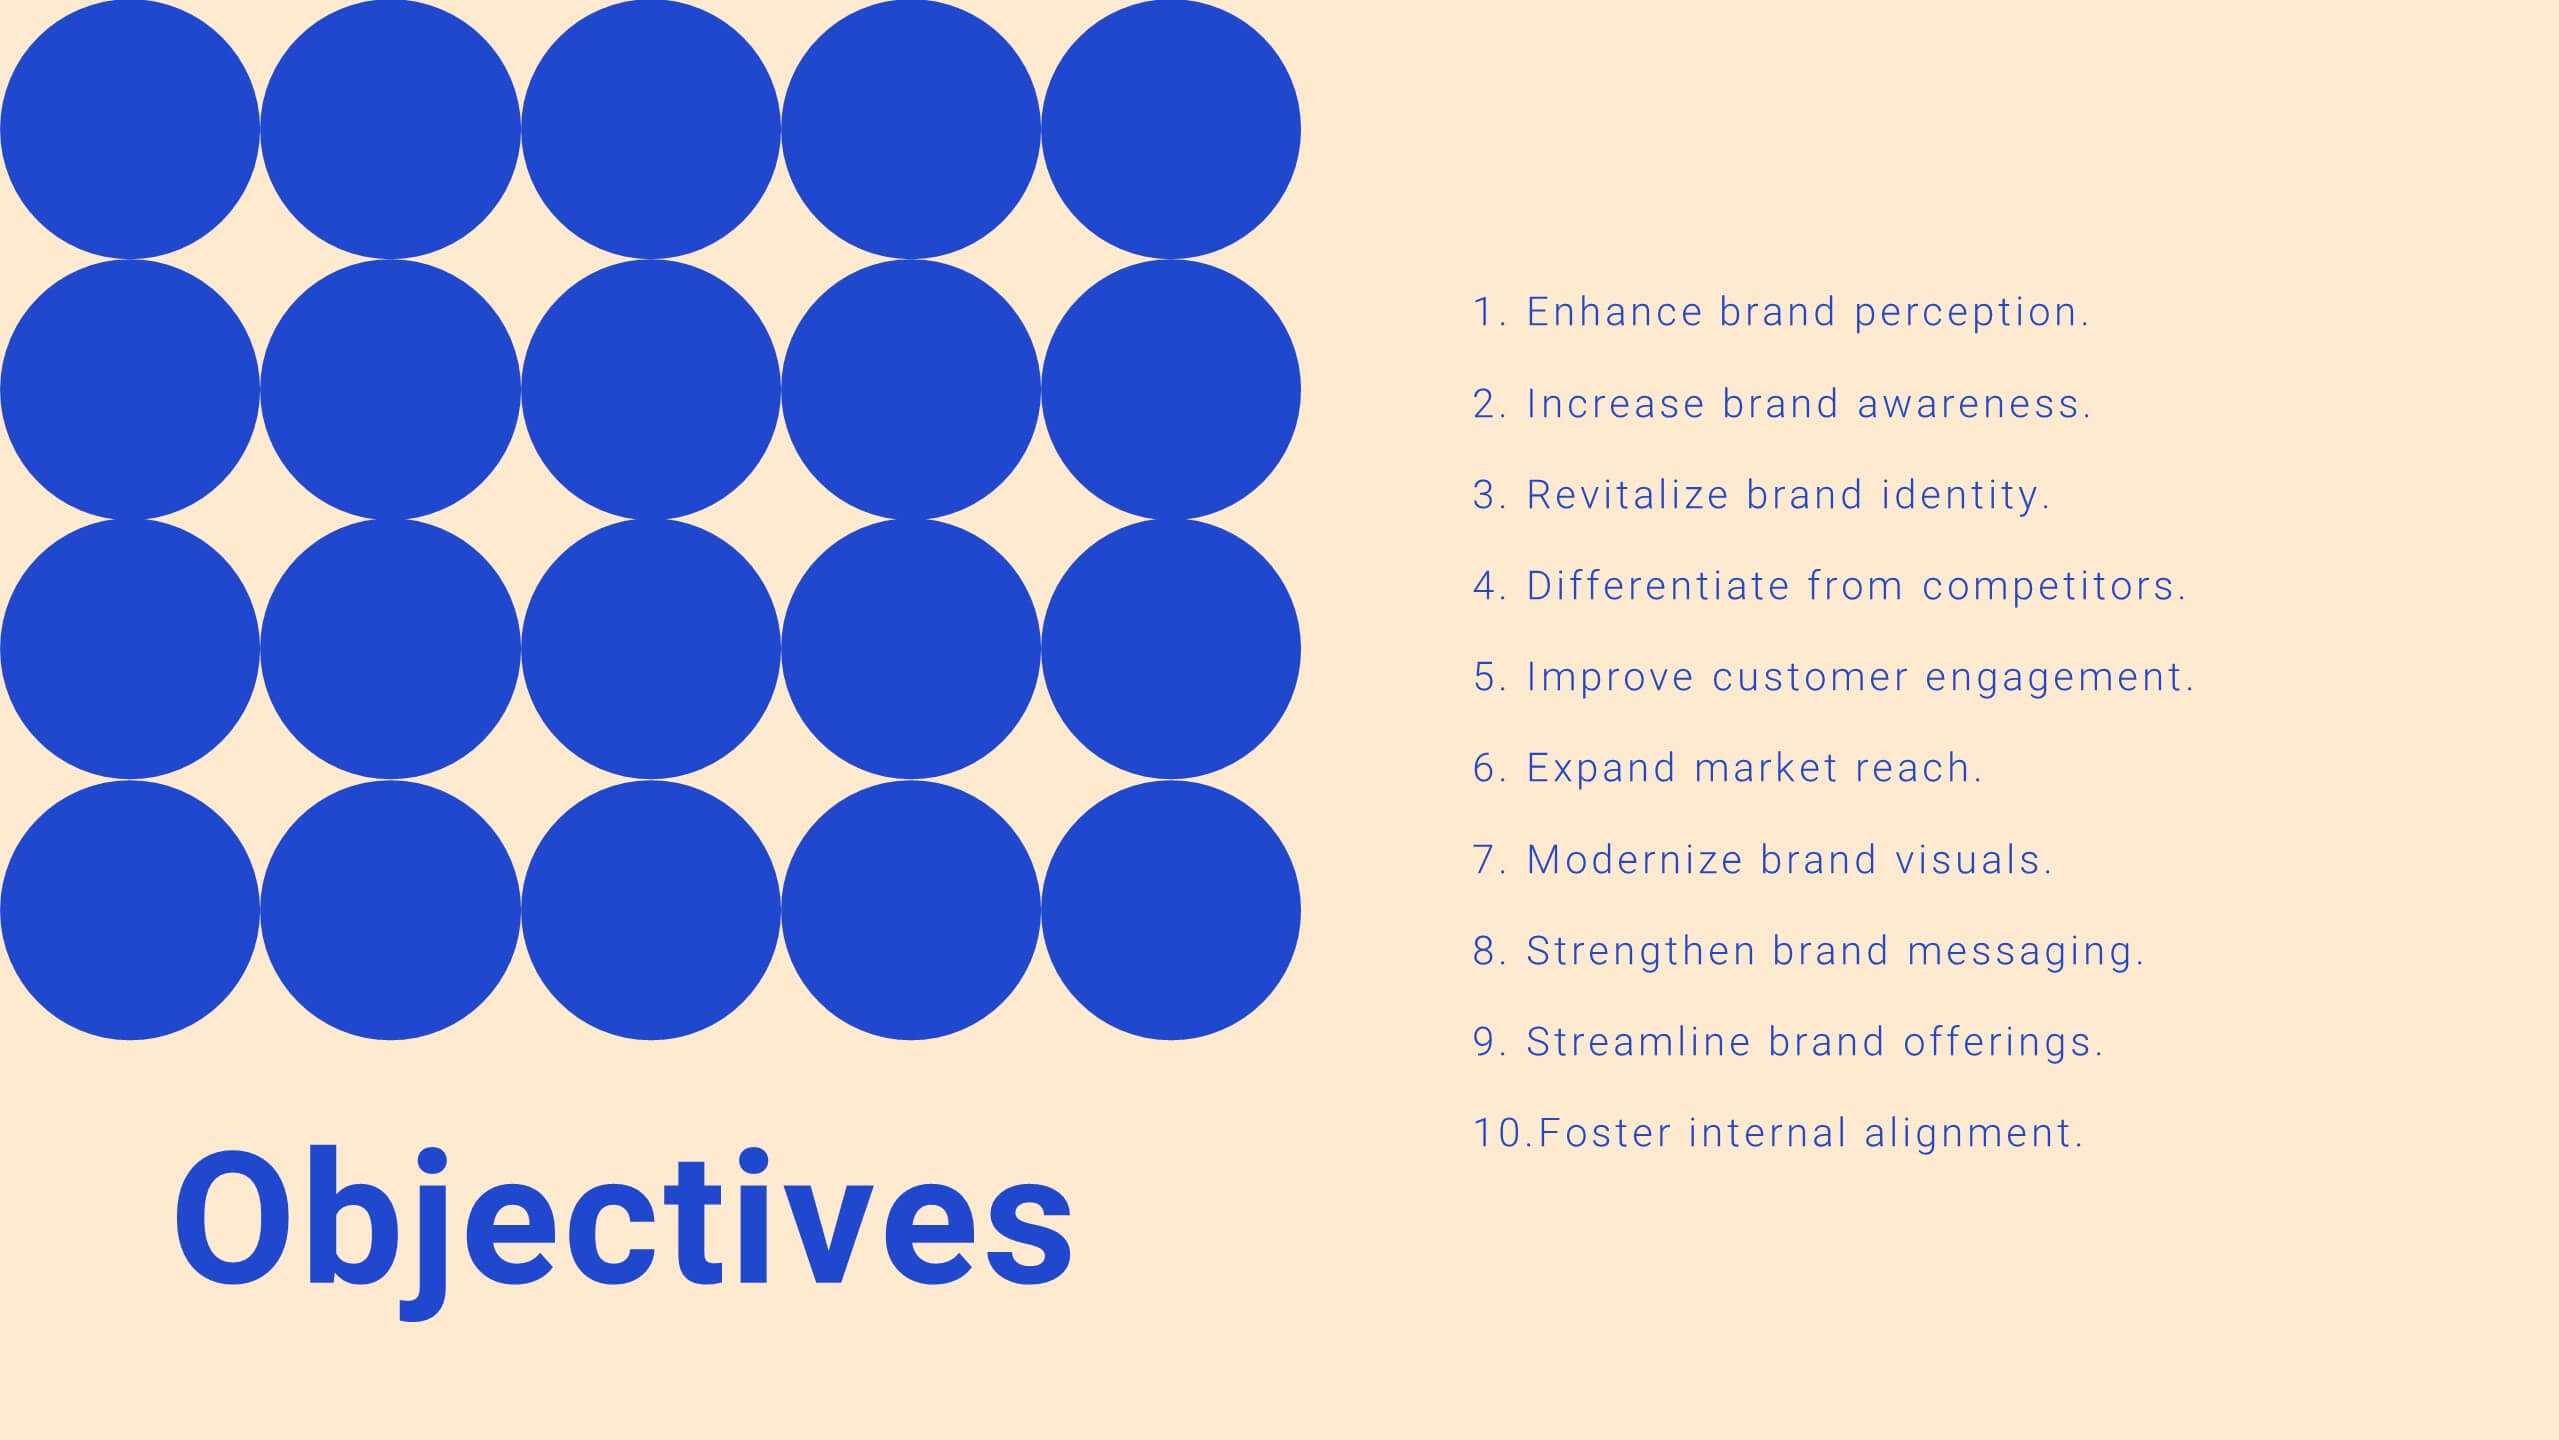
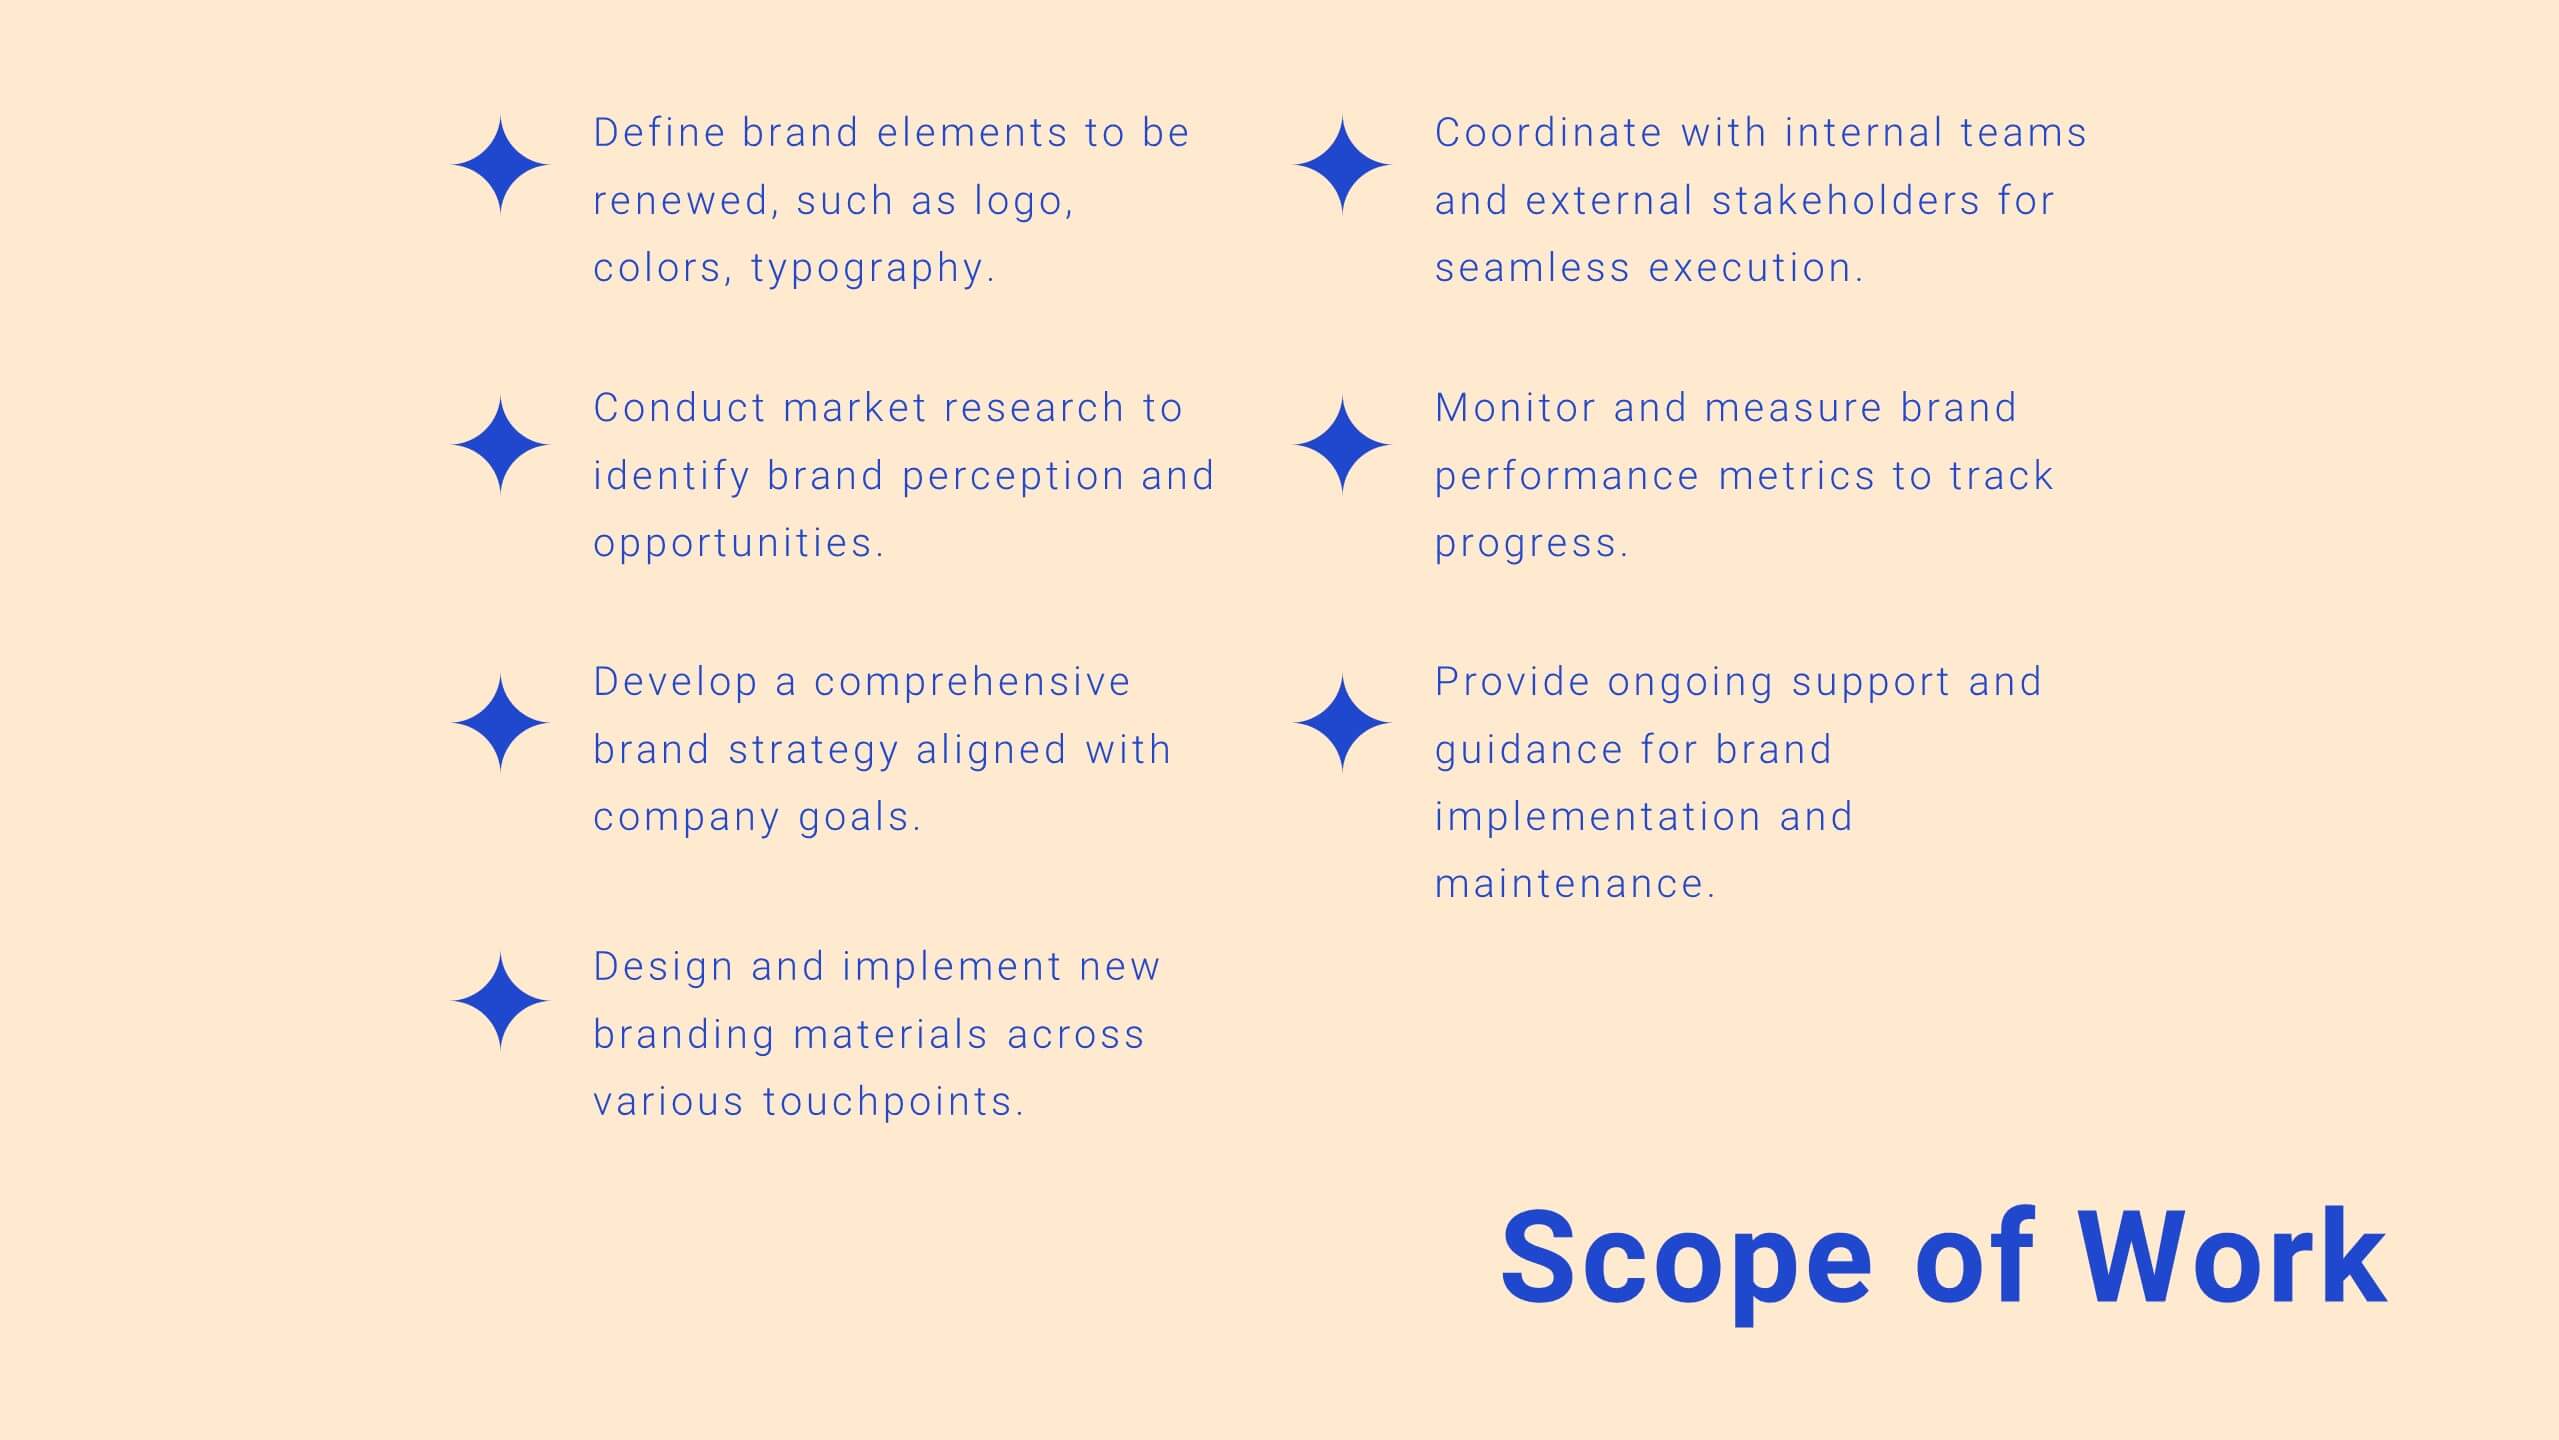
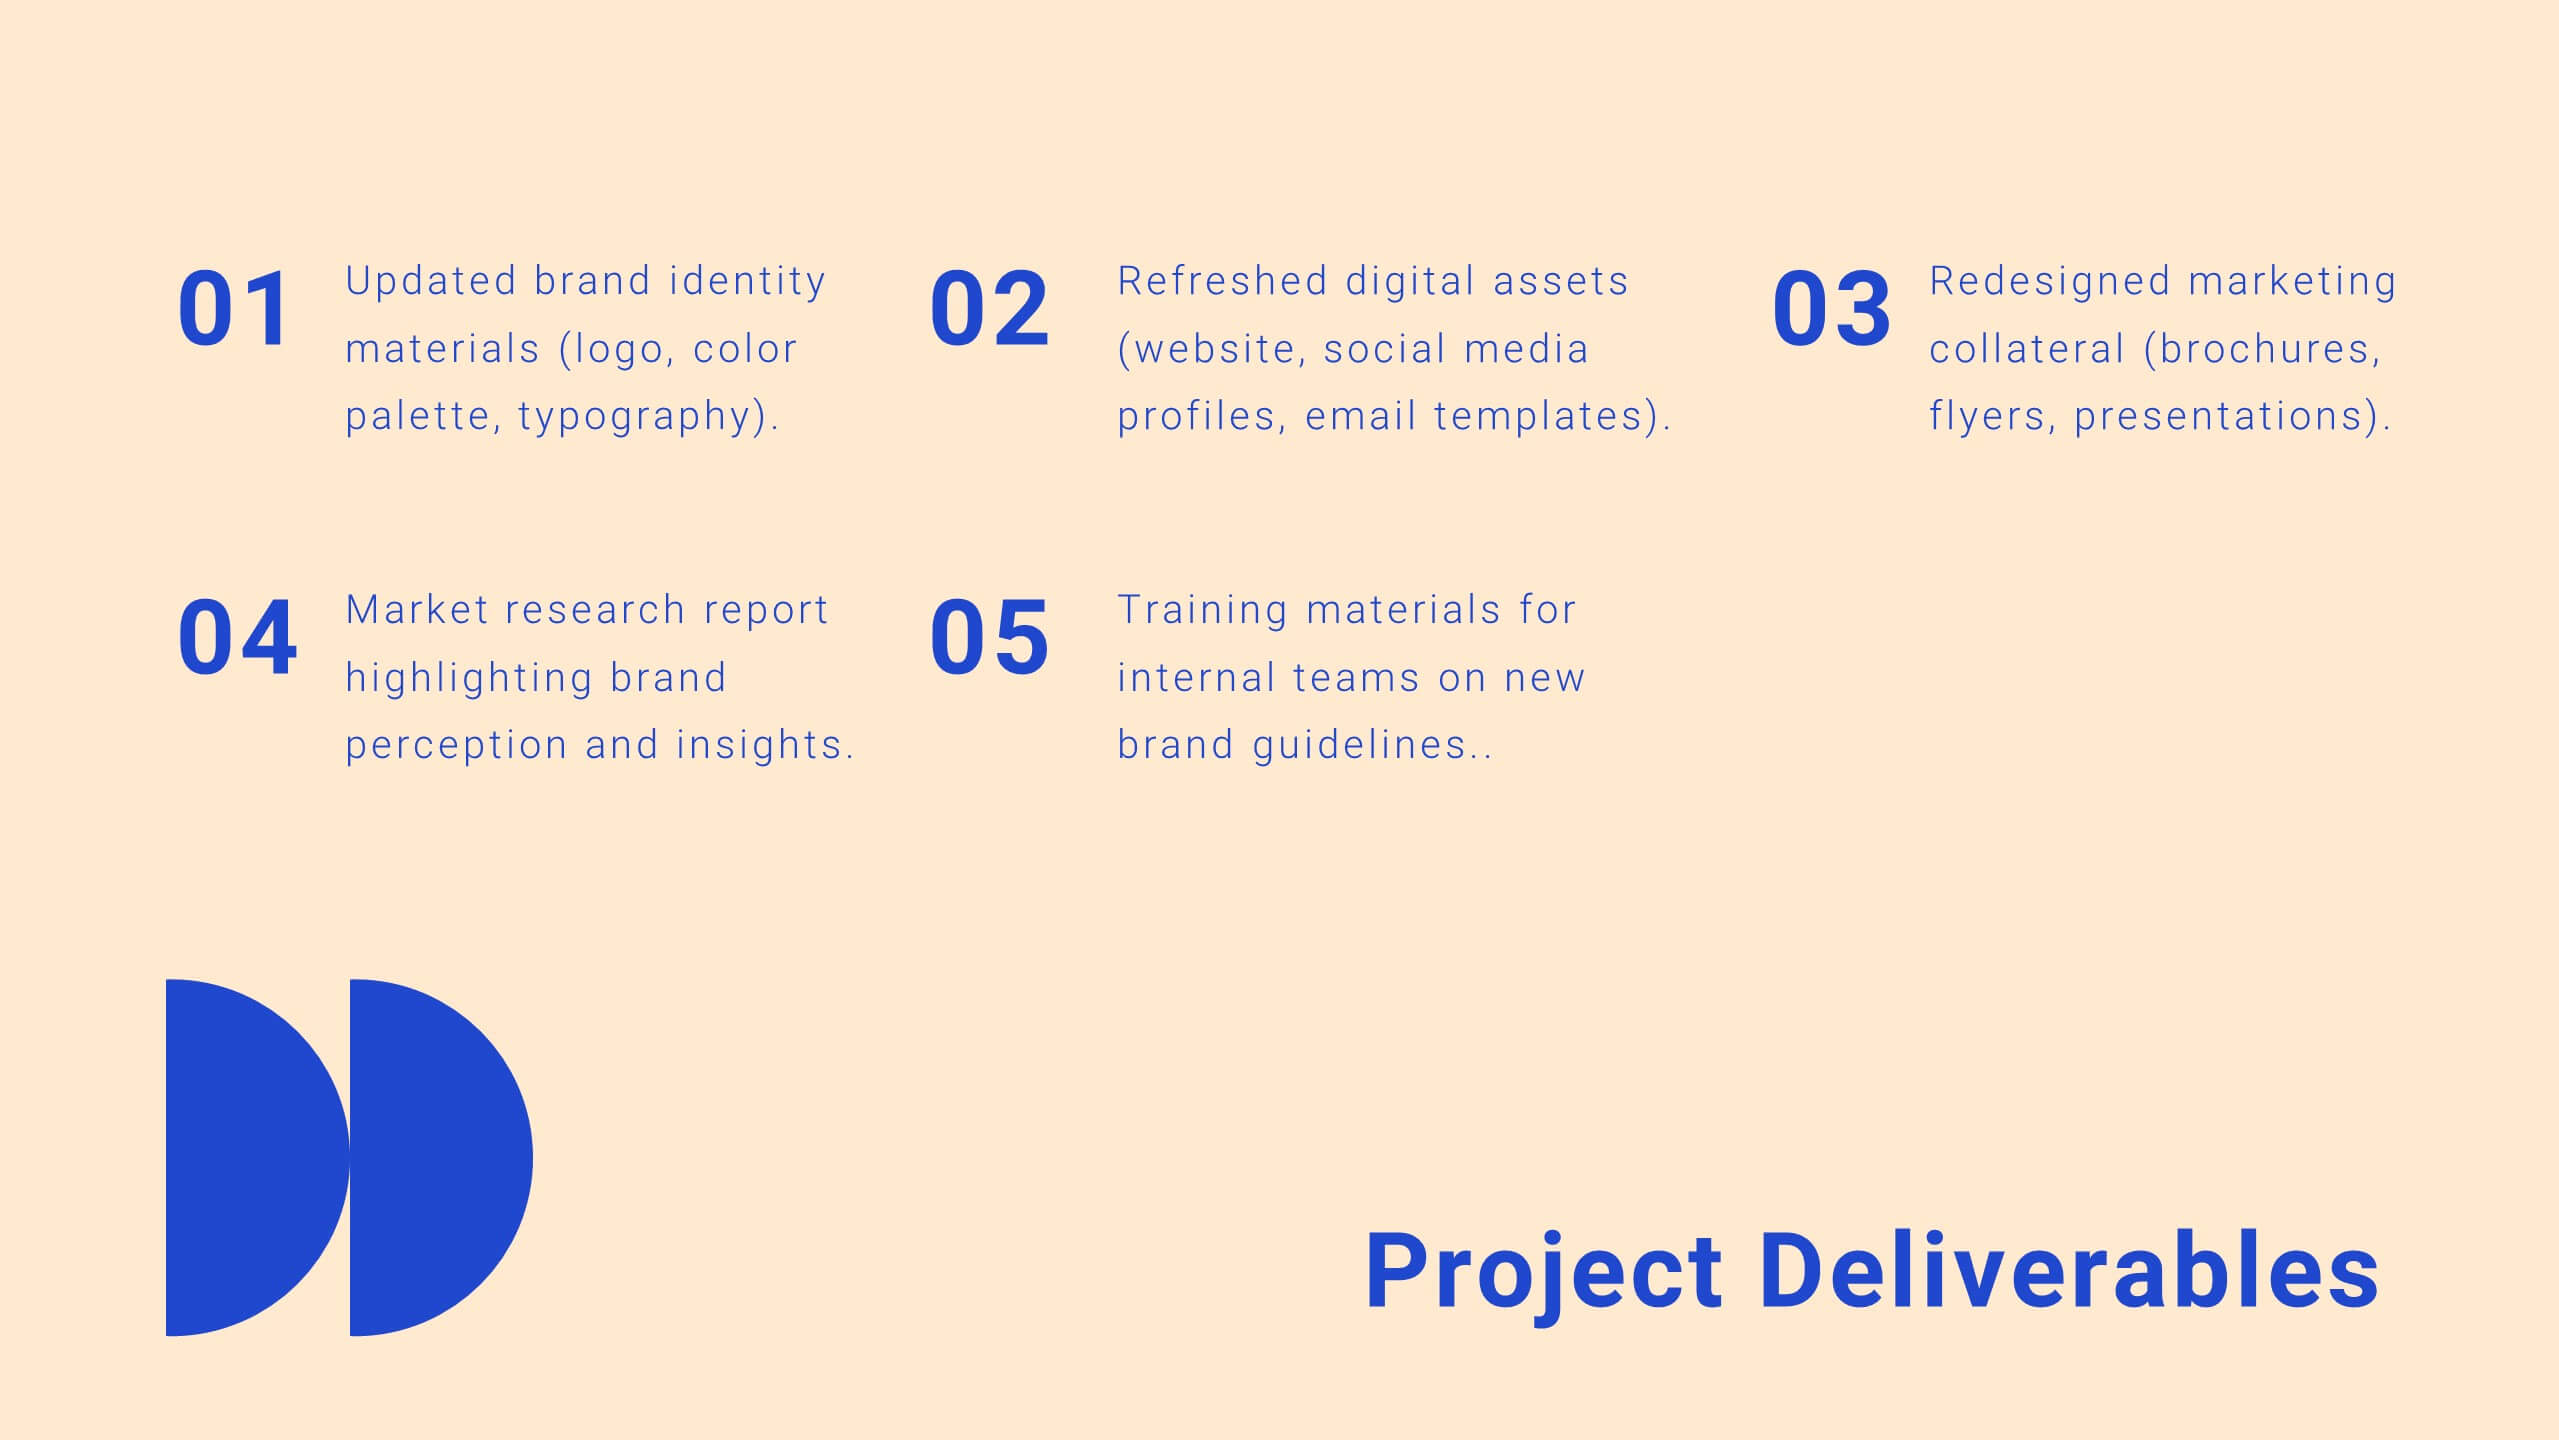
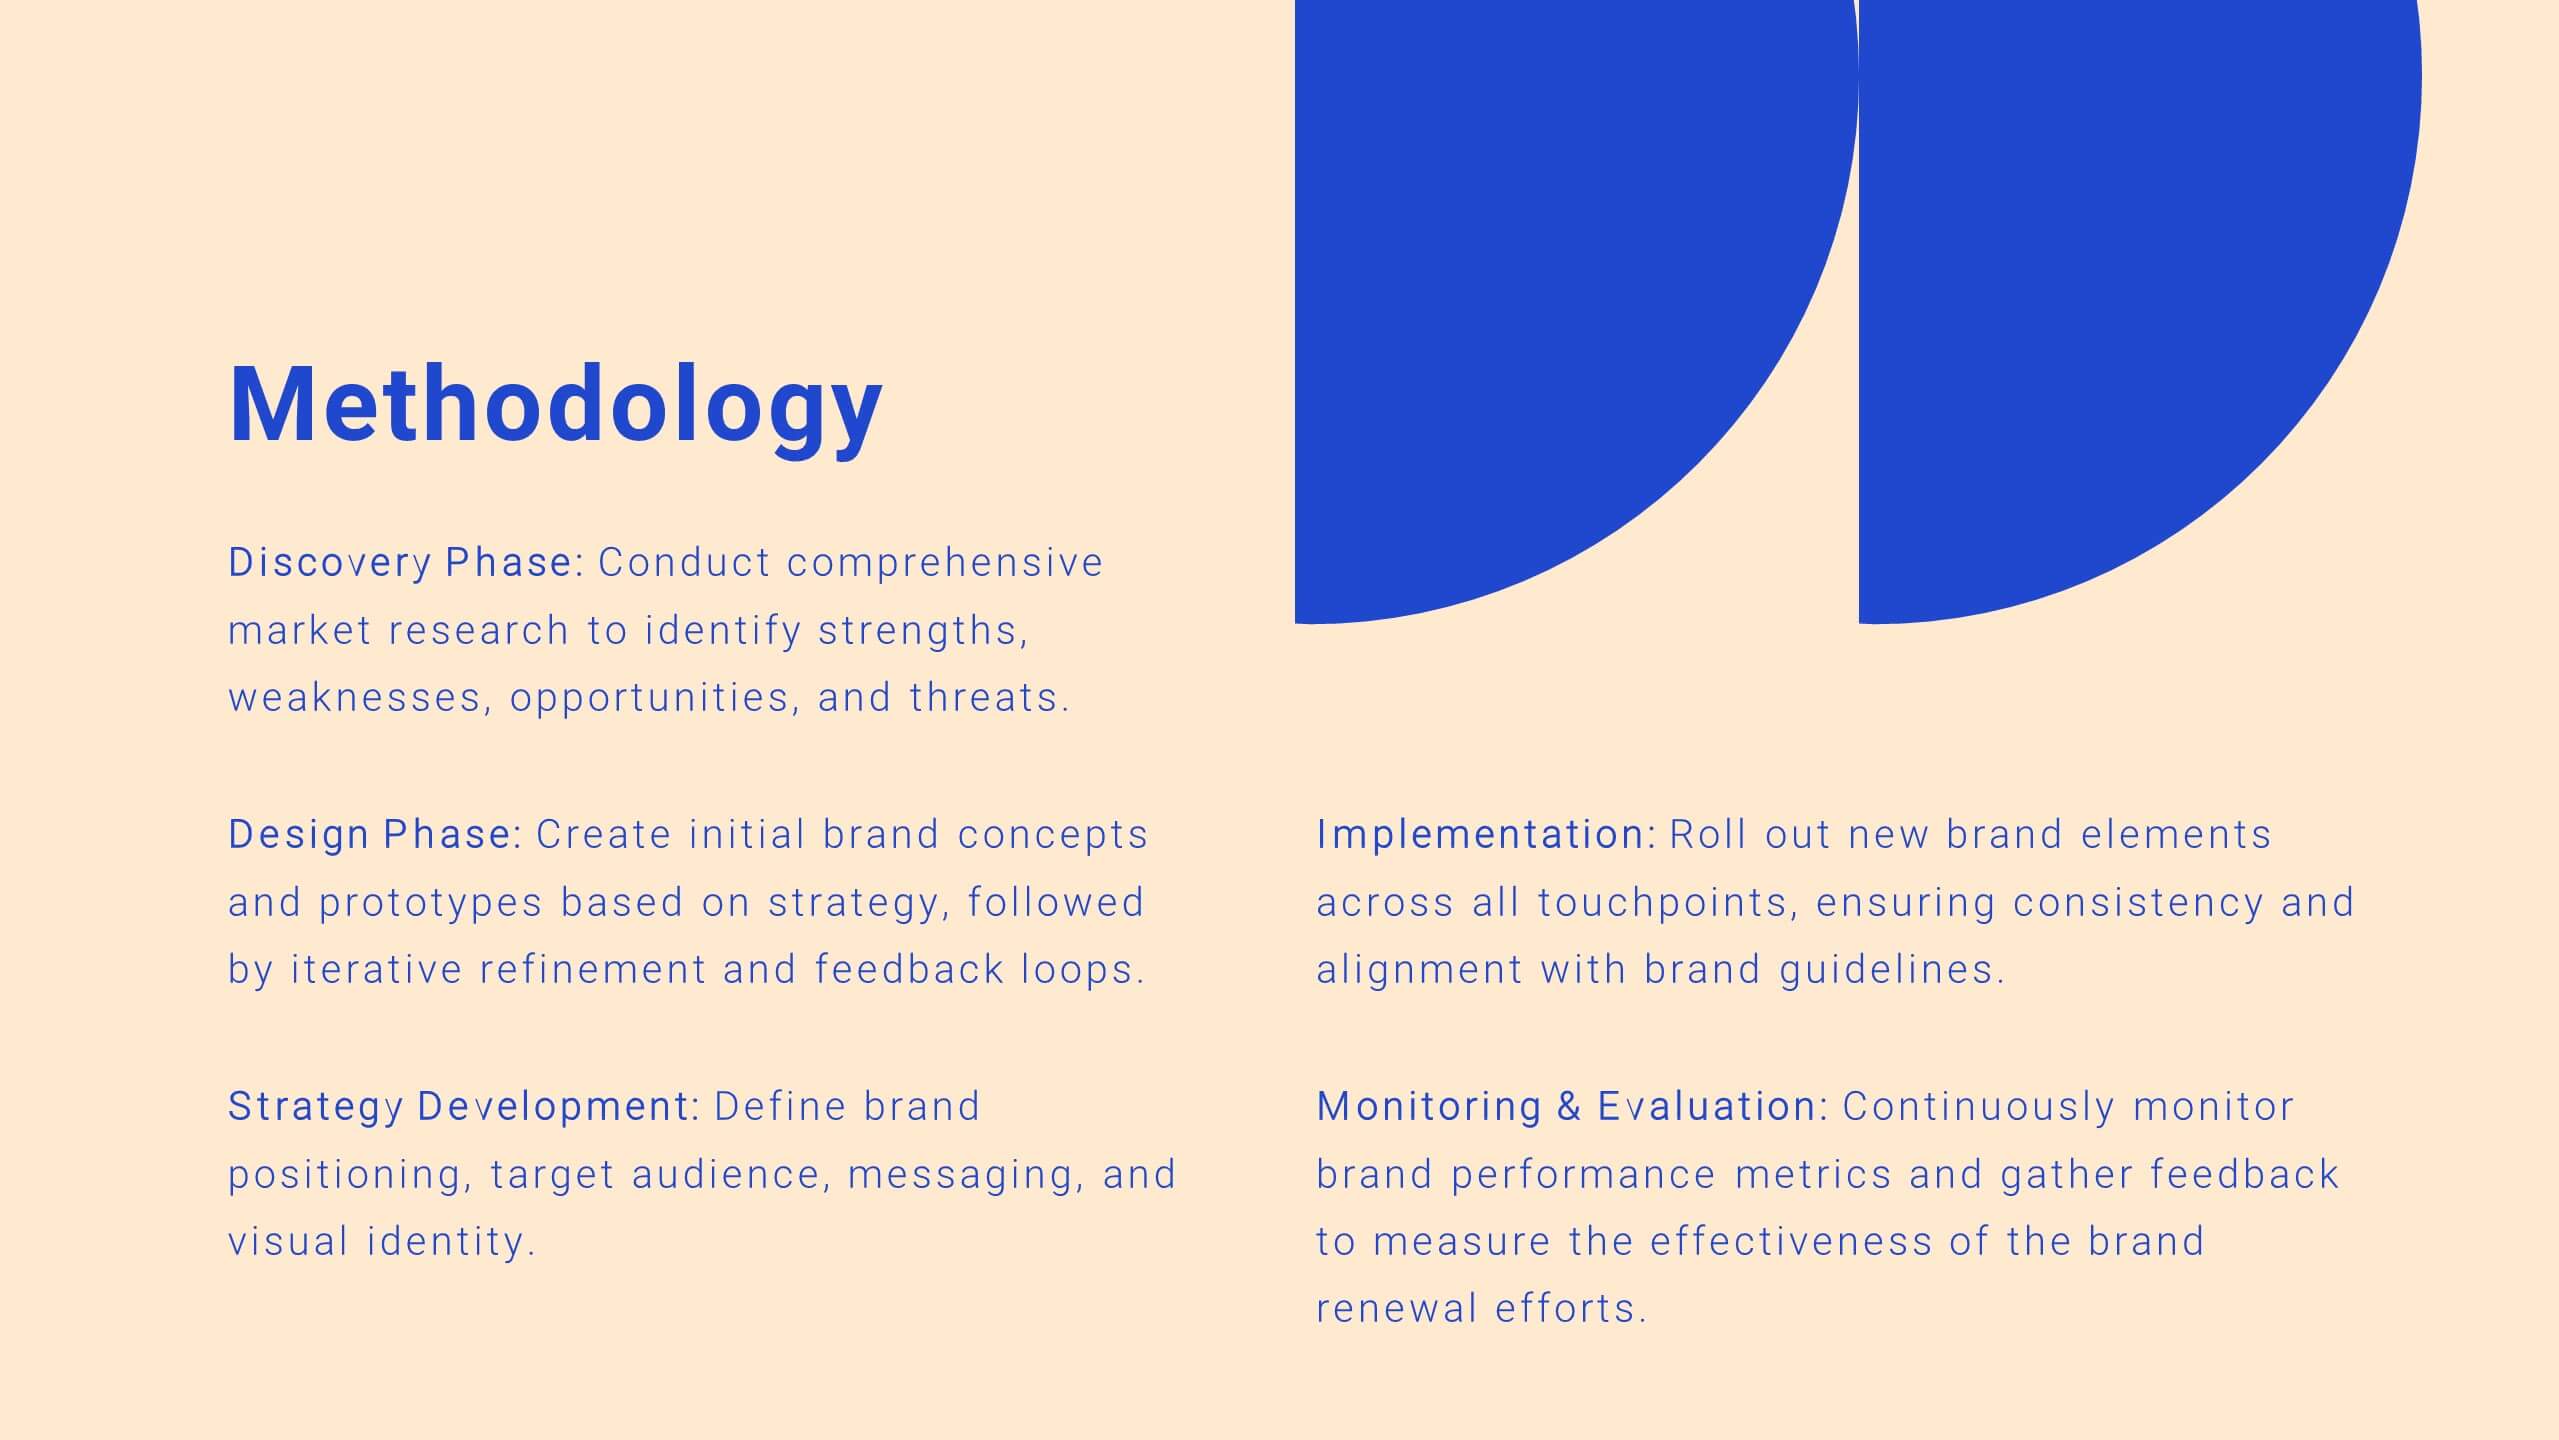
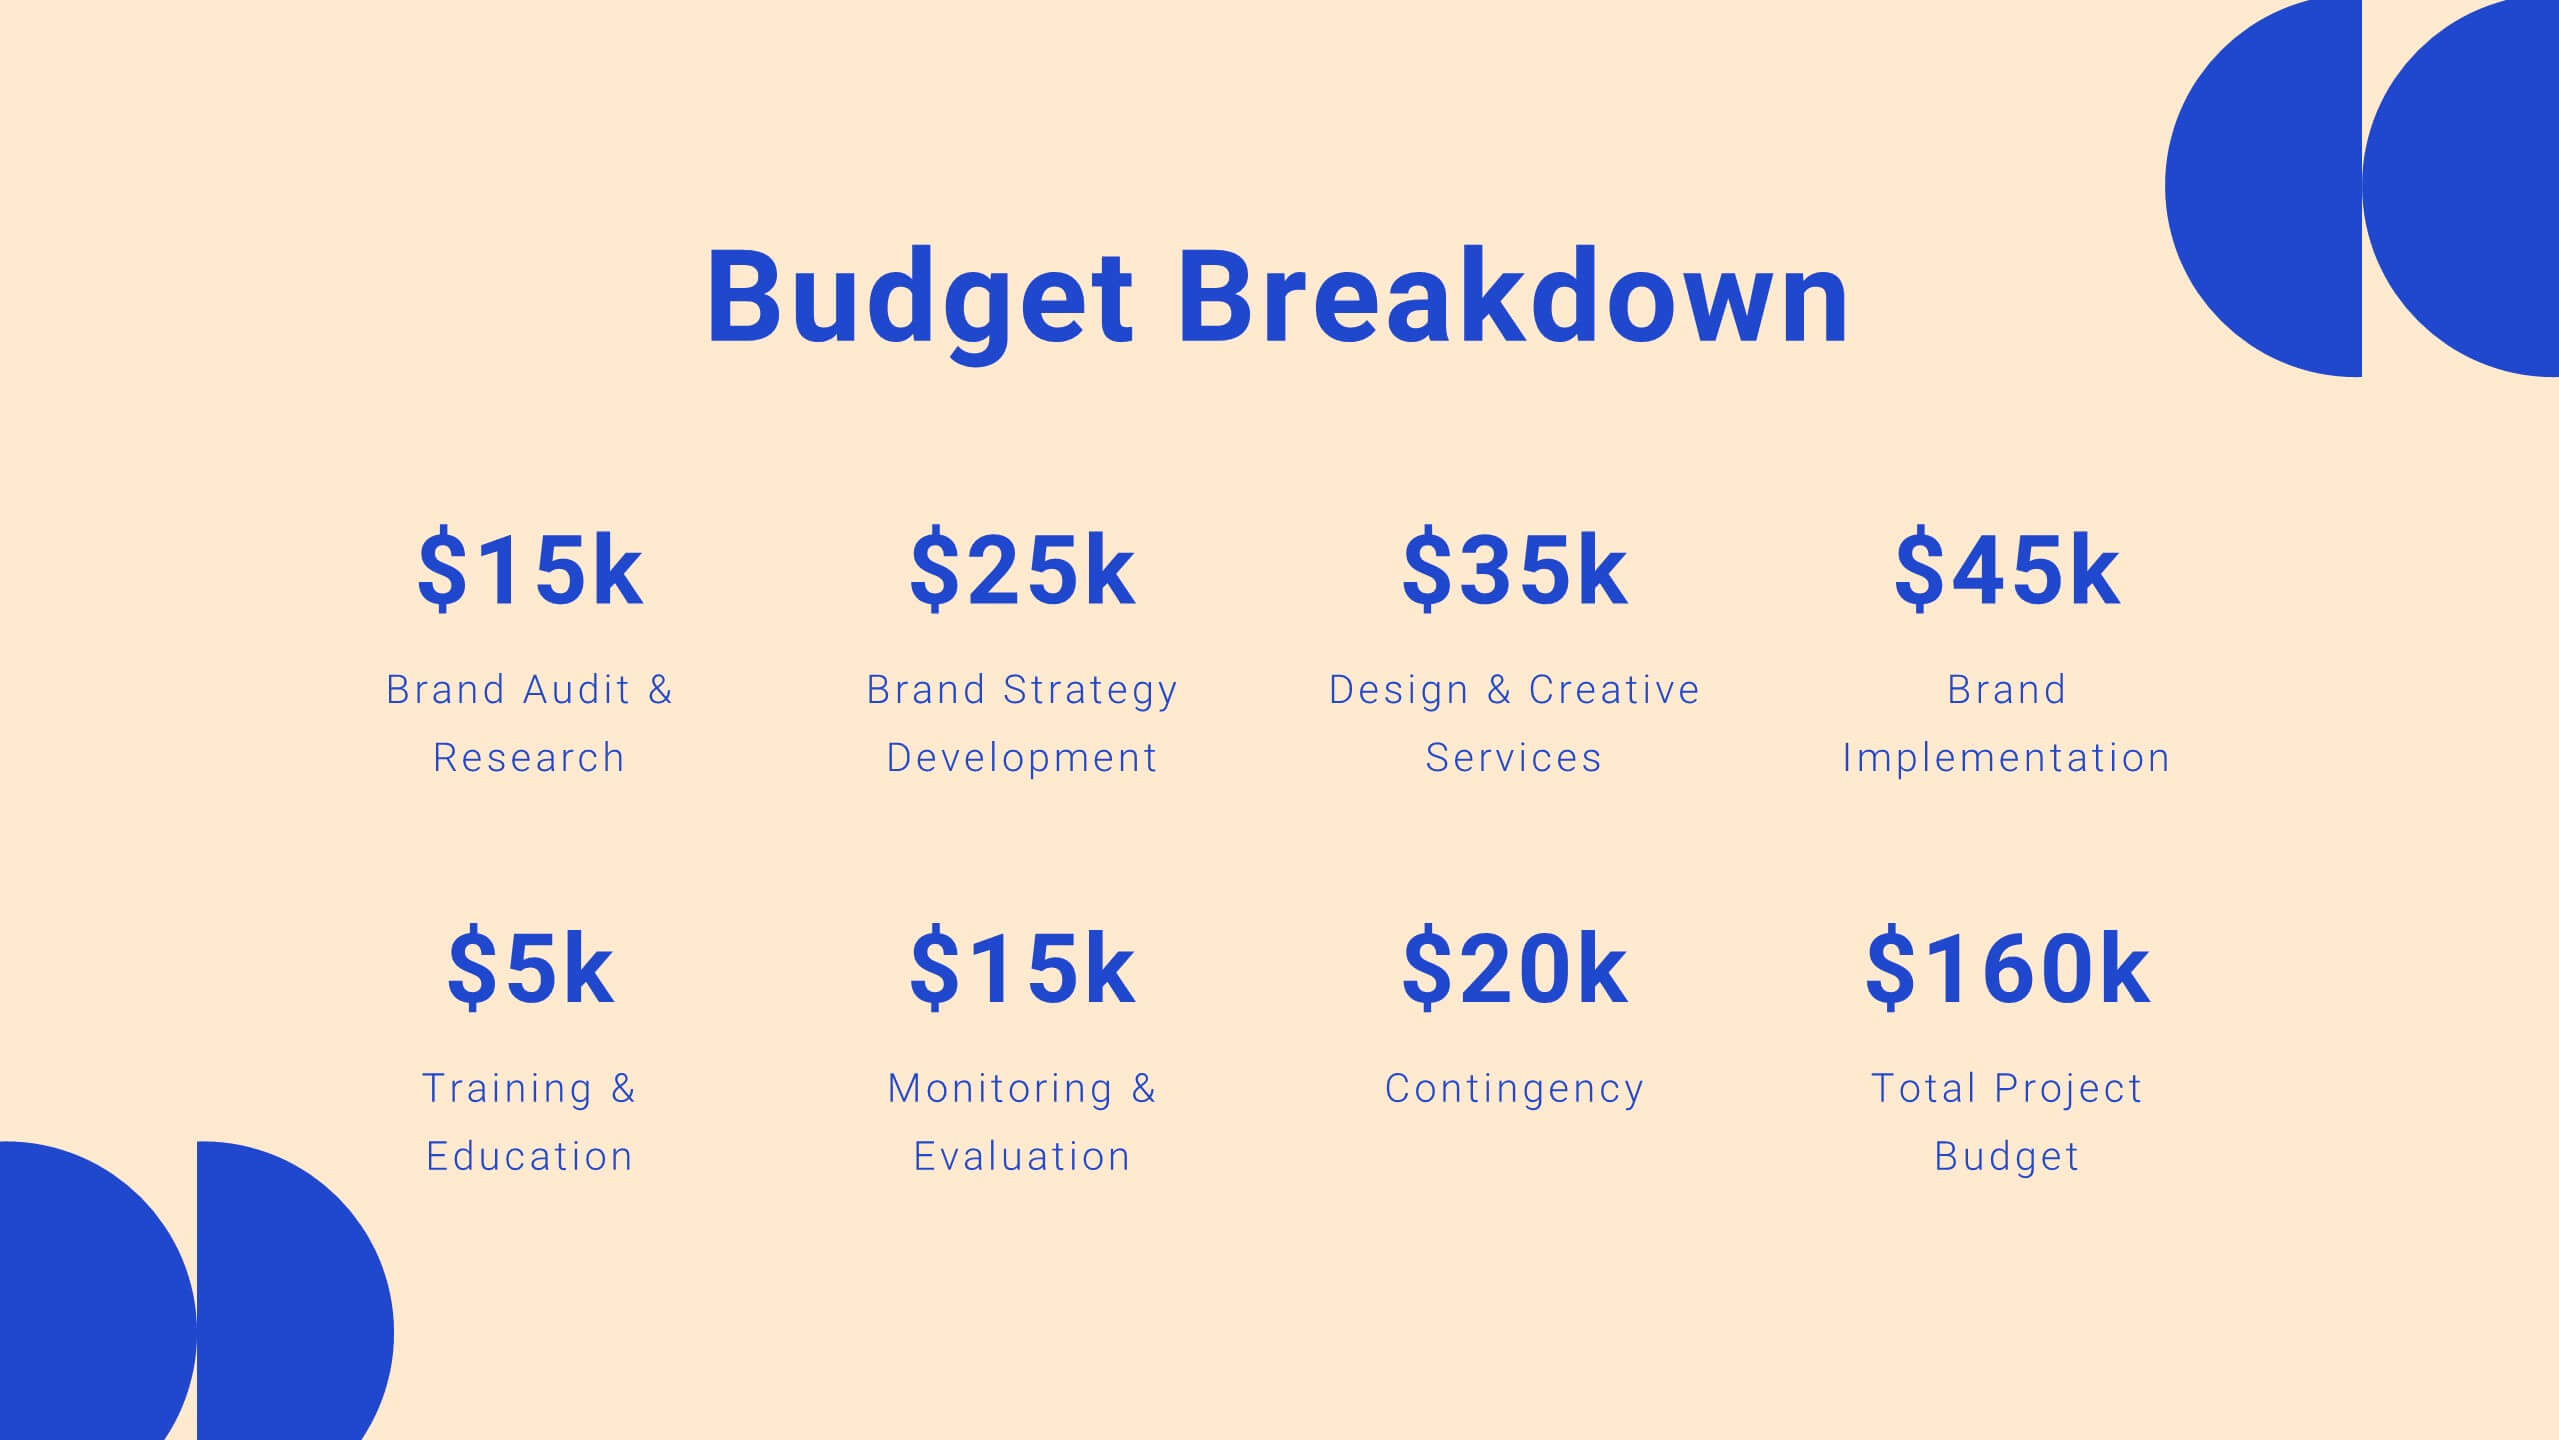
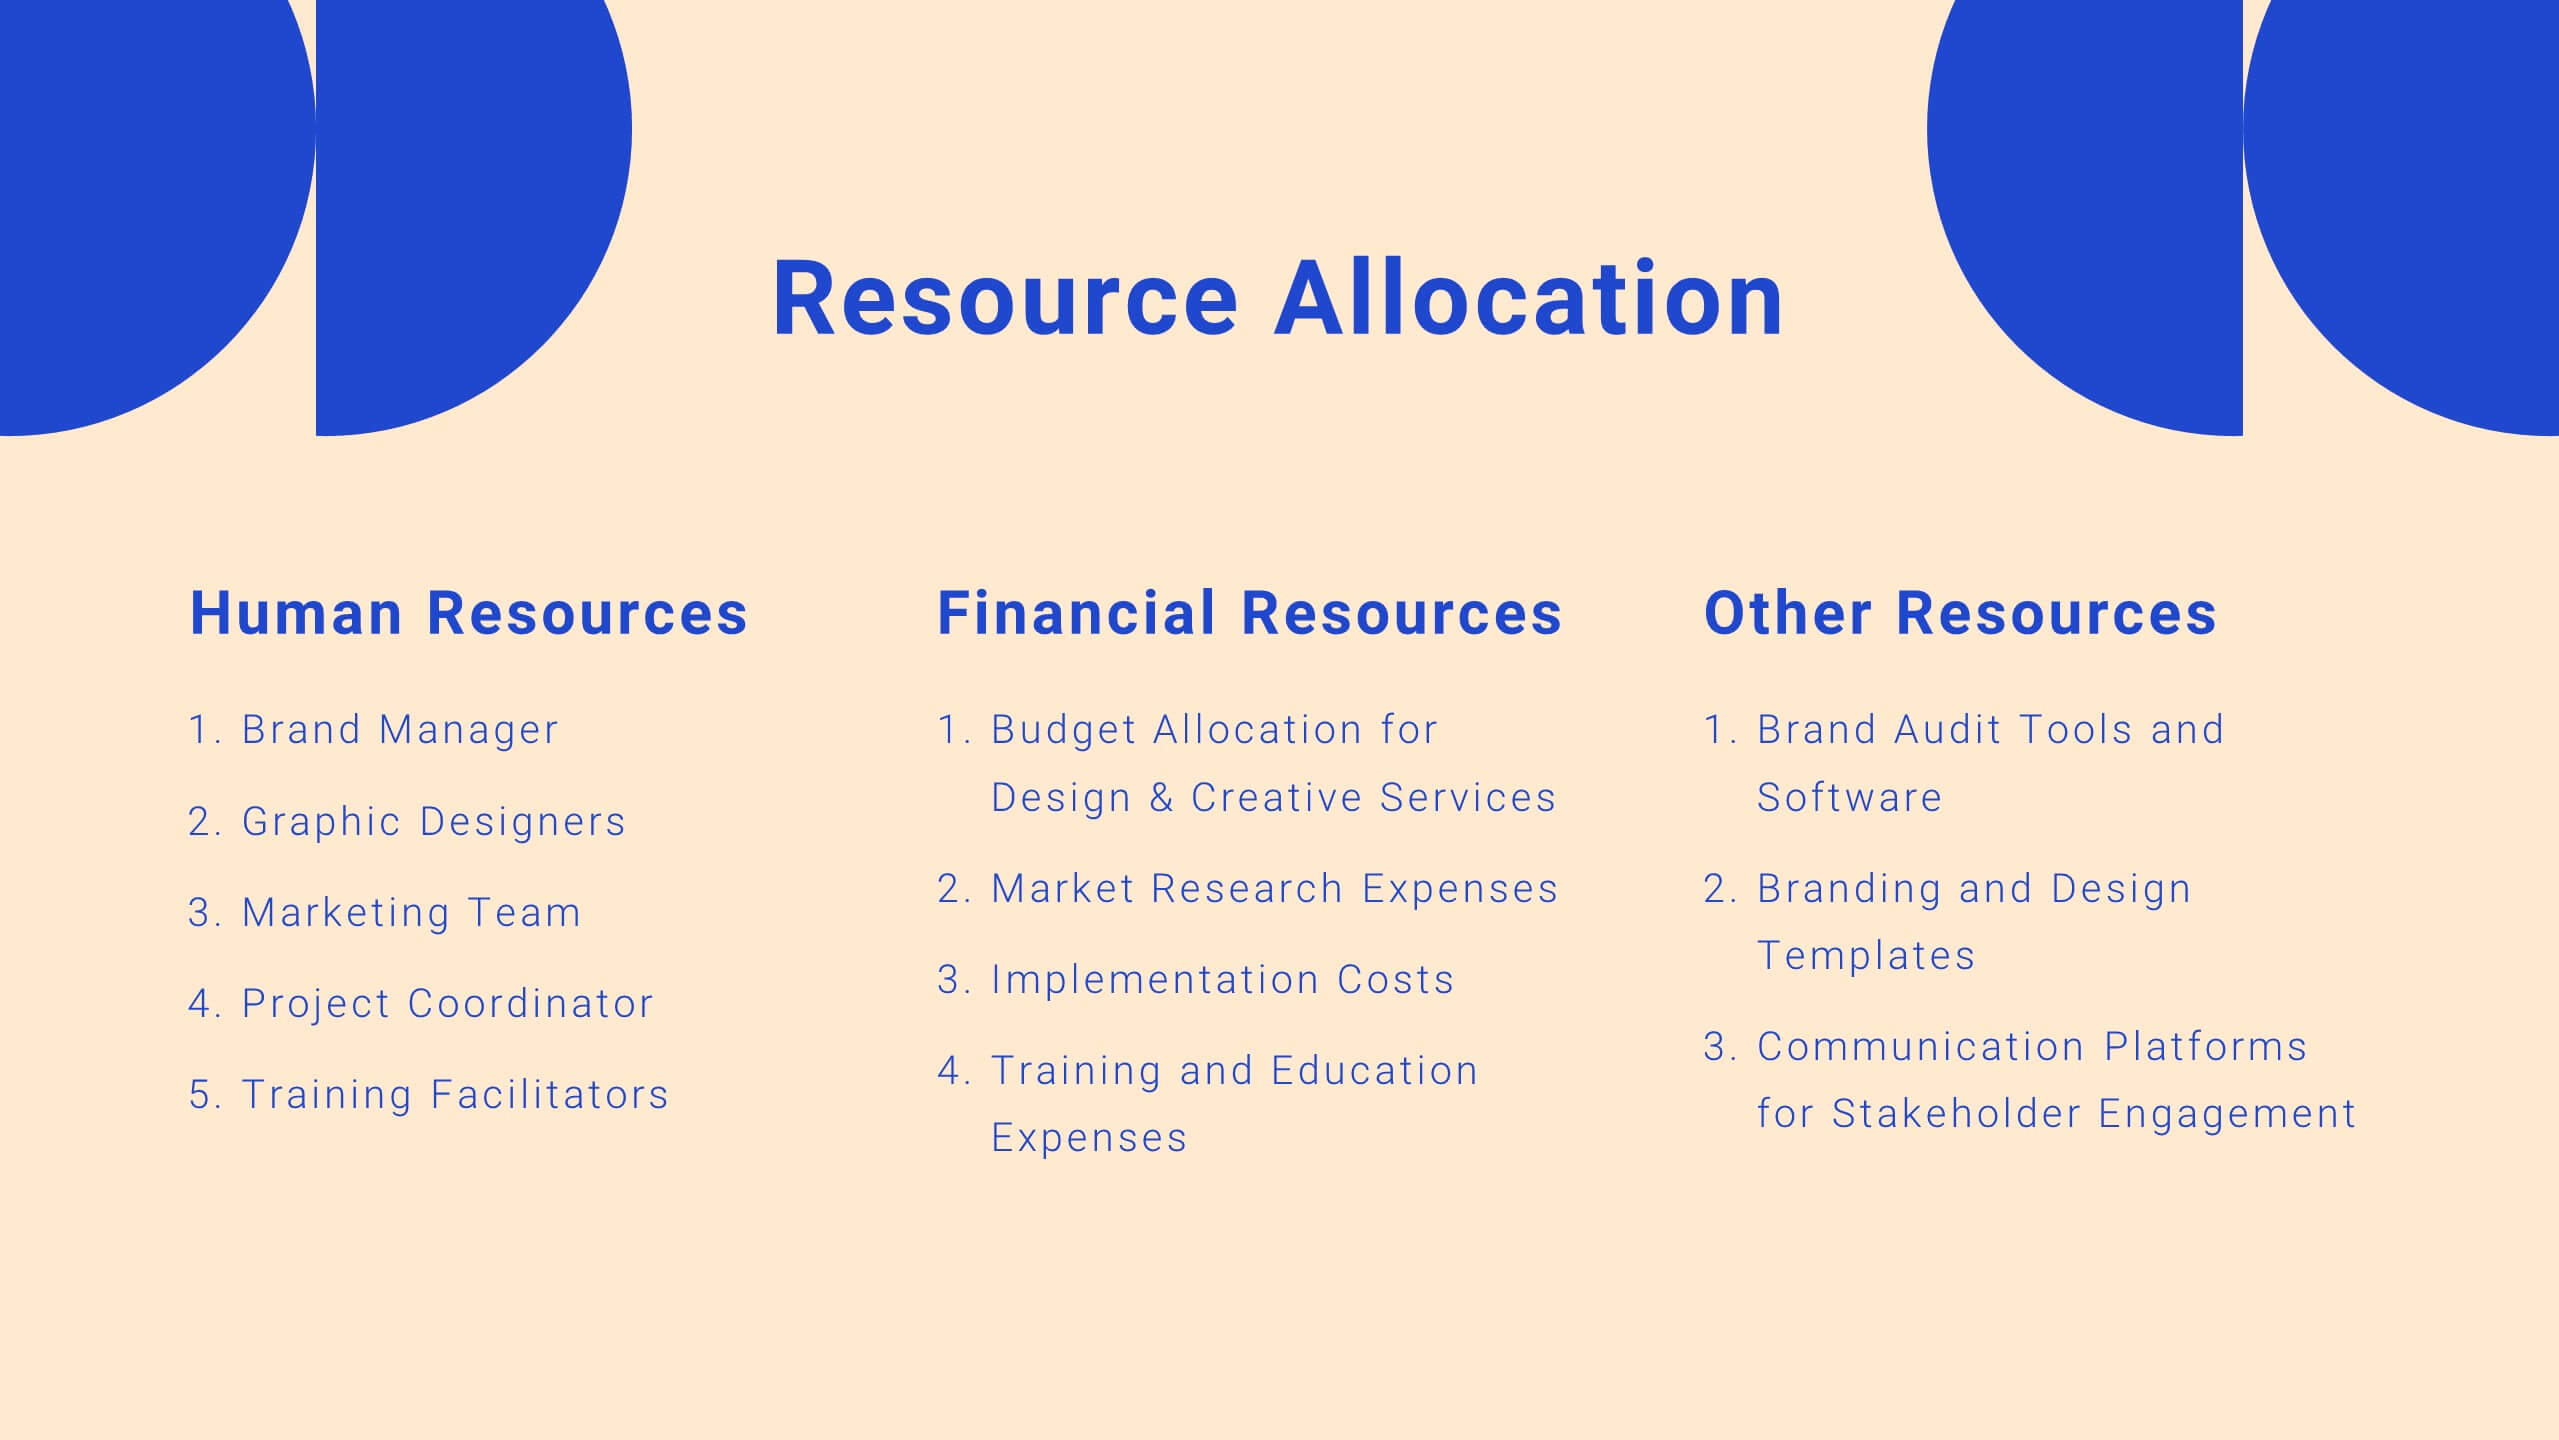
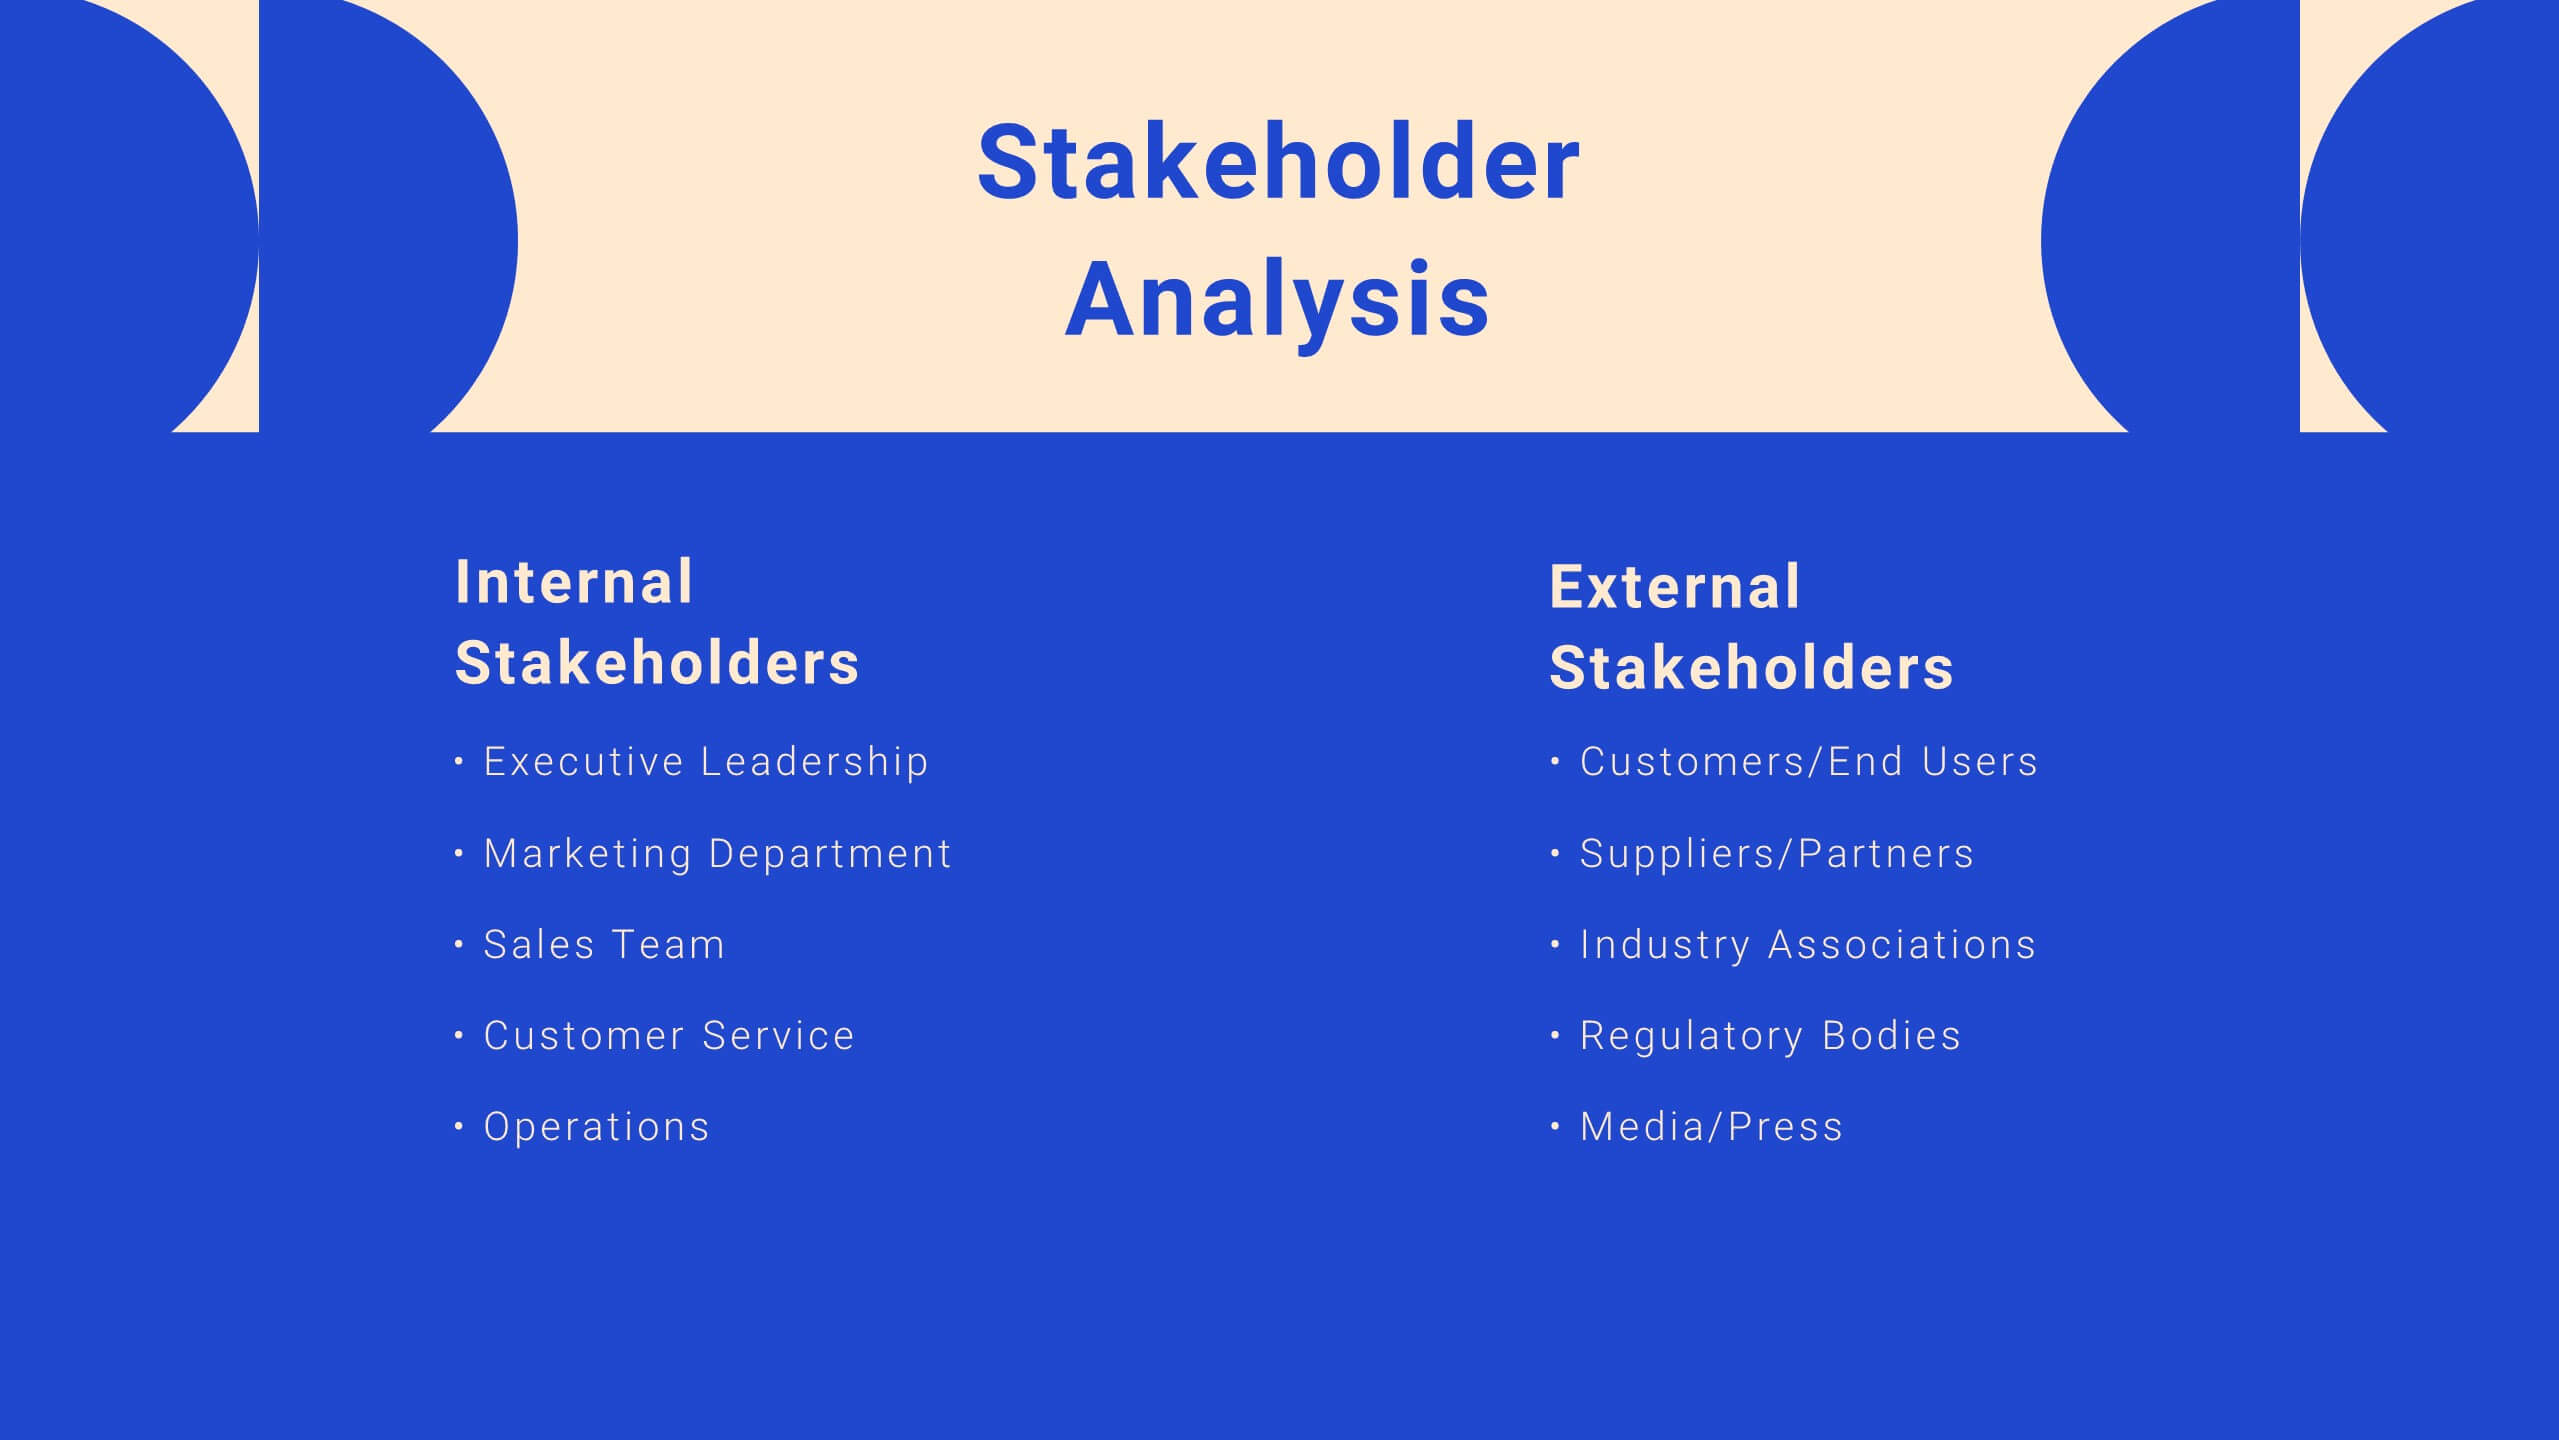
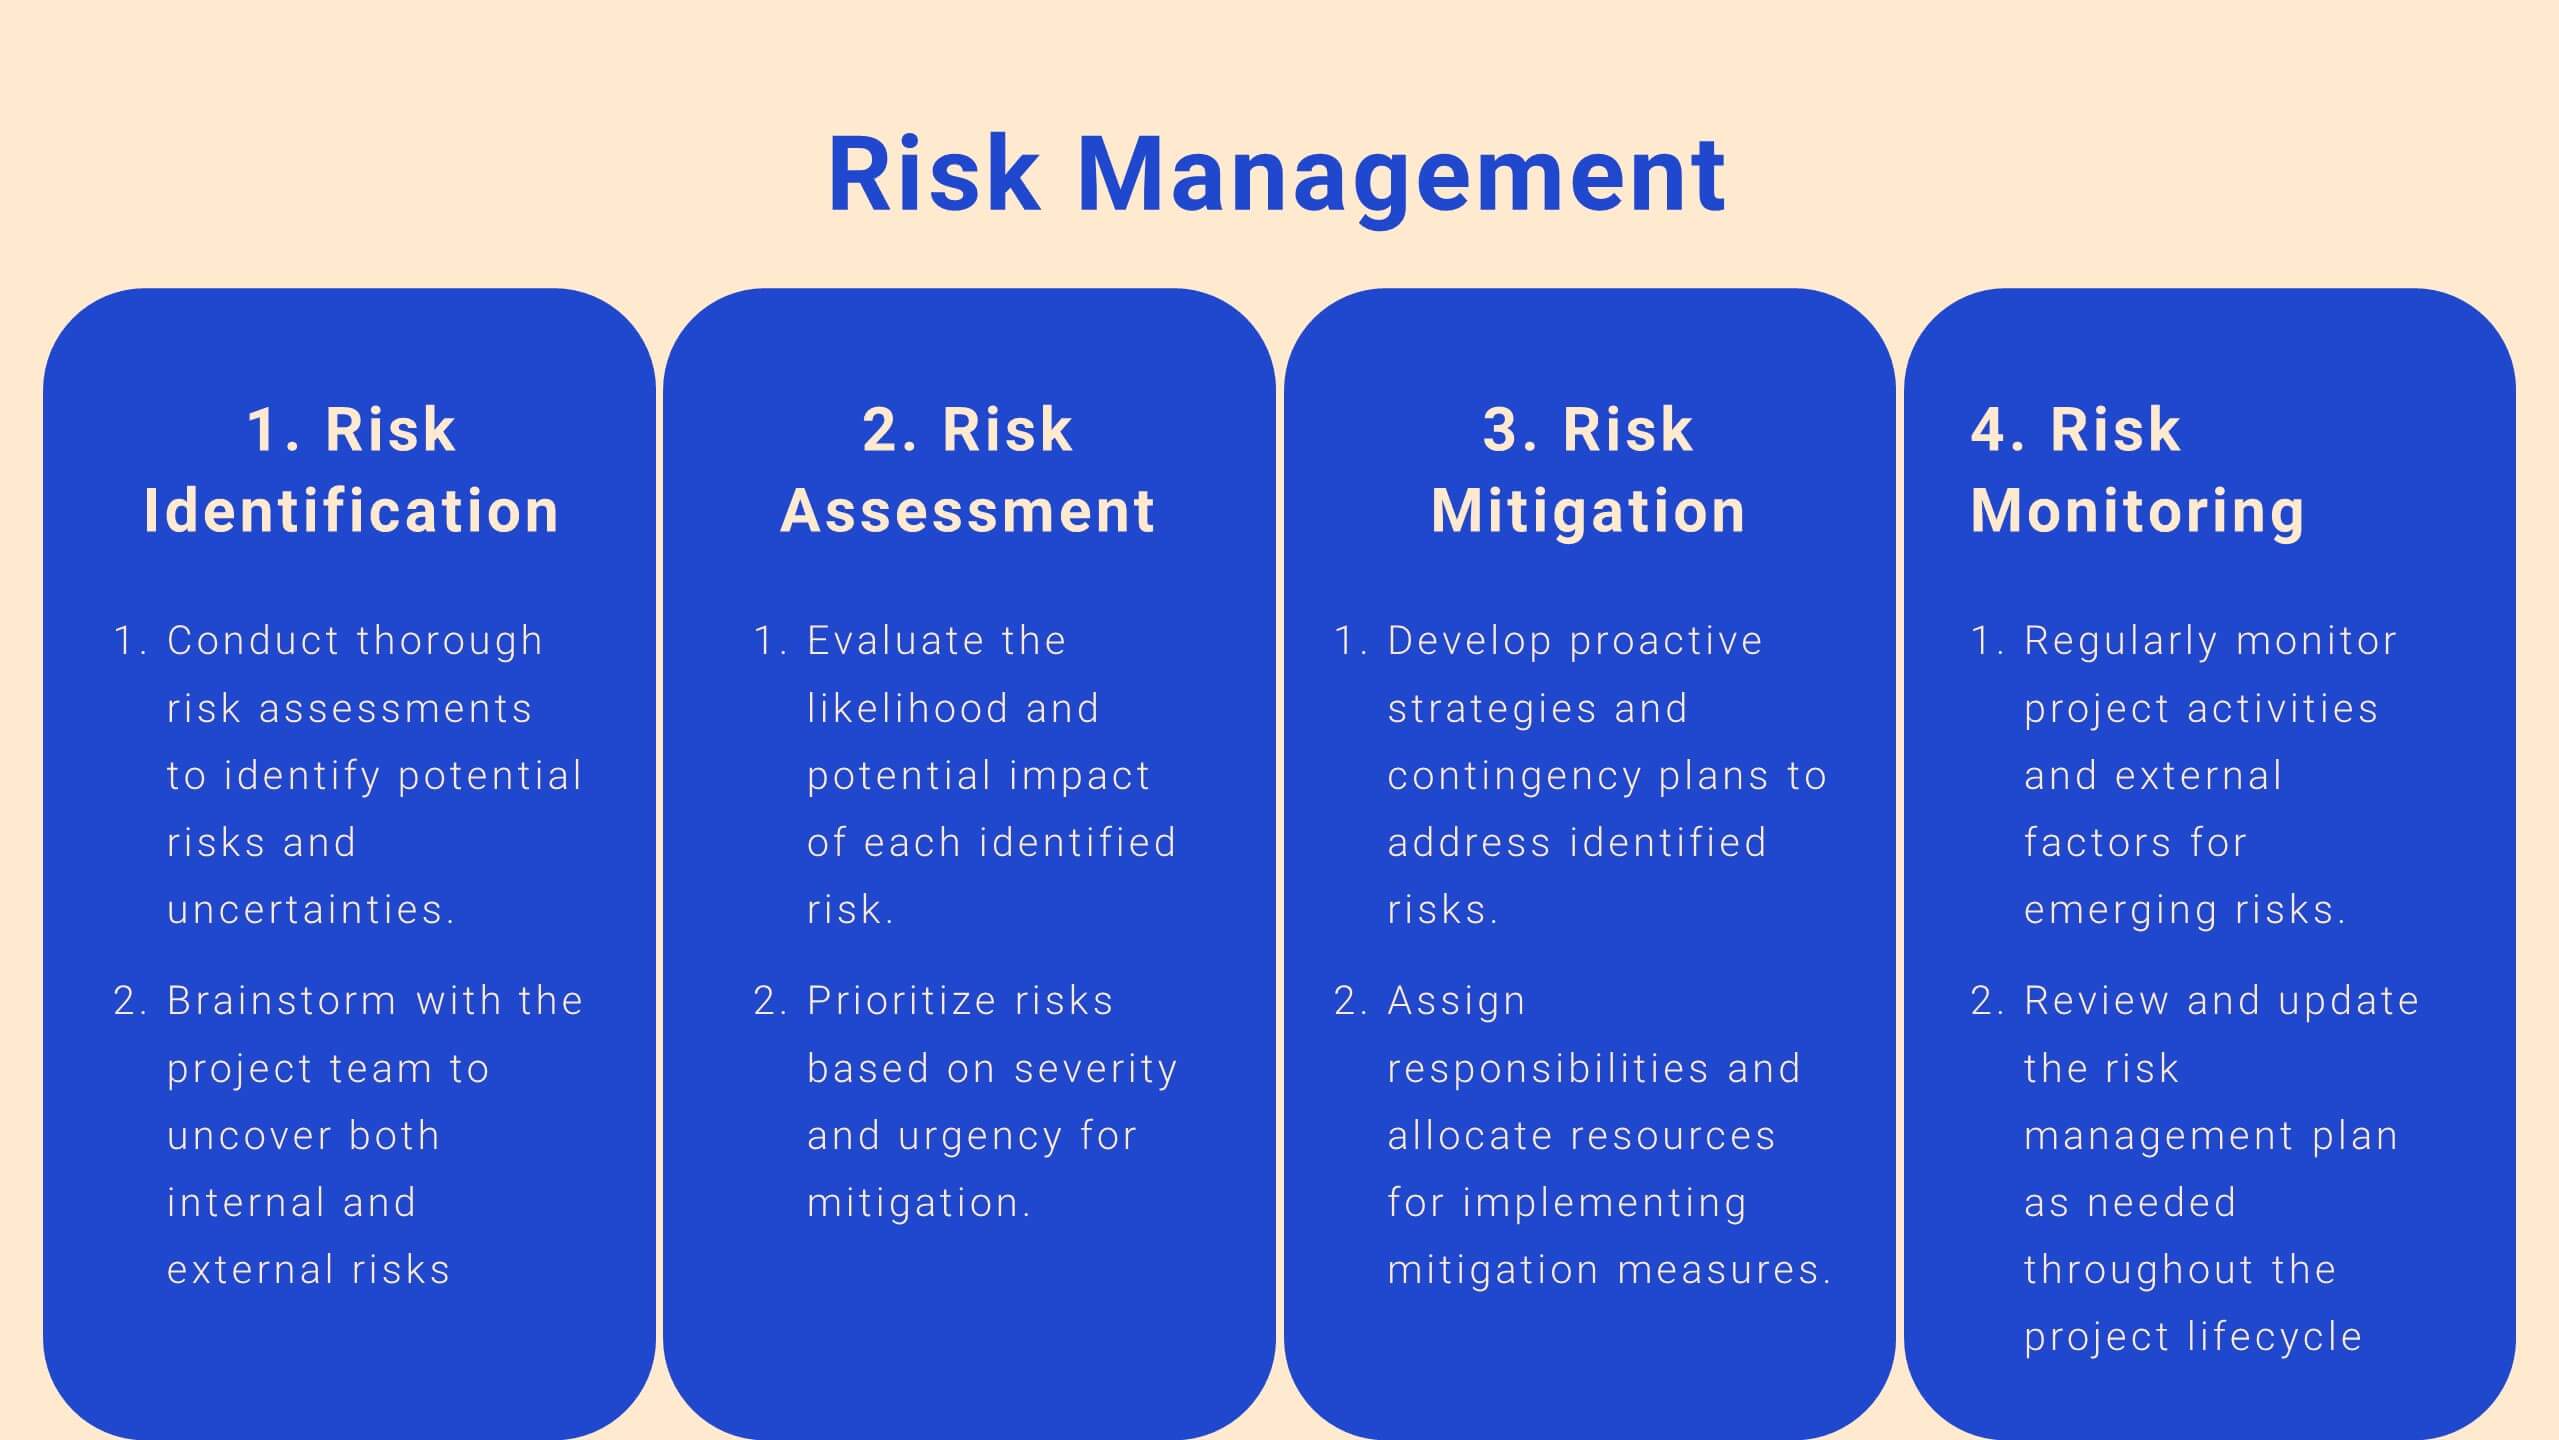
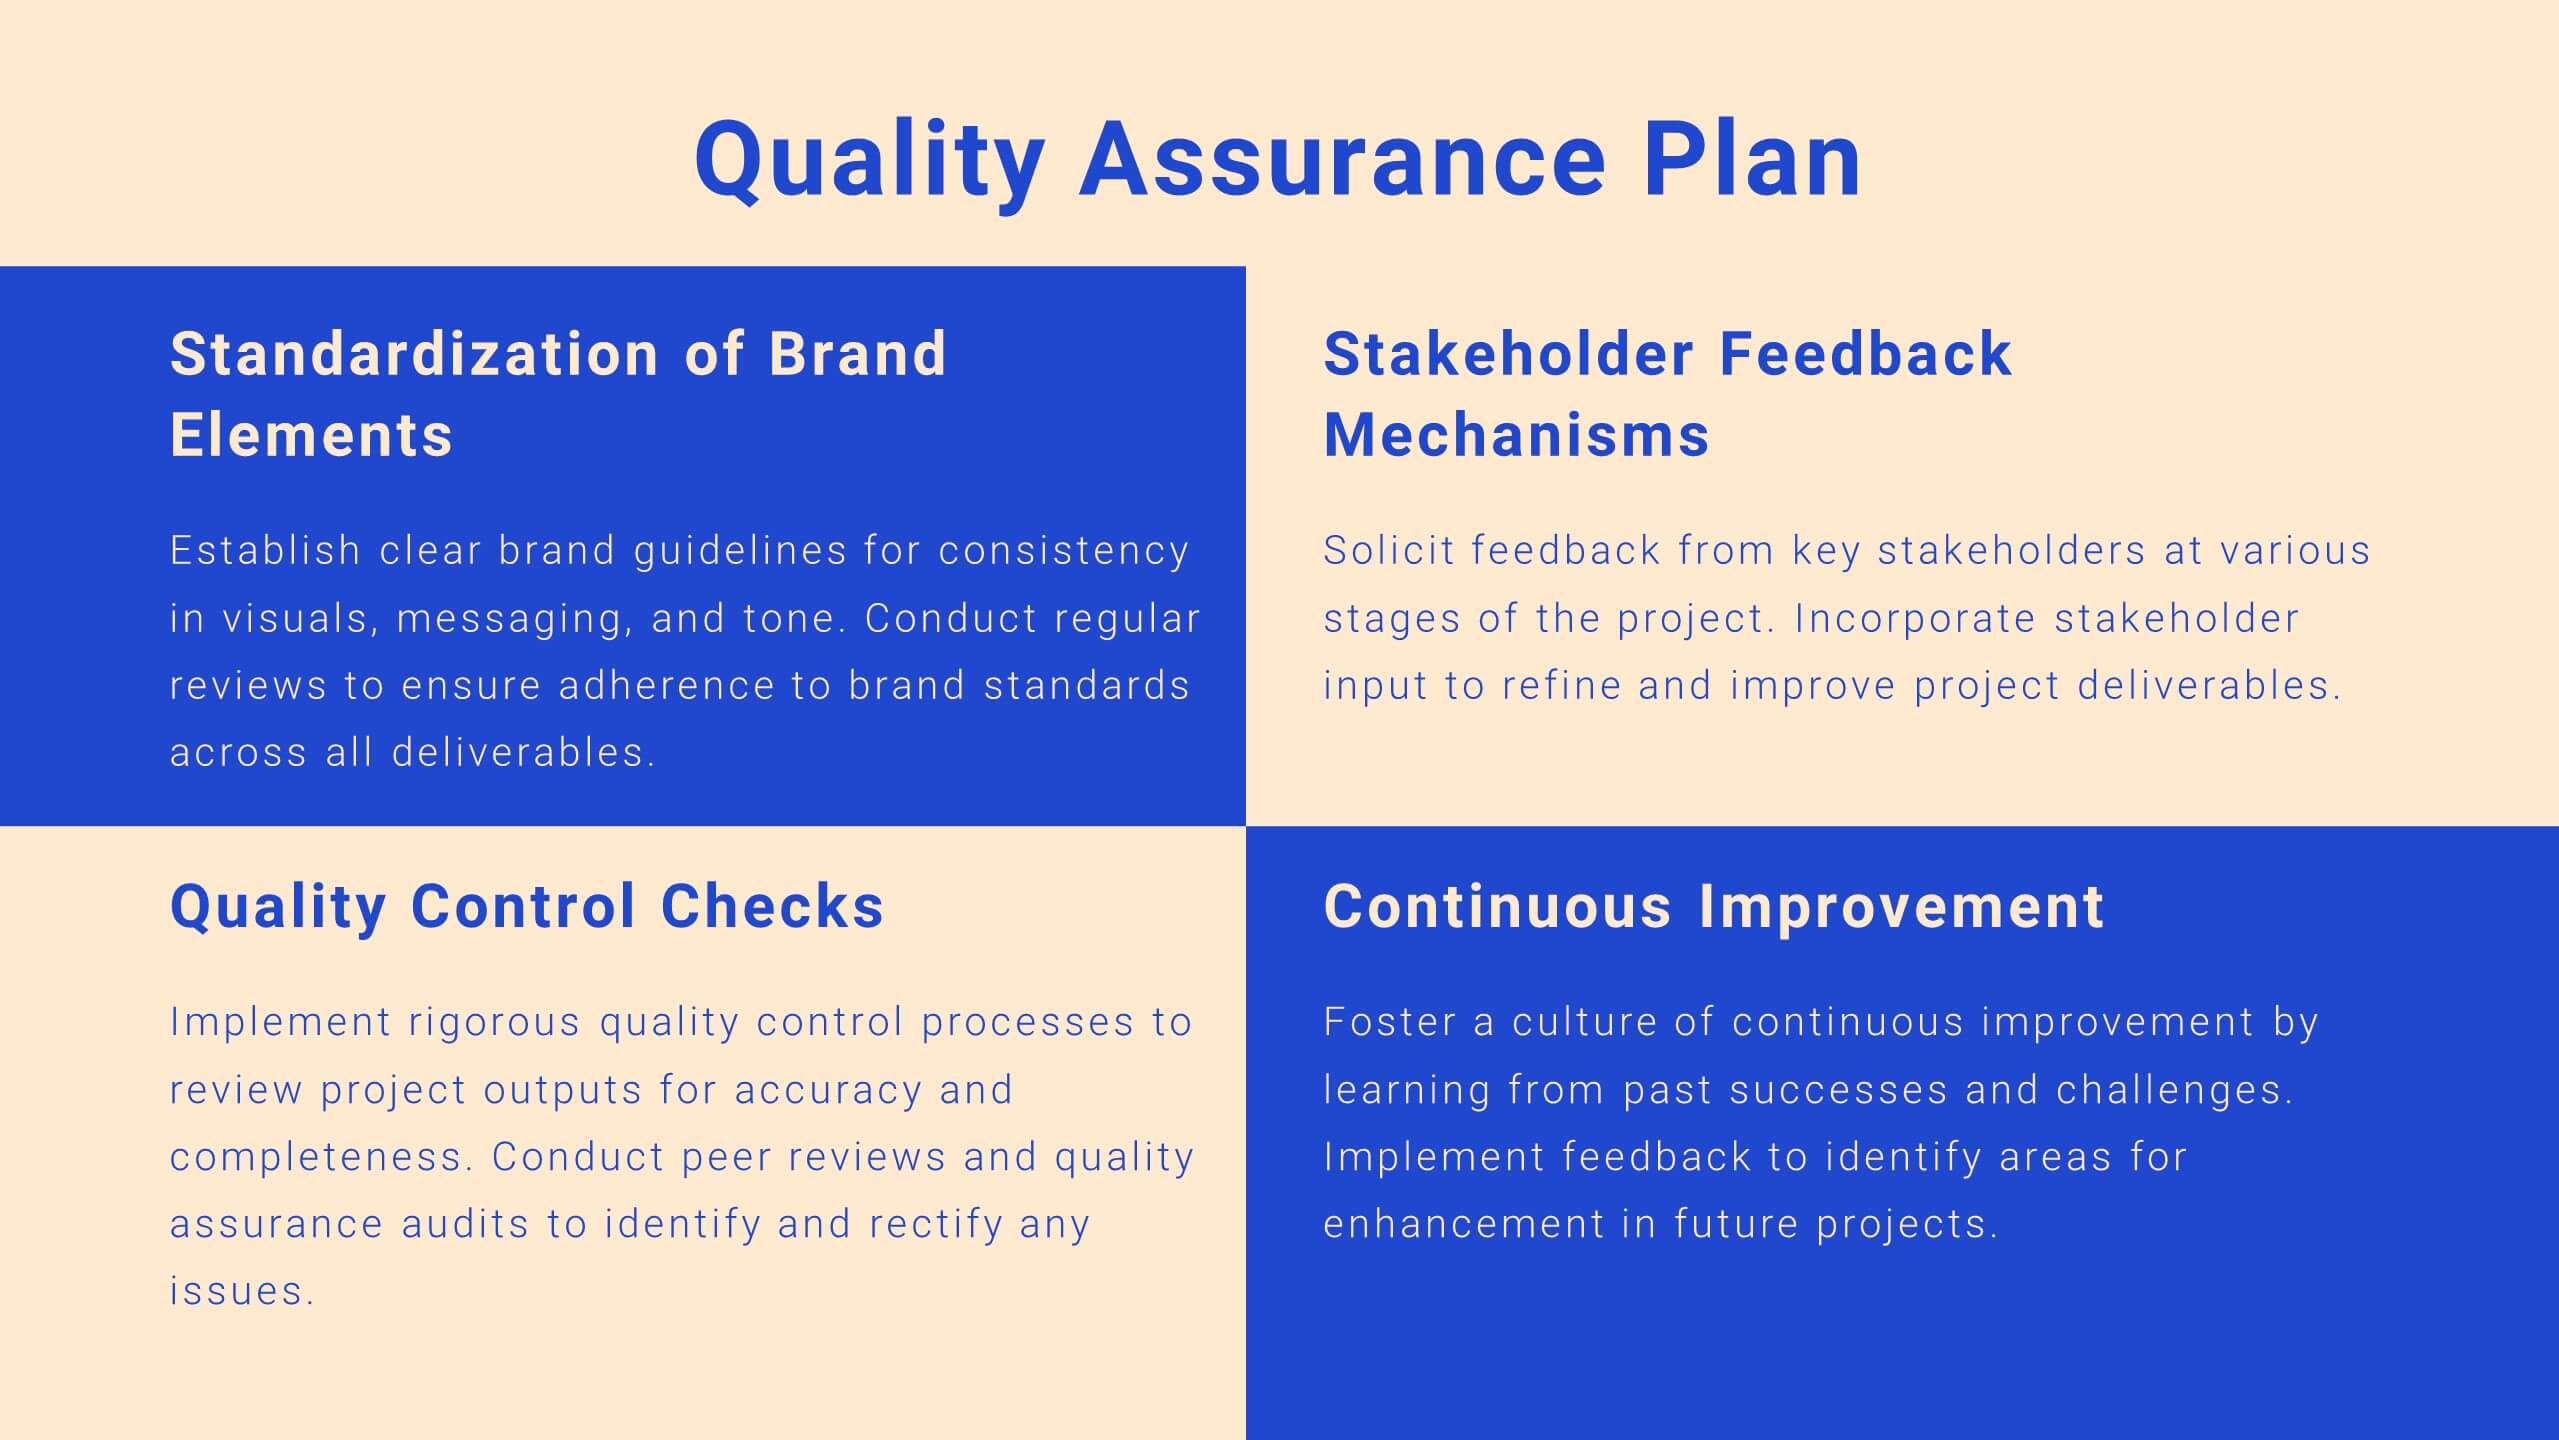
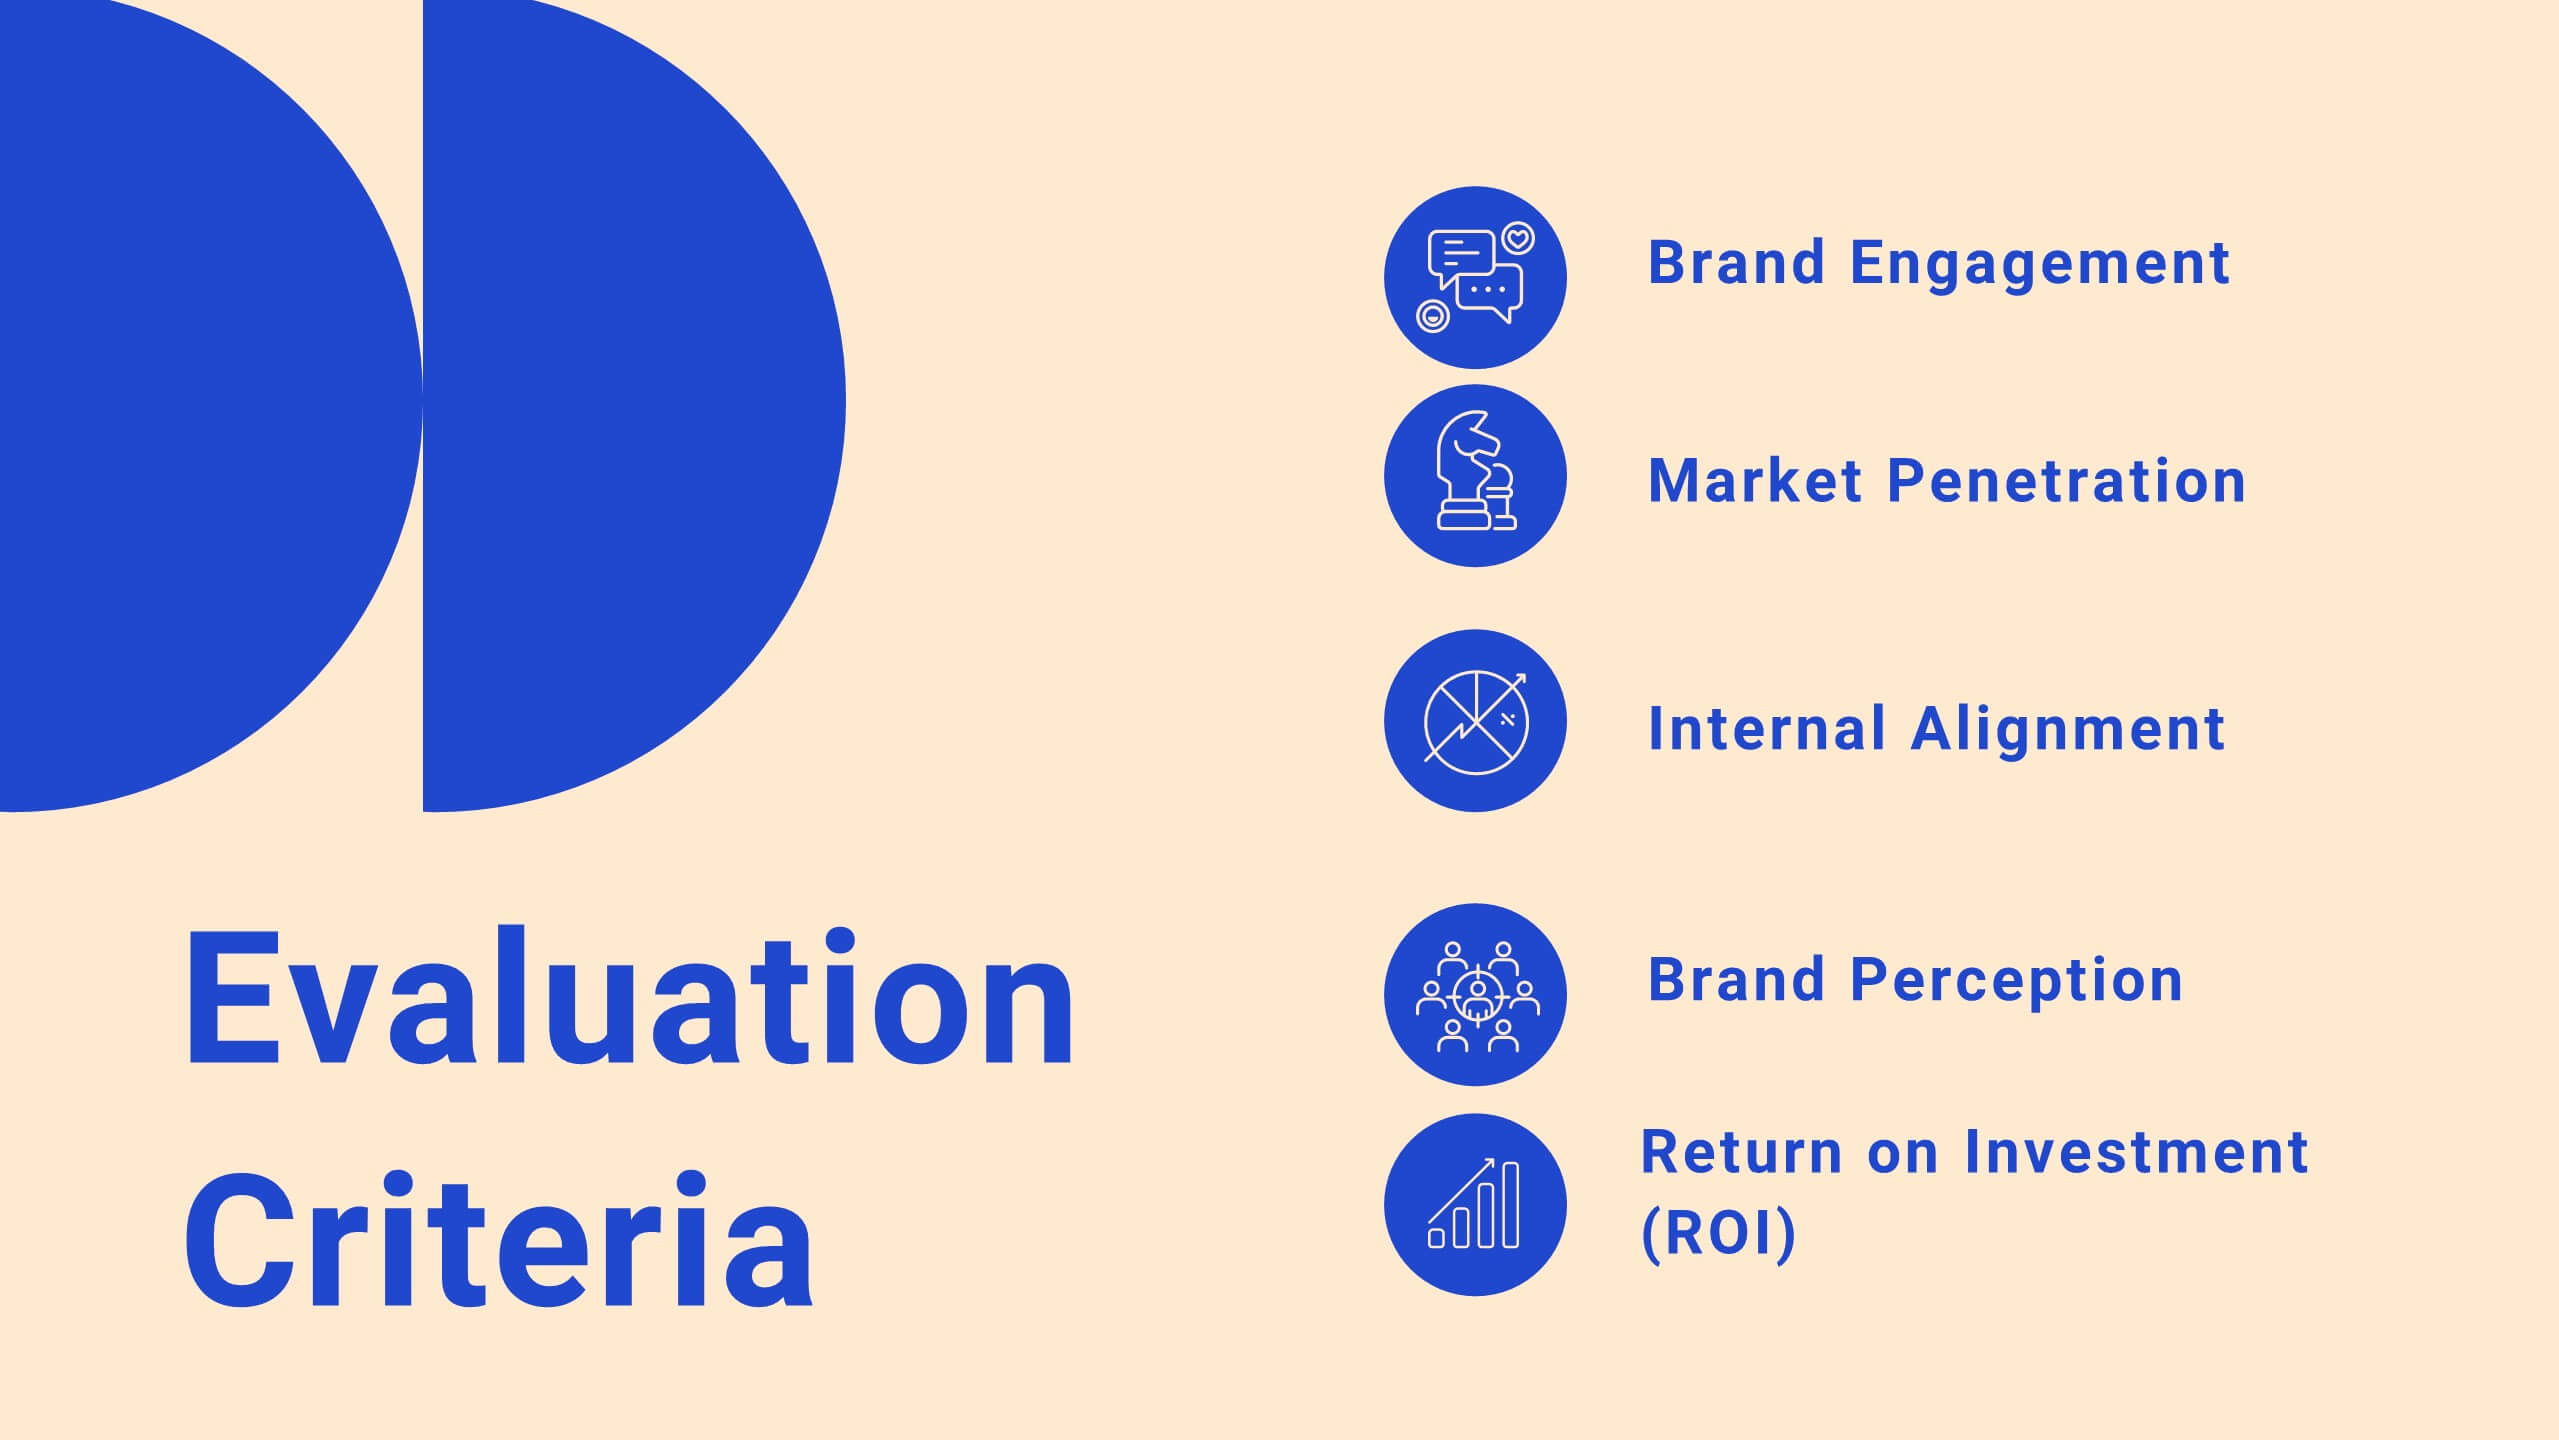
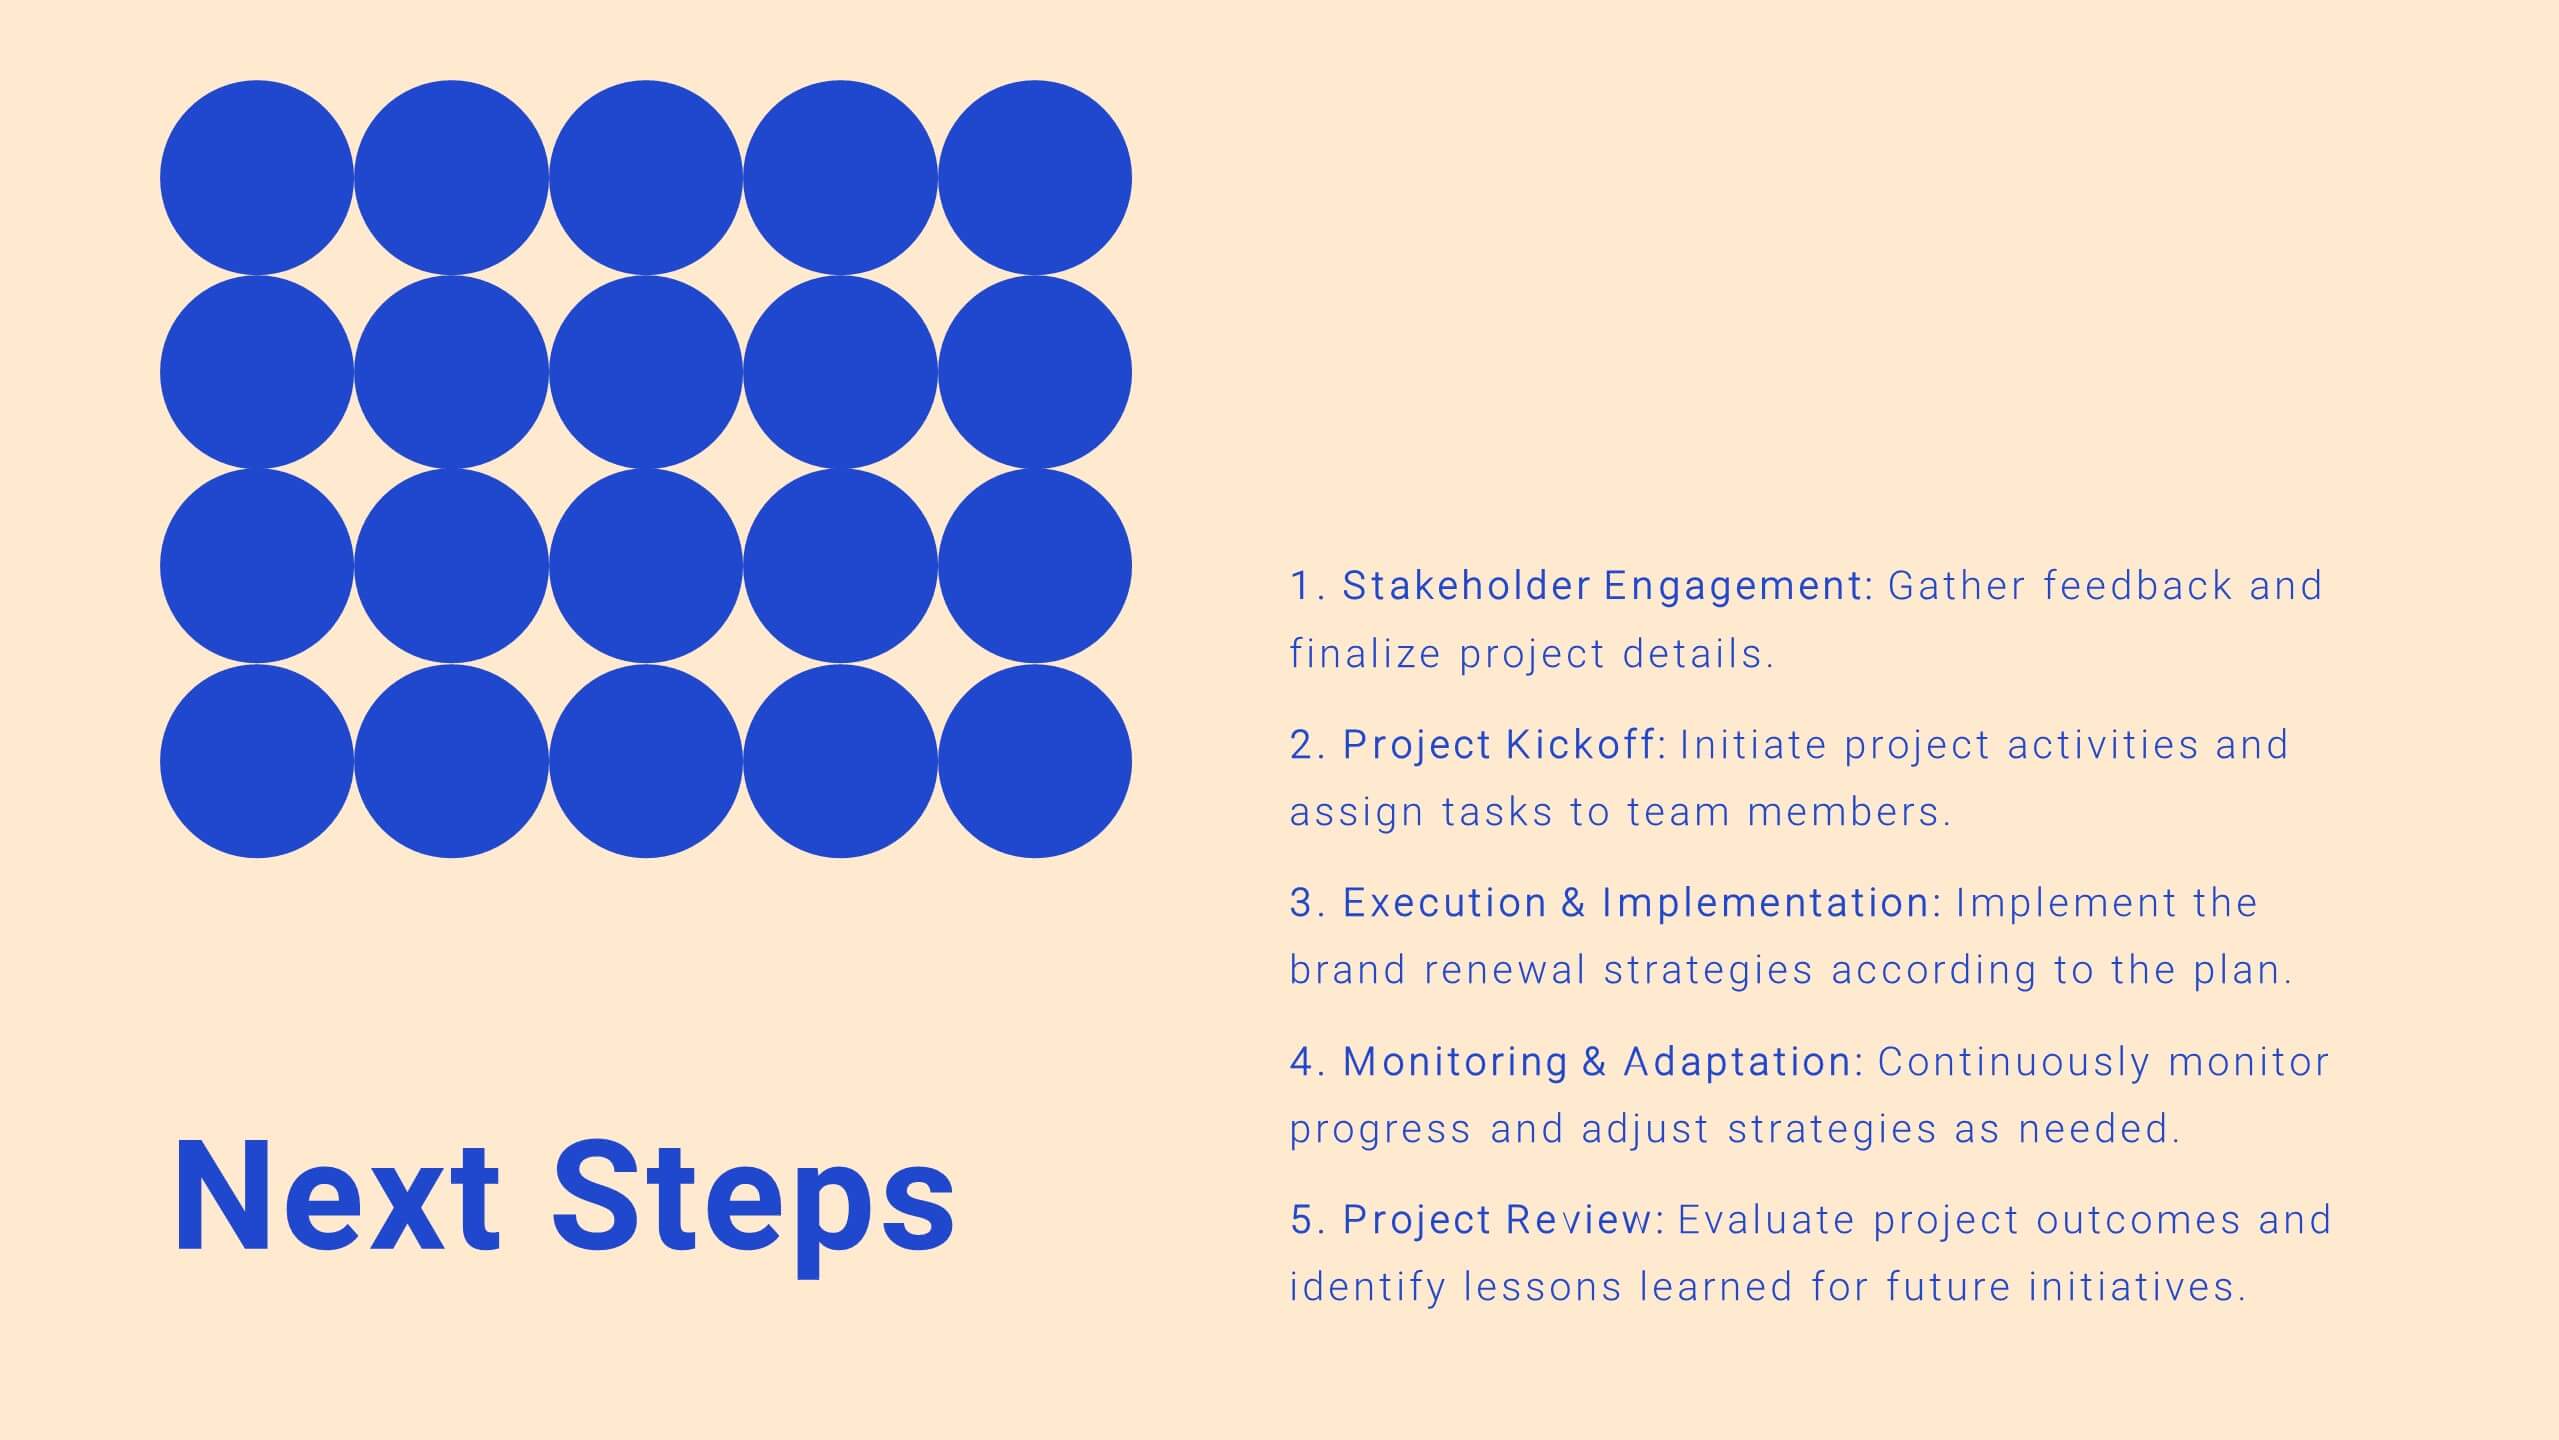
Drift Agile Project Plan Presentation
Take control of your projects with this comprehensive project plan template! From introductions to detailed objectives, this template covers scope of work, methodology, timelines, budget breakdowns, and risk management. Ideal for ensuring your project stays on track, it also includes stakeholder analysis and quality assurance plans. Compatible with PowerPoint, Keynote, and Google Slides.
6 slides
Arrow Segments for Goal Tracking Presentation
Clearly define objectives and measure performance with the Arrow Segments for Goal Tracking Presentation. This visually engaging dartboard-style layout is perfect for showcasing KPIs, targets, or strategic milestones. Each arrow represents a key focus area, allowing you to highlight priorities and progress. Fully customizable in PowerPoint, Google Slides, and Canva.


6 slides
Macro Environment PESTEL Framework
Navigate market forces with confidence using this dynamic PESTEL framework layout—designed to help you assess Political, Economic, Social, Technological, Environmental, and Legal factors with clarity. Whether for strategy planning or external analysis, this slide keeps your insights visually organized and easy to explain. Fully compatible with PowerPoint, Keynote, and Google Slides.


5 slides
Political Campaign Strategies Infographics
A political campaign refers to the organized efforts of individuals or groups to promote a particular candidate, political party, or specific political agenda during an election or to raise awareness and support for a specific issue. These infographic templates are designed to showcase various strategies and techniques used in political campaigns. This is perfect for politicians, campaign managers, or anyone involved in the political arena who wants to present their campaign strategies. Its customizable layout and eye-catching design enable politicians to communicate their campaign, engage with their audience, and rally support for their goals.


5 slides
Four-Step Marketing Funnel Plan Presentation
Streamline your messaging with the Four-Step Marketing Funnel Plan Presentation. This clean, vertical funnel layout highlights each stage of your strategy—ideal for visualizing lead nurturing, sales processes, or campaign progression. Each level is clearly marked and editable, helping you deliver focused insights with ease. Fully compatible with PowerPoint, Canva, Keynote, and Google Slides.


6 slides
Formal Numbers Infographics
Enter the world of formal numbers, a vital concept in mathematics and science! This infographic acts as your gateway to comprehending the structure and significance of formal numbers. From the fundamental properties of natural numbers to the intricate details of real and complex numbers, we unveil the secrets that underpin these mathematical entities. Discover the mathematical significance of formal numbers across various fields, from algebra to calculus and beyond. Explore how these numbers are used in practical applications, including engineering, physics, and computer science. Gain an appreciation for the elegance and versatility of formal numbers in solving real-world problems. With this informative infographic, compatible with PowerPoint, Keynote, and Google Slides, sharing your understanding of formal numbers becomes seamless. Empower yourself with the knowledge to navigate the intricate world of mathematics. Dive into the realm of formal numbers and embark on a journey of mathematical exploration and enlightenment.