


Features
- 4 Unique slides
- Fully editable and easy to edit in Microsoft Powerpoint, Keynote and Google Slides
- 16:9 widescreen layout
- Clean and professional designs
- Export to JPG, PDF or send by email


Do you have any questions?
Recommend


7 slides
Artificial Intelligence Uses Infographic
Artificial Intelligence (AI) is no longer just a concept of sci-fi narratives but an integral part of our daily lives. Our compelling infographic, set against a clean white backdrop with contrasting hues of blue, provides a captivating look into the myriad uses of AI. From healthcare innovations to smart home solutions, our visually engaging template breaks down complex AI applications into digestible information bites. Ideal for educators, tech enthusiasts, and businesses, it's a versatile tool designed for multiple presentation platforms, including PowerPoint, Keynote, and Google Slides.


5 slides
Risk Assessment Heat Map Presentation
Evaluate risks effectively with a structured heat map. This Risk Assessment Heat Map helps visualize potential threats by mapping probability and impact levels. Ideal for risk management, business continuity planning, and decision-making. Fully customizable and compatible with PowerPoint, Keynote, and Google Slides for professional and seamless integration.


21 slides
Ceres Financial Report Presentation
This financial report template is designed to showcase performance metrics, sales analysis, project progress, and strategic insights with clarity and professionalism. Featuring slides for operational updates, competitor insights, and recommendations for improvement, it ensures a comprehensive financial overview. Compatible with PowerPoint, Keynote, and Google Slides for flexible presentations.


5 slides
Economic Analysis of North America Map Presentation
The Economic Analysis of North America Map template provides a focused visual tool for displaying economic data across different regions. With dedicated spots for key statistics and trends, this template enhances presentations with clear, data-driven insights. It is designed to be user-friendly and is compatible with PowerPoint, Keynote, and Google Slides.


7 slides
Communication Styles Infographic
Dive into the diverse world of communication with our communication styles infographic. Set against a palette of blue, yellow, and white, this template offers a visual exploration of different communication methods and their nuances. Whether it's assertive, passive, aggressive, or passive-aggressive, understanding these styles is vital in both personal and professional settings. Ideal for corporate trainers, educators, students, or anyone aiming to improve their interpersonal skills. Crafted for clarity and compatibility, this infographic is an excellent addition to PowerPoint, Keynote, and Google Slides, ensuring your presentations resonate with both substance and style.


5 slides
Human Body Anatomy Diagram Presentation
Bring your content to life with a clean, modern visual that makes learning feel surprisingly engaging. This presentation breaks down key body systems in a simple, approachable way, helping you explain functions, processes, or health concepts with clarity. Perfect for medical training, wellness education, or anatomy lessons. Fully compatible with PowerPoint, Keynote, and Google Slides.


6 slides
Core Focus Areas in Strategic Wheel Model Presentation
Showcase your business's key focus areas using this five-part strategic wheel layout. Each segment is paired with corresponding labels and editable text fields for streamlined messaging. Ideal for strategy, operations, or team planning. Fully customizable and compatible with PowerPoint, Keynote, and Google Slides to suit any brand style.


4 slides
Target Audience Slide Deck Presentation
Make your message click instantly with a bold, puzzle-style slide that brings your audience insights to life. This presentation helps you break down key segments, user needs, and demographic details in a clear, engaging format that supports strategic decision-making. Fully compatible with PowerPoint, Keynote, and Google Slides.


6 slides
Geometric Shape Design Slides
Present your process or flow clearly using the Geometric Shape Design Slides Presentation. This layout uses connected circular icons to visually represent sequential steps, ideal for workflows, timelines, or strategic roadmaps. Each stage is color-coded and paired with editable titles and descriptions for clarity. Fully customizable in PowerPoint, Keynote, and Google Slides.


21 slides
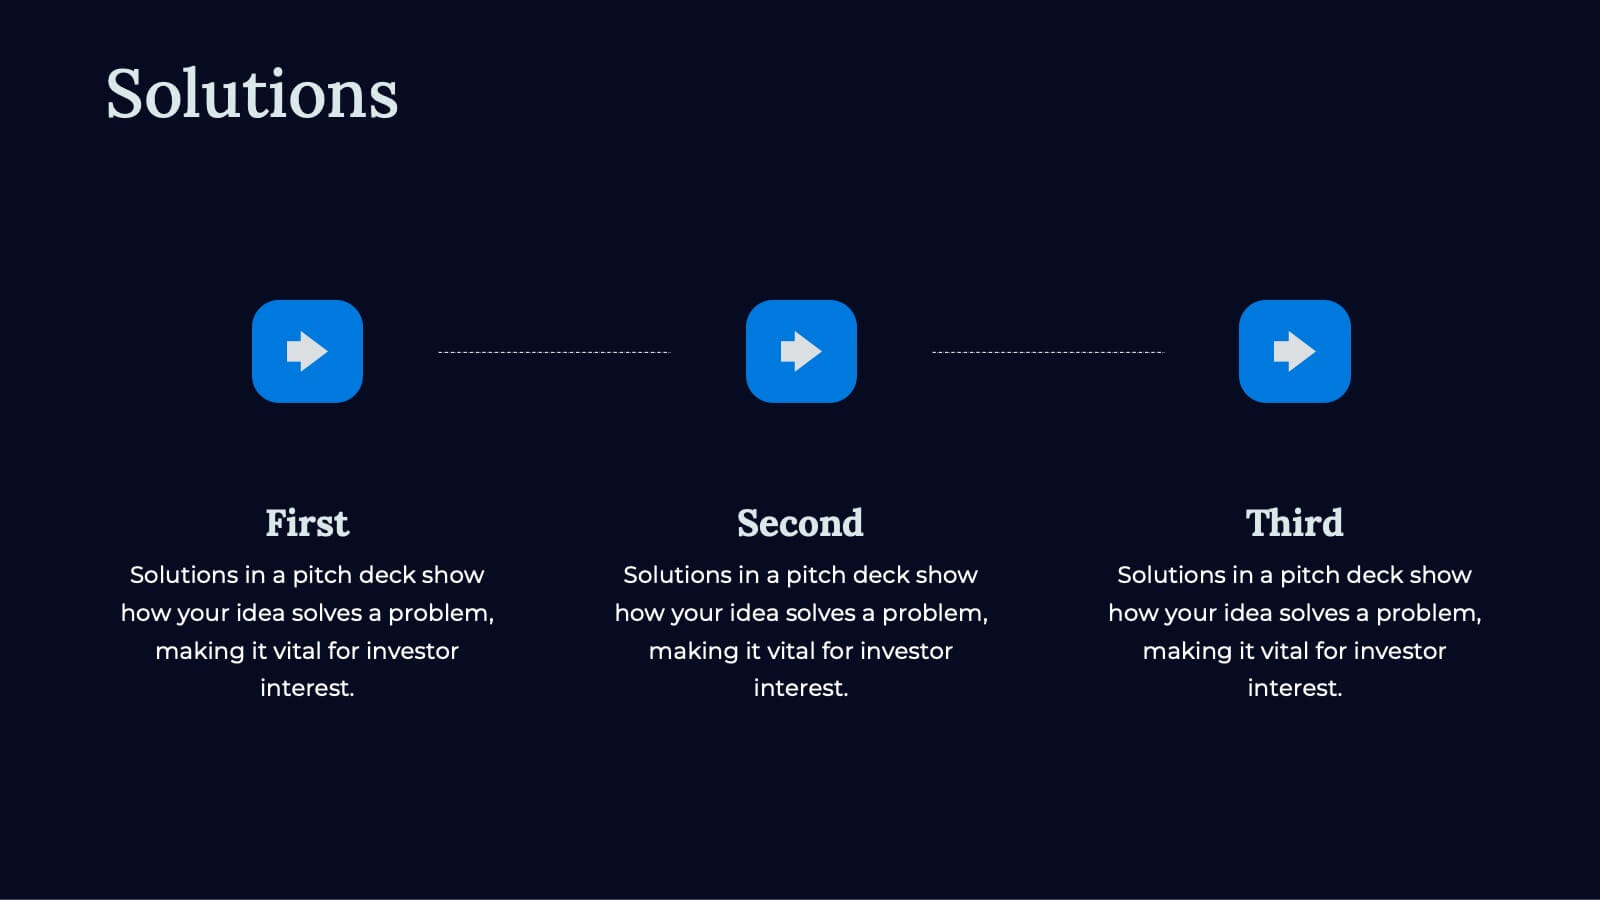
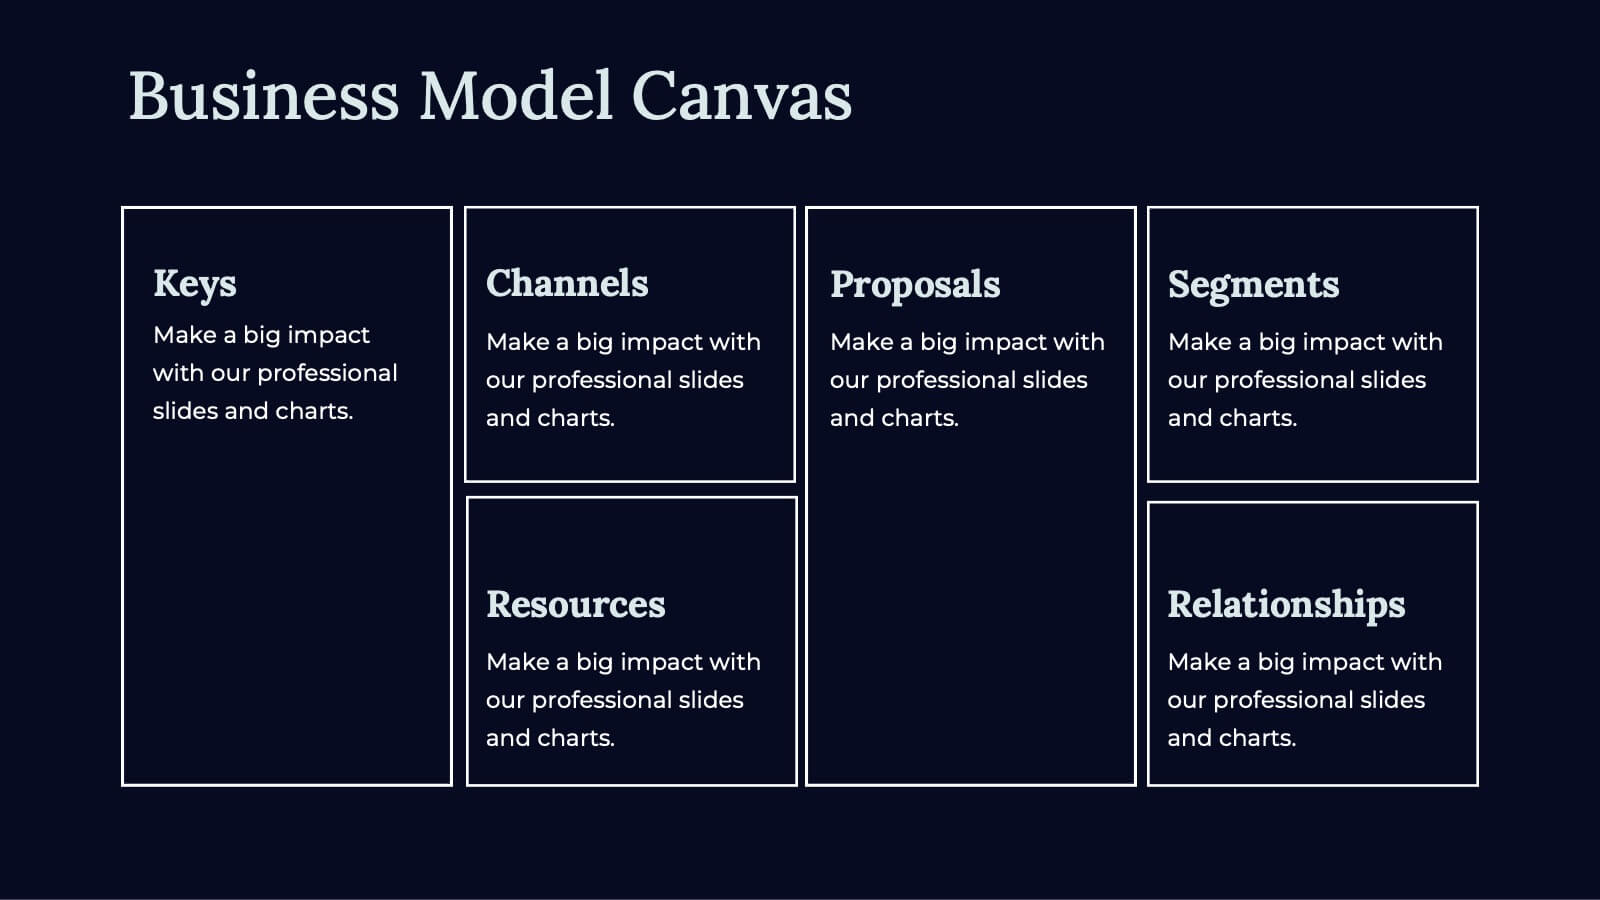
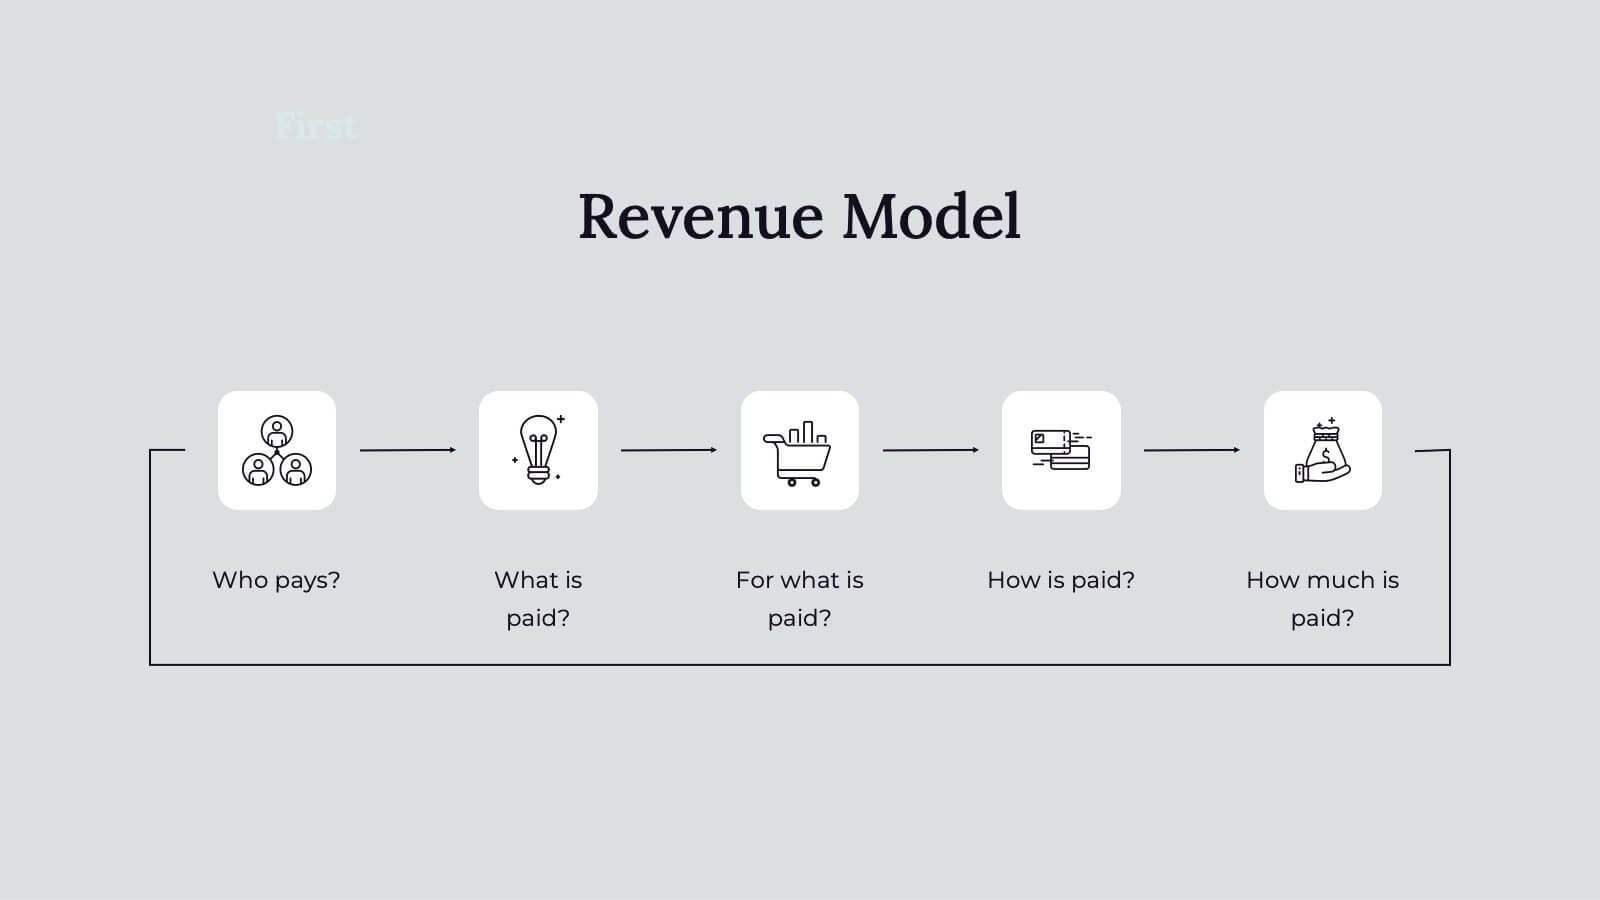
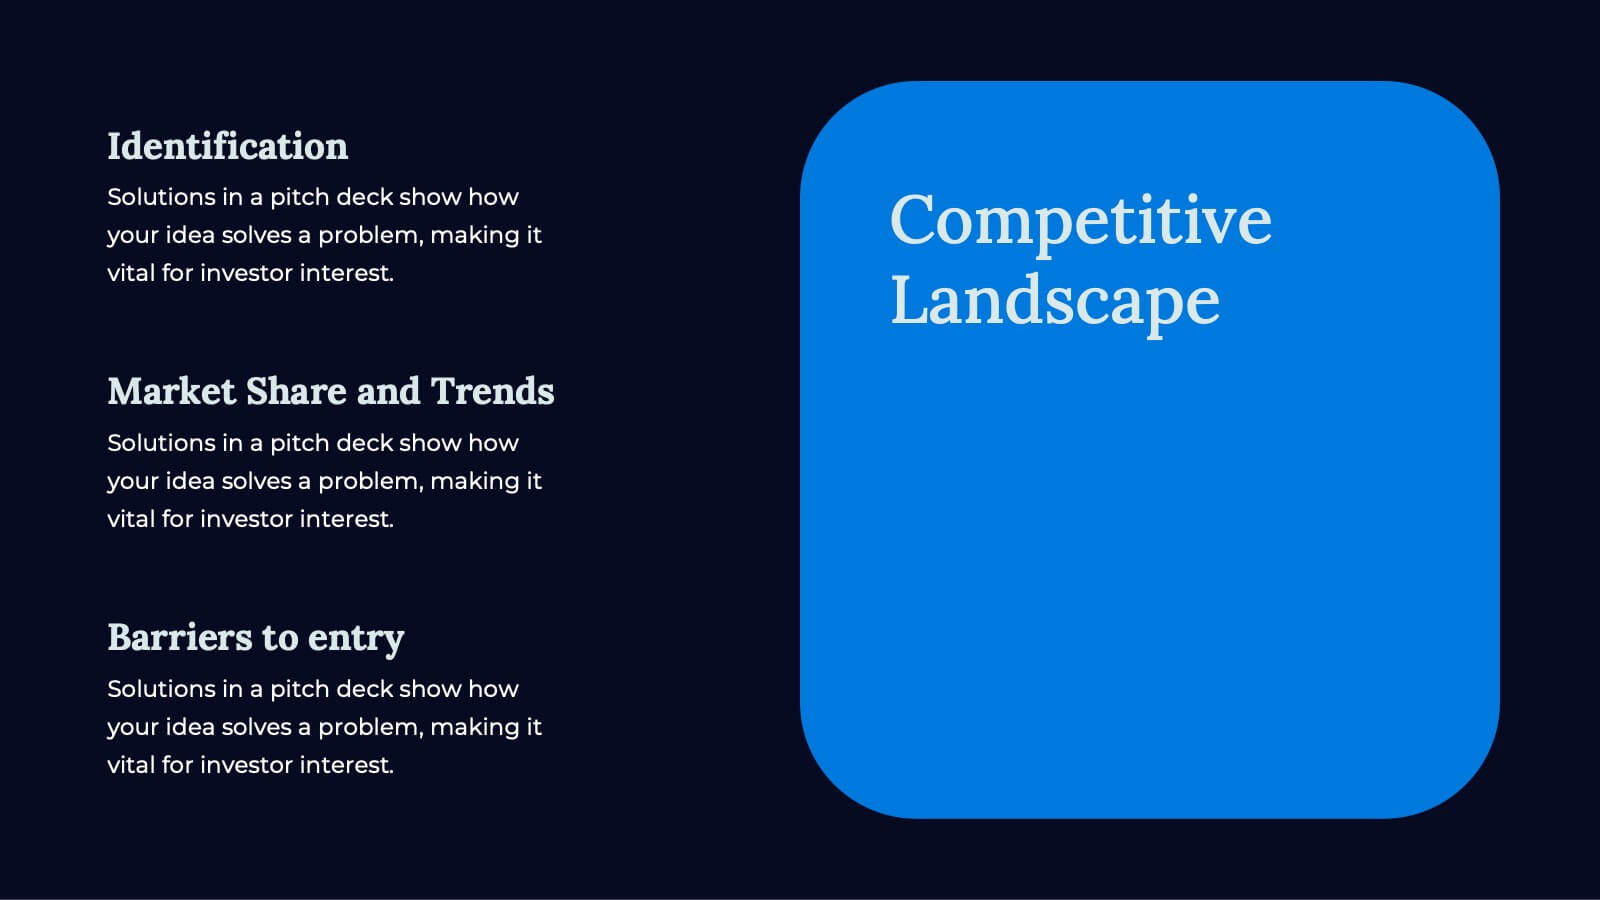
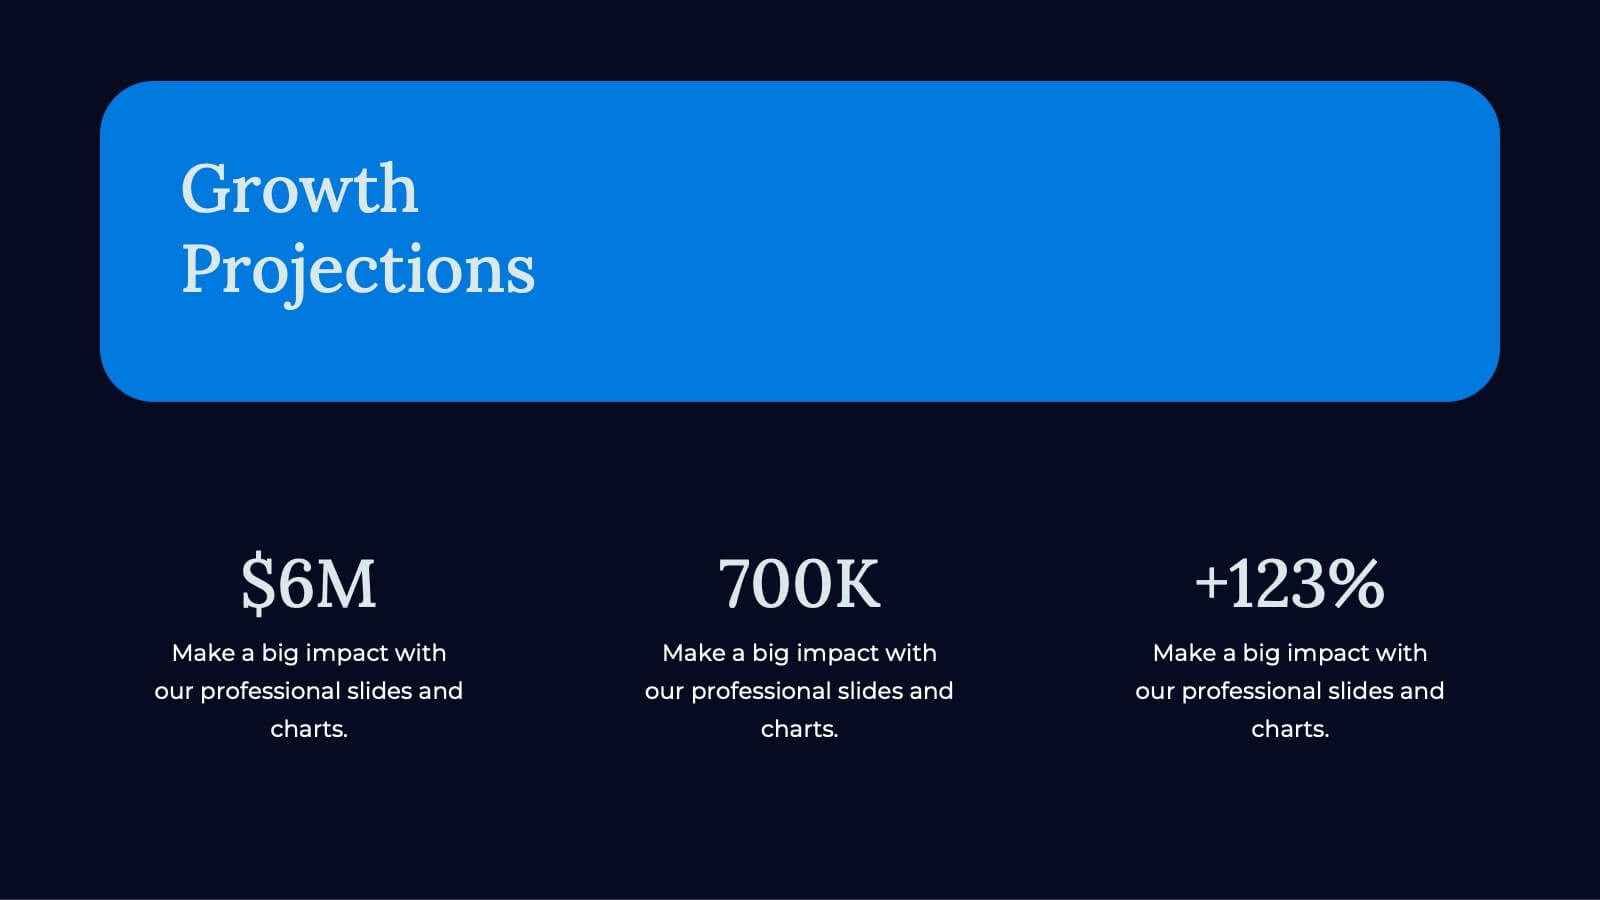
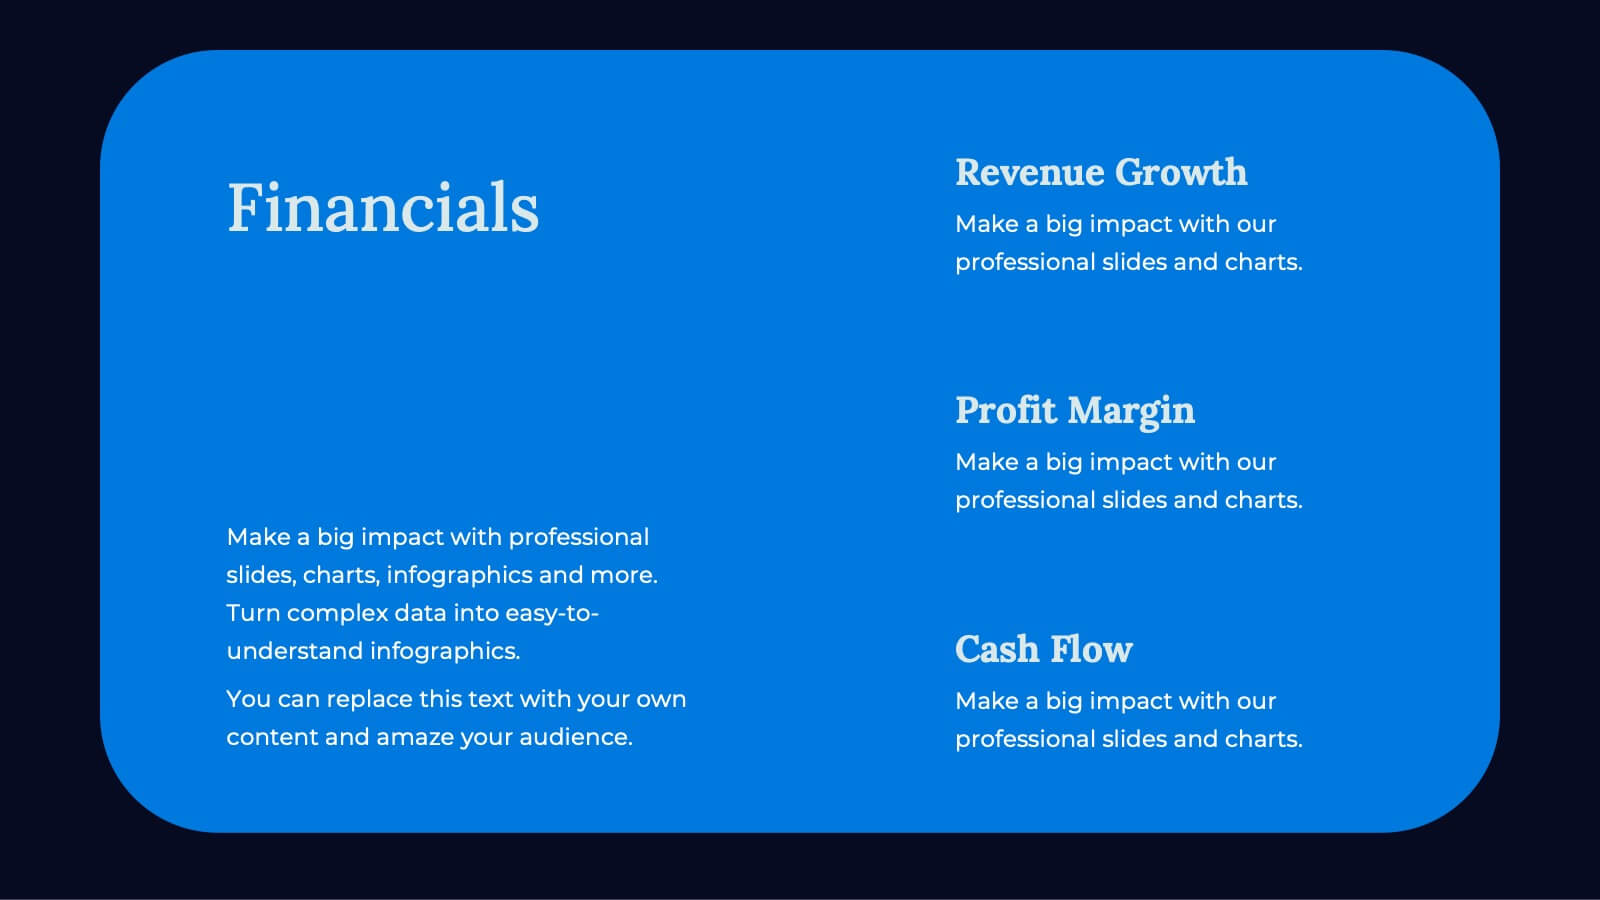
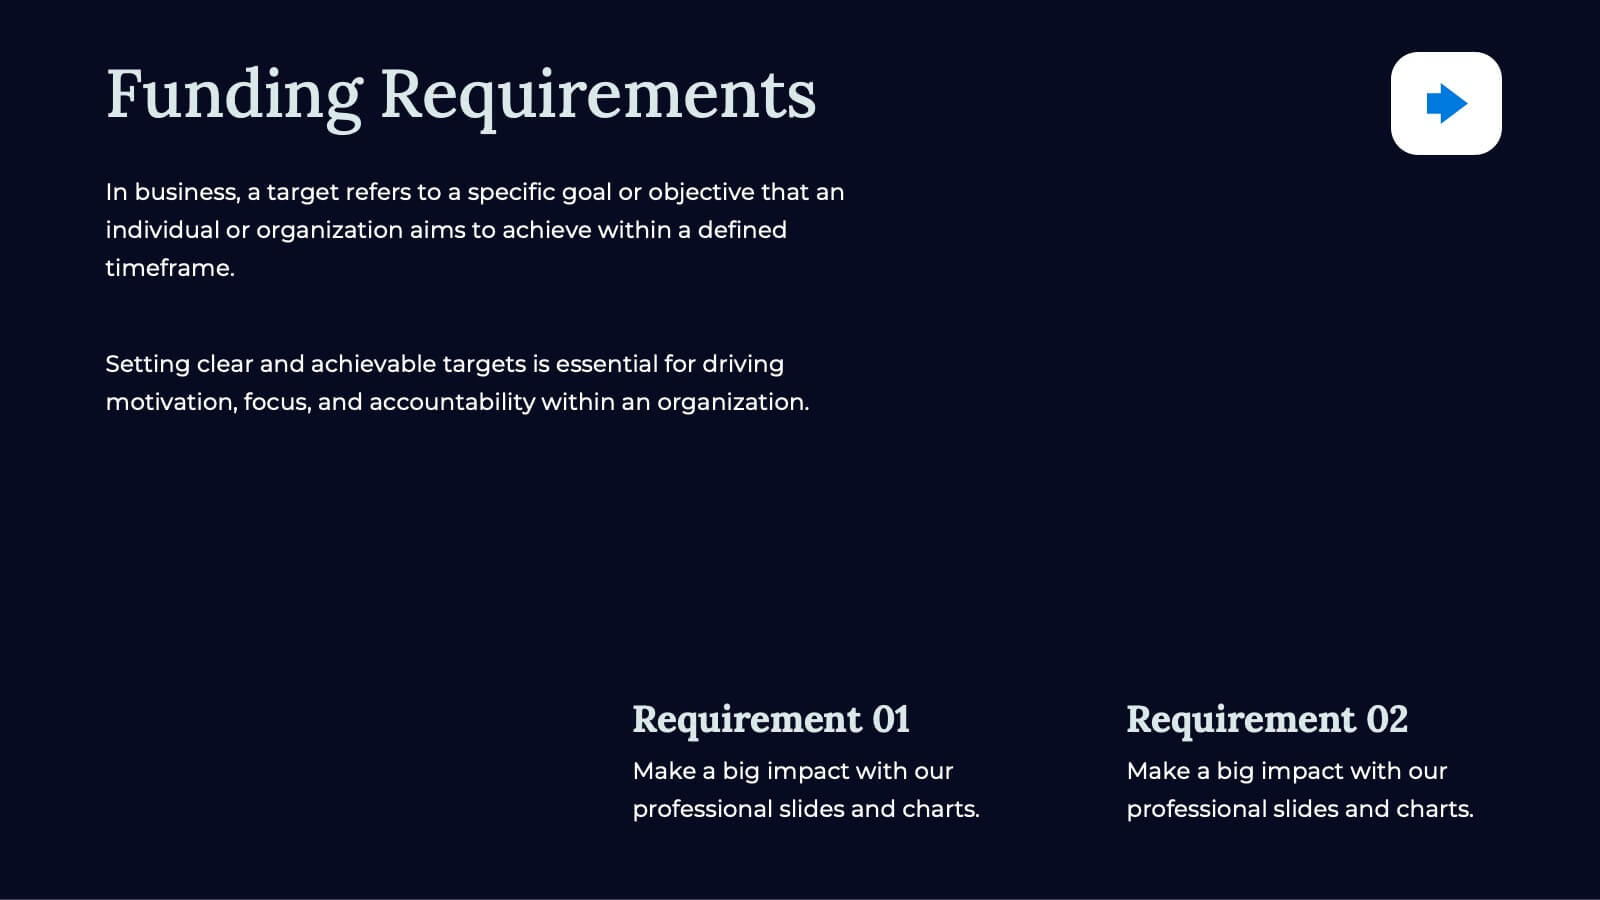
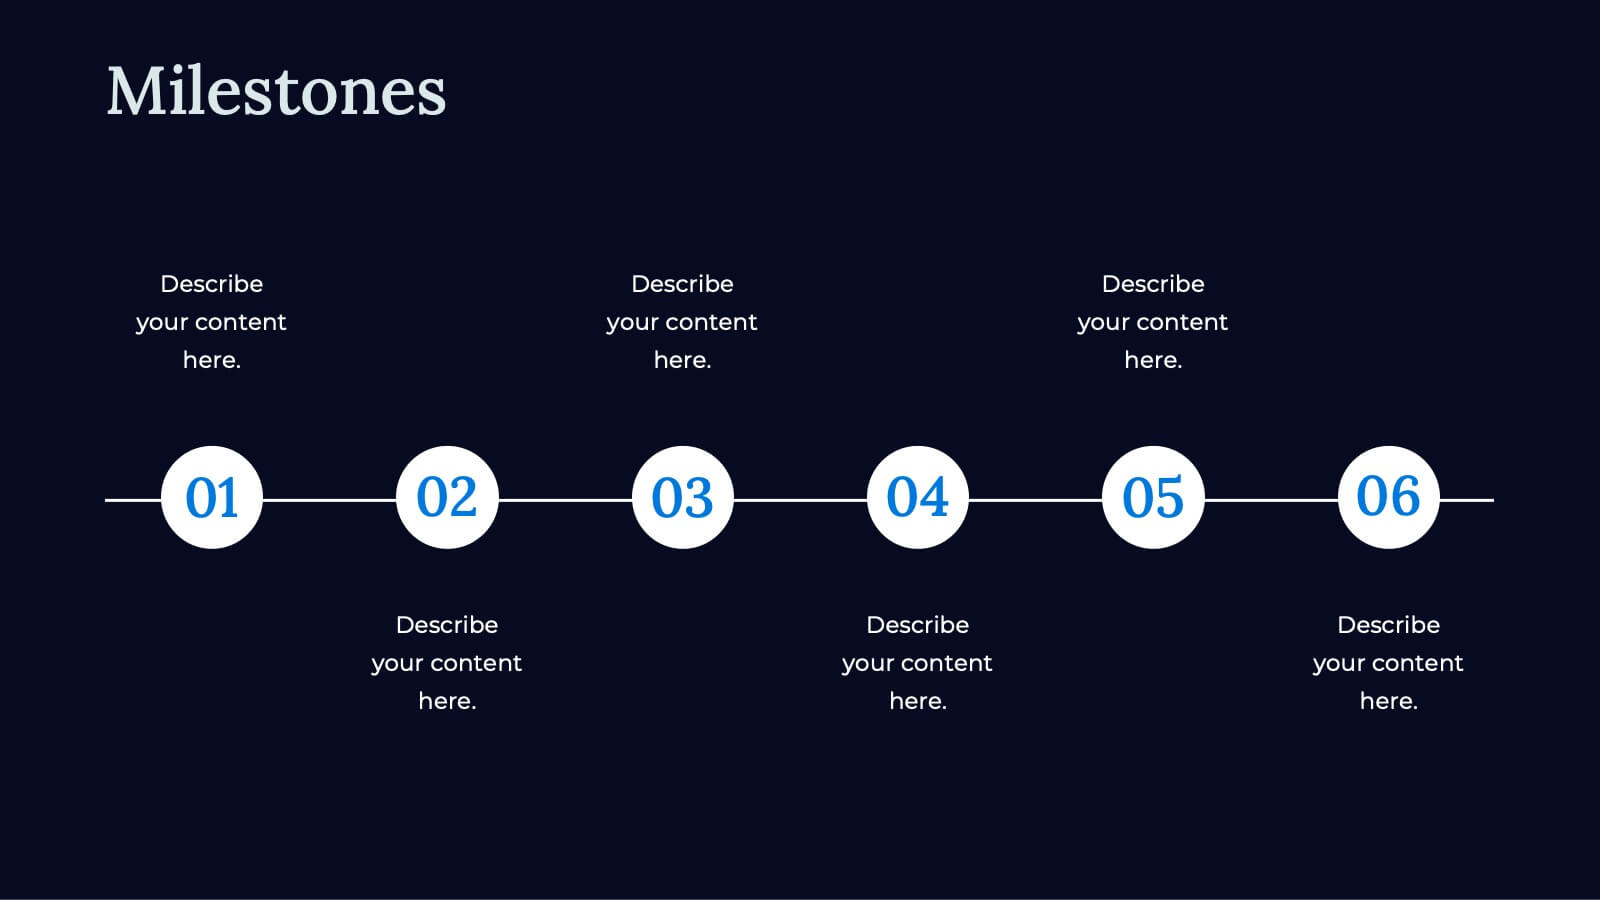
Apex Business Idea Pitch Deck Presentation
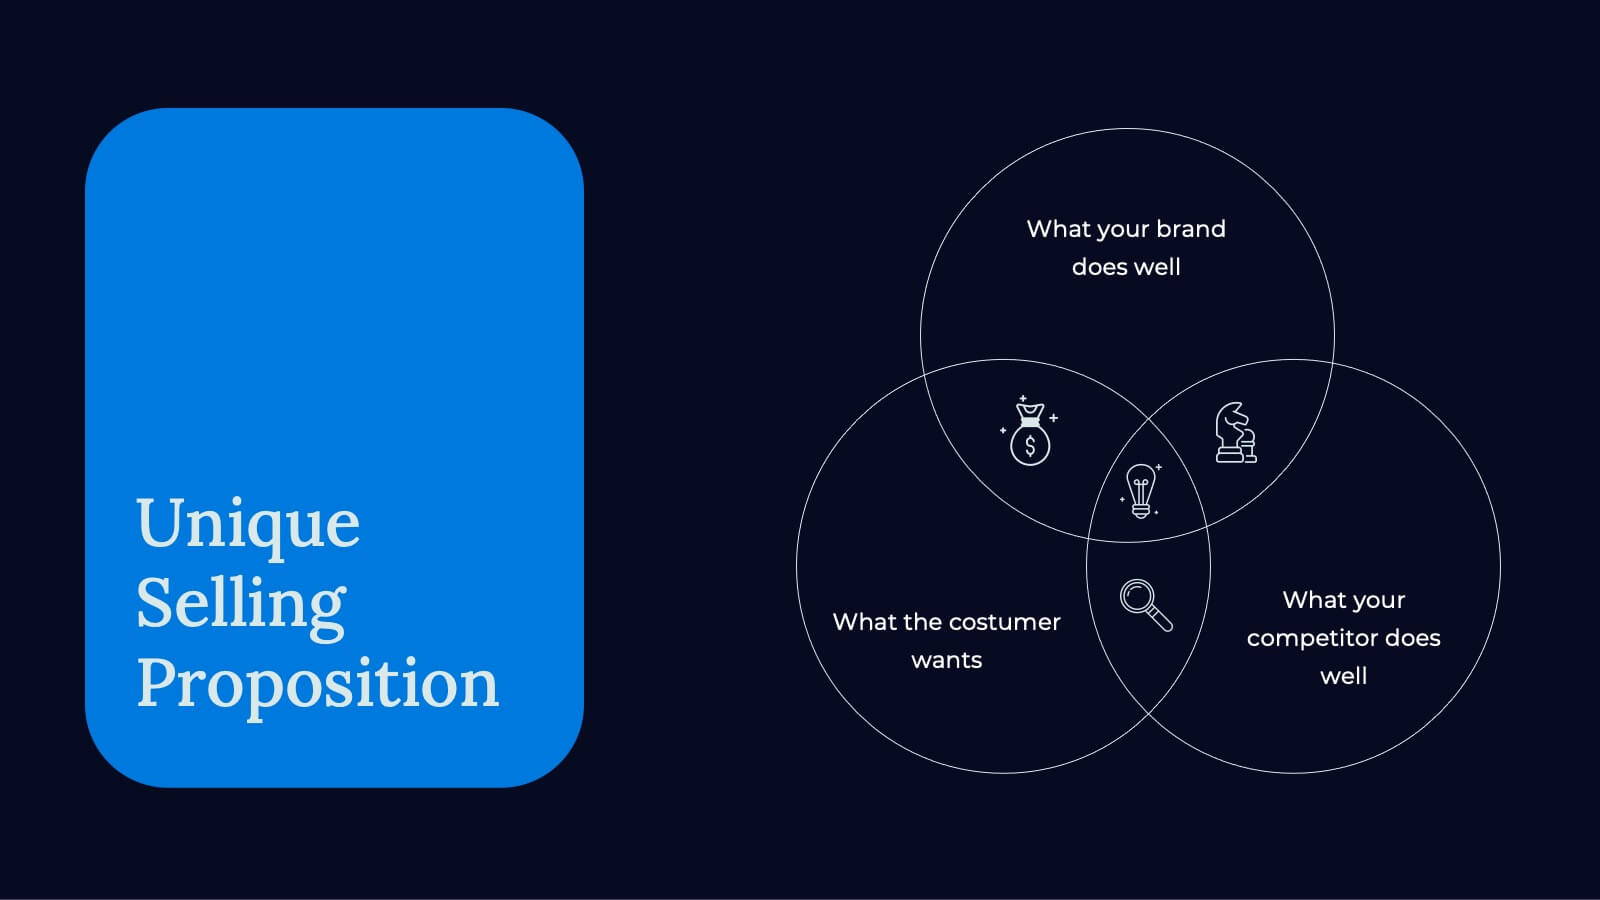
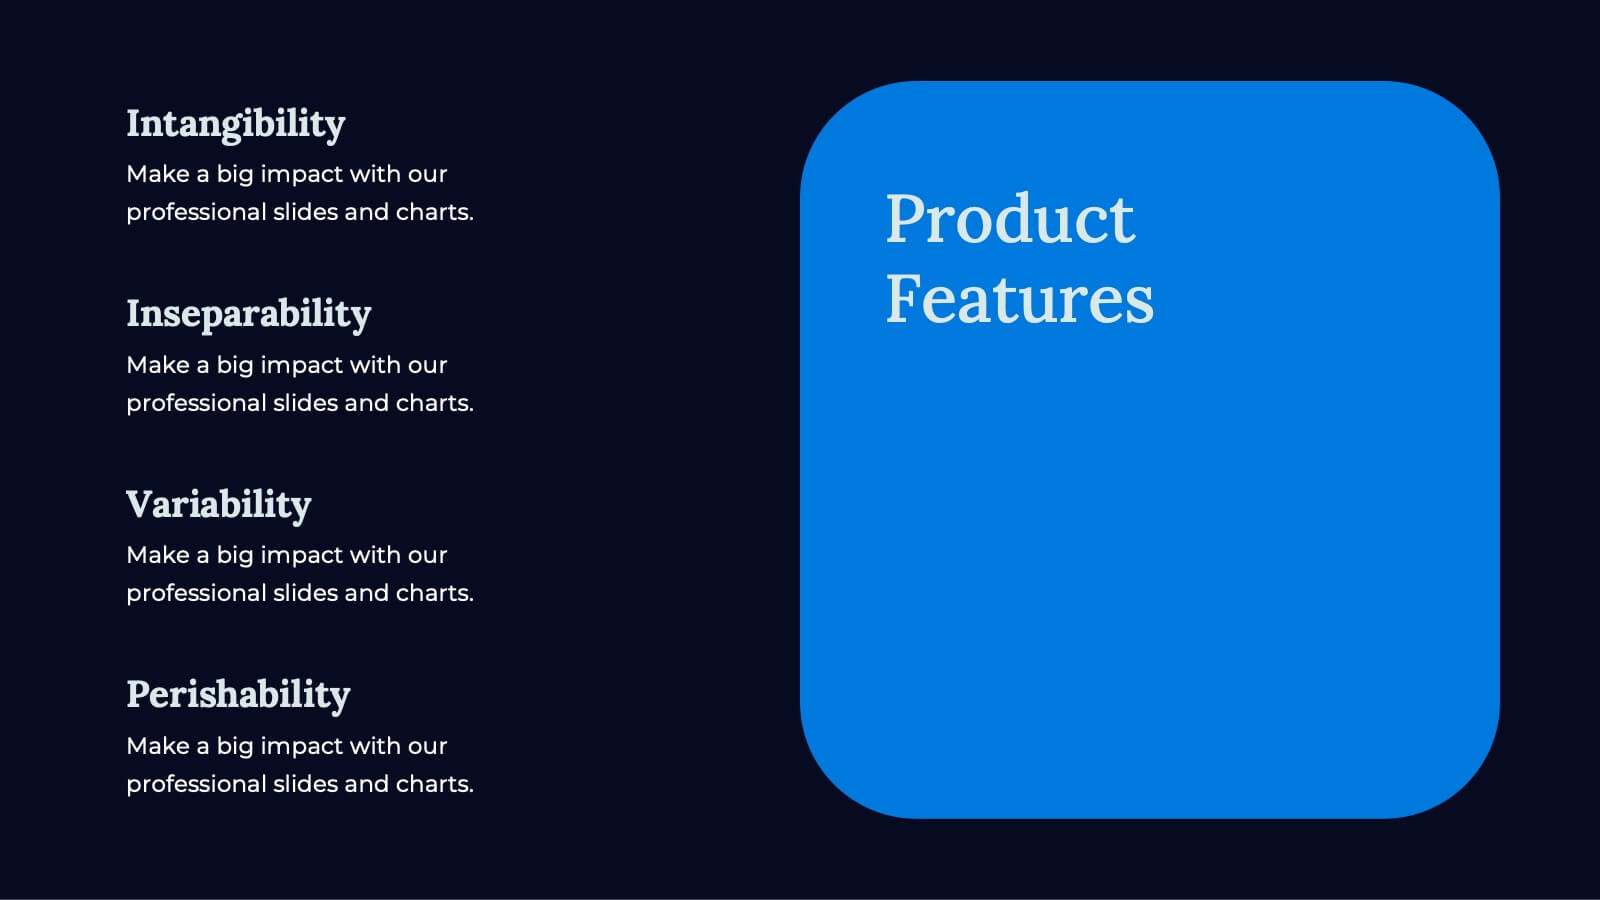
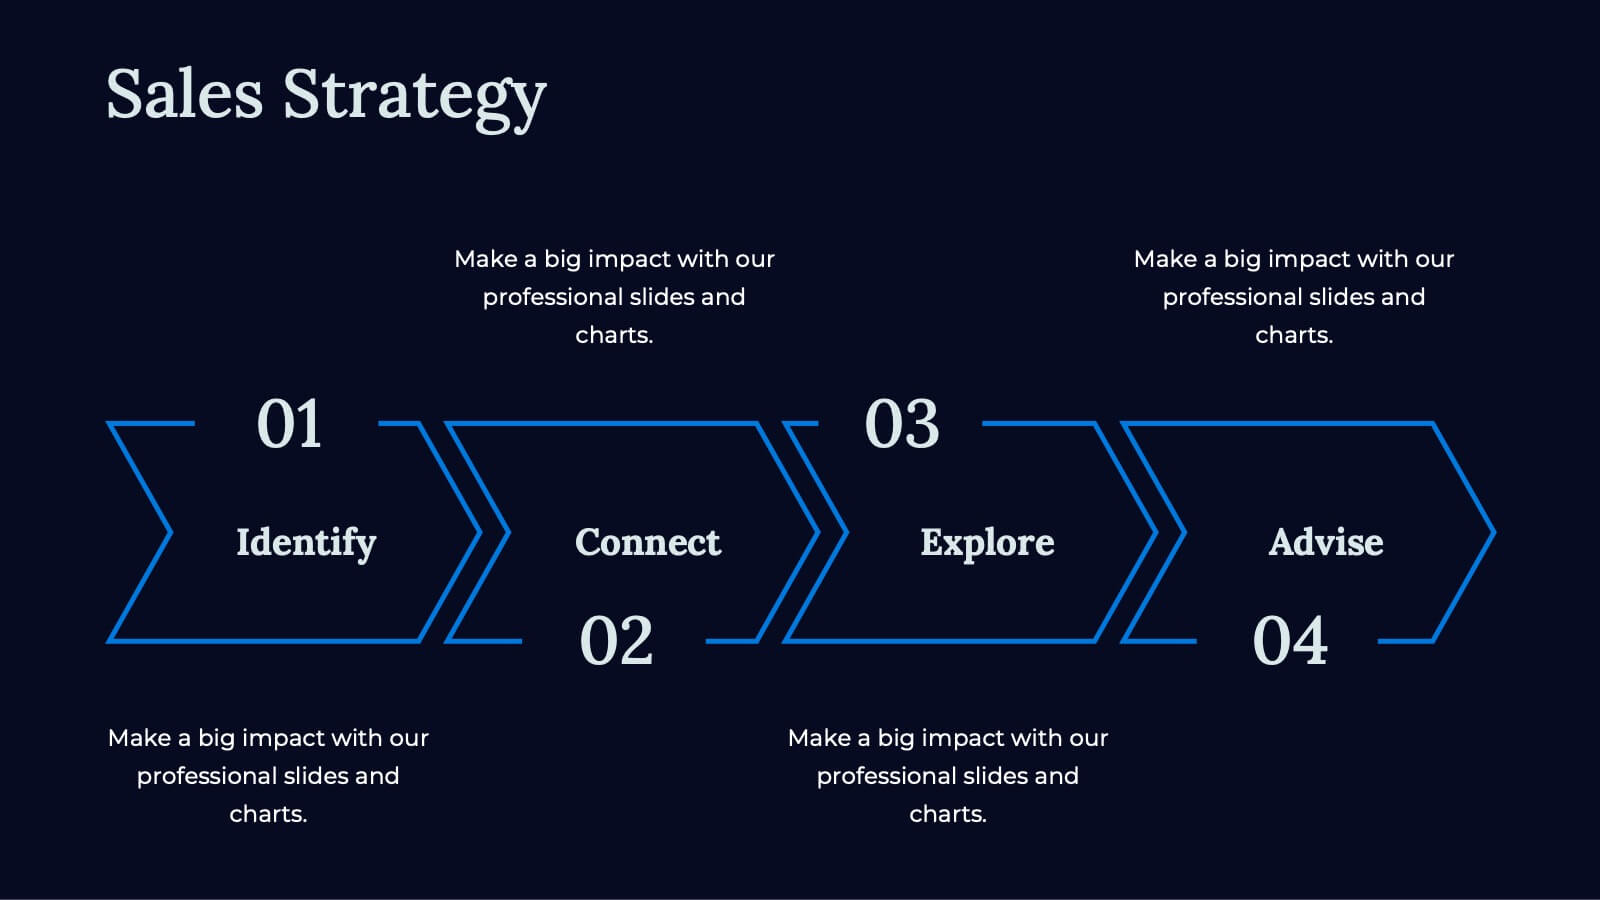
Craft powerful business pitch decks with this sleek template. Present your company overview, problem statement, solutions, and market opportunity. Showcase your business model, revenue model, competitive landscape, and unique selling proposition. Perfect for highlighting financials, growth projections, and funding requirements. Compatible with PowerPoint, Keynote, and Google Slides. Impress investors and stakeholders with clear, concise, and visually appealing presentations.


4 slides
Annual Calendar Layout for Projects
Plan your year like a pro with this clean and colorful visual layout—it’s designed to help you stay focused, organized, and on track month by month. Whether you're mapping out team projects, campaign milestones, or business goals, this annual calendar format makes it easy to see everything at a glance. Fully compatible with PowerPoint, Keynote, and Google Slides.


6 slides
ABC Alphabet Infographic
An "Alphabet Infographic" is a visually engaging way to present the letters of the alphabet along with corresponding words or images that start with each letter. This type of infographic is often used in educational settings to teach young children the alphabet and basic vocabulary. Display the letters of the alphabet in a clear and appealing layout. You can arrange them in rows or columns, using a bold and easily readable font. Use colorful and child-friendly illustrations for the images associated with each letter. This will make the infographic more captivating and engaging for young learners.


5 slides
Social Media Analytics and Metrics Presentation
Track performance across platforms with this sleek analytics dashboard. Visualize paid vs. organic reach, audience engagement, and conversion data in one view. Ideal for reporting social insights to clients or teams. Compatible with PowerPoint, Keynote, and Google Slides—fully editable to fit any social media strategy, campaign review, or content report.


5 slides
Diverse List Infographics
Diverse list refers to a compilation or collection of items that include a wide range of diverse elements. These infographic templates showcases a diverse range of categories and topics in a concise format. The infographic is designed to present information in a visually stimulating way, allowing viewers to easily navigate and understand the diverse list being presented. The infographics organizes the lists into categories or sections, so the viewers can identify and locate specific items of interest. The categories are represented by visually distinct sections and color-coded tabs or icons that provide a cue for each category.


12 slides
Understanding Digital Currencies Presentation
Simplify the complexity of crypto ecosystems with the Understanding Digital Currencies presentation template. Designed around a wallet-style visual, this layout highlights key features of various cryptocurrencies using six labeled touchpoints. Perfect for introducing Bitcoin, Ethereum, altcoins, and digital wallets in educational, financial, or blockchain-related presentations. Ideal for crypto educators, fintech startups, and investment analysts. Compatible with PowerPoint, Keynote, and Google Slides.


7 slides
Editable List Slide Presentation
Organize your ideas with style and simplicity using this clean, structured layout designed for clarity and impact. Ideal for summarizing key points, checklists, or action plans, it keeps your content professional and easy to follow. Fully customizable and compatible with PowerPoint, Keynote, and Google Slides for seamless presentation design.


26 slides
Cutting-Edge AI Breakthroughs Presentation
Step into the future with this exciting presentation on cutting-edge AI breakthroughs. Covering advancements in machine learning, automation, ethical AI, and real-world applications, this template helps you present complex innovations with clarity and impact. Fully customizable and compatible with PowerPoint, Keynote, and Google Slides for a seamless and engaging presentation experience.