


Features
- 4 Unique Slides
- Fully editable and easy to edit in Microsoft Powerpoint, Keynote and Google Slides
- 16:9 widescreen layout
- Clean and professional designs
- Export to JPG, PDF or send by email


Do you have any questions?
Recommend


8 slides
Organizational Hierarchy Tree Diagram Presentation
Streamline Your Organization! The Organizational Hierarchy Tree Diagram Presentation visualizes team structures, reporting relationships, and company workflows. Ideal for corporate presentations, HR planning, and decision-making, it features editable elements for seamless customization. Compatible with PowerPoint, Keynote, and Google Slides, ensuring professional clarity and impact in any business setting.


21 slides
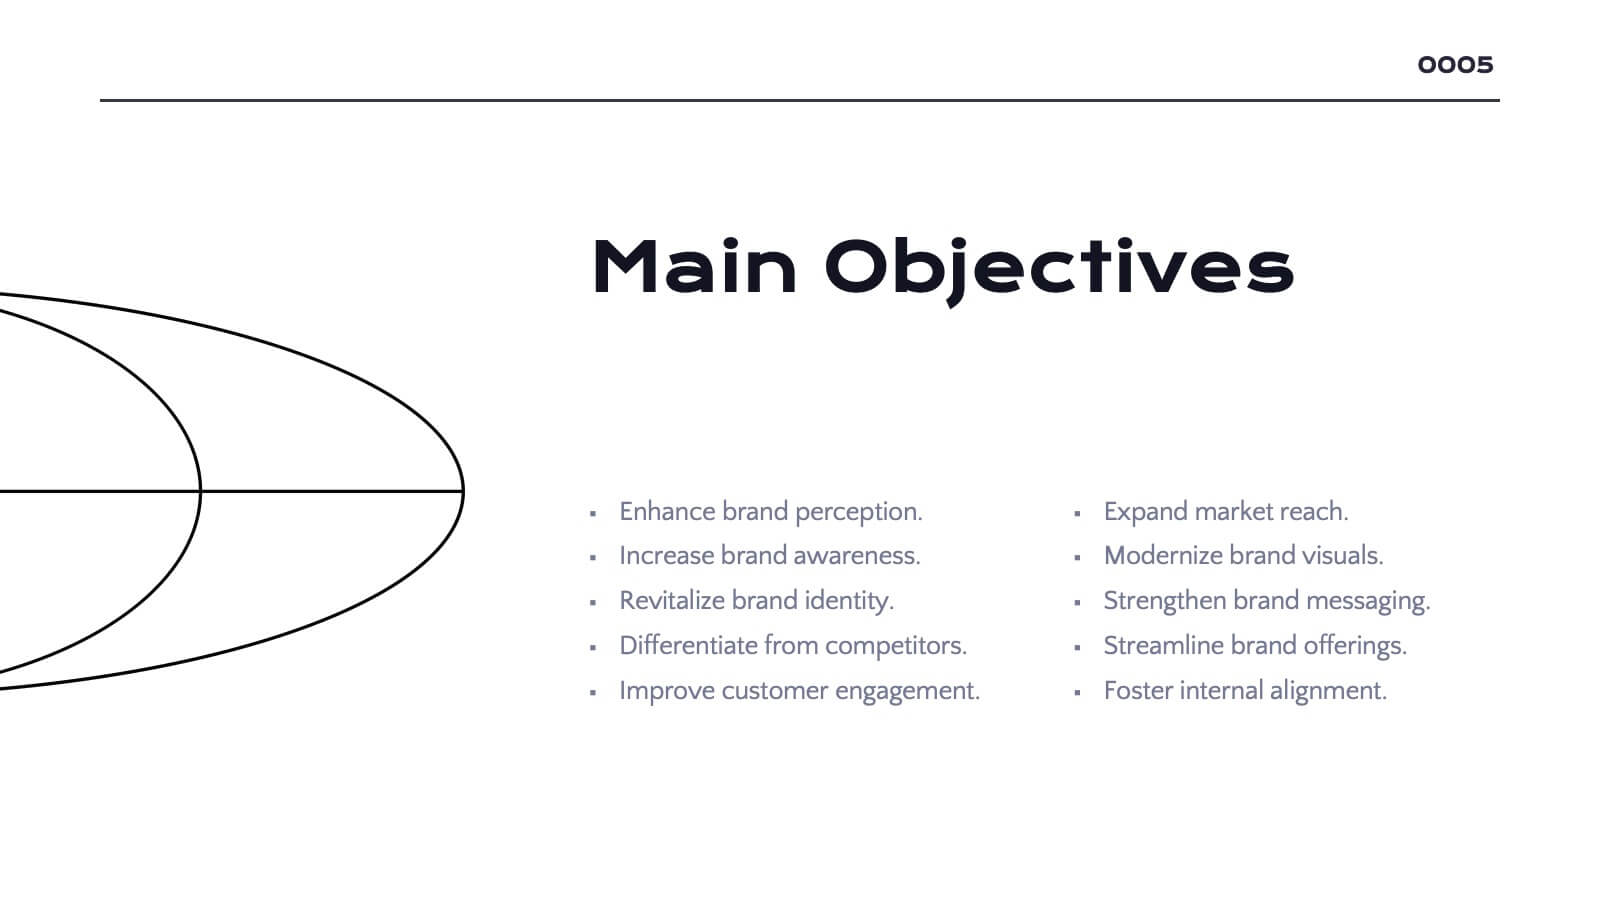
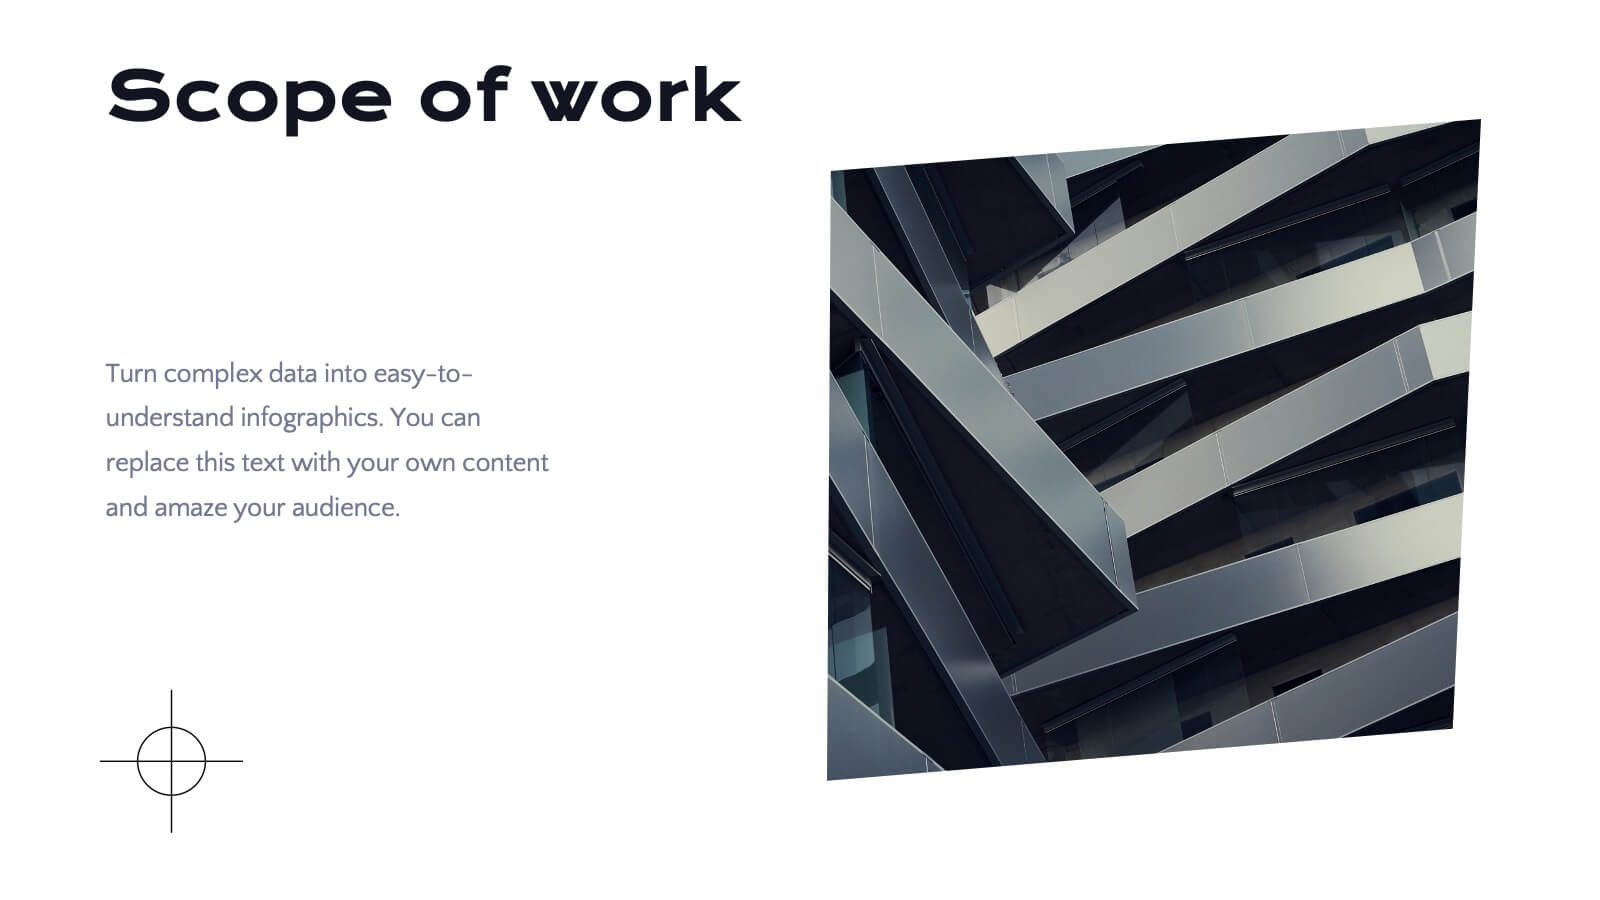
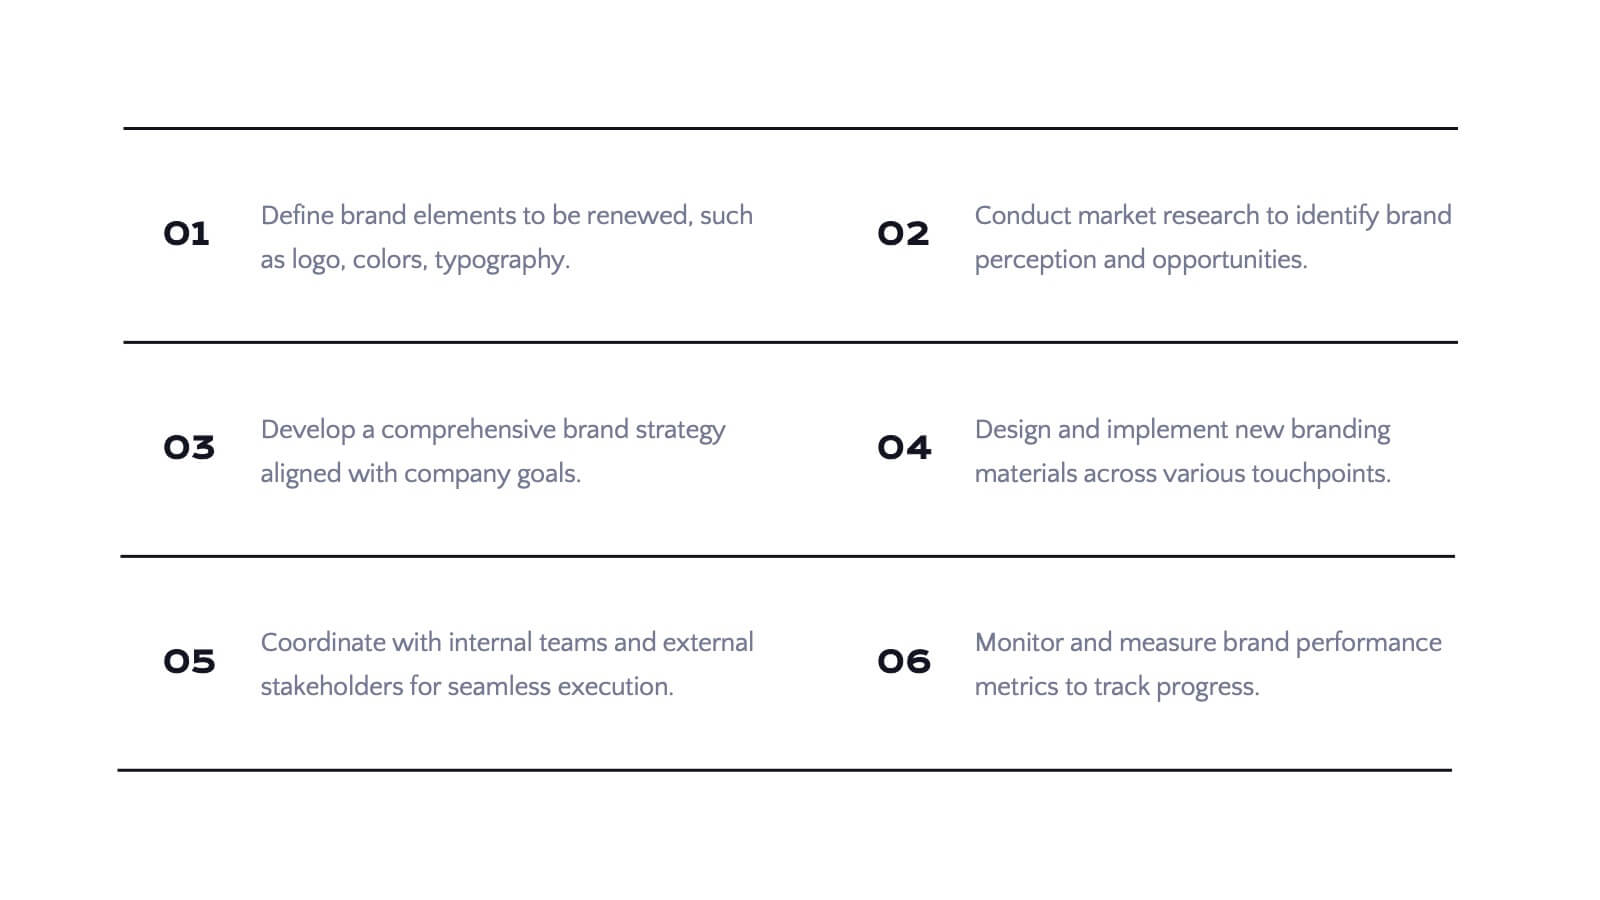
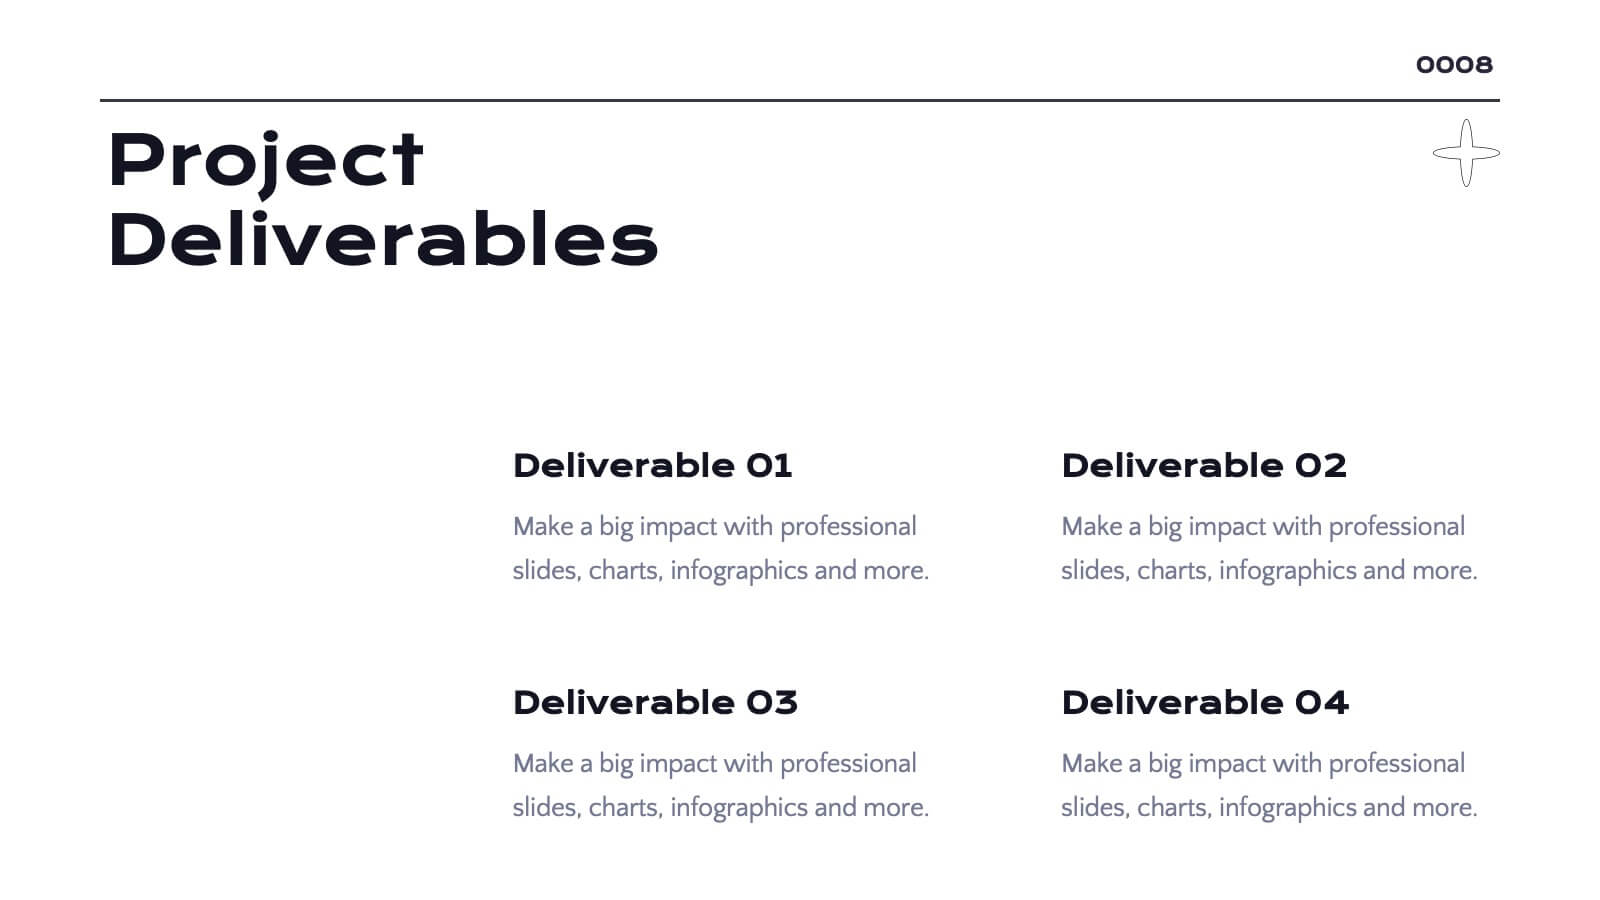
Flamelore Agile Project Plan Presentation
Organize and deliver your Agile Project Plan seamlessly with this dynamic presentation template. Designed to align with Agile principles, it features a comprehensive structure covering objectives, scope of work, and key deliverables. The template helps you outline a detailed project timeline and budget breakdown to keep stakeholders informed. Illustrate complex information with visual aids such as pyramids, charts, and process diagrams, making data interpretation effortless. Highlight team members, their roles, and responsibilities to foster transparency and accountability. With slides dedicated to risk assessment and evaluation criteria, you can confidently navigate potential challenges. This fully editable template works across PowerPoint, Google Slides, and Keynote, providing flexibility and a polished design for project managers, teams, and business professionals. Whether you're pitching to stakeholders or aligning your team, this Agile framework ensures clear communication and actionable steps.


4 slides
Property Investment Pitch Deck Presentation
Impress investors with a sleek and confident presentation designed to highlight property opportunities and market growth. This professional layout helps you showcase financial insights, projections, and investment strategies with clarity and style. Fully customizable and compatible with PowerPoint, Keynote, and Google Slides for effortless editing and impactful delivery.


5 slides
Capital Allocation Strategy Overview
Break down your financial strategy visually with the Capital Allocation Strategy Overview Presentation. This semi-circle diagram helps you present four key spending or investment categories clearly and professionally. Ideal for budget planning, operational expenses, or strategic financial decisions. Fully editable in PowerPoint, Keynote, and Google Slides.


2 slides
Creative Title Slide Presentation
Bring your audience in with a burst of personality using this bold, playful cover-style presentation slide. Designed to spotlight a creative message, it uses vibrant shapes and striking color to set an energetic tone while keeping your title front-and-center. Fully compatible with PowerPoint, Keynote, and Google Slides.


5 slides
Digital Strategy and Online Campaigns Presentation
Aim for success with the Digital Strategy and Online Campaigns Presentation. This template uses a dynamic target and arrow graphic to represent strategic goals, campaign directions, and marketing focus. Ideal for showcasing KPIs, digital initiatives, and performance insights. Fully customizable in PowerPoint, Keynote, and Google Slides.


7 slides
Enforcement Law Infographic Presentation
A Law Enforcement Infographic is a visual representation of key concepts, statistics, and procedures related to law enforcement. This template can be used to provide an overview of various aspects of law enforcement, such as crime rates, policing strategies, and legal procedures. This infographic includes a variety of icons, illustrations, and other design elements law themed to enhance the visual appeal and make it more appealing for your viewers. This template is compatible with Powerpoint, Keynote and Google Slides making it easy to customize and edit with your own text and information.


6 slides
IT Security Policy Presentation
A bold, clean layout brings your message to life with clarity and confidence. This presentation helps you outline essential guidelines, communicate security expectations, and explain key protective measures in a way your audience can easily follow. Designed for professionalism and simplicity, it works seamlessly in PowerPoint, Keynote, and Google Slides.


6 slides
Mission Goals Infographic
These professionally designed slide templates are tailored to help you articulate your organization's mission goals with clarity and impact. Each slide is structured to emphasize the strategic objectives that guide your operations, making them ideal for communicating with stakeholders, teams, and external partners. Featuring a variety of layouts that include real-life imagery and concise text areas, these templates not only convey your goals but also illustrate the values that underpin your mission. They are perfect for enhancing corporate presentations, annual meetings, or internal strategy discussions, providing a visual and textual guide to what drives your organization forward. Customizable for various communication needs, these templates can be adapted to highlight specific mission goals or to align with different thematic elements of your presentations. They are an essential tool for organizations aiming to foster a unified understanding of their mission and to inspire alignment and action among all stakeholders.


7 slides
Service Finance Infographic
Service finance refers to the management of financial resources, transactions, and strategies within the service industry. This infographic template ensures that the services provided are financially sustainable, meet customer needs, and contribute to the overall growth and success of the organization. Fully customizable and compatible with Powerpoint, Keynote, and Google Slides. Showcase the dynamics that drive the financial world, uncovering the core elements of the ecosystem. This infographic will encourage action and invite your audience to embrace a financial renaissance, soaring towards their prosperous future.


10 slides
Financial Growth Planning
Visualize your path to financial success with this puzzle-themed Financial Growth Planning template. Each step connects seamlessly to outline investment goals, budgeting strategies, or revenue milestones. Designed for clarity and impact, it's fully editable in PowerPoint, Keynote, and Google Slides for effortless customization.


21 slides
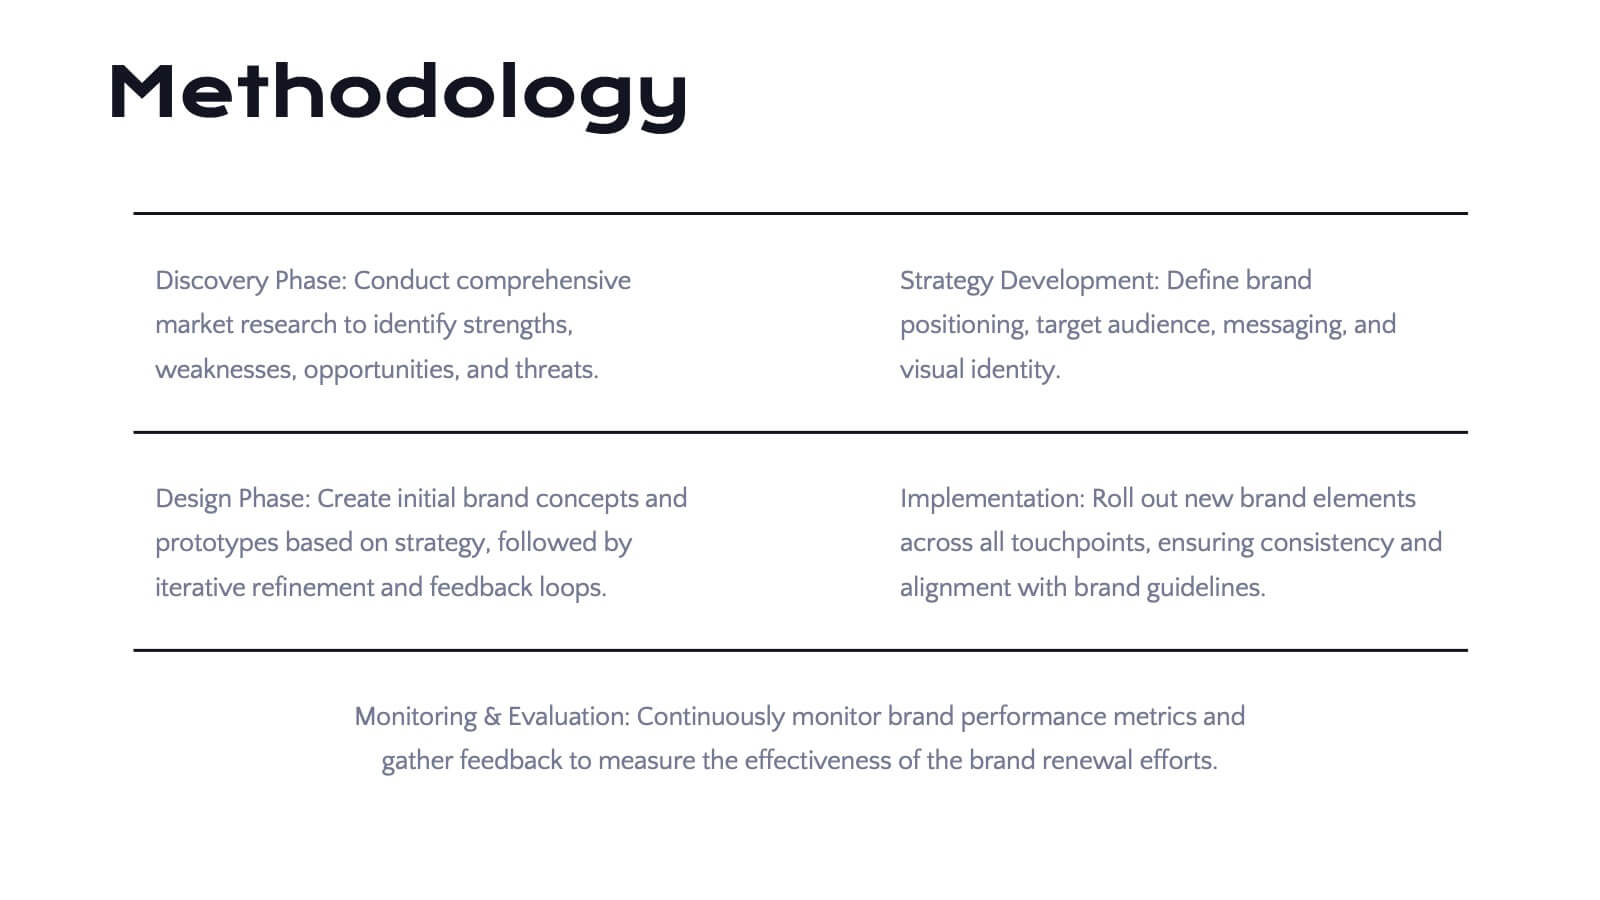
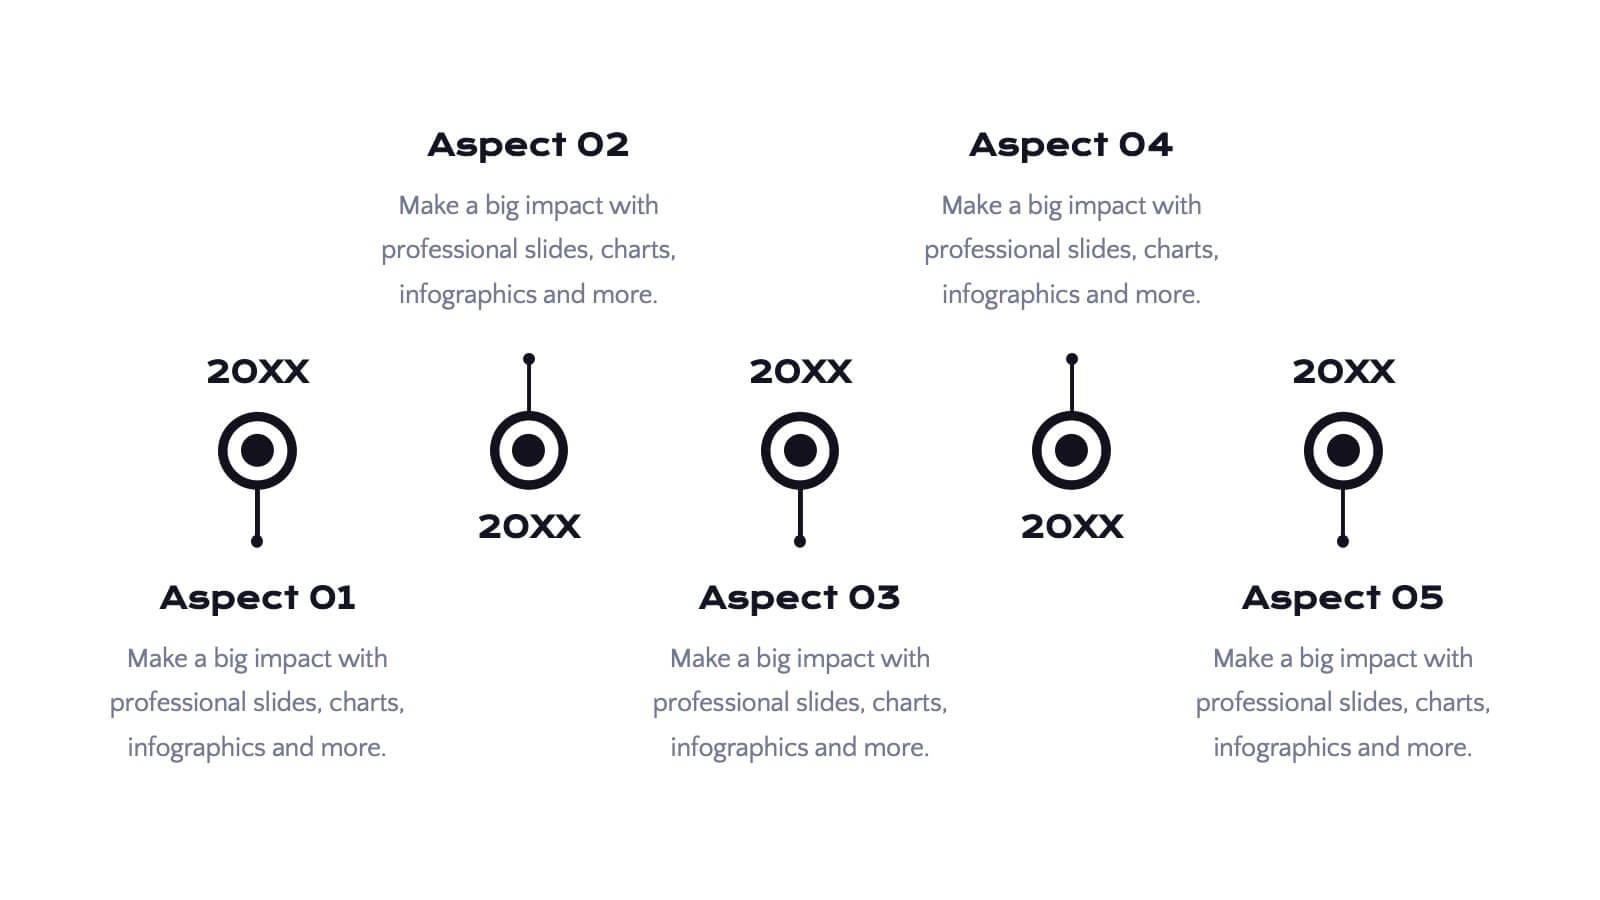
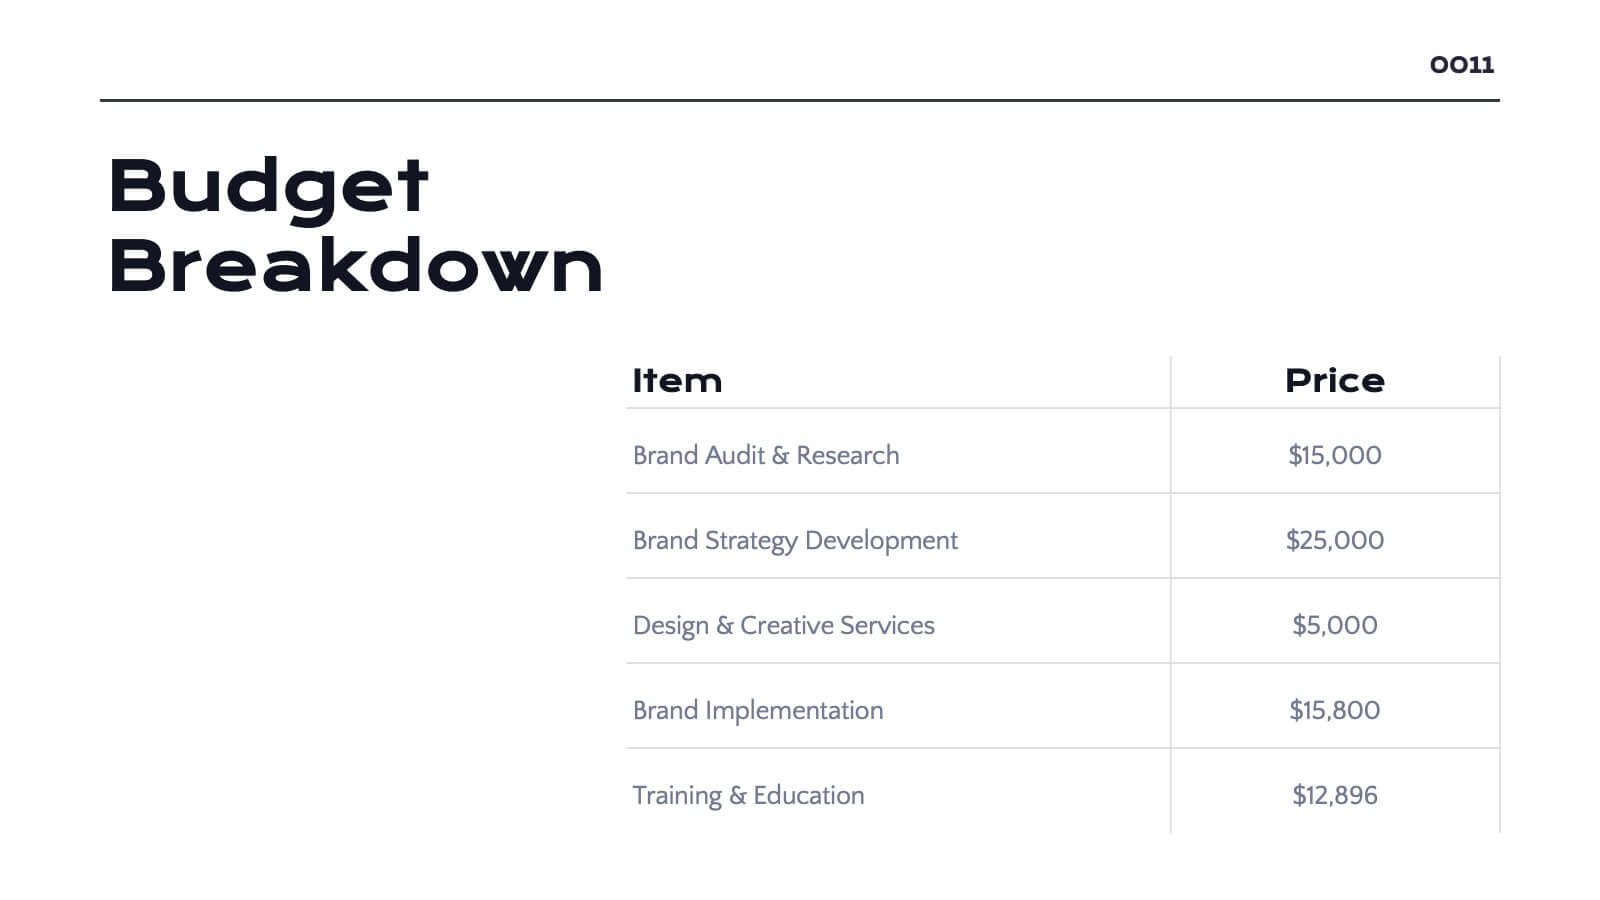
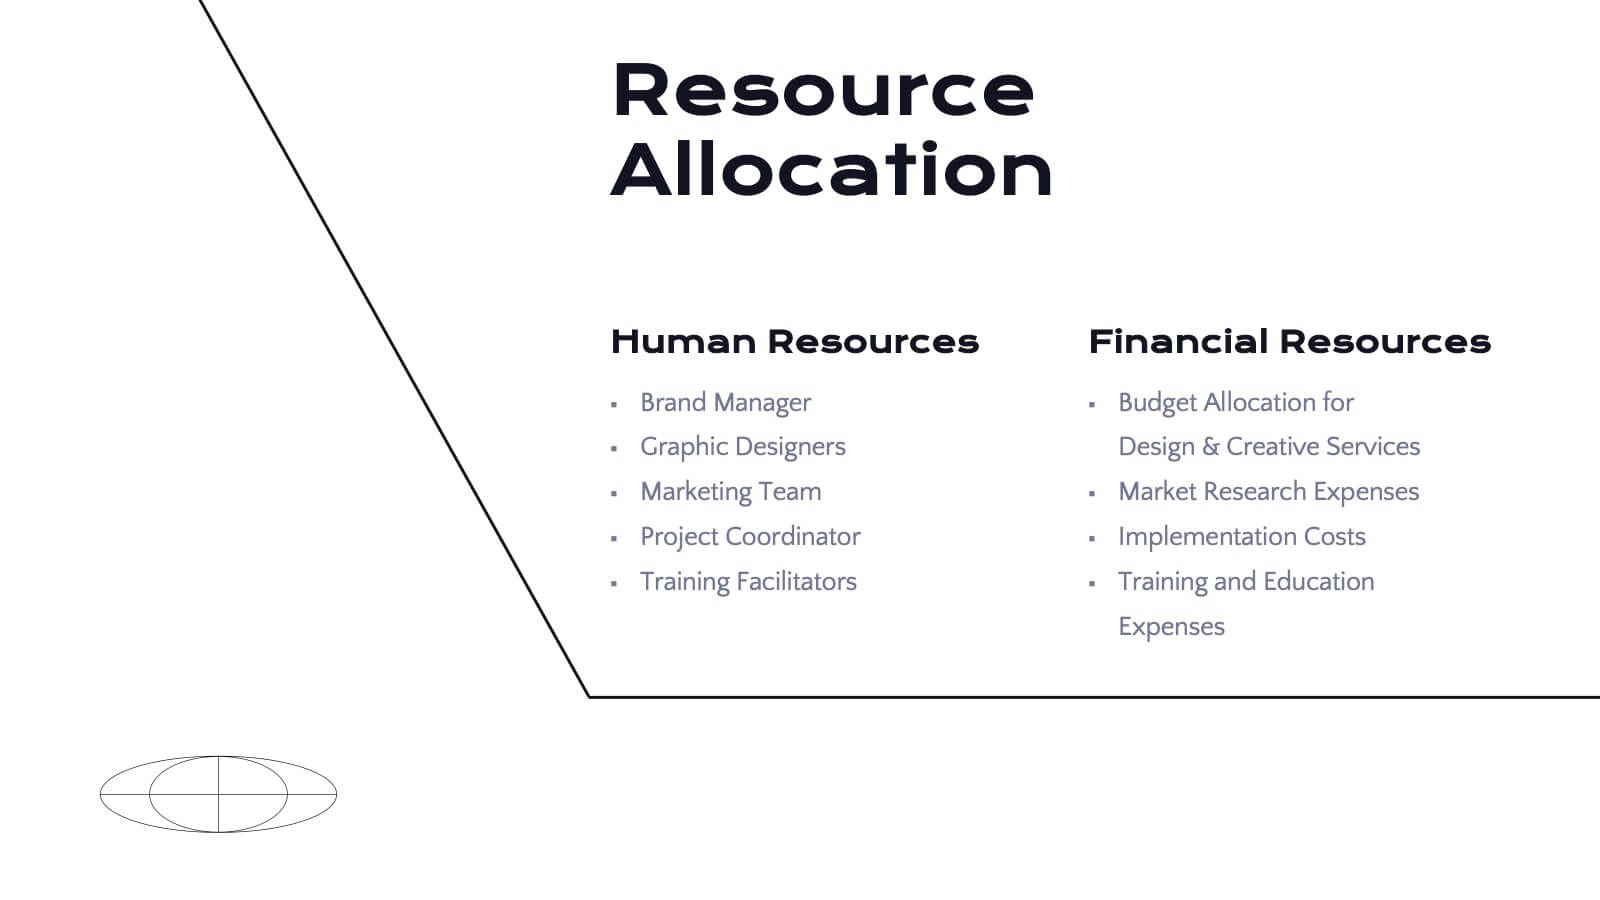
Radiance Detailed Project Execution Plan Presentation
Elevate your project execution presentations with this sleek template, covering everything from objectives to timelines and budget breakdowns. It's perfect for aligning your team and stakeholders. Compatible with PowerPoint, Keynote, and Google Slides, it ensures professionalism and clarity in showcasing your project plans.


6 slides
Green Business Practice Implementation Presentation
Showcase your sustainability strategy with this Green Business Practice Implementation Presentation. Featuring a segmented lightbulb diagram, this slide is ideal for outlining eco-friendly initiatives, sustainable development goals, or ESG compliance efforts. Perfect for corporate sustainability reports or green business planning. Fully compatible with PowerPoint, Keynote, and Google Slides.


5 slides
Renewable Energy Sector Infographics
Illuminate your audience's knowledge with our renewable energy sector infographics. Radiating with vibrant shades of orange, yellow, and blue, this creative, vertical template breathes life into data and trends in the clean energy realm. Compatible with Powerpoint, Keynote, and Google Slides. Whether you're an environmental advocate or an academic researcher, these infographics, embellished with relevant graphics and icons, serve as a catalyst for enlightening discussions. From solar power breakthroughs to wind energy statistics, these visual aids are geared to power impactful presentations and reports in the renewable energy sector.


8 slides
Corporate Office Scenes Illustrations Presentation
Bring workplace communication to life with this slide featuring an illustrated office meeting scene and a four-point list layout. Each segment is color-coded with accompanying icons, making it ideal for presenting corporate strategies, team roles, or process workflows. Designed for clarity and visual appeal, this slide is perfect for business reports, training decks, or client briefings. Easily customizable in PowerPoint, Keynote, and Google Slides.


7 slides
Target Audience Demographics Slide Presentation
Capture attention with a clean, data-driven layout that makes understanding your audience quick and intuitive. This presentation helps you showcase key demographic insights, highlight behavioral patterns, and communicate strategic findings with clarity. Designed for easy editing and smooth workflow, it’s fully compatible with PowerPoint, Keynote, and Google Slides.


5 slides
Investor-Ready Business Pitch Plan Presentation
Make your business roadmap stand out with this dynamic visual journey, perfect for impressing investors from the first slide. This infographic-style pitch deck helps clearly outline your business strategy across five milestones, using vibrant colors and icons for easy comprehension. Fully compatible with PowerPoint, Keynote, and Google Slides.