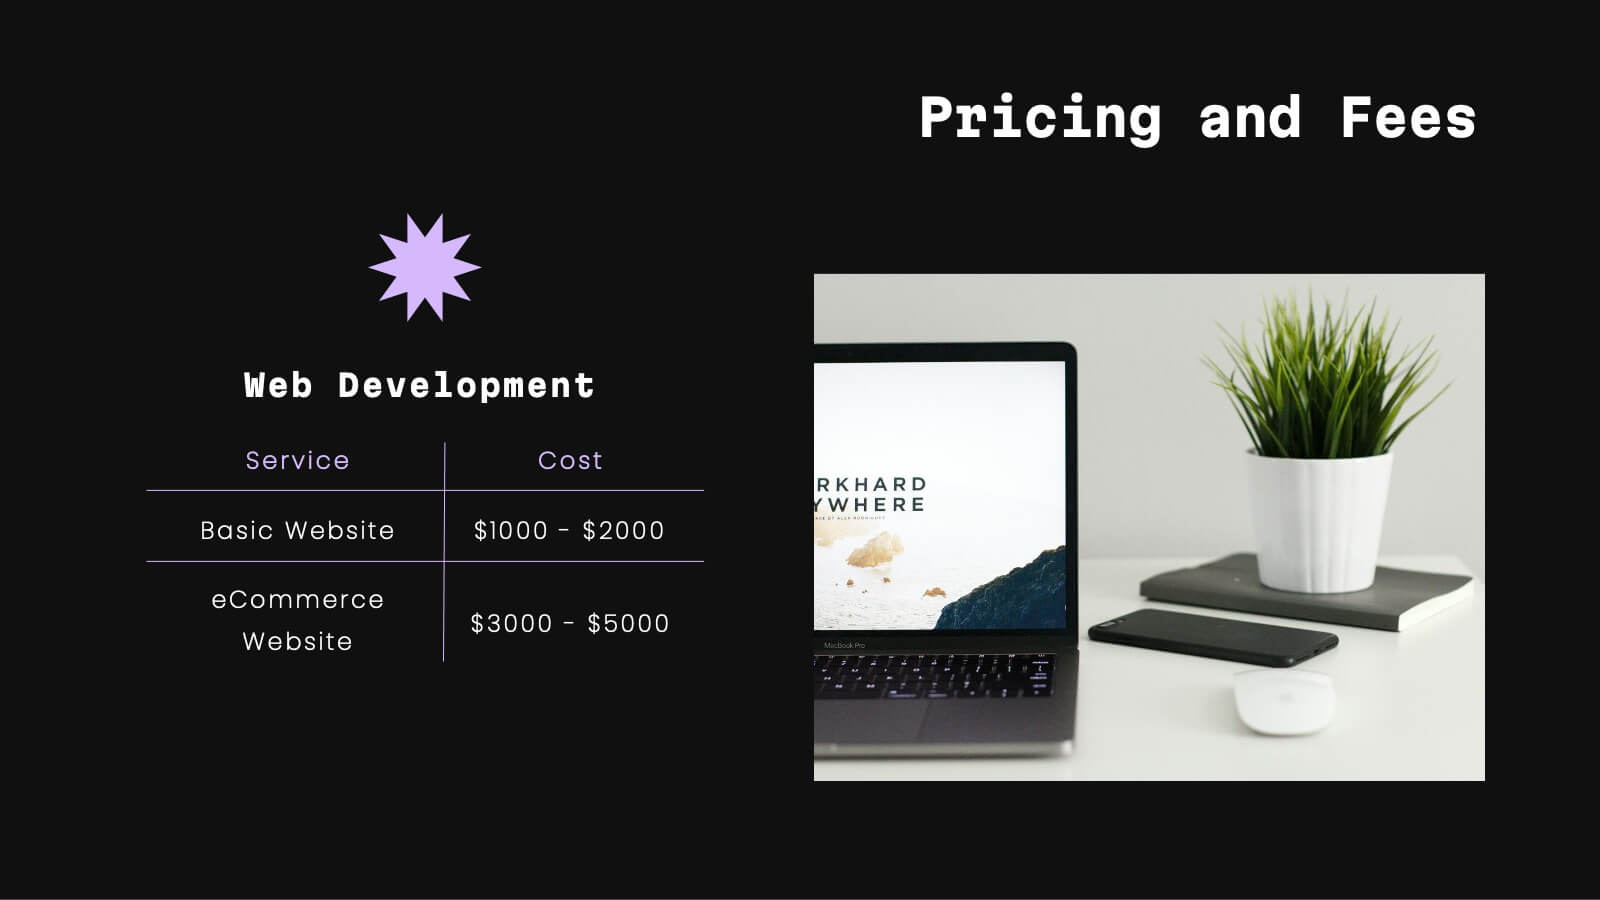
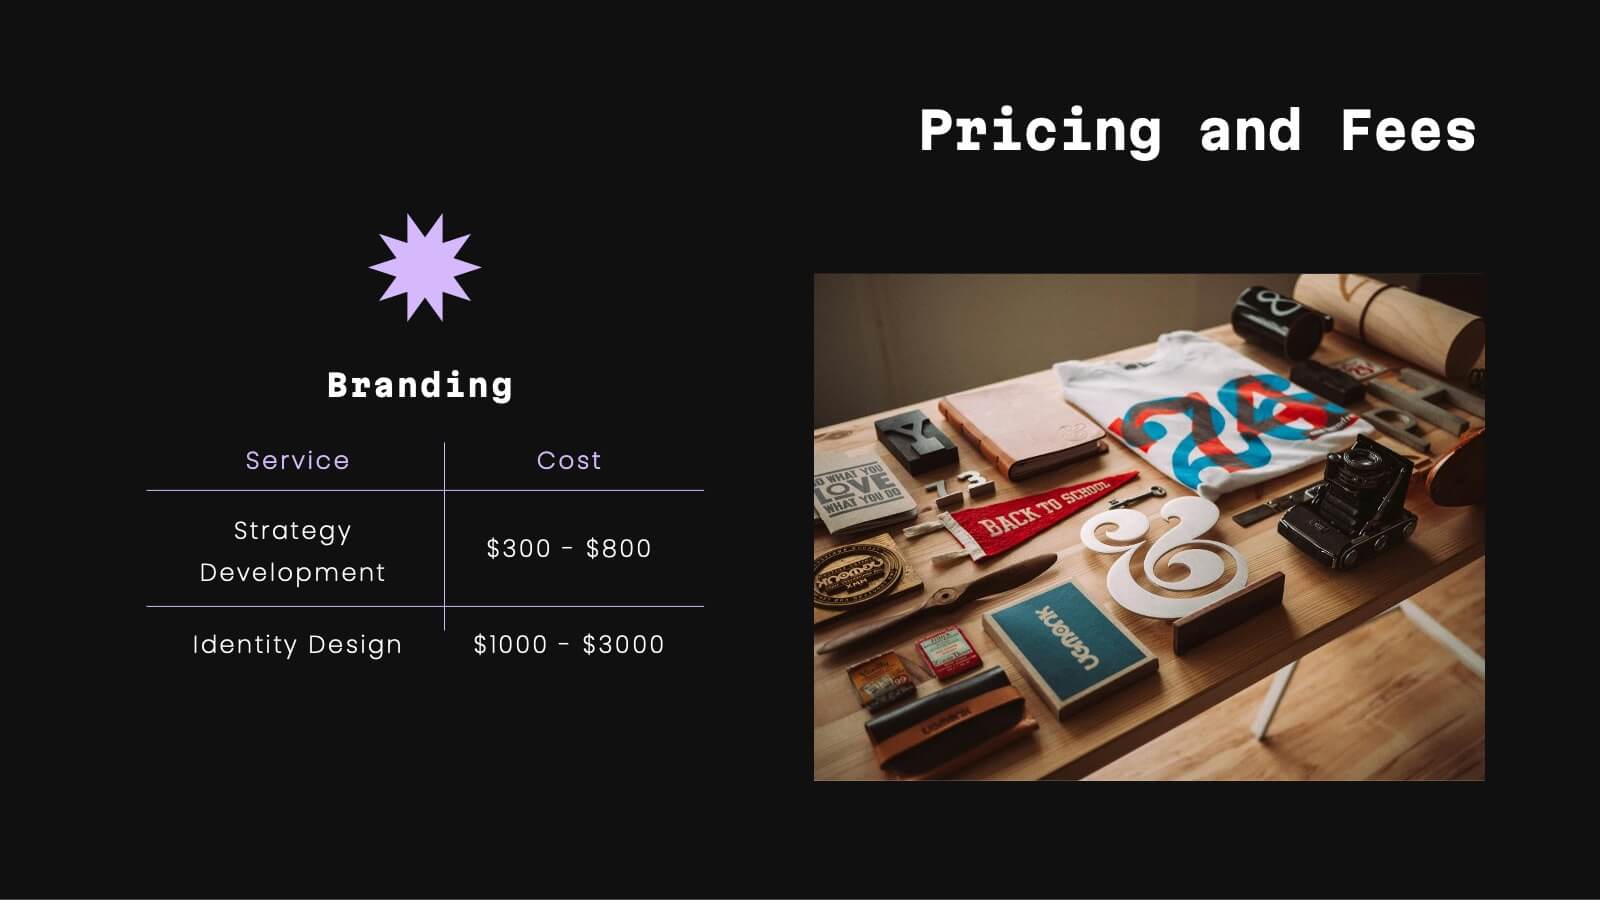
Resource Mapping in African Regions Presentation
PowerPoint Template and Google Slides Theme
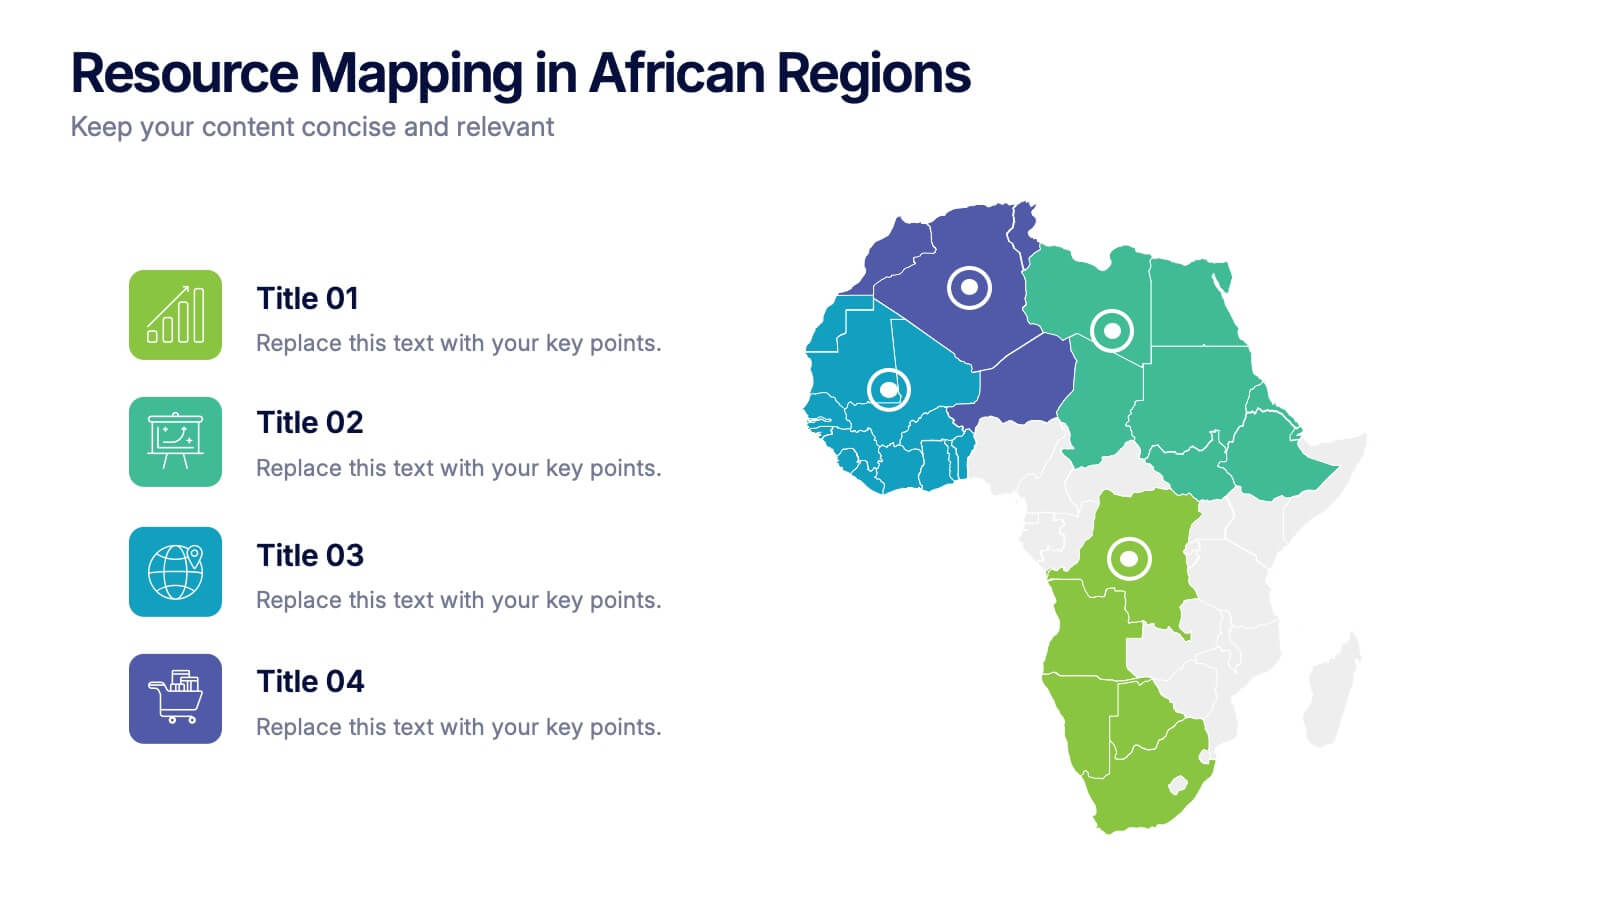
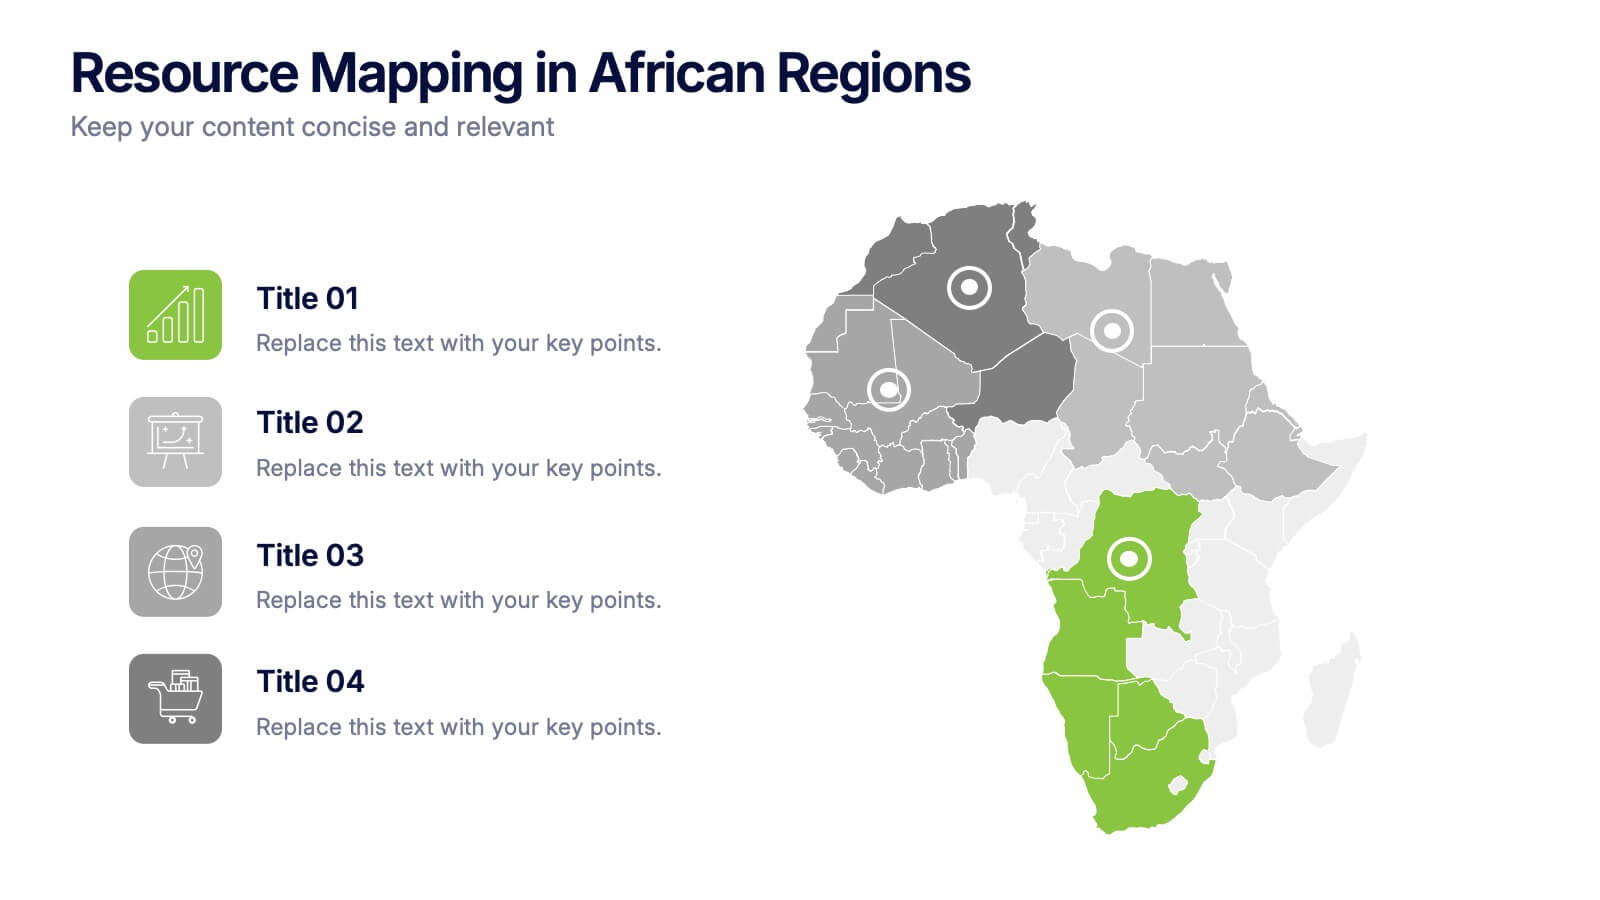
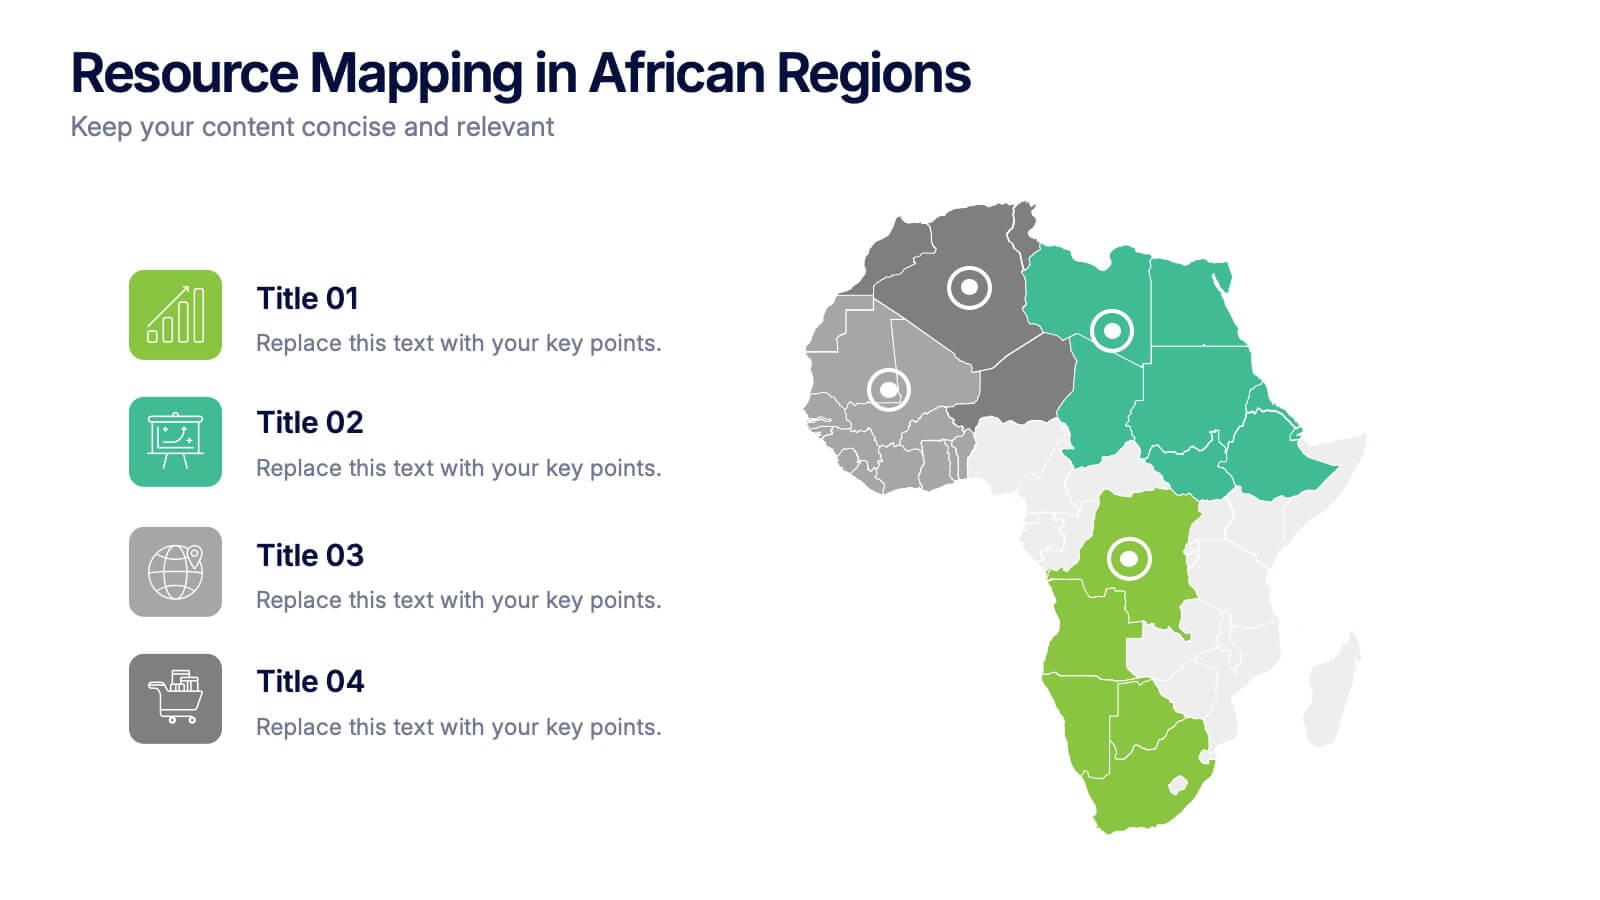
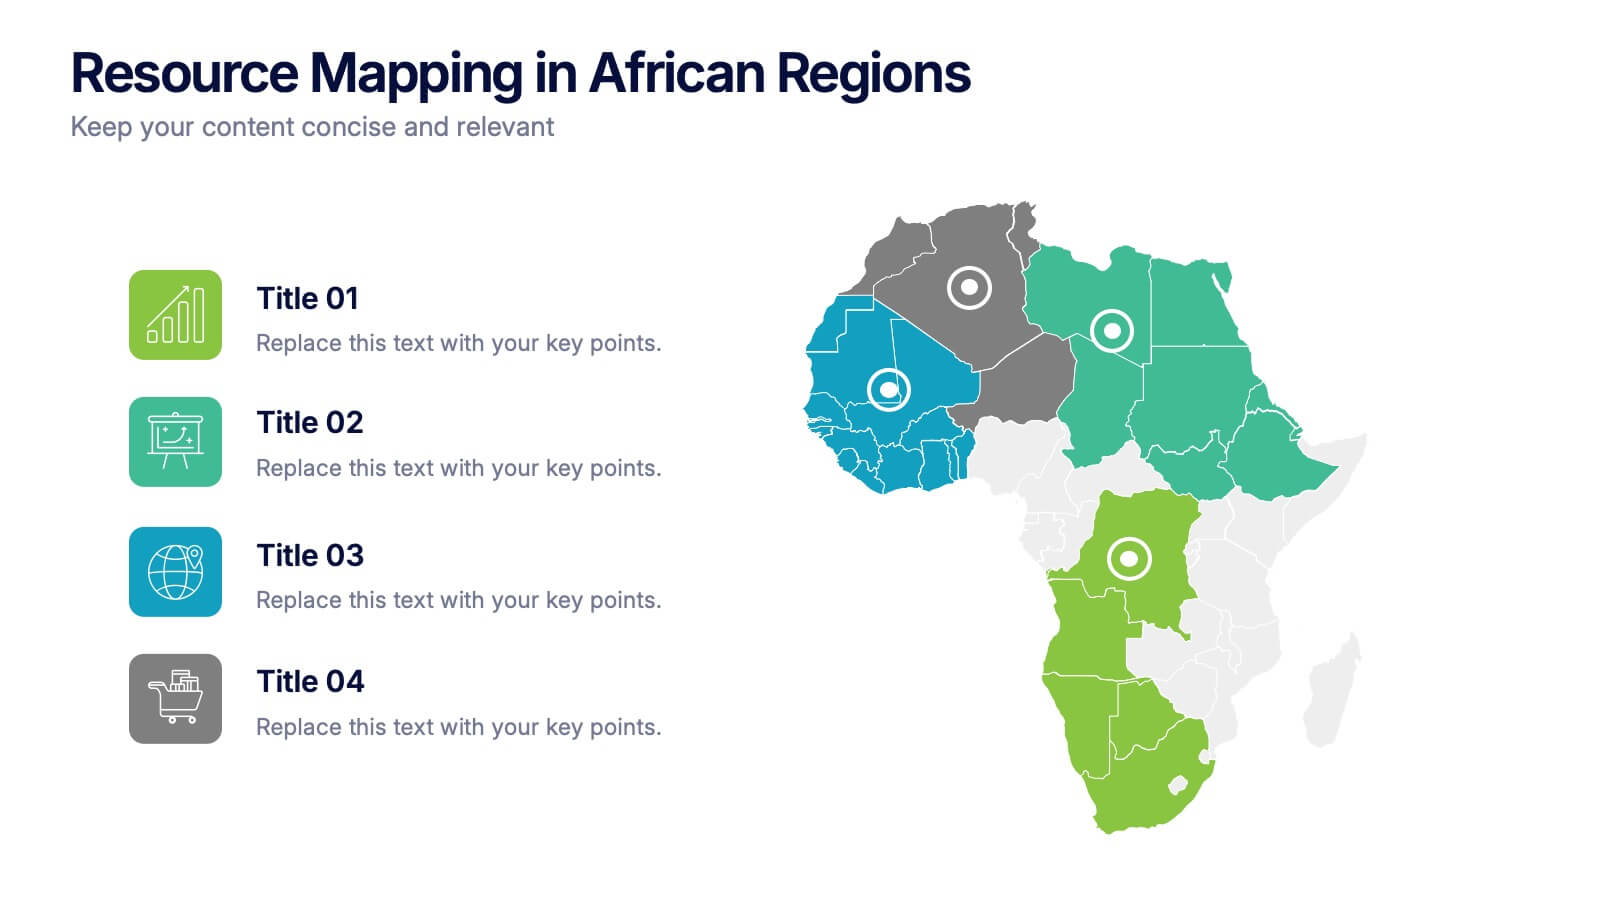
Features
- 4 Unique slides
- Fully editable and easy to edit in Microsoft Powerpoint, Keynote and Google Slides
- 16:9 widescreen layout
- Clean and professional designs
- Export to JPG, PDF or send by email
- Remove from favorites
Powerpoint Template
1 MB
Google Slides Template
External link
Keynote Template
2 MB
Recommend
- Remove from favorites
Powerpoint Template
1 MB
Google Slides Template
External link
Keynote Template
1 MB
5 slides
RAPID Decision-Making Model Presentation
The RAPID Decision-Making Model template simplifies complex decision processes, laying out steps from recommending to deciding in an easily digestible format. It's ideal for team leaders and managers who want to streamline decision-making. The template is designed for seamless use across PowerPoint, Keynote, and Google Slides, ensuring broad compatibility and user-friendly presentations.
- Remove from favorites
Powerpoint Template
1 MB
Google Slides Template
External link
Keynote Template
1 MB
4 slides
Patient Care Plan and Metrics Presentation
Turn healthcare data into meaningful stories with this modern and professional presentation. Perfect for highlighting patient progress, clinical outcomes, and care efficiency, it balances visuals and data for clarity and impact. Easy to edit and fully compatible with PowerPoint, Keynote, and Google Slides for smooth customization.
- Remove from favorites
Powerpoint Template
1 MB
Google Slides Template
External link
Keynote Template
1 MB
6 slides
Six-Sided Strategy with Hexagon Infographic Presentation
Present your six-point plan with clarity using the Six-Sided Strategy with Hexagon Infographic Presentation. This geometric layout highlights each core element in a balanced, easy-to-follow format—ideal for frameworks, business models, or strategy steps. Fully customizable in Canva, PowerPoint, Keynote, and Google Slides for seamless integration.
- Remove from favorites
Powerpoint Template
1 MB
Google Slides Template
External link
Keynote Template
1 MB
5 slides
Innovation in Digital Technologies Presentation
Highlight key advancements with this Innovation in Digital Technologies Presentation. Designed with four modern icon segments, this slide helps communicate your digital transformation journey clearly. Ideal for showcasing emerging tools, platforms, or strategies. Fully editable in Canva, PowerPoint, or Google Slides for seamless integration into any tech-focused presentation.
- Remove from favorites
Powerpoint Template
1 MB
Google Slides Template
External link
Keynote Template
1 MB
6 slides
Social Comparison Infographics
The "Social Comparison" infographic template is a thought-provoking and detailed tool, expertly crafted for PowerPoint, Keynote, and Google Slides. This template is particularly useful for psychologists, sociologists, and educators who wish to explore and present the concept of social comparison, its impacts on individual behavior, and its role in society. This template delves into the various dimensions of social comparison, including upward and downward comparisons, the influence on self-esteem, and the effects on social cohesion. It's structured to provide a nuanced understanding of how individuals assess themselves relative to others, making it a valuable resource for educational seminars, psychological workshops, or social research presentations. The design is both engaging and reflective, with a color scheme that is subtle yet impactful. This ensures the presentation is not only visually appealing but also resonates with the complex and multifaceted nature of social comparison. Whether used in academic settings, counseling sessions, or social research meetings, this template ensures that the intricacies of "Social Comparison" are presented in a clear, insightful, and visually compelling manner.
- Remove from favorites
Powerpoint Template
2 MB
Google Slides Template
External link
Keynote Template
3 MB
22 slides
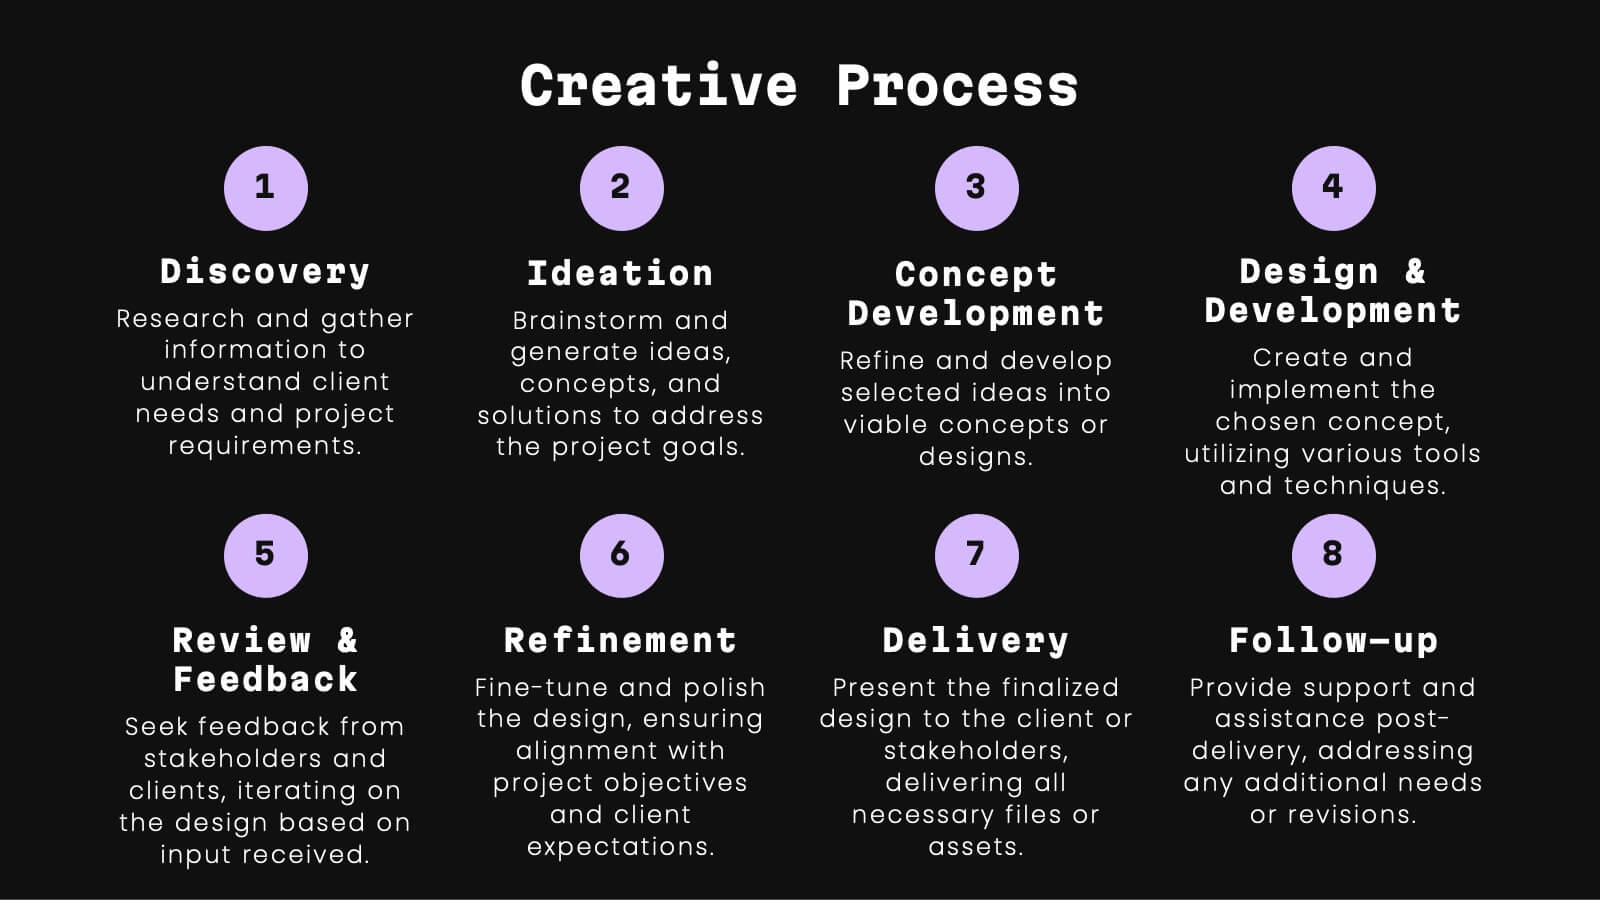
Celeste Professional Portfolio Showcase Presentation
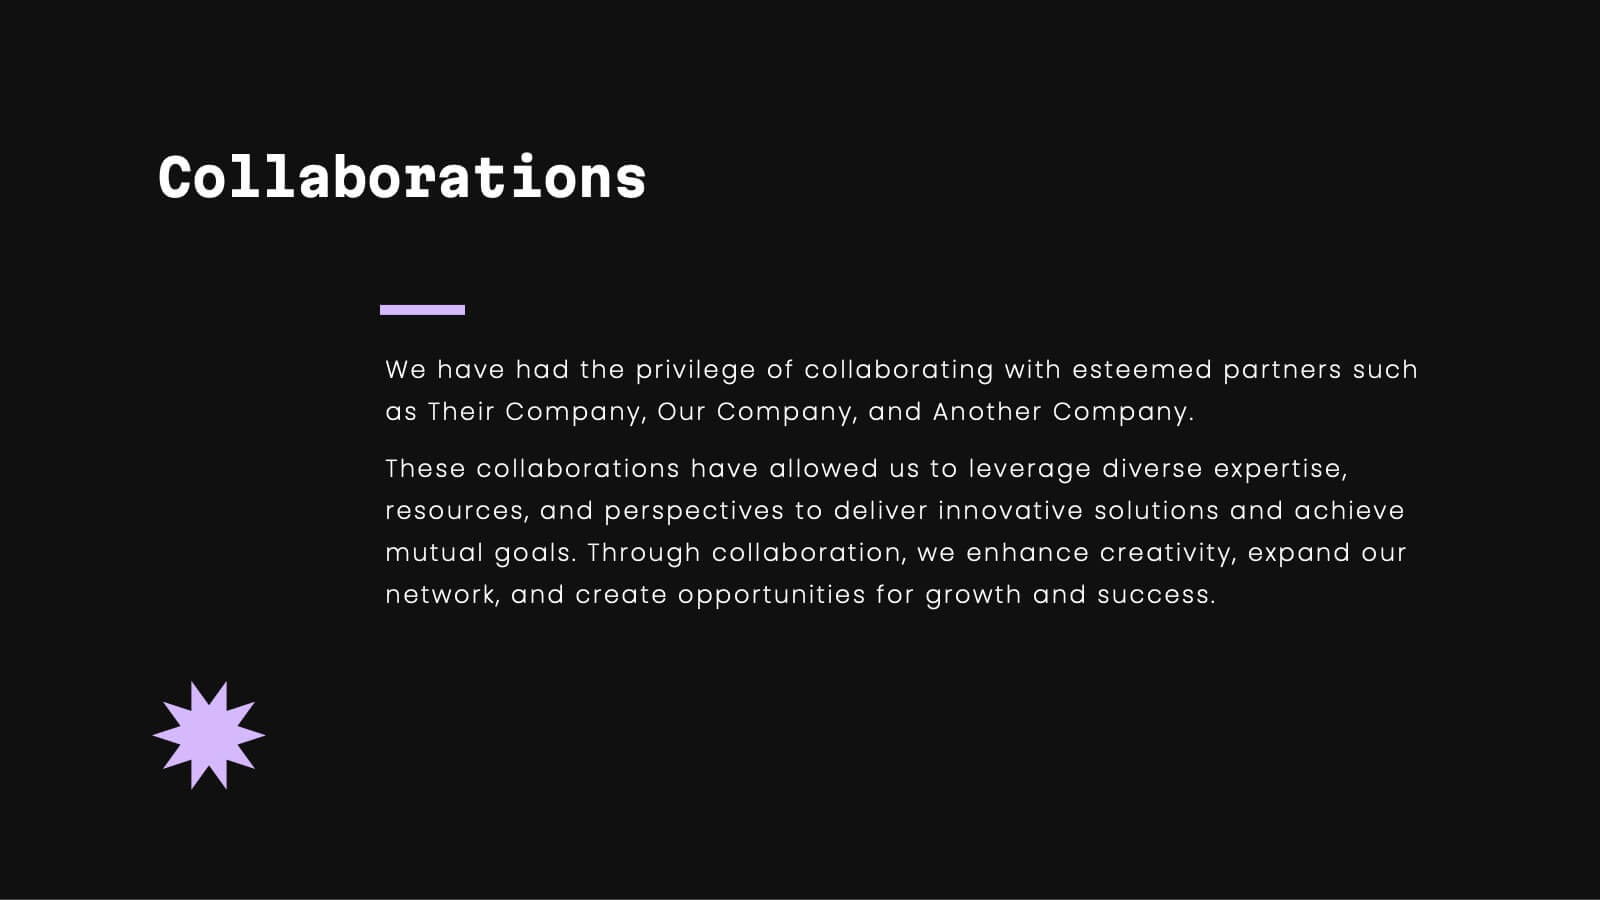
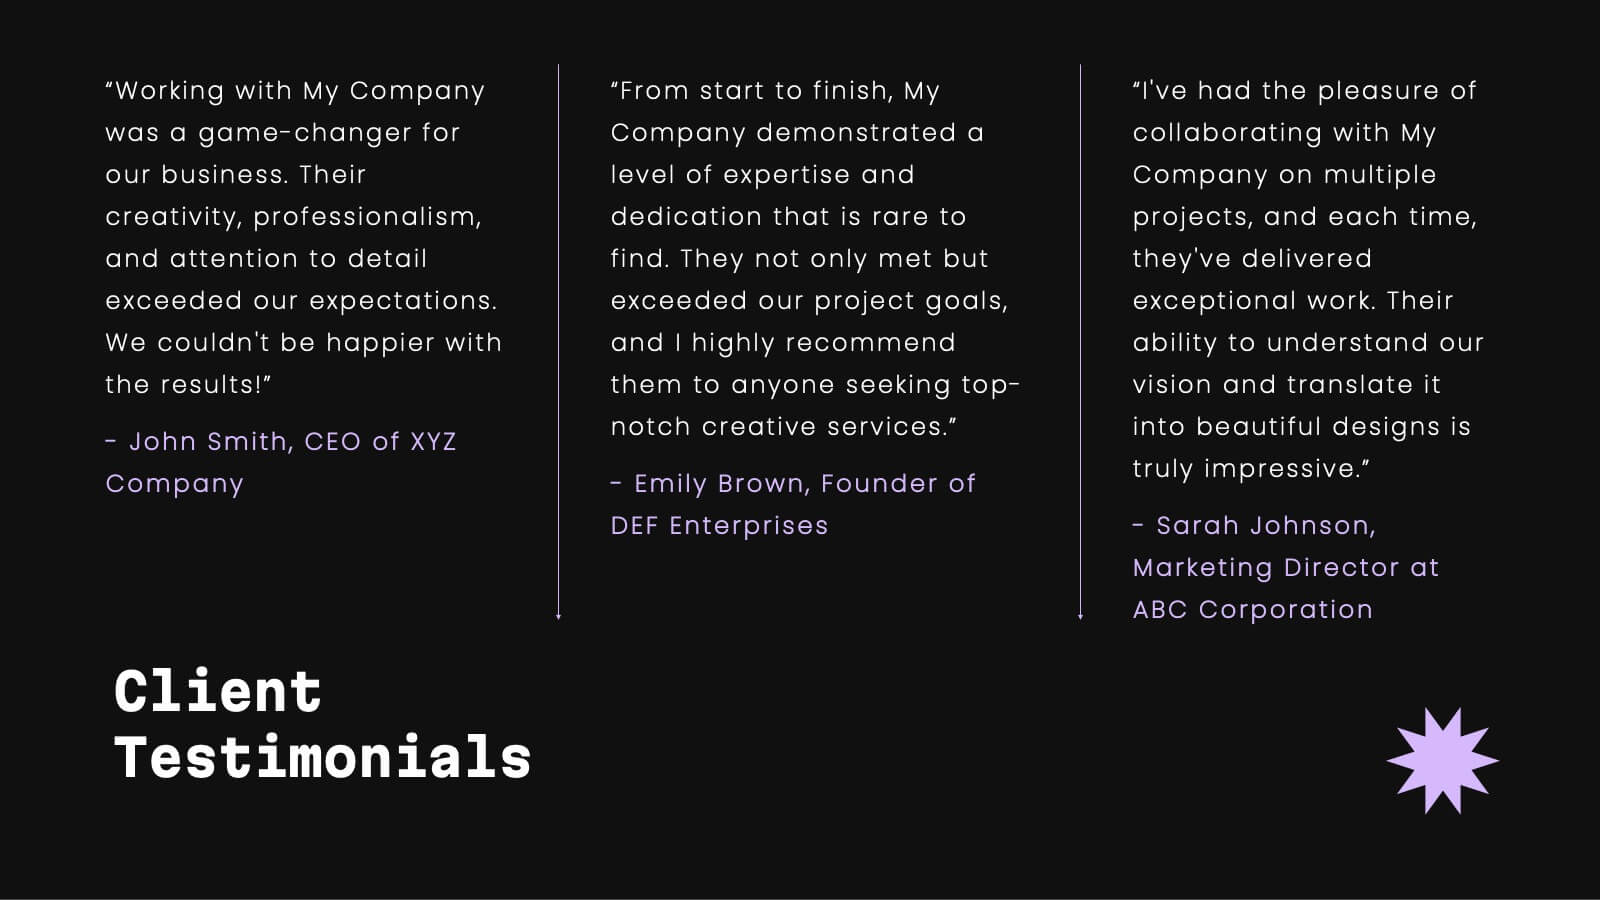
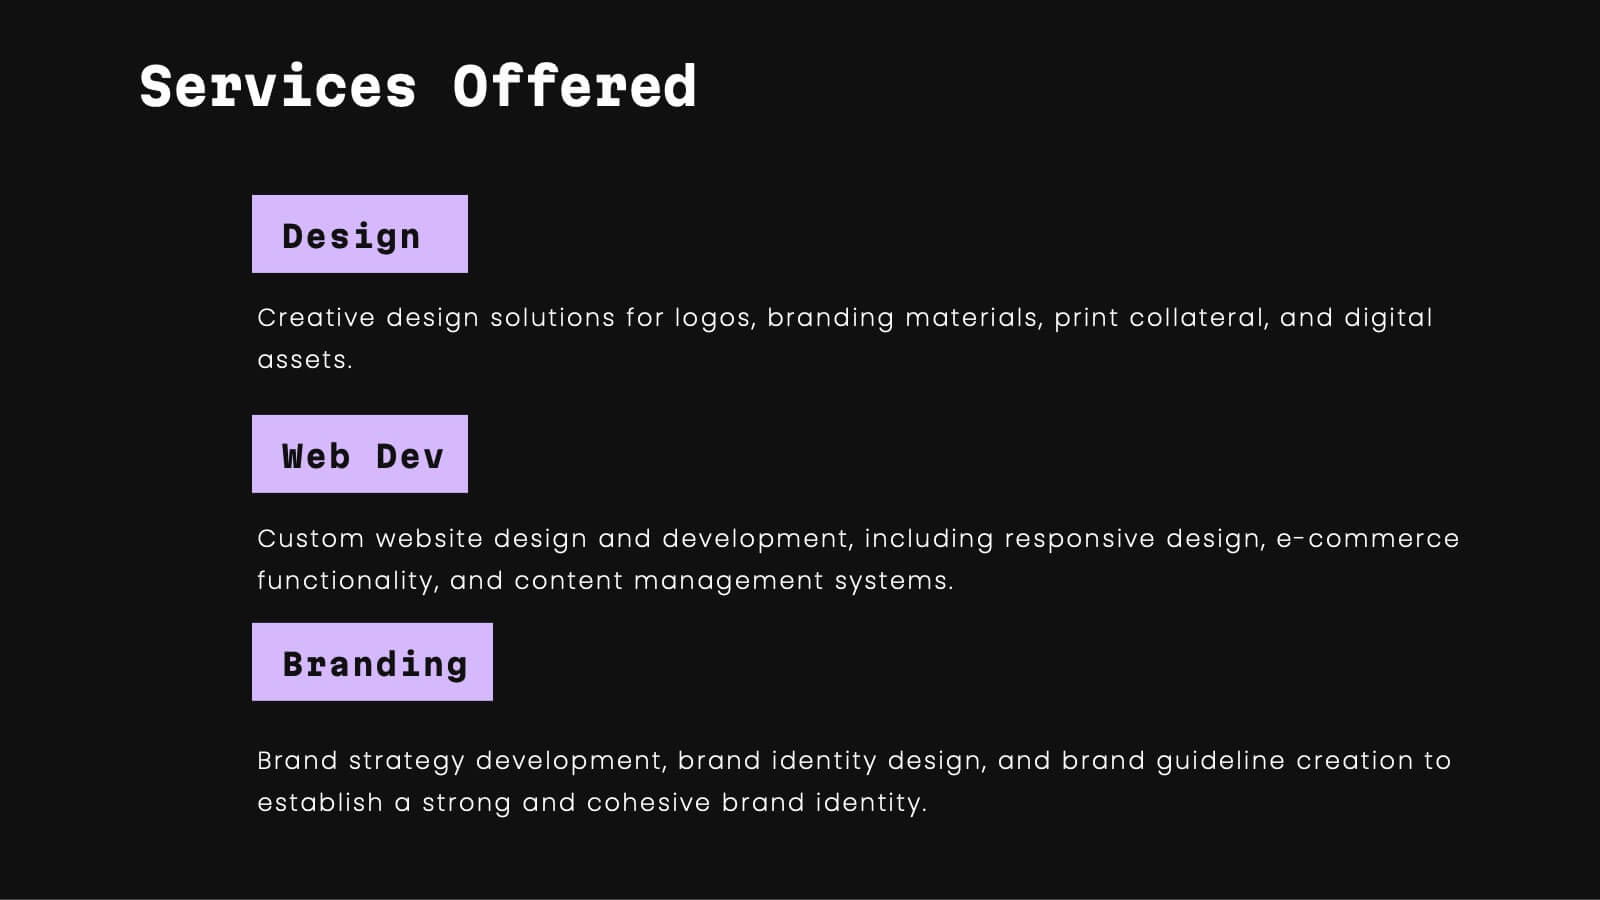
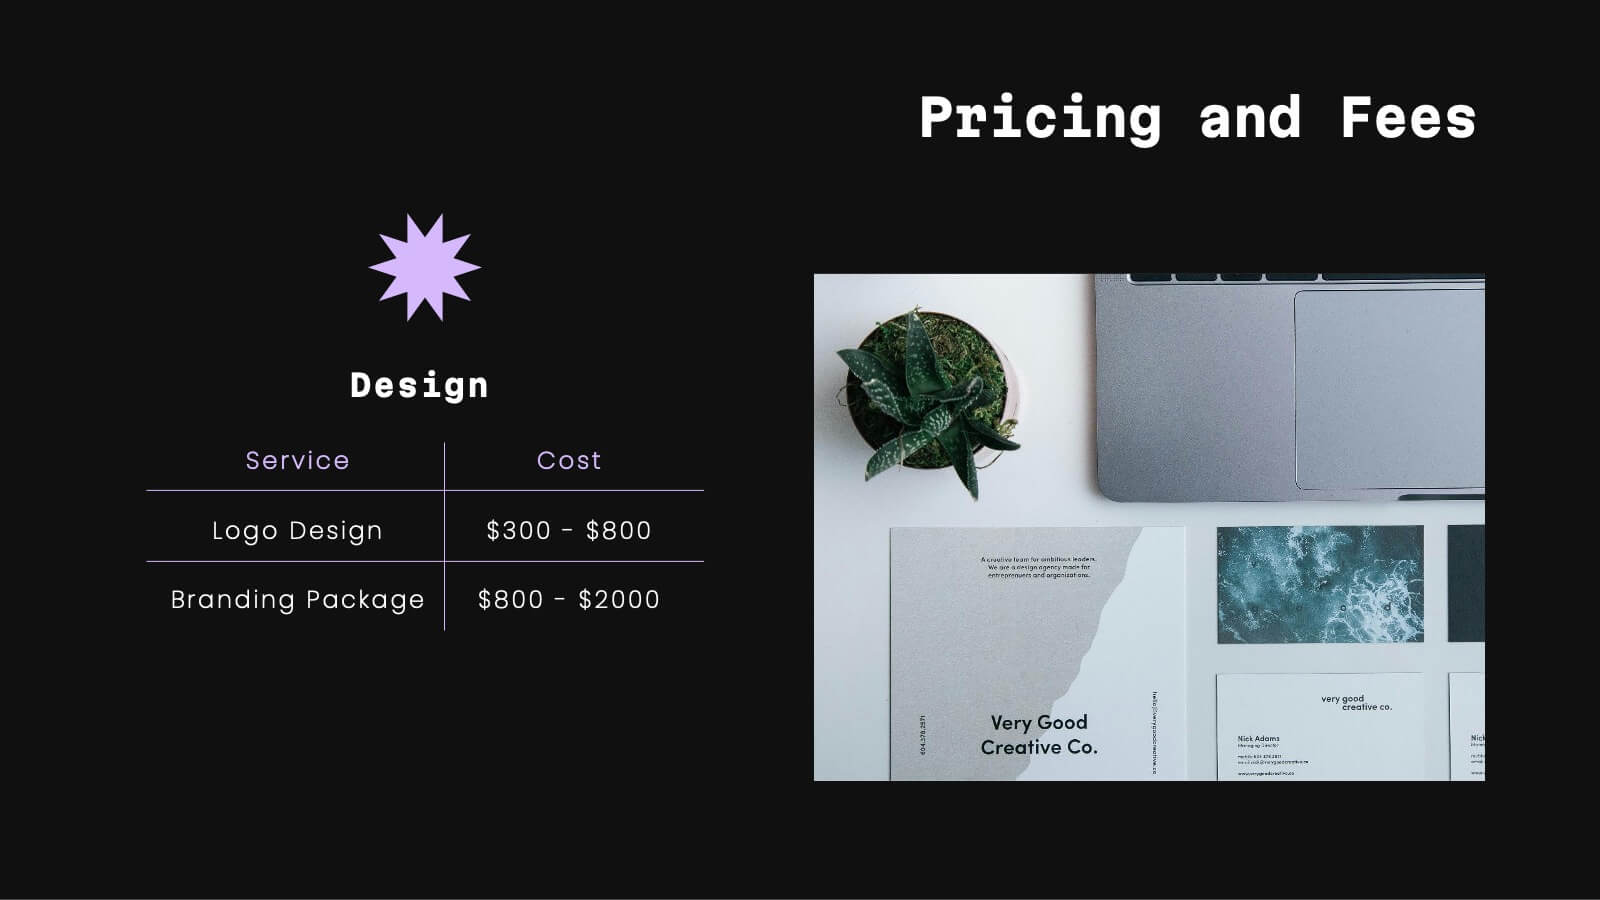
Impress with style using this sophisticated portfolio presentation template. Perfect for showcasing featured projects, creative processes, and client testimonials, this template enhances the visual appeal of your work. Its modern, dark-themed design ensures your content stands out, making a lasting impression. Compatible with PowerPoint, Keynote, and Google Slides, it's versatile for any platform.
- Remove from favorites
Powerpoint Template
8 MB
Google Slides Template
External link
Keynote Template
4 MB
27 slides
Basilisk Brand Guidelines Proposal Presentation
Present your brand strategy effectively with this modern brand guidelines proposal template! It includes sections for brand vision, values, identity, and market analysis. Fully customizable and compatible with PowerPoint, Keynote, and Google Slides, it’s perfect for showcasing your brand's identity and ensuring consistency across all platforms.
- Remove from favorites
Powerpoint Template
4 MB
Google Slides Template
External link
Keynote Template
8 MB
26 slides
Professional Etiquette Presentation
Navigate the nuances of professional decorum through this tapestry of visuals that articulate the essence of workplace conduct. Against a palette of serene blues, each slide is a chapter in the unwritten manual of corporate finesse. Behold the tableau of contents, a compass that guides through topics from networking nuances to meeting mastery. Profile snapshots reveal the faces behind the expertise, their demeanors a blend of affability and authority. Charts ascend like ladders, each bar a rung towards proficiency, while infographics spiral into knowledge funnels, distilling broad concepts into digestible insights. In the realm of comparison, dichotomies transform into dialogues, contrasting ideas merging into a unified vision of etiquette. Venn diagrams interlock circles of skills, control, and success, illustrating the symbiotic relationship of competencies. Contact slides extend a virtual handshake, inviting engagement and fostering connections. This presentation is an homage to the unspoken - the grace of gratitude, the elegance of silence, and the power of a well-timed gesture - as it crafts an environment where professionalism is not just practiced, but lived.
- Remove from favorites
Powerpoint Template
1 MB
Google Slides Template
External link
Keynote Template
1 MB
5 slides
Four-Step Customer Experience Framework Presentation
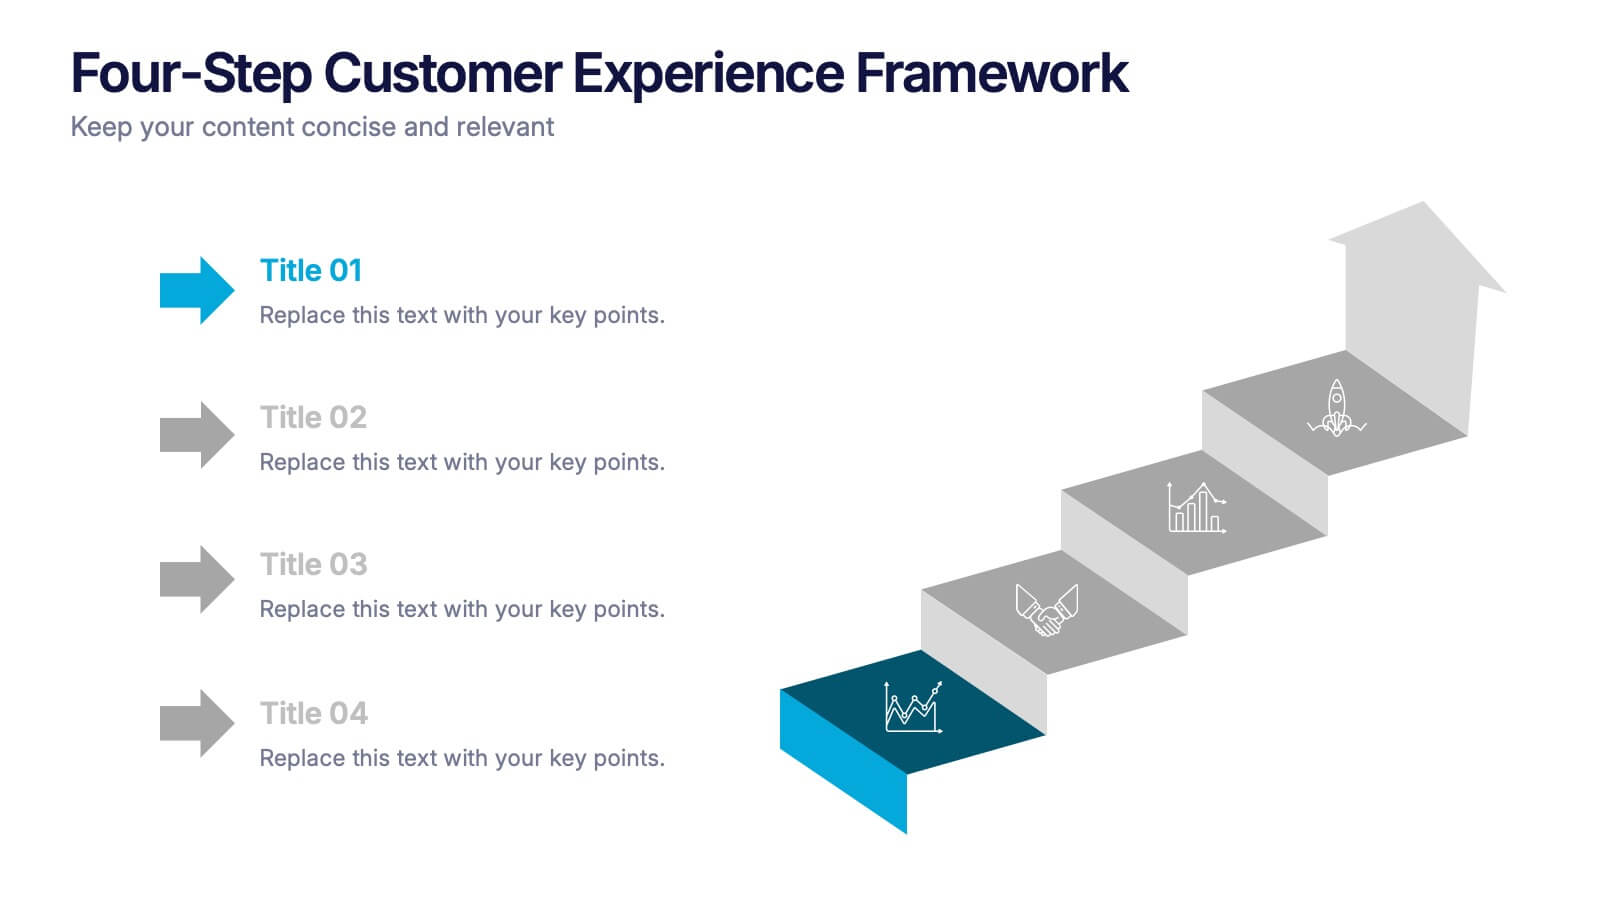
Showcase your customer journey with this sleek, step-by-step visual. Featuring a stair-step arrow design, it’s ideal for highlighting stages in user experience, onboarding, or service improvement. Each step is editable, with icons and titles for clarity. Compatible with PowerPoint, Keynote, and Google Slides—perfect for marketers, strategists, and CX professionals.
- Remove from favorites
Powerpoint Template
1 MB
Google Slides Template
External link
Keynote Template
1 MB
5 slides
Nonprofit Organizations Infographics
Nonprofit Organizations are organizations that are established to pursue a particular social cause or provide a service that benefits the public, rather than generate a profit. These infographic templates are designed to visually present information about nonprofit organizations. They feature bright, colorful and engaging designs with icons and illustrations that represent different aspects of nonprofit organizations, such as fundraising, volunteers, and social impact. The template includes customizable graphs and text boxes to allow users to easily present data about nonprofits, including their structure, goals, impact, and funding sources.
- Remove from favorites
Powerpoint Template
1 MB
Google Slides Template
External link
Keynote Template
1 MB
7 slides
Project Status Tracking Infographic
For any project manager or team leader, tracking the progress and status of projects is paramount. This project status tracking infographic simplifies this task, offering a visually appealing representation of every project phase. With a predominant palette of white and blue, this design captures attention and imparts clarity. Tailored for project managers, stakeholders, and team members, this infographic acts as a dynamic snapshot of ongoing tasks, completed milestones, and impending deadlines. Designed for seamless use with PowerPoint, Keynote, and Google Slides, it's your ultimate tool for effective project communication.
- Remove from favorites
Powerpoint Template
1 MB
Google Slides Template
External link
Keynote Template
1 MB
5 slides
Pandemic Preventive Measures Infographics
Pandemic Preventive Measures refer to a set of actions taken to prevent the spread of infectious diseases. These vertical infographics are focused on informing the audience about the preventive measures that can be taken during a pandemic. They contains various customizable elements such as icons, charts, and diagrams that can be easily edited to suit your needs. The design is clean and easy to follow, making it an effective tool for communicating important information. Educate your audience on the essential pandemic preventive measures, and provide them with the necessary information to stay safe and healthy!
- Remove from favorites
Powerpoint Template
1 MB
Google Slides Template
External link
Keynote Template
2 MB
6 slides
Competitor Benchmarking and Comparison Presentation
Present a side-by-side snapshot of your competitive landscape with the Competitor Benchmarking and Comparison Presentation. This clear layout lets you compare five key features or metrics between your brand and competitors using a visual central column. Fully editable in Canva, PowerPoint, Keynote, and Google Slides for fast, professional benchmarking.
- Remove from favorites
Powerpoint Template
1 MB
Google Slides Template
External link
Keynote Template
1 MB
7 slides
Feedback Management Infographic
Boost your presentation's impact with our Feedback Management infographic, optimized for Powerpoint, Keynote, and Google Slides. This infographic is an essential asset for professionals looking to present feedback data compellingly and concisely. Designed to convey customer satisfaction metrics and responses effectively, it's perfect for market researchers, customer service managers, and business analysts. The Feedback Management infographic is constructed to visually communicate the importance of customer insights and how they drive business improvements. It transforms complex data into an easy-to-understand format, which is crucial for making informed decisions based on customer feedback. The infographic's structured design assists audiences in comprehending the collected feedback at a glance, highlighting key figures and trends. Whether you're reporting on survey results or showcasing customer reviews, this infographic ensures your data is presented clearly. Compatible with leading presentation software, it allows for smooth integration into your slides, ensuring your feedback analysis stands out. Incorporate this infographic into your presentations to effectively display feedback management data and make a lasting impression.
- Remove from favorites
Powerpoint Template
1 MB
Google Slides Template
External link
Keynote Template
1 MB
6 slides
Fishbone Diagram
A fishbone diagram, also known as a cause-and-effect diagram or an Ishikawa diagram, is a visual tool used to identify and analyze the potential causes of a problem or an effect. This infographic template is designed to help you explore and understand the root causes of an issue by visually mapping out various contributing factors. This cause-and-effect diagram, provides a structured approach to identify and categorize the various factors contributing to a specific outcome. This template is fully customizable and compatible with Powerpoint, Keynote, and Google Slides making it easy to input your information.
- Remove from favorites
Powerpoint Template
1 MB
Google Slides Template
External link
Keynote Template
2 MB
7 slides
Weight Challenge Infographic Presentation
Challenges are essential for personal and professional growth, and they play an important role in our lives in several ways. This template is designed for any and all use. You can use it in business, academic presentations, or home. This template is designed to give you flexibility in your presentations and allow you to create dynamic content that stands out from the crowd. This is compatible with Powerpoint, Keynote, and Google Slides so you can easily edit your presentation. This template can be used for a variety of projects, including team building, goal setting and brainstorming!
- Remove from favorites
Powerpoint Template
28 MB
Google Slides Template
External link
Keynote Template
22 MB
26 slides
Understanding the Stock Market Presentation
Step into the exciting world of finance with our dynamic and sleek presentation template, perfect for understanding the stock market! This comprehensive guide simplifies complex financial concepts, making it an ideal resource for beginners, students, and professionals. Featuring a sophisticated collection of slides, this template covers key topics such as market trends, investment strategies, and financial analysis. The design integrates bold colors, sharp graphics, and well-organized layouts to keep your audience engaged and informed. Infographics and charts break down intricate data, while mockups offer realistic previews of stock market tools. Fully customizable and versatile, this template can be adapted to suit various presentation needs and styles. It is compatible with PowerPoint, Keynote, and Google Slides, ensuring smooth and professional presentations across different platforms. Perfect for financial workshops, educational seminars, or anyone looking to deepen their understanding of the stock market.


