


Features
- 5 Unique slides
- Fully editable and easy to edit in Microsoft Powerpoint, Keynote and Google Slides
- 16:9 widescreen layout
- Clean and professional designs
- Export to JPG, PDF or send by email


Do you have any questions?
Recommend


8 slides
Airline Business Strategy Presentation
Leverage key insights into the aviation sector with the "Aviation Industry Market Analysis" presentation template. This design allows professionals in the aviation industry to effectively communicate market trends and forecasts. Its compatibility with PowerPoint, Keynote, and Google Slides ensures a versatile use across different platforms, making it ideal for industry analyses, investor meetings, or internal strategy discussions.


26 slides
Poseidon Sales Pitch Deck Template Presentation
Unleash your persuasive power with the Poseidon Sales Pitch Deck template! This sleek and modern deck is designed to elevate your pitch, making your business the undeniable choice for potential clients or investors. With a compelling company overview and a clear problem statement, this template sets the stage for presenting your solution as the ultimate answer to your market’s challenges. The deck includes essential slides like competitive landscape analysis, revenue models, and marketing strategies to give your pitch a comprehensive edge. The visually appealing design combined with well-organized sections ensures your message is clear, concise, and impactful. Customize it to fit your brand identity and make your unique selling proposition stand out. Perfect for startups, established businesses, or anyone looking to make a powerful impression, this template is compatible with PowerPoint, Keynote, and Google Slides. Take your pitch to the next level and close those deals with confidence!


2 slides
Business Self-Introduction Presentation
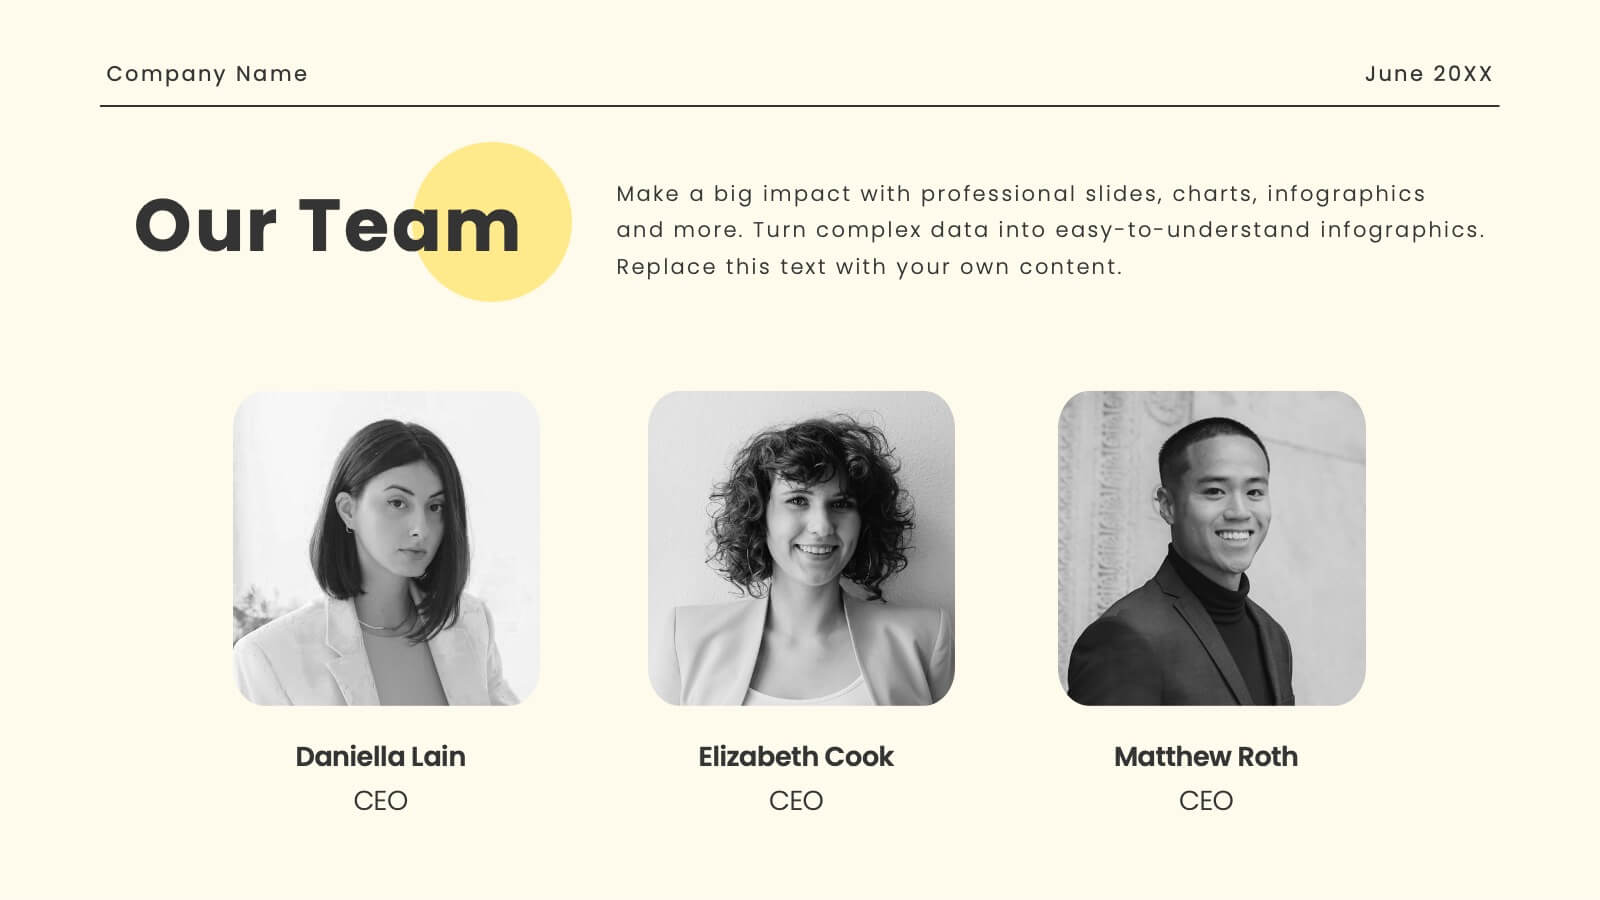
Introduce yourself with confidence using this Business Self-Introduction Slide. Perfect for networking, team meetings, and professional presentations, this template features a modern layout with a dynamic photo cutout, engaging visuals, and structured text areas. Fully customizable for PowerPoint, Keynote, and Google Slides, you can adjust colors, fonts, and content to reflect your personal or business identity.


7 slides
Customer Service Profile Infographic Presentation
A Customer Profile infographic is a visual representation of a target customer or customer segment that provides important information about their demographics, behavior, preferences, and needs. This template can help businesses and organizations understand their customers better, tailor their products or services to meet their needs, and develop effective marketing strategies. This template can be used for various purposes, such as to guide product development, to inform marketing campaigns, or to improve customer service. This template is compatible with Powerpoint, keynote and google slides.


6 slides
Business Decision Flow Model Presentation
Make smarter choices with this Business Decision Flow Model presentation. Clearly map out key decisions, steps, and potential outcomes using a structured, color-coded flow. Perfect for strategy reviews, team meetings, and executive briefings. Fully editable in Canva, PowerPoint, and Google Slides for seamless customization.


10 slides
Buyer Persona Journey Presentation
Understand your audience better with the Buyer Persona Journey Presentation. This intuitive layout showcases the key stages of your ideal customer’s experience—from discovery to decision-making. Great for marketing campaigns, product development, and sales alignment. Fully editable and compatible with PowerPoint, Keynote, and Google Slides.


6 slides
Brain Vector Infographic
This Brain Vector Infographic is an imaginative tool for presenting complex concepts and ideas in an easy-to-digest visual format. The design employs brain imagery to symbolize various aspects of thought processes, intelligence, brainstorming, or mental health. Its sections are strategically placed to reflect different cognitive areas, making it perfect for educational settings or business workshops focused on innovation. Fully editable and compatible with PowerPoint, Google Slides, and Keynote, this template allows for full customization, from colors to text, adapting to your unique presentation needs. Whether for academic, or personal use, this infographic simplifies conveying intricate information.


8 slides
Employee Training and Development Presentation
Optimize your team's growth with the 'Employee Training and Development' presentation template. This layout strategically organizes training modules, showcasing clear pathways for skills enhancement and career progression. Compatible with PowerPoint, Keynote, and Google Slides, it's ideal for delivering engaging and instructional corporate training sessions.


6 slides
Business Development Strategy Infographic
Business Strategy refers to a set of planned actions and decisions designed to achieve specific goals and objectives within an organization. This infographic template is designed to showcase the key elements and steps involved in a business development strategy. Ideal for entrepreneurs and marketing professionals, this template helps present the roadmap for business growth and success. The visuals showcase the market research and analysis conducted to identify target audiences, market trends, and competitors. Graphs and charts represent market growth potential and opportunities. This template is fully compatible with Powerpoint, Keynote, and Google Slides.


10 slides
Simplified Workflow in Four Clear Steps Presentation
Guide your audience through structured execution with the Simplified Workflow in Four Clear Steps Presentation. This vertical step diagram visually organizes key stages for task progression, planning, or implementation workflows. Each block is labeled, color-coded, and easy to customize—making your message direct and engaging. Fully editable in PowerPoint, Keynote, Google Slides, and Canva.


26 slides
Venture Capital Presentation
Perfect for investors and startups, this Venture Capital presentation template is designed to effectively communicate the nuances of funding and investment strategies. Its professional layout, highlighted with bold colors and clear graphics, sets the stage for impactful discussions on the intricacies of venture capital. The slides are structured to guide you through every aspect of the investment journey, from introducing key players to dissecting financial forecasts and market analyses. Engaging visuals aid in illustrating company growth potential, funding stages, and investor expectations, while specialized slides enable a deep dive into competitive comparisons and future financial projections. This template, adaptable across PowerPoint, Keynote, and Google Slides, is an essential tool for anyone in the venture capital arena looking to present their ideas with confidence and precision.


2 slides
Presentation Title Design Options Presentation
Make a bold first impression with the Presentation Title Design Options template. This visually striking layout features a futuristic 3D cube graphic framed in a circular cutout, paired with two clean content blocks for highlighting your key messages. Ideal for opening slides or concept overviews, this design is fully editable in PowerPoint, Keynote, and Google Slides.


21 slides
Oasis Startup Business Plan Presentation
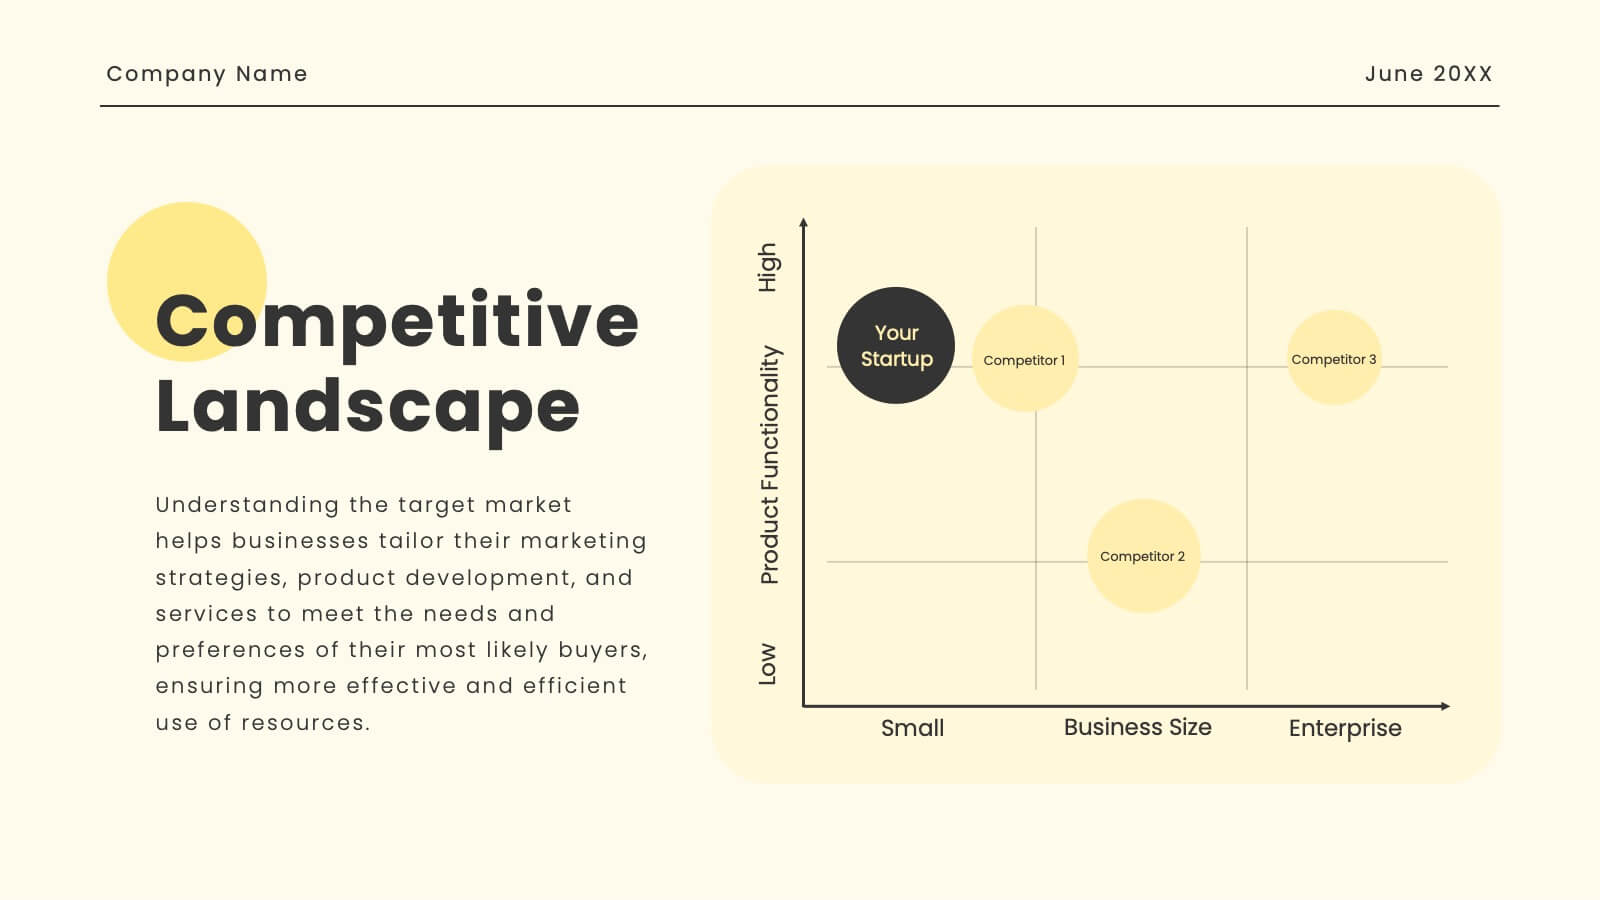
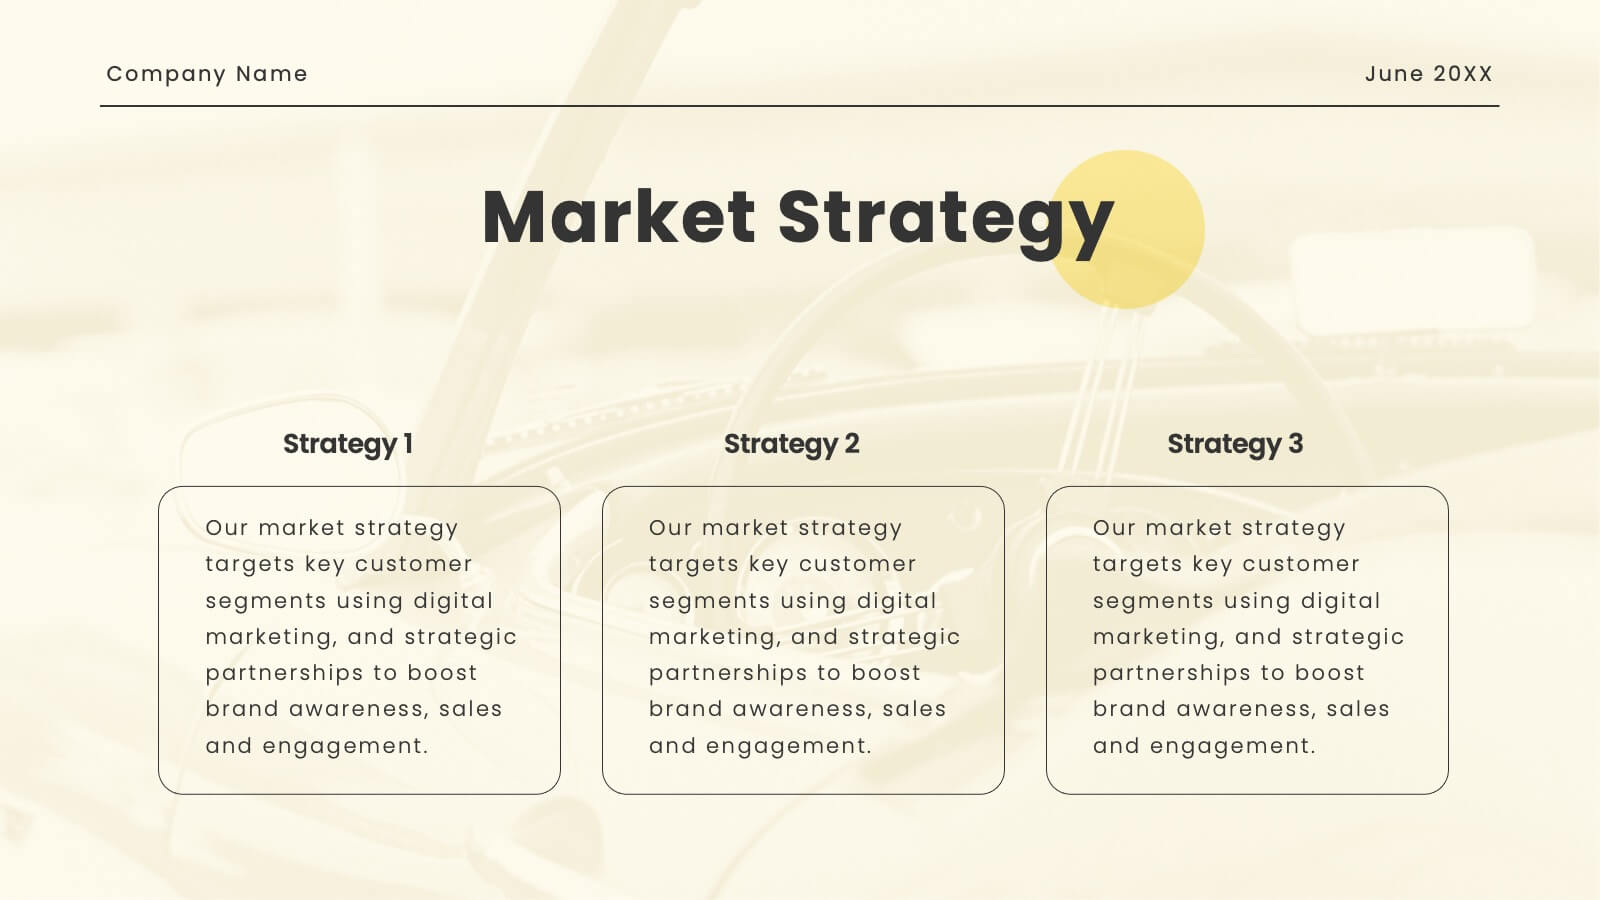
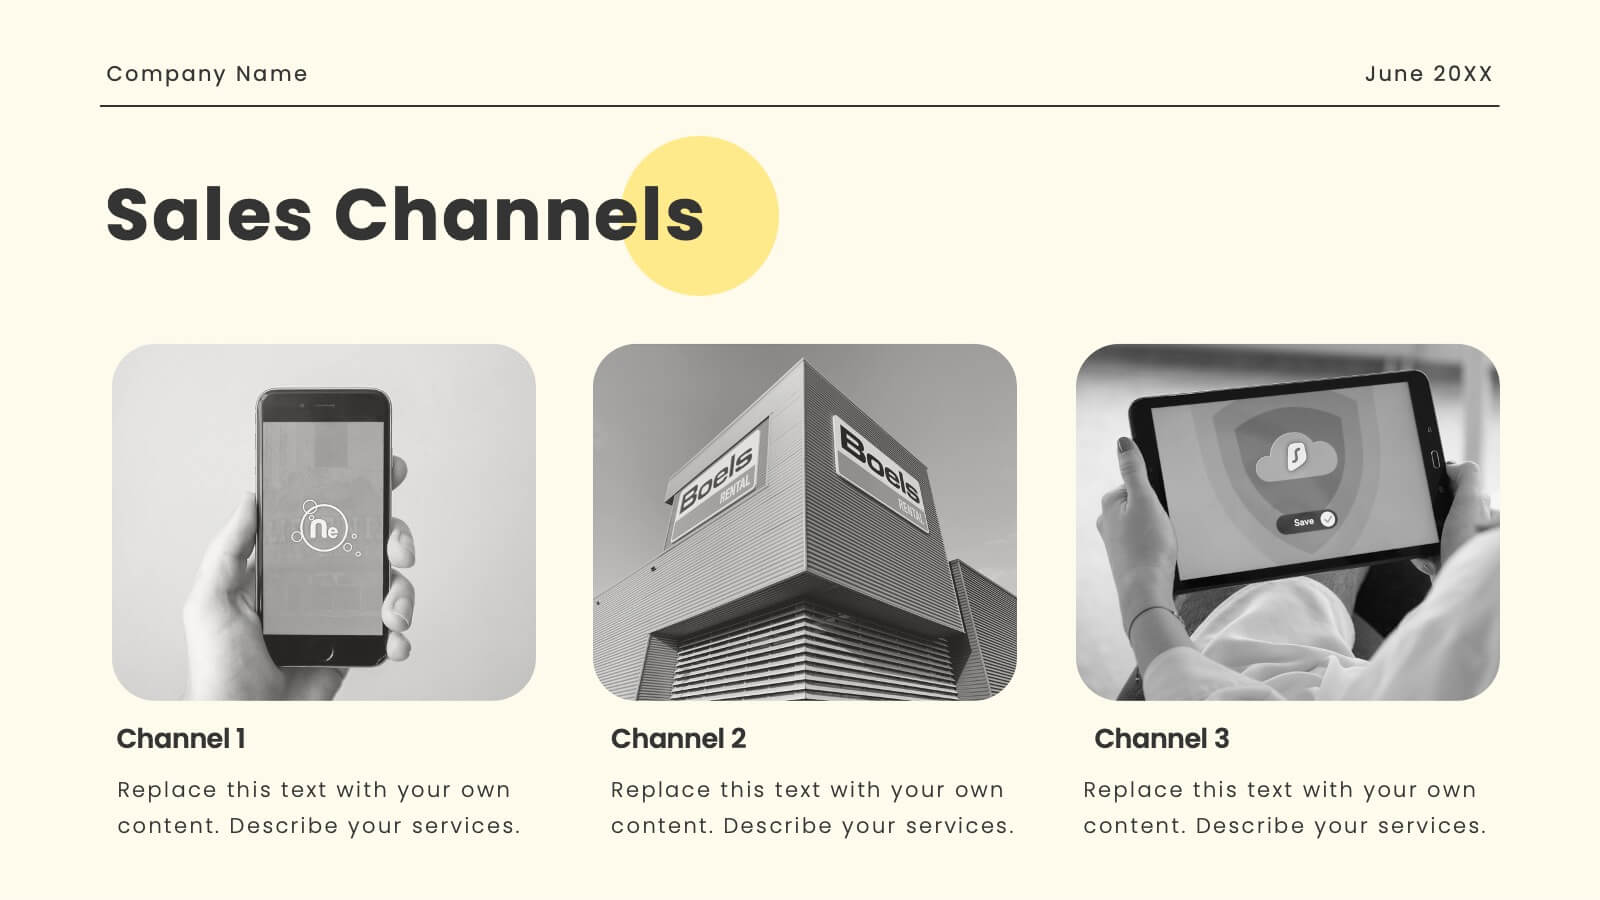
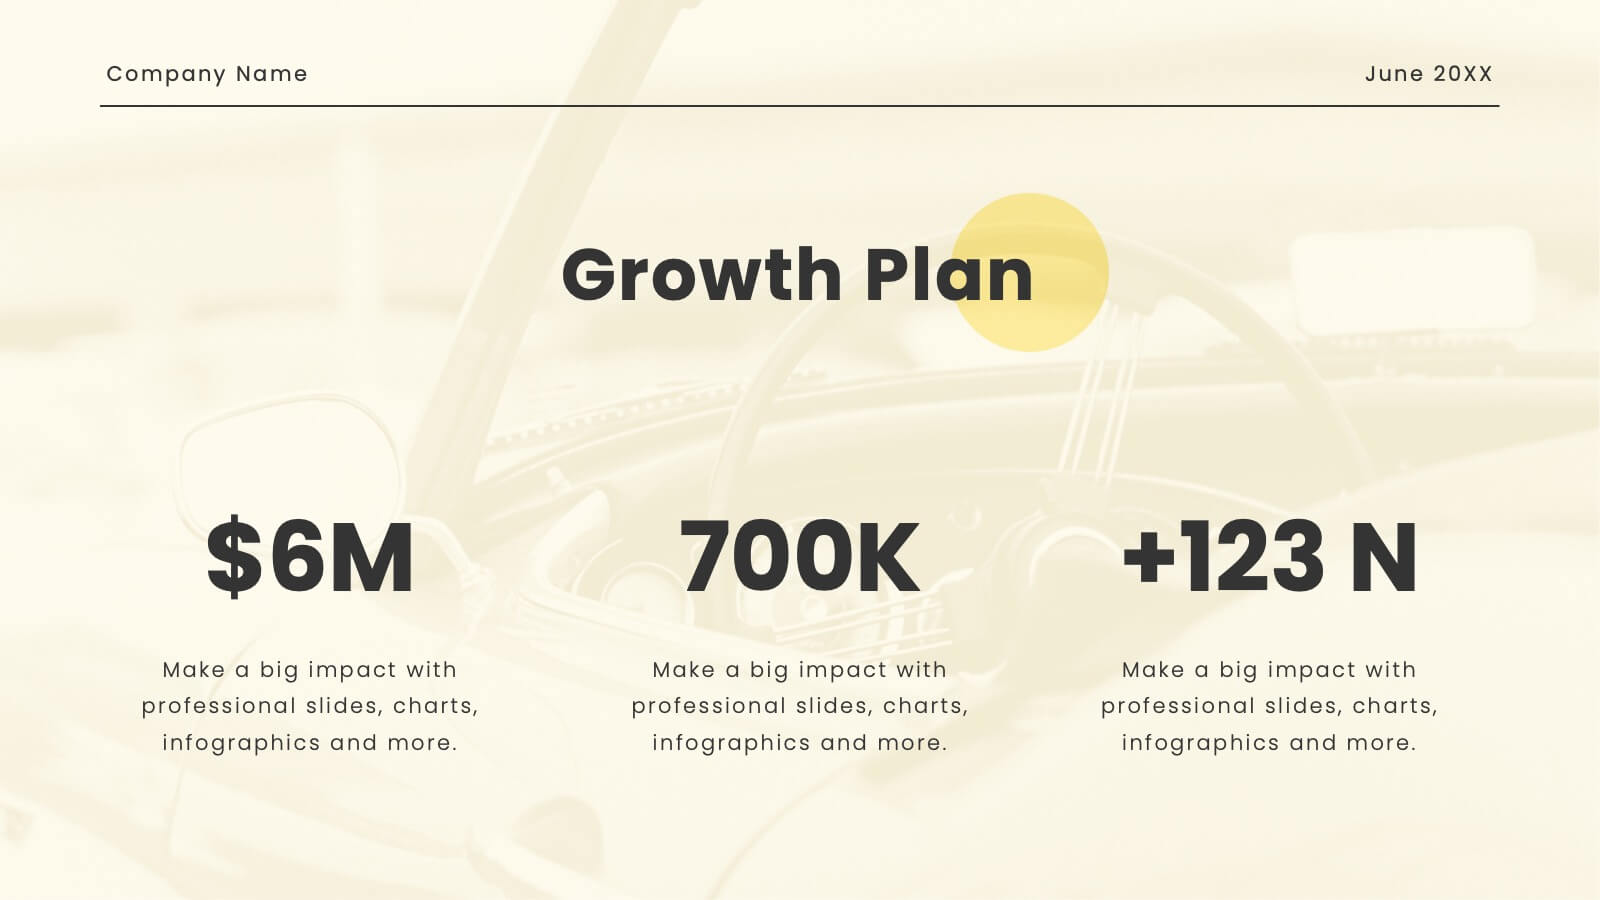
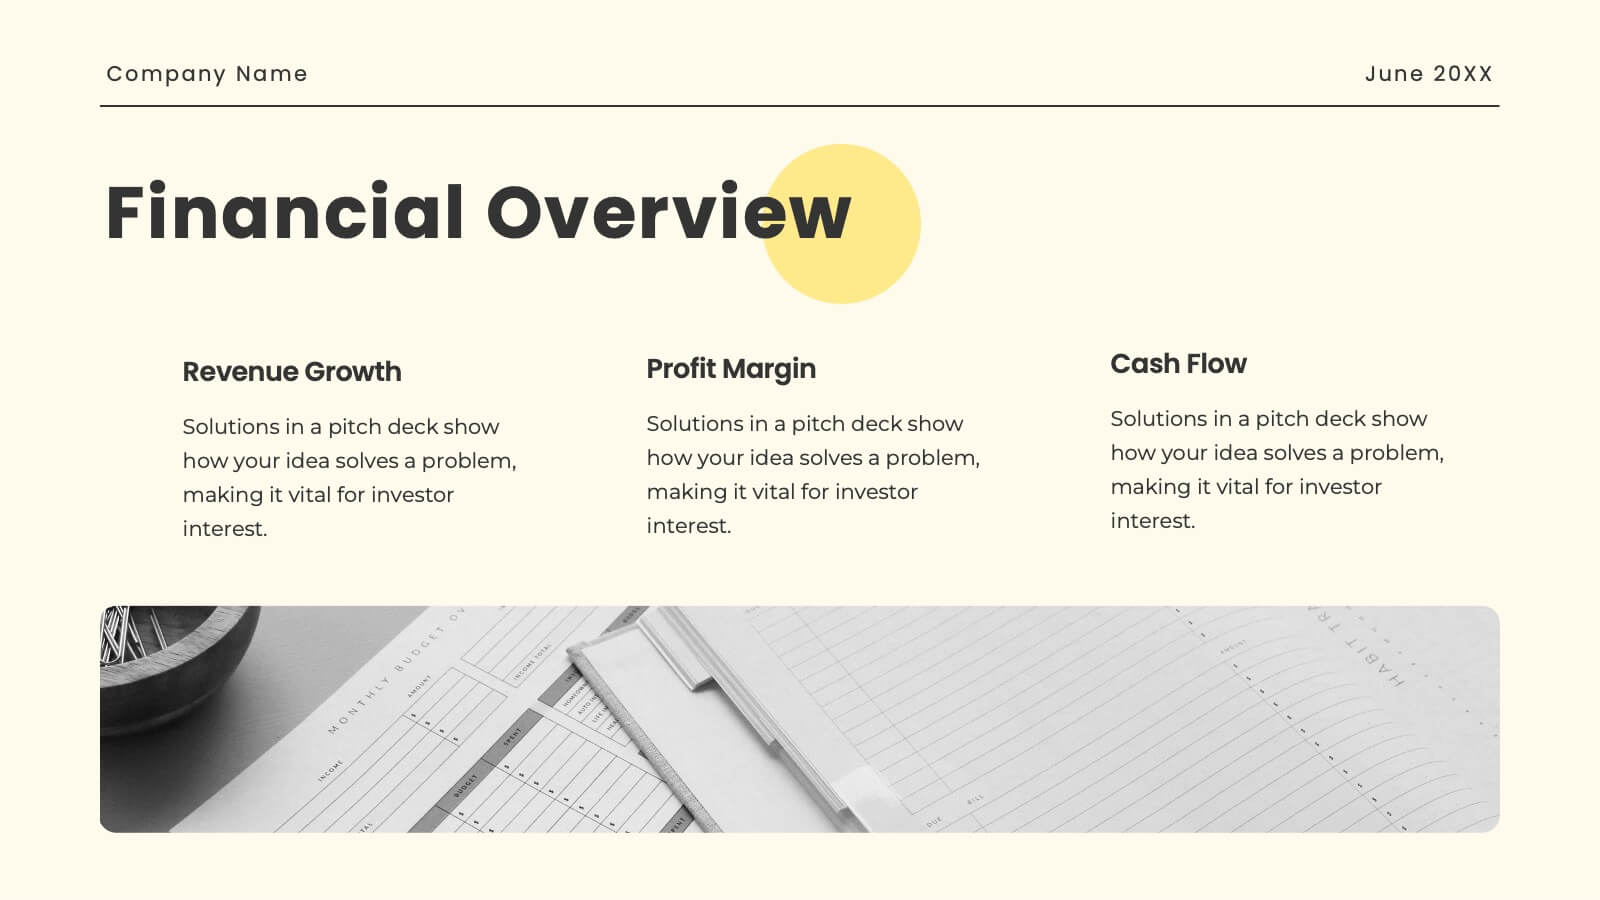
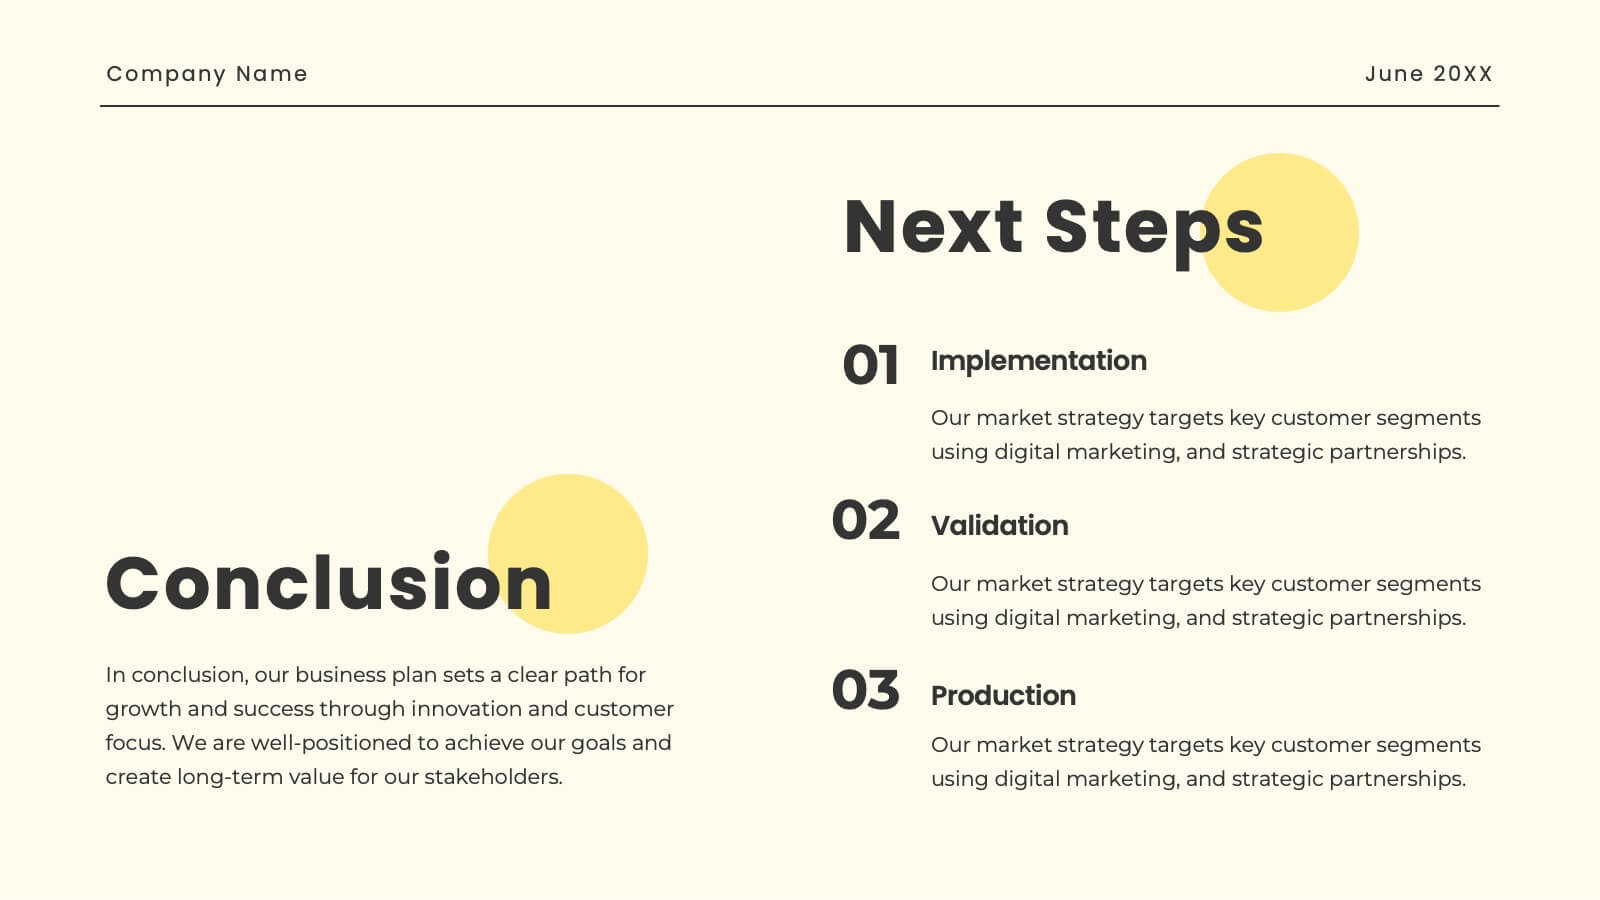
Present your corporate business plan with confidence! This template includes sections for company overview, mission, vision, services, target market, and more. Showcase your market strategy, sales channels, growth plan, and financial overview. Perfect for conveying a professional and comprehensive business plan. Compatible with PowerPoint, Keynote, and Google Slides. Impress your audience today!


4 slides
Digital Marketing and SEO Best Practices Presentation
Communicate your digital strategy with this clean and structured visual layout. This template features a horizontal flowchart design with four circular icons branching from a central infographic, allowing you to showcase core areas such as audience targeting, content creation, performance analytics, and ranking improvement. Ideal for marketers, consultants, and SEO professionals. Fully editable in PowerPoint, Keynote, and Google Slides.
4 slides
Objectives and Results Strategy Tracking Presentation
Track progress with clarity using the Objectives and Results Strategy Tracking Presentation. This sleek, minimalist layout helps visualize how each objective connects to measurable outcomes along a strategic path. Ideal for OKR reviews, quarterly goal updates, and performance check-ins. Fully customizable in PowerPoint, Canva, Keynote, and Google Slides.


6 slides
Food Market Infographic
The food market refers to the industry and marketplace where various food products are produced, processed, distributed, and sold to consumers. This infographic template is designed to provide insights into the food market industry. This aims to showcase key trends, statistics, and market dynamics related to the global food market. Whether used in presentations, reports, or educational material, this infographic will help your audience gain insights into the market, identify growth opportunities, and make informed decisions in the food industry. Compatible with Powerpoint, Keynote, and Google Slides.


6 slides
Real Estate Property Market Overview Presentation
Present key property market insights using this structured, easy-to-follow layout. The slide features six labeled sections flanking a central house graphic—ideal for highlighting data points, regional comparisons, or investment factors. Fully customizable in Canva, PowerPoint, and Google Slides, making it perfect for real estate reports, pitches, or client presentations.