


Features
- 10 Unique slides
- Fully editable and easy to edit in Microsoft Powerpoint, Keynote and Google Slides
- 16:9 widescreen layout
- Clean and professional designs
- Export to JPG, PDF or send by email


Do you have any questions?
Recommend


20 slides
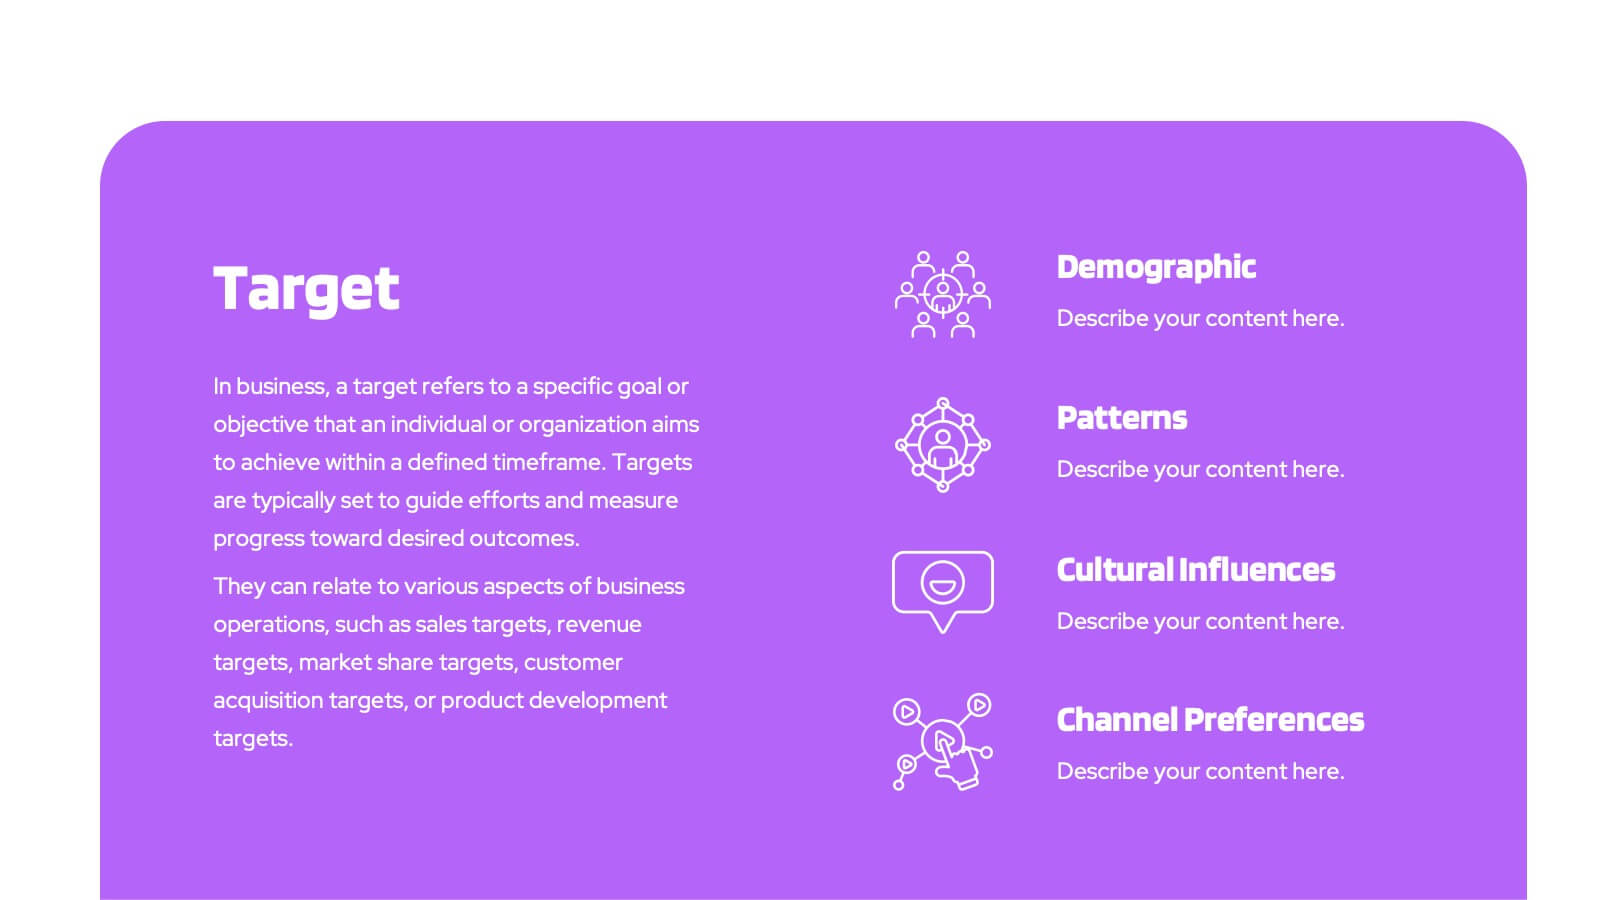
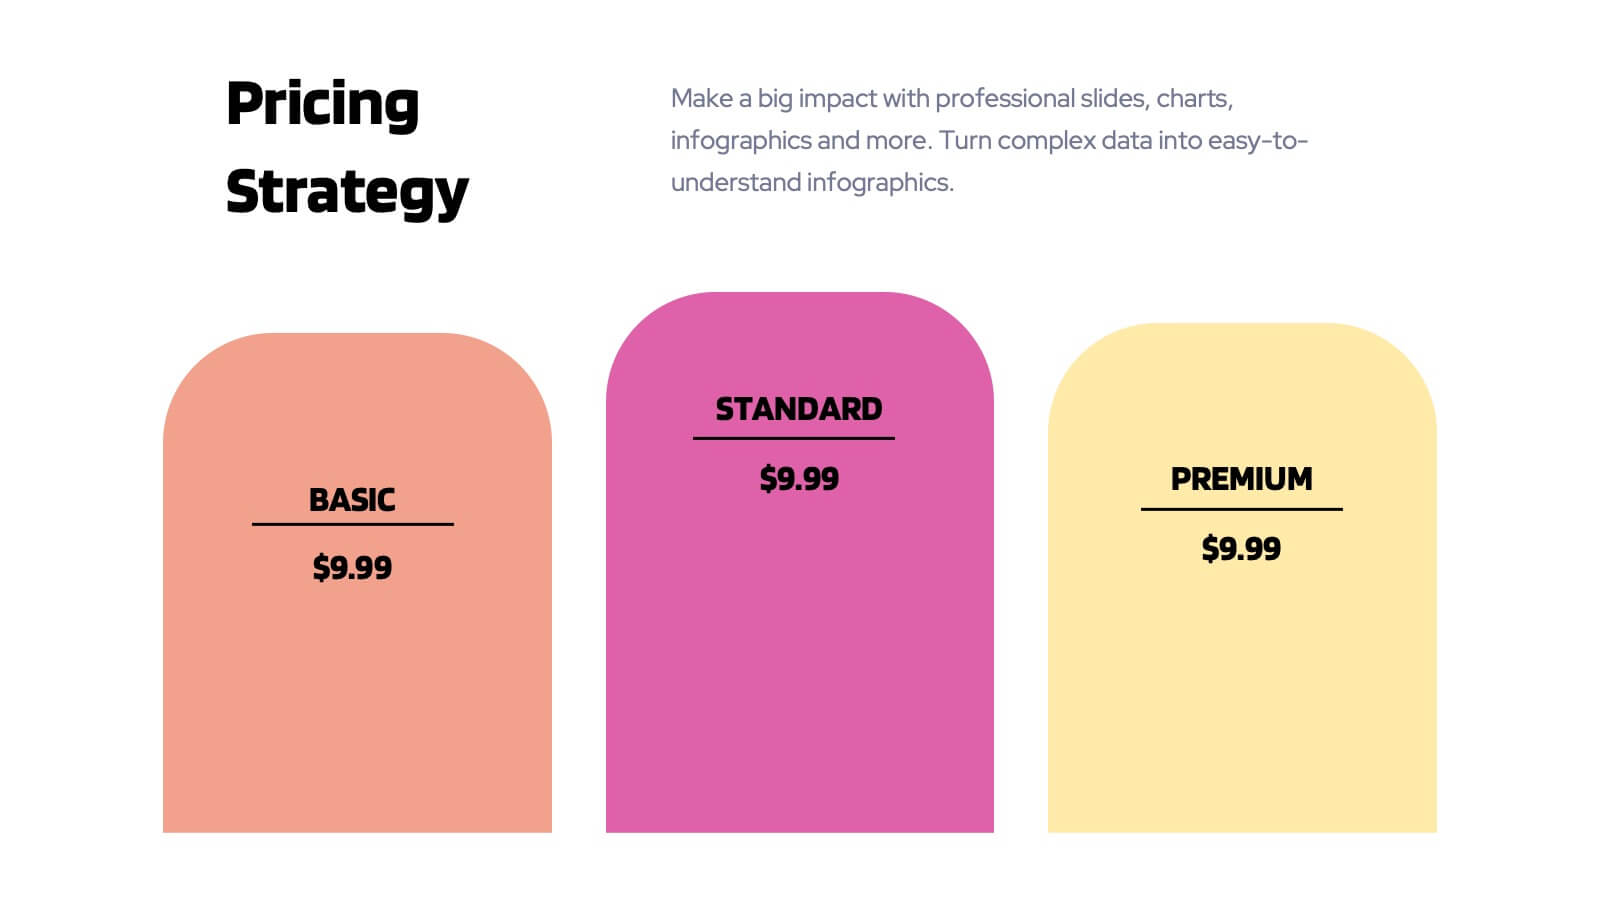
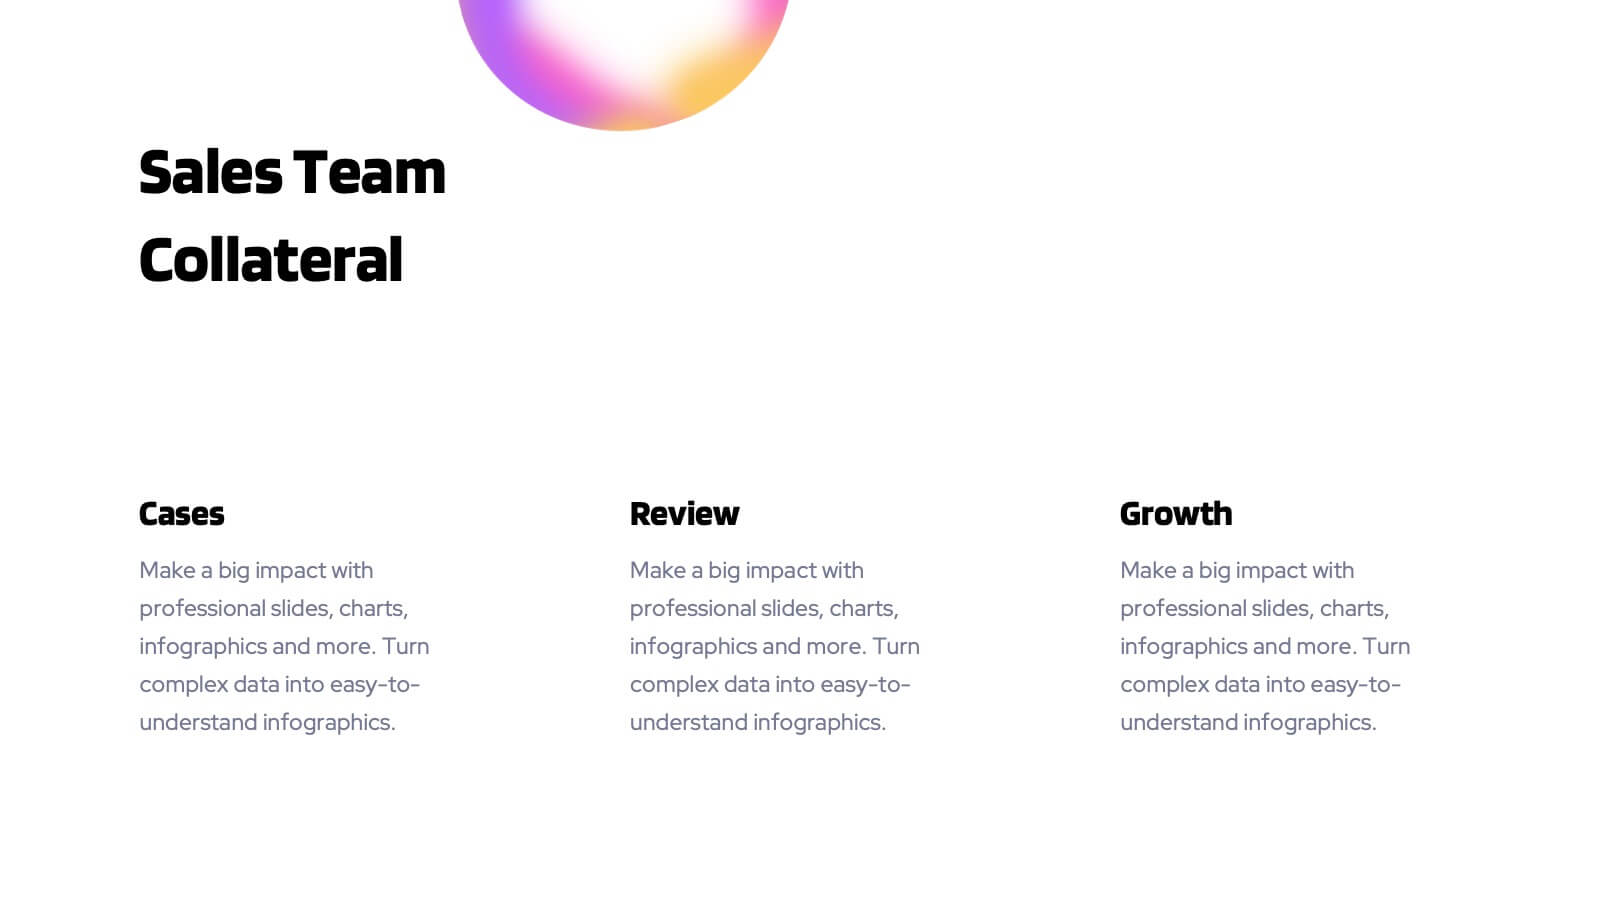
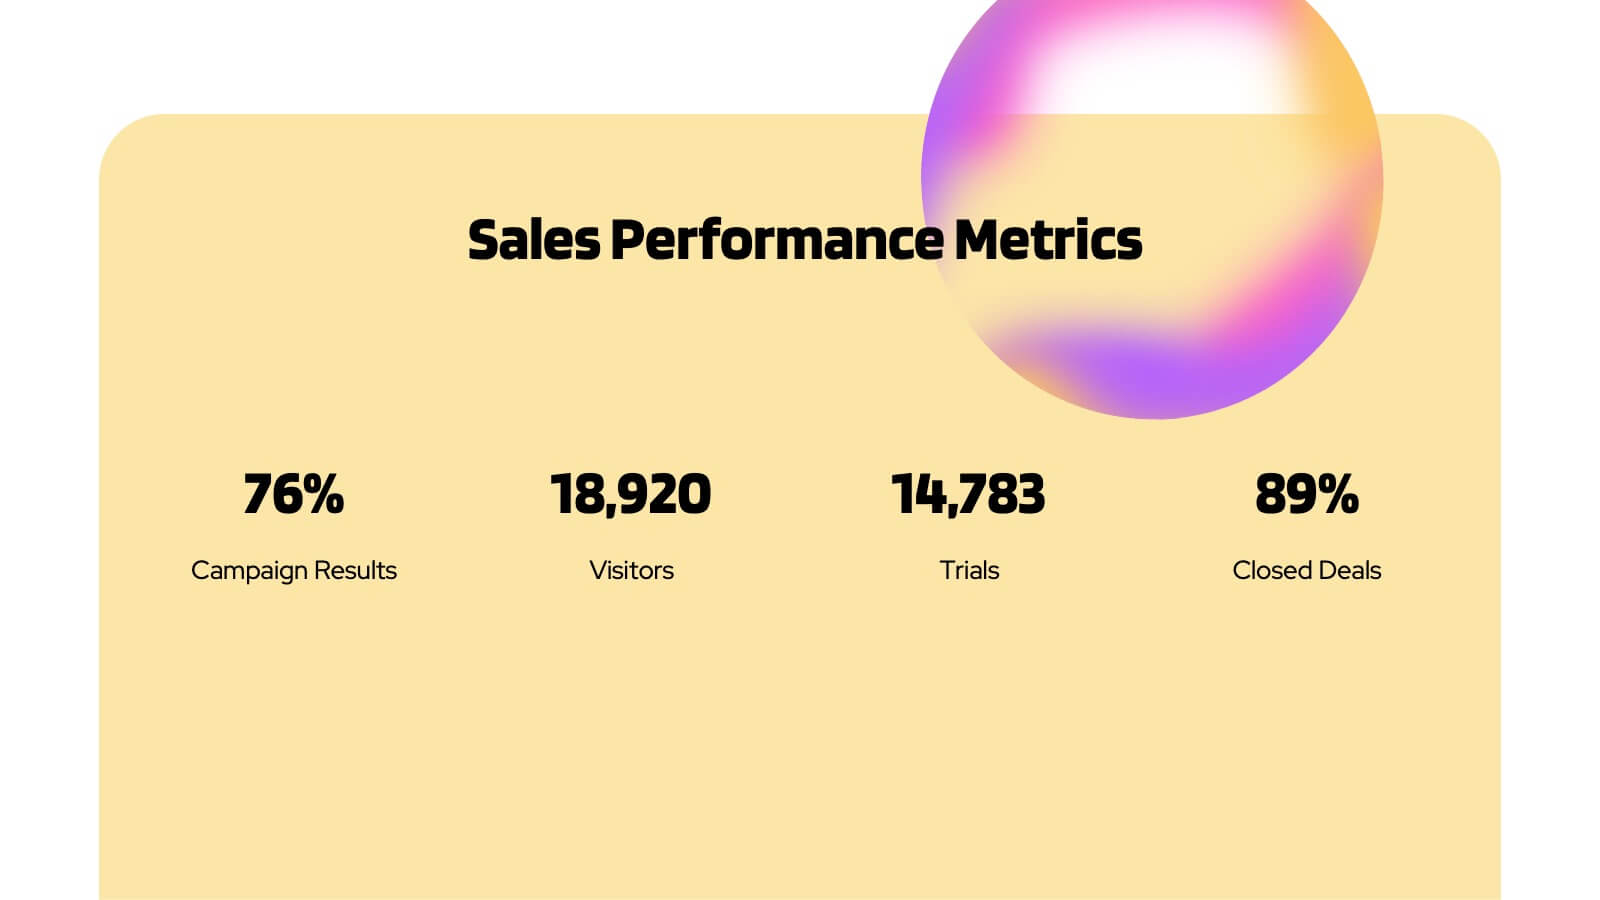
Planetary Sales Performance Report Presentation
Energize your sales efforts with this vivid sales performance presentation template. It includes sections for company overview, detailed sales metrics, and future goals, perfect for showcasing achievements. Compatible with PowerPoint, Google Slides, and Keynote, it’s designed to inform and motivate sales teams effectively.


4 slides
Cause-Effect Relationships Bowtie Format Presentation
Clearly illustrate the connection between causes and outcomes with the Cause-Effect Relationships Bowtie Format Presentation. Designed to simplify complex business logic, this layout uses a symmetrical bowtie shape to contrast contributing factors with resulting effects. Ideal for strategy, operations, or risk analysis. Fully editable in Canva, PowerPoint, Google Slides, and Keynote.


7 slides
Tree Branch Diagram Infographic
The Tree Branch Diagram Infographic is a versatile template designed to showcase hierarchical information and relationships between different categories or levels of data. Its tree-like structure branches out from a central idea, making it ideal for visualizing organizational structures, decision trees, or classification systems. Each branch represents a unique segment of information, which can be further divided into sub-categories, providing a clear and comprehensive view of complex data. The design is user-friendly and adaptable, suitable for use in PowerPoint, Google Slides, and Keynote presentations.


5 slides
Root Cause Business Problem Slide
Uncover the foundation of complex challenges with this tree-inspired slide—perfect for visualizing root causes behind business problems. Showcase contributing factors at each root to guide effective solutions. Fully editable in PowerPoint, Keynote, and Google Slides.


6 slides
Digital Education and E-Learning Trends Presentation
Present modern educational insights with clarity using this well-structured slide focused on digital learning trends. Featuring an icon-based circular layout around a graduate figure and six editable titles, it's ideal for showcasing online learning strategies, tech tools, and training programs. Designed to keep your content concise and visually engaging, this layout is perfect for educators, institutions, and e-learning professionals. Fully customizable in PowerPoint, Keynote, and Google Slides.


4 slides
OKRs Alignment for Performance Goals Presentation
Visualize and align your objectives with precision using the OKRs Alignment for Performance Goals Presentation. This template illustrates how Objectives, Key Activities, and Results converge toward a shared target, helping you communicate goals clearly to teams and stakeholders. Perfect for quarterly planning, team alignment, and executive reviews. Fully editable in Canva, PowerPoint, Keynote, and Google Slides.


8 slides
Project Milestones and Deliverables Presentation
Visualize your project’s journey with this step-by-step milestone timeline—ideal for tracking key phases, task ownership, or delivery checkpoints. The diagonal path connects colorful icons and editable text blocks, helping teams align on objectives and timelines. Compatible with PowerPoint, Keynote, and Google Slides.


7 slides
AIDA Selling Model Infographic
The AIDA model is a widely used marketing and advertising framework that outlines the stages a consumer typically goes through when engaging with a product or service. This infographic template is a dynamic and compelling tool designed to conquer the attention and minds of your audience. AIDA, the cornerstone of marketing, stands for Attention, Interest, Desire, and Action—an unyielding formula for successful engagement. Fully customizable and compatible with Powerpoint, Keynote, and Google Slides. Prepare to take your marketing strategies to exhilarating heights with this infographic.


7 slides
Communication Styles Infographic
Dive into the diverse world of communication with our communication styles infographic. Set against a palette of blue, yellow, and white, this template offers a visual exploration of different communication methods and their nuances. Whether it's assertive, passive, aggressive, or passive-aggressive, understanding these styles is vital in both personal and professional settings. Ideal for corporate trainers, educators, students, or anyone aiming to improve their interpersonal skills. Crafted for clarity and compatibility, this infographic is an excellent addition to PowerPoint, Keynote, and Google Slides, ensuring your presentations resonate with both substance and style.


7 slides
Agile Methodology Strategy Infographic
Master the dynamics of Agile with our agile methodology infographic. Set against a crisp white foundation, the design cascades with the professionalism of blue, the urgency of red, the innovation of orange, and the growth of green. Equipped with methodical infographics, pertinent icons, and versatile image placeholders, this template provides a comprehensive depiction of the Agile process, from sprint planning to retrospectives. Tailored impeccably for Powerpoint, Keynote, or Google Slides. A must-have for project managers, scrum masters, product owners, or any Agile enthusiasts aiming to educate, implement, or iterate the Agile way.


4 slides
Enterprise IT Architecture Presentation
Visualize the foundation of your organization’s technology with this sleek, layered presentation. Designed to showcase system hierarchies, integration processes, and strategic frameworks, it simplifies complex IT concepts through a clear, structured layout. Fully customizable and compatible with PowerPoint, Keynote, and Google Slides for effortless professional presentations.


7 slides
Medical Center Infographic
A medical center, often referred to as a healthcare center, is a facility or establishment where a range of medical services and care are provided to individuals in need of medical attention. This infographic template is designed to provide a comprehensive overview of the medical center, emphasizing its services, healthcare professionals, facilities, patient satisfaction, and community engagement. This infographic is fully customizable and compatible with Powerpoint, Keynote, and Google Slides. Easily customize and design this to align with your specific medical center's brand and message.


8 slides
Economic Impact on Stock Market Presentation
Illuminate your financial presentation with the "Economic Impact on Stock Market" template, ideal for displaying the interconnected influences of economic variables on market performance. These slides feature clear, visual representations through pie charts and percentage indicators, allowing for an engaging analysis of trends and impacts. This template is fully compatible with PowerPoint, Keynote, and Google Slides, ensuring versatility across different presentation platforms.


5 slides
Work Schedule Overview Presentation
Keep your week perfectly organized with this clean and modern layout designed to simplify planning and scheduling. Ideal for presenting weekly goals, tasks, or project timelines, it helps teams stay aligned and productive. Fully customizable and compatible with PowerPoint, Keynote, and Google Slides for effortless professional presentations.


6 slides
Social Media Advertising Infographic
Boost your online presence with our Social Media Advertising Infographic, compatible with PowerPoint, Google Slides, and Keynote. This dynamic template is crafted for marketers and businesses to showcase their social media strategies and ad campaigns. It includes diverse slide layouts to detail different aspects such as audience targeting, platform choice, content planning, and budget allocation. Each slide provides a clear structure to display comparative analyses, timelines, and the impact of your social media efforts. It's an ideal tool for presenting to teams, clients, or during workshops to explain the intricacies of social media marketing effectively.


8 slides
Competitive Market Strategy Presentation
Stay Ahead in the Market with this Competitive Market Strategy Presentation template. This slide helps you analyze industry competition, market positioning, and strategic advantages with a clean, engaging circular layout. Ideal for business planning, marketing strategy meetings, and competitive analysis, this template allows you to highlight key differentiators and action steps clearly. Fully customizable and available for PowerPoint, Keynote, and Google Slides.


20 slides
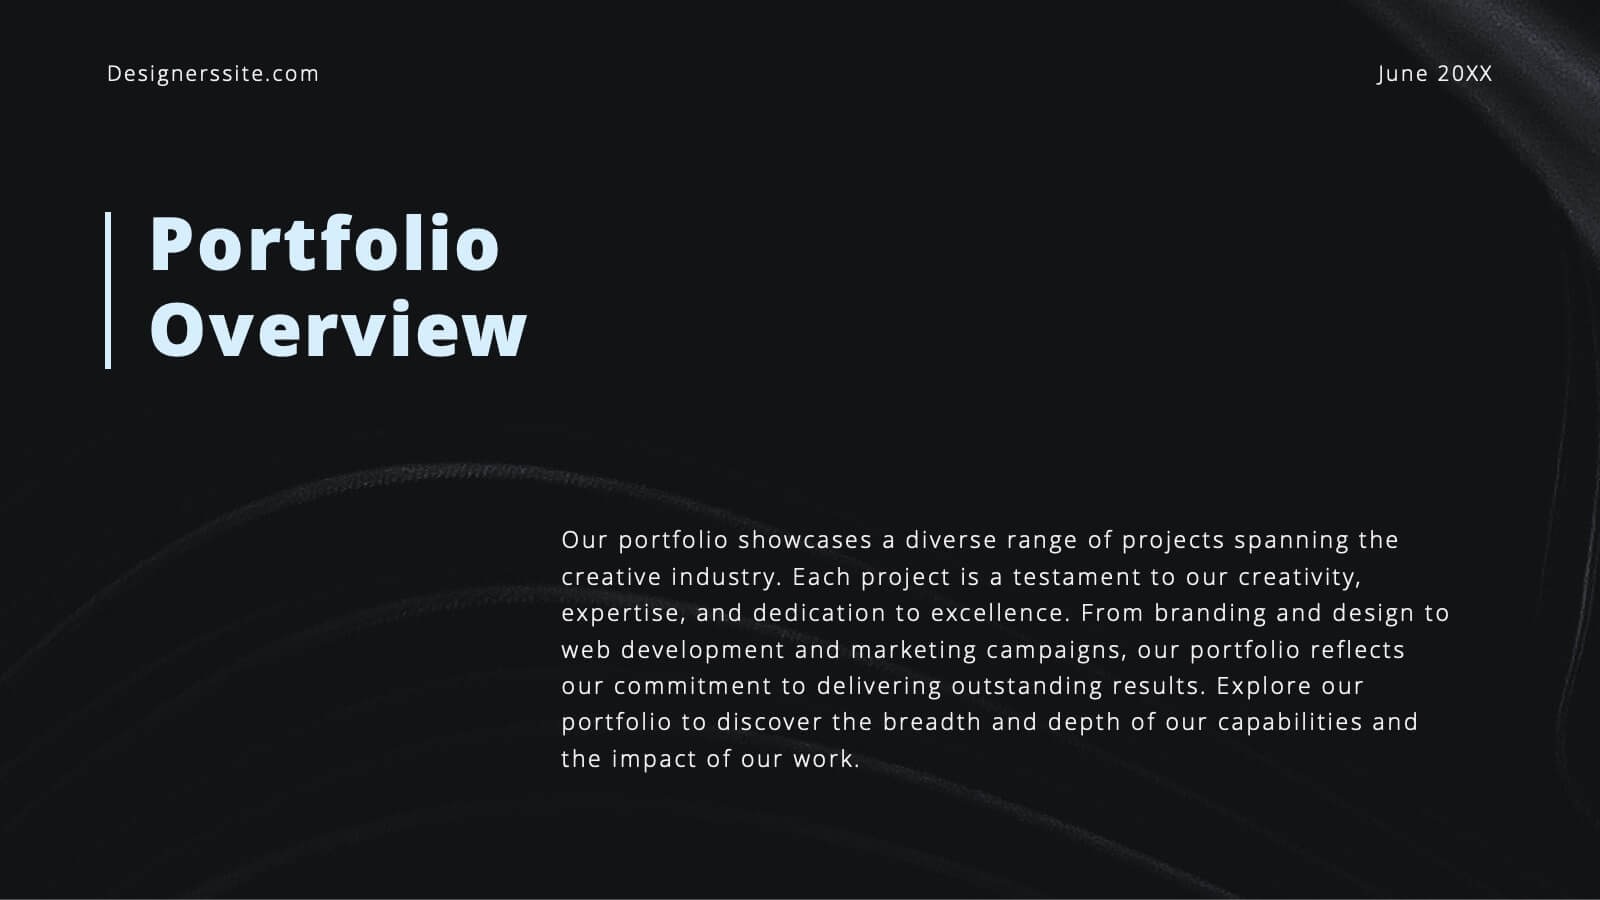
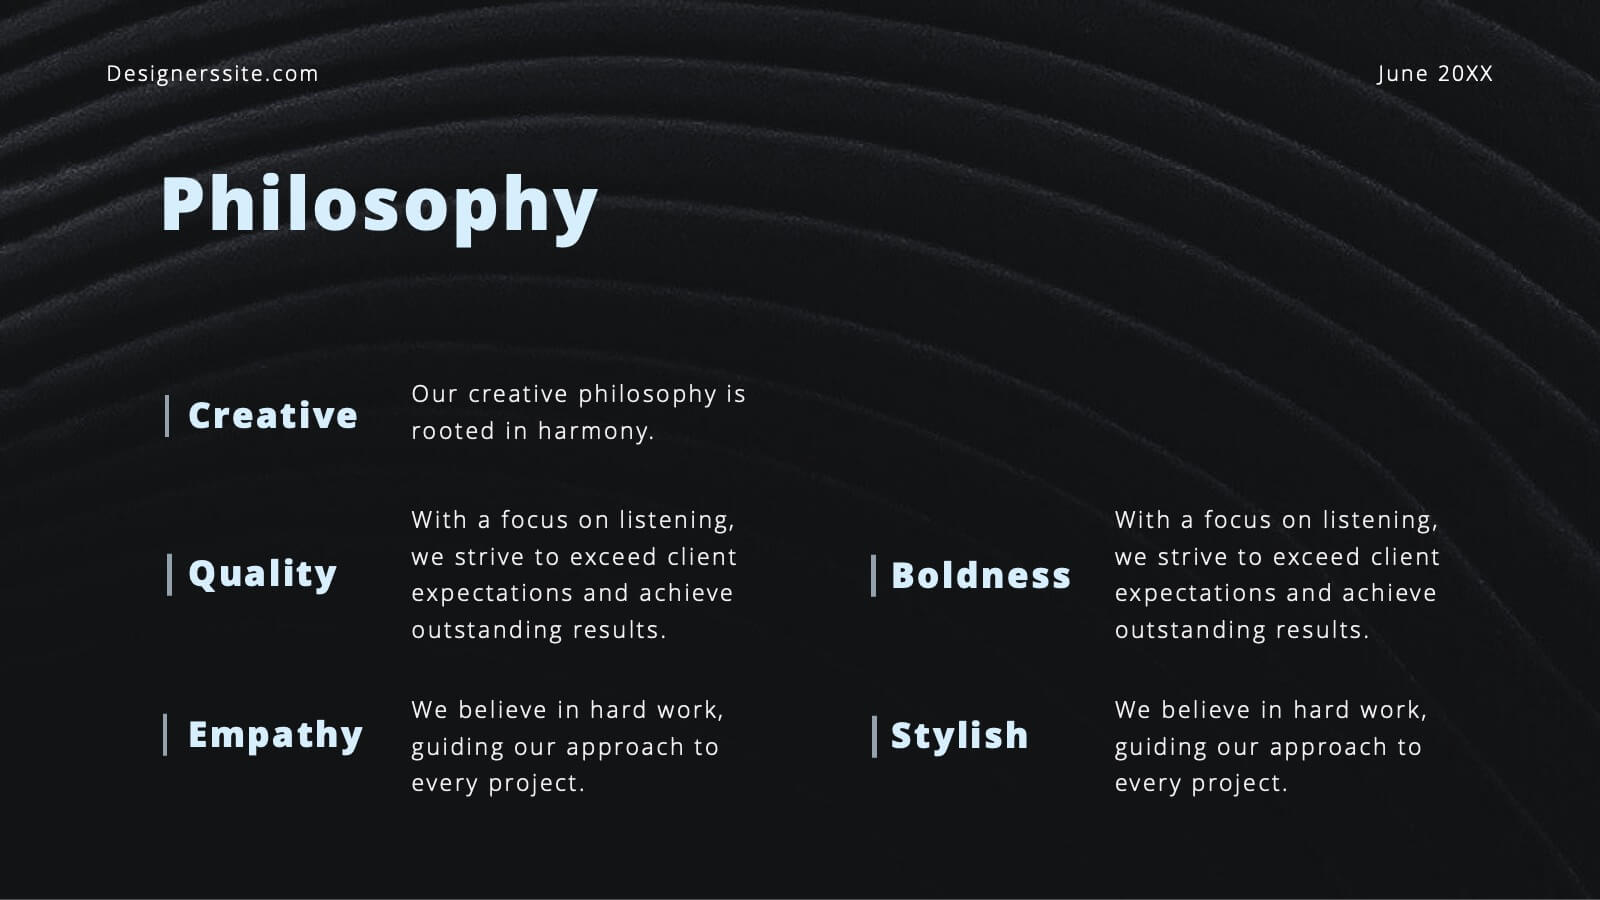
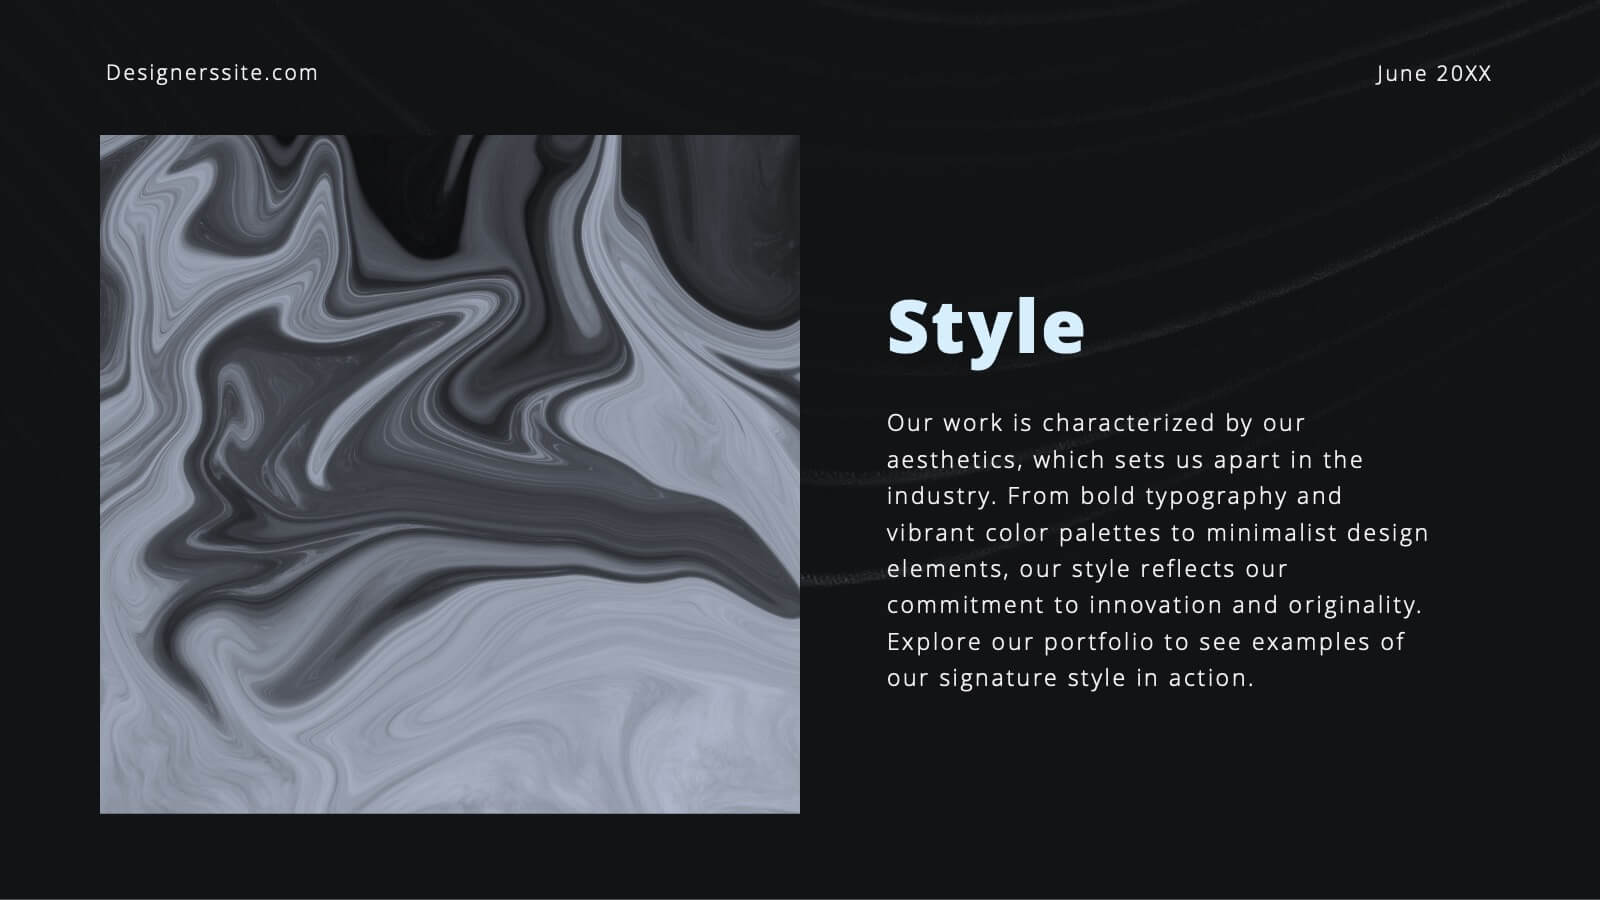
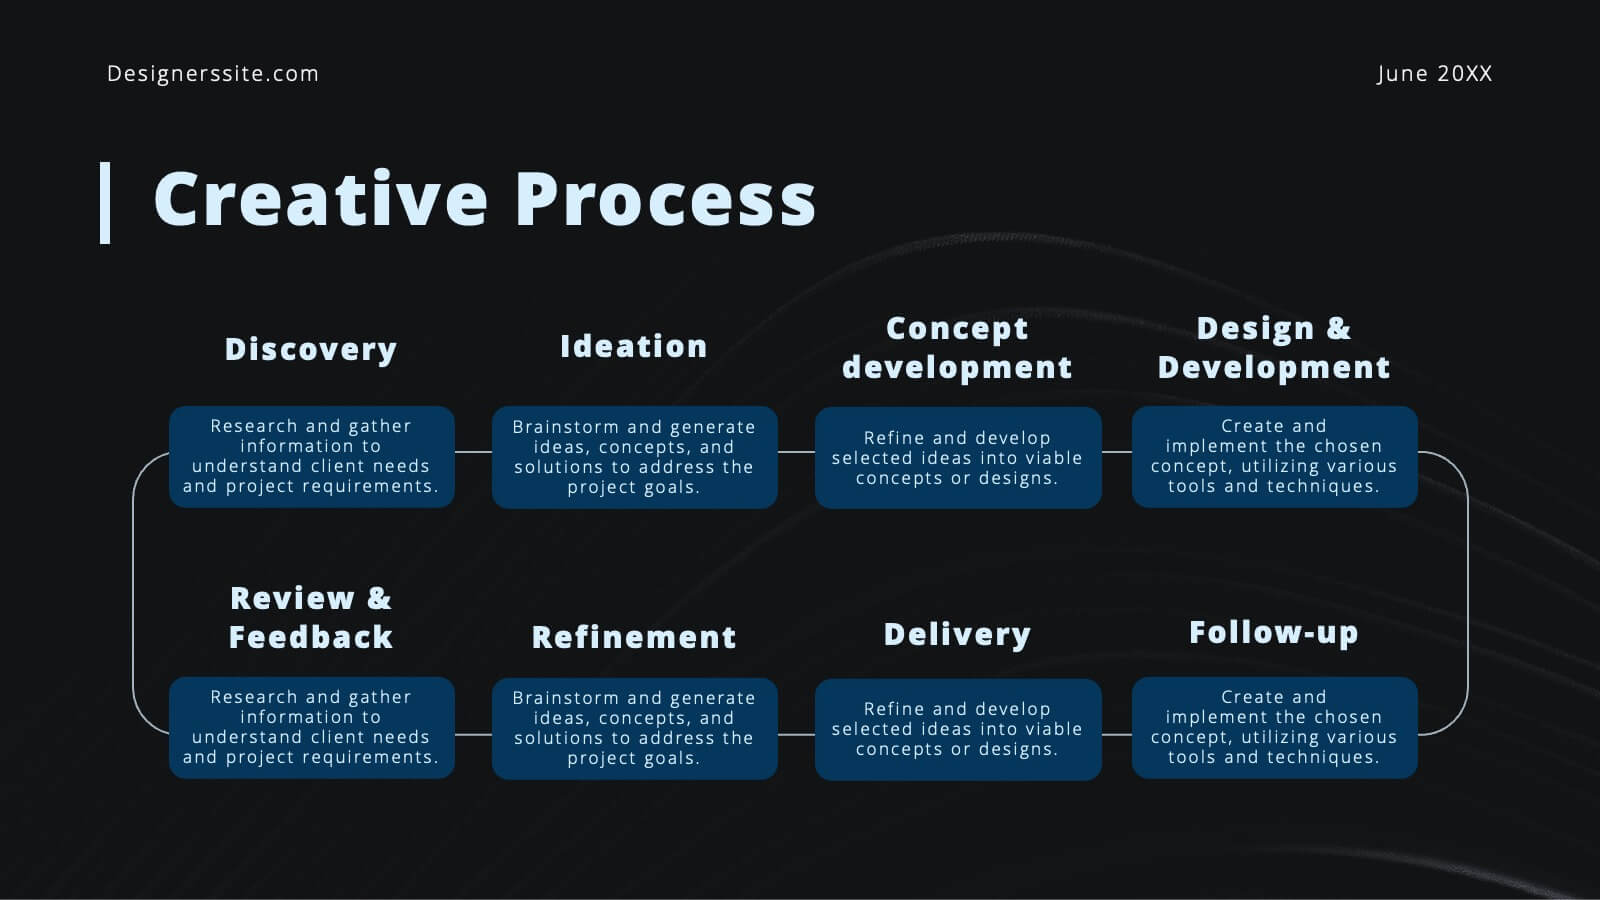
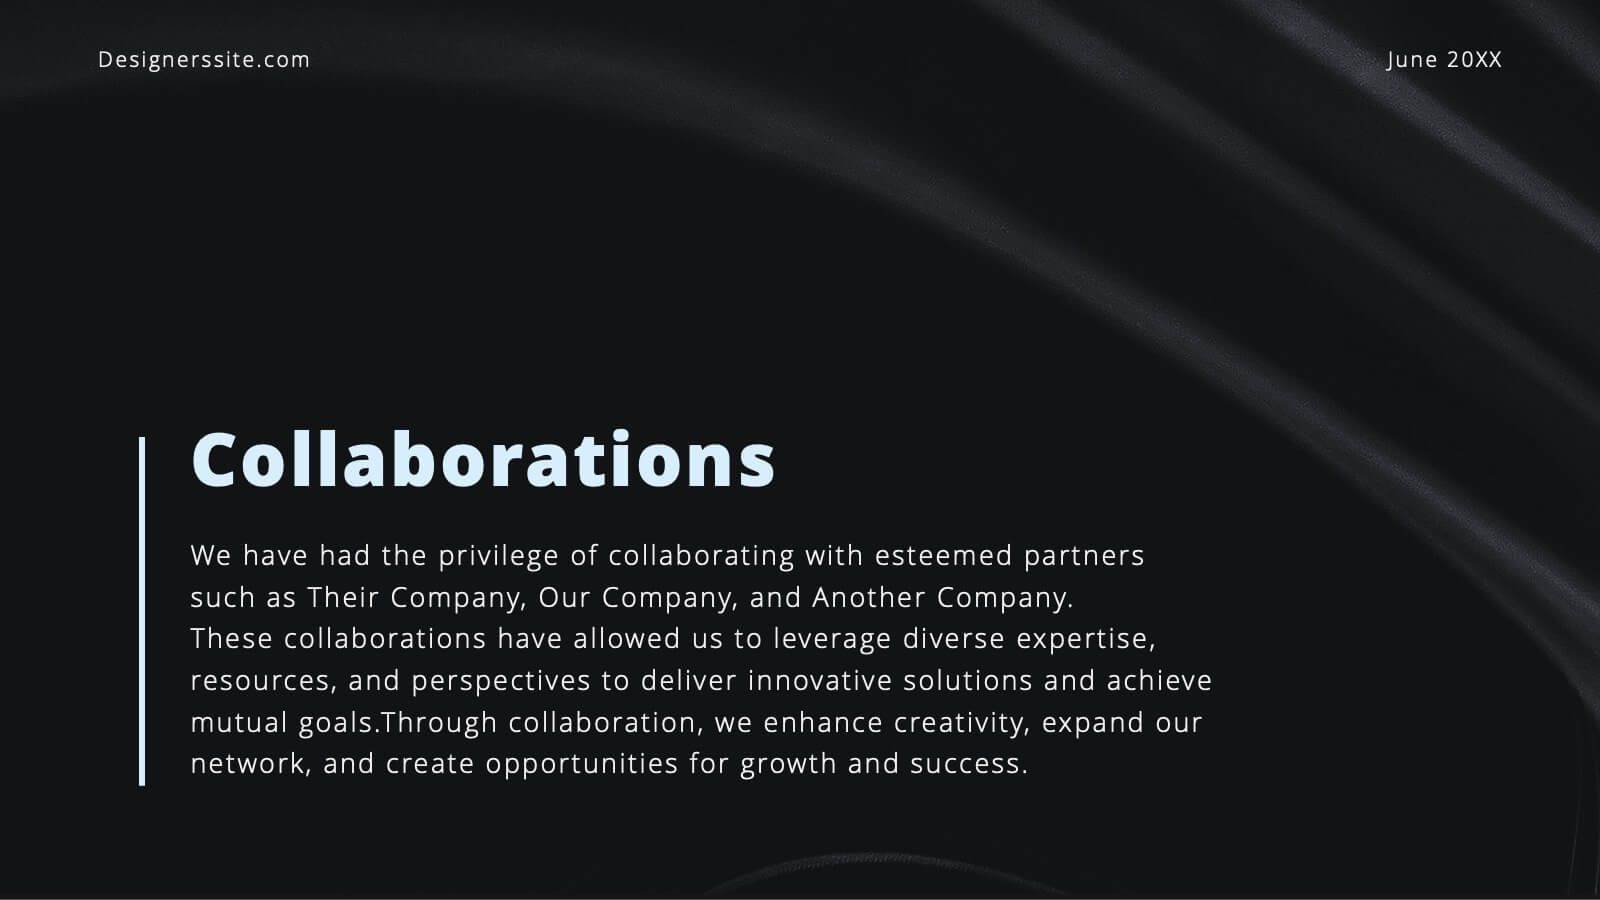
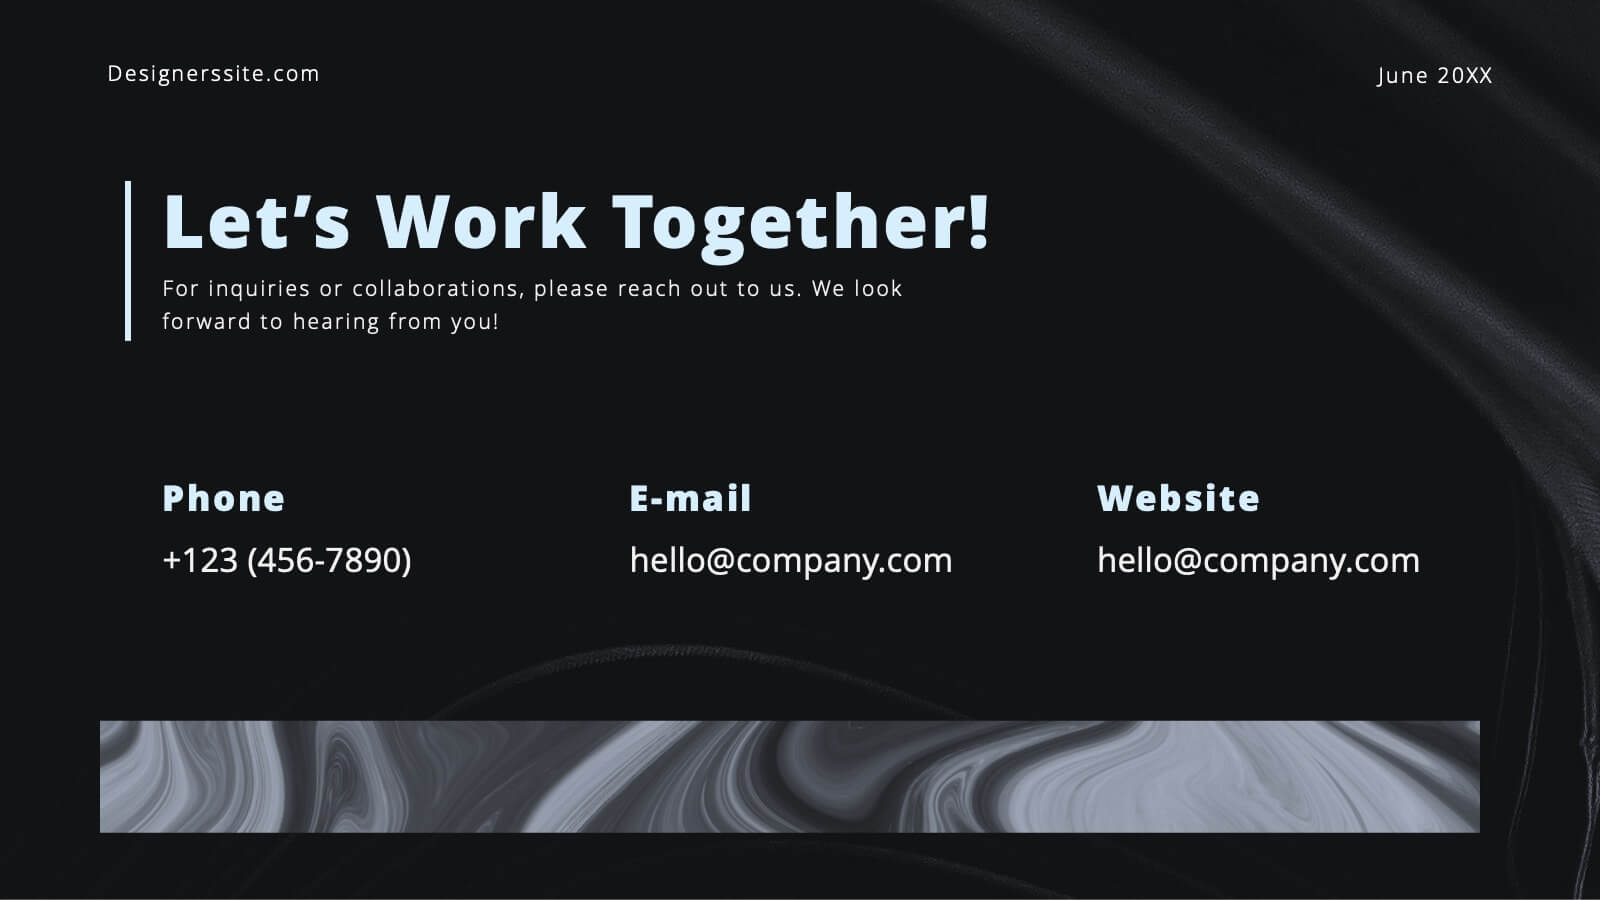
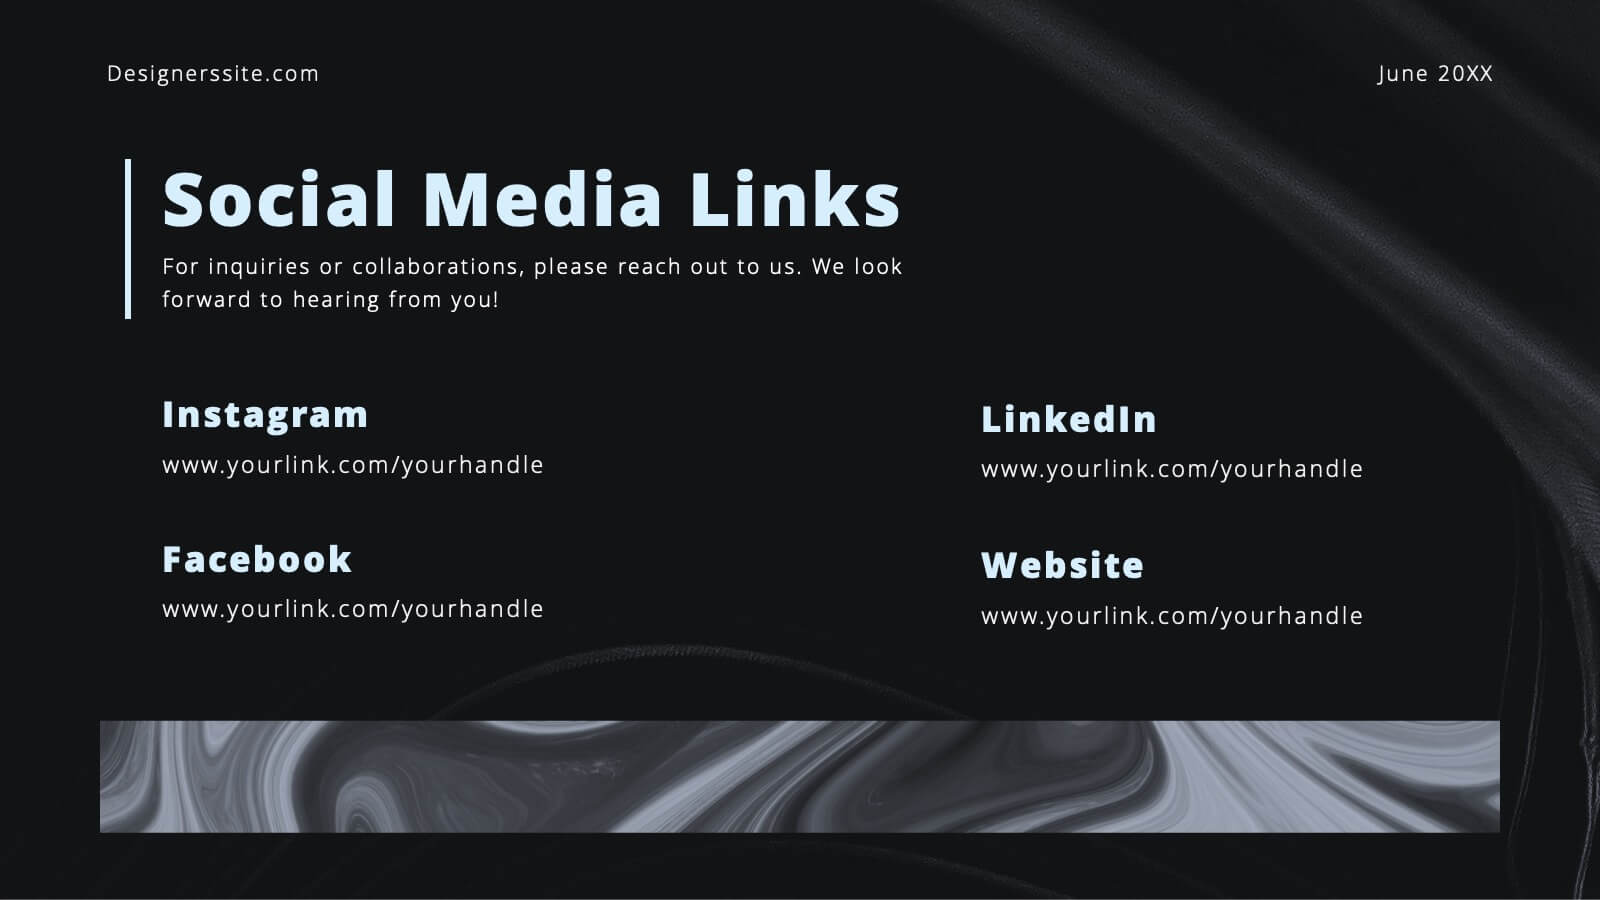
Bravo Creative Portfolio Presentation
Showcase your creative prowess with this sleek, modern portfolio presentation template. Perfect for highlighting featured projects, client testimonials, and your creative process, this template ensures your work shines. Its stylish design and professional layout make it ideal for impressing potential clients and collaborators. Compatible with PowerPoint, Keynote, and Google Slides, it's versatile for any platform.