


Features
- 4 Unique slides
- Fully editable and easy to edit in Microsoft Powerpoint, Keynote and Google Slides
- 16:9 widescreen layout
- Clean and professional designs
- Export to JPG, PDF or send by email


Do you have any questions?
Recommend


6 slides
30 60 90 Day Plan for Executives Infographics
Develop a strategic plan for executives with our customizable 30, 60, and 90 Day Plan for Executives infographic template. This template is fully compatible with popular presentation software like PowerPoint, Keynote, and Google Slides, allowing you to easily customize it to outline the key objectives and priorities for executives over these timeframes. The 30, 60, and 90 Day Plan for Executives infographic template offers a visually engaging platform to structure and communicate short-term goals, milestones, and initiatives for executive leaders. Whether you're an executive, manager, or HR professional, this template provides a user-friendly canvas to create informative presentations and strategic plans. Optimize executive performance and alignment with this SEO-optimized 30, 60, and 90 Day Plan for Executives infographic template, thoughtfully designed for clarity and ease of use. Customize it to showcase specific objectives, key projects, performance metrics, and alignment with broader organizational goals, ensuring that executives have a clear roadmap for success. Start crafting your personalized infographic today to help executives drive strategic impact in their roles.


5 slides
Process Improvement Using Five Steps Framework Presentation
Visualize progress with clarity using the Process Improvement Using Five Steps Framework Presentation. This stepped layout helps you illustrate sequential actions, milestones, or improvements across five stages. Ideal for strategy, operations, or performance initiatives. Easy to customize in PowerPoint, Keynote, Google Slides, and Canva to fit your workflow needs.


4 slides
Progress Indicators with Harvey Visuals Presentation
Track multiple projects at a glance with the Progress Indicators with Harvey Visuals Presentation. This slide design uses Harvey balls and icons to clearly communicate status across key metrics such as schedule, budget, risk, and issues. Ideal for PMOs, stakeholder updates, or cross-functional reviews. Fully editable and compatible with PowerPoint, Keynote, and Google Slides.


34 slides
Dragon Startup
Introducing our Dragon Start-up Template! This template is designed with a vibrant and energetic yellow color palette, perfect to convey a sense of optimism, creativity, and innovation. It features customizable slides that are specifically tailored for start-up presentations. The slides included cover various aspects of your pitch deck, such as company overview, problem statement, solution description, market analysis, business model, financial projections, and more. Each slide in this template is designed with a dynamic layout, featuring eye-catching yellow accents that add a sense of energy and excitement to your presentation.


4 slides
AIDA Marketing Funnel Slide Presentation
Capture attention from the very first slide with a bold, structured layout that turns each stage of your message into a clear, engaging flow. This presentation helps simplify complex decision paths and guide viewers through each step with ease. Fully editable and compatible with PowerPoint, Keynote, and Google Slides.


5 slides
Level-Based Authority Chart Presentation
Display organizational hierarchy with clarity using this level-based authority chart. The pyramid layout highlights reporting tiers, perfect for showcasing leadership roles, department levels, or team structures. Fully customizable in Canva, PowerPoint, or Google Slides—ideal for managers, HR professionals, and business consultants looking to present structured authority in a clean format.


6 slides
Wellness Program and Health Strategy Presentation
Bring your strategy to life with this clean and creative visual! This presentation template uses a six-part flower design to help you showcase your wellness goals, health strategies, or program pillars with clarity and balance. It’s fully editable and works perfectly in PowerPoint, Keynote, and Google Slides for flexible customization.


5 slides
Real Estate Investing Infographics
Real estate investing refers to the purchase, ownership, management, rental, or sale of real estate properties with the objective of generating income and/or capital appreciation. These infographic templates can be used to provide key information and insights about real estate investing. These are designed to educate individuals about the basics of real estate investing, its benefits, and important considerations to help them make informed investment decisions. These infographics are great for anyone seeking to understand the basics of real estate. Compatible with Powerpoint, Keynote, and Google Slides.


10 slides
Leadership and Team Management Presentation
Enhance team leadership with the Leadership and Team Management presentation template. Featuring a structured layout with a clear hierarchy, this template helps illustrate management strategies, team roles, and leadership principles. Perfect for business leaders, HR professionals, and trainers. Fully customizable and compatible with PowerPoint, Keynote, and Google Slides.
6 slides
Performance Tracking Heat Map Presentation
Turn performance data into bold visual stories with a sleek, bubble-style layout that highlights progress and key metrics. Ideal for showcasing results, performance reviews, or KPI tracking, this presentation helps audiences grasp insights quickly. Fully compatible with PowerPoint, Keynote, and Google Slides for seamless editing and customization.


6 slides
Achieving Career Success Presentation
Achieve your professional goals with the Achieving Career Success Presentation template. Designed for career coaches, professionals, and personal development strategists, this slide deck helps outline key milestones, success strategies, and growth trajectories in a visually compelling way. With a sleek, modern layout and clear step-by-step structure, this template is fully customizable and compatible with PowerPoint, Keynote, and Google Slides.


5 slides
Sustainable Growth and Green Policy Presentation
Showcase your eco-initiatives with the Sustainable Growth and Green Policy Presentation. This unique leaf-shaped diagram highlights four key environmental pillars—ideal for presenting climate strategies, energy policies, or green development goals. With a sleek and modern design, it’s perfect for NGOs, government briefings, or corporate sustainability reports. Editable in Canva, PowerPoint, Keynote, and Google Slides.


5 slides
Corporate Risk Assessment Framework Presentation
Streamline corporate risk evaluations with a structured framework. This Corporate Risk Assessment Framework provides a clear, organized approach to identifying, analyzing, and managing risks. Ideal for business strategists, project managers, and compliance teams. Fully customizable and compatible with PowerPoint, Keynote, and Google Slides for seamless integration into your workflow.


21 slides
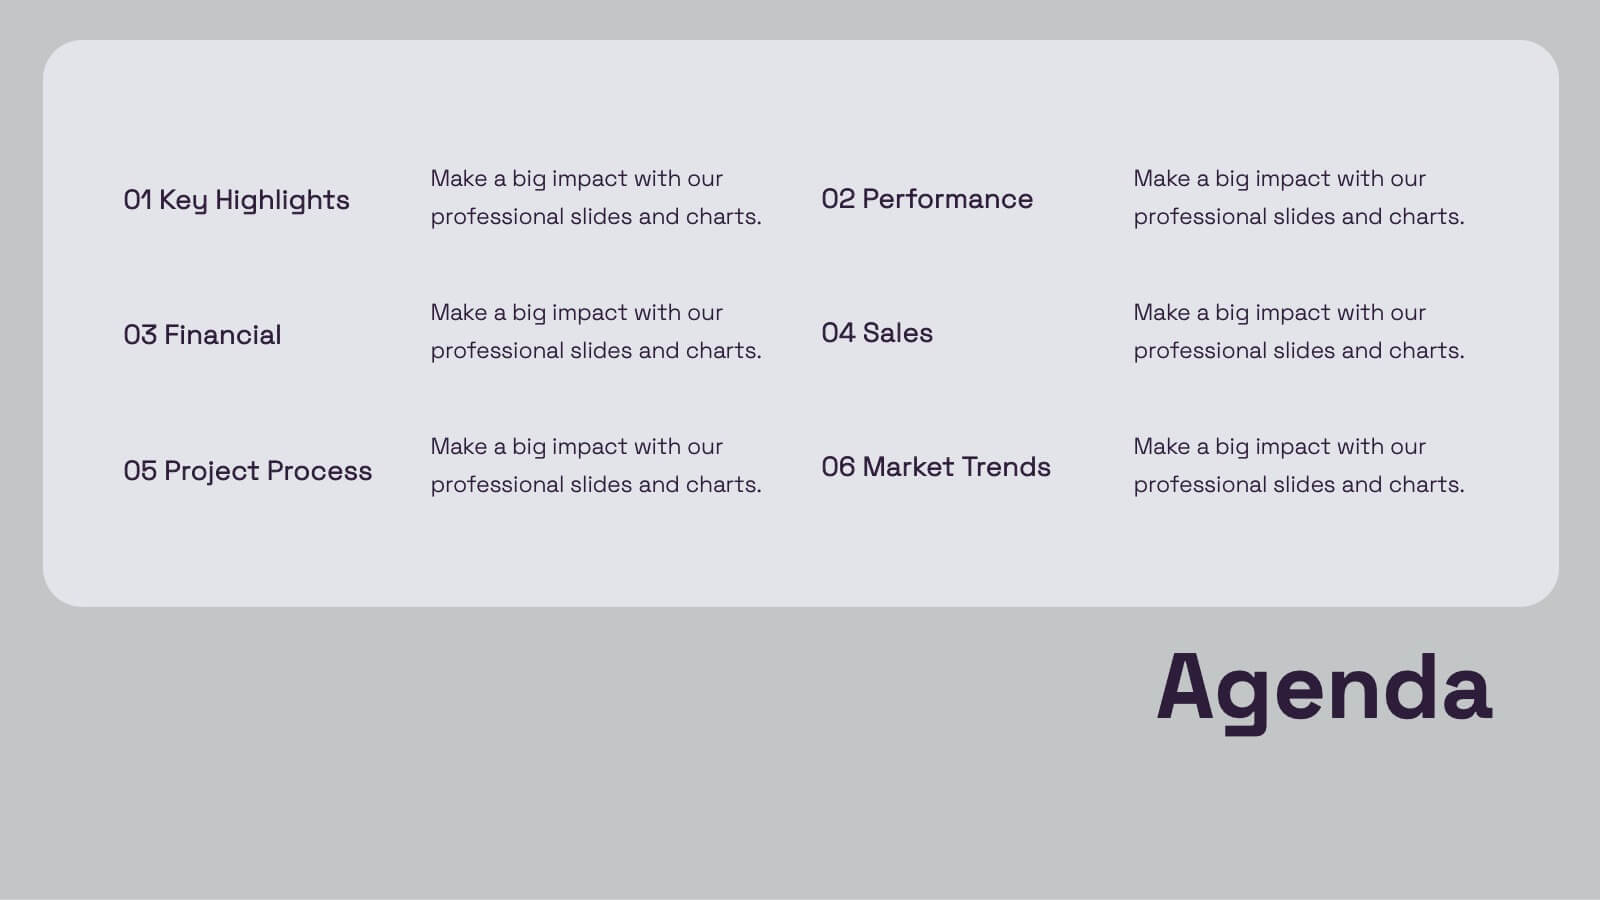
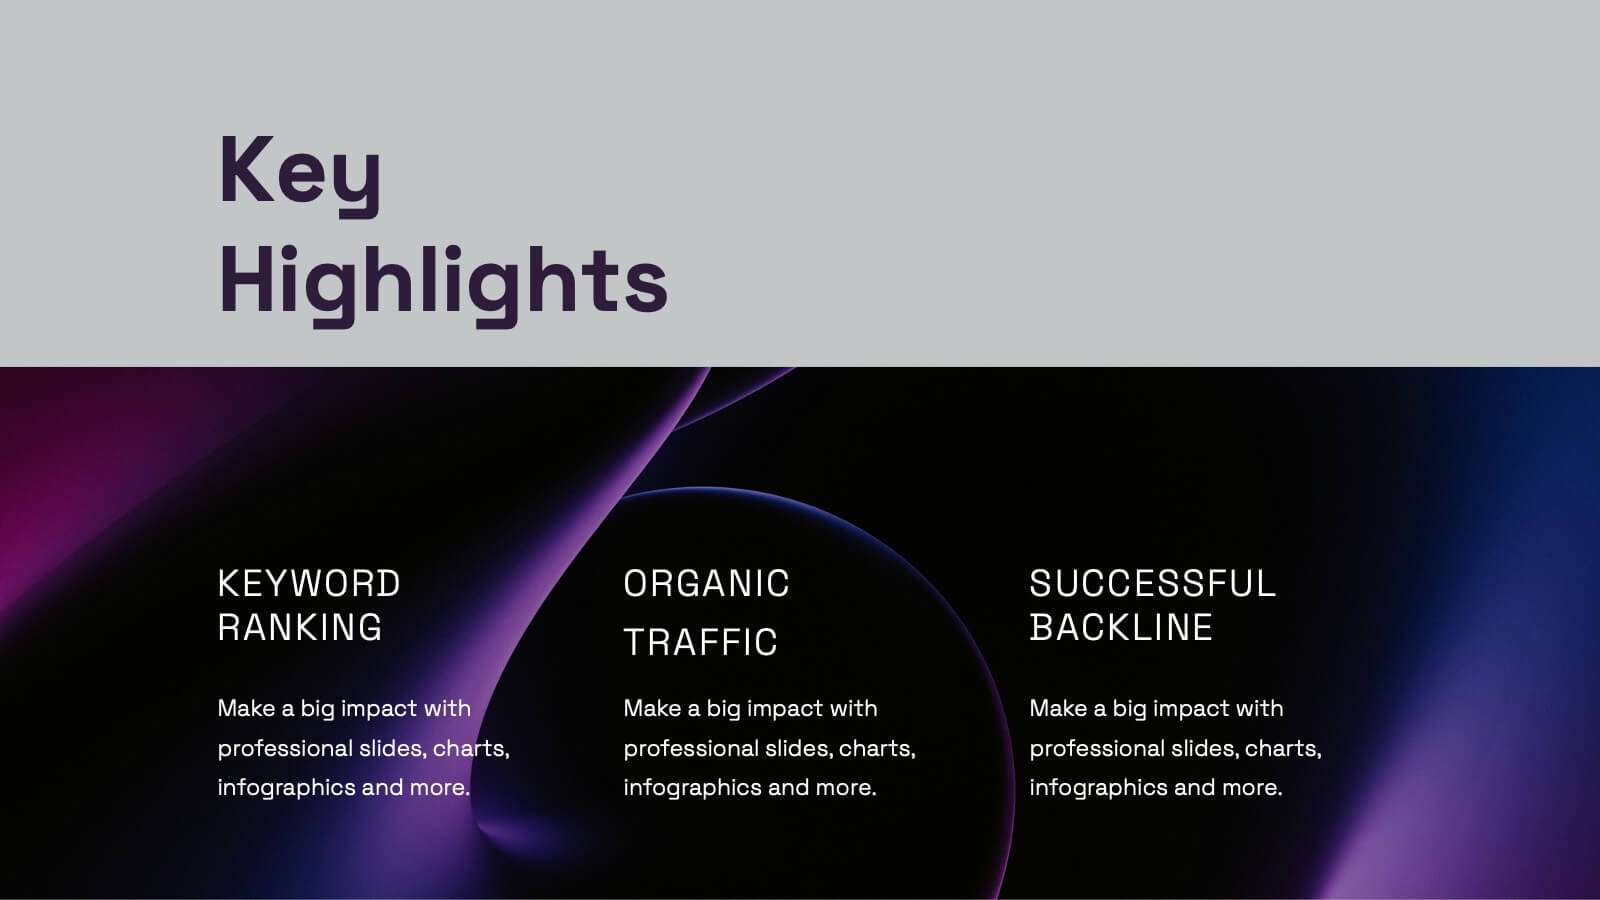
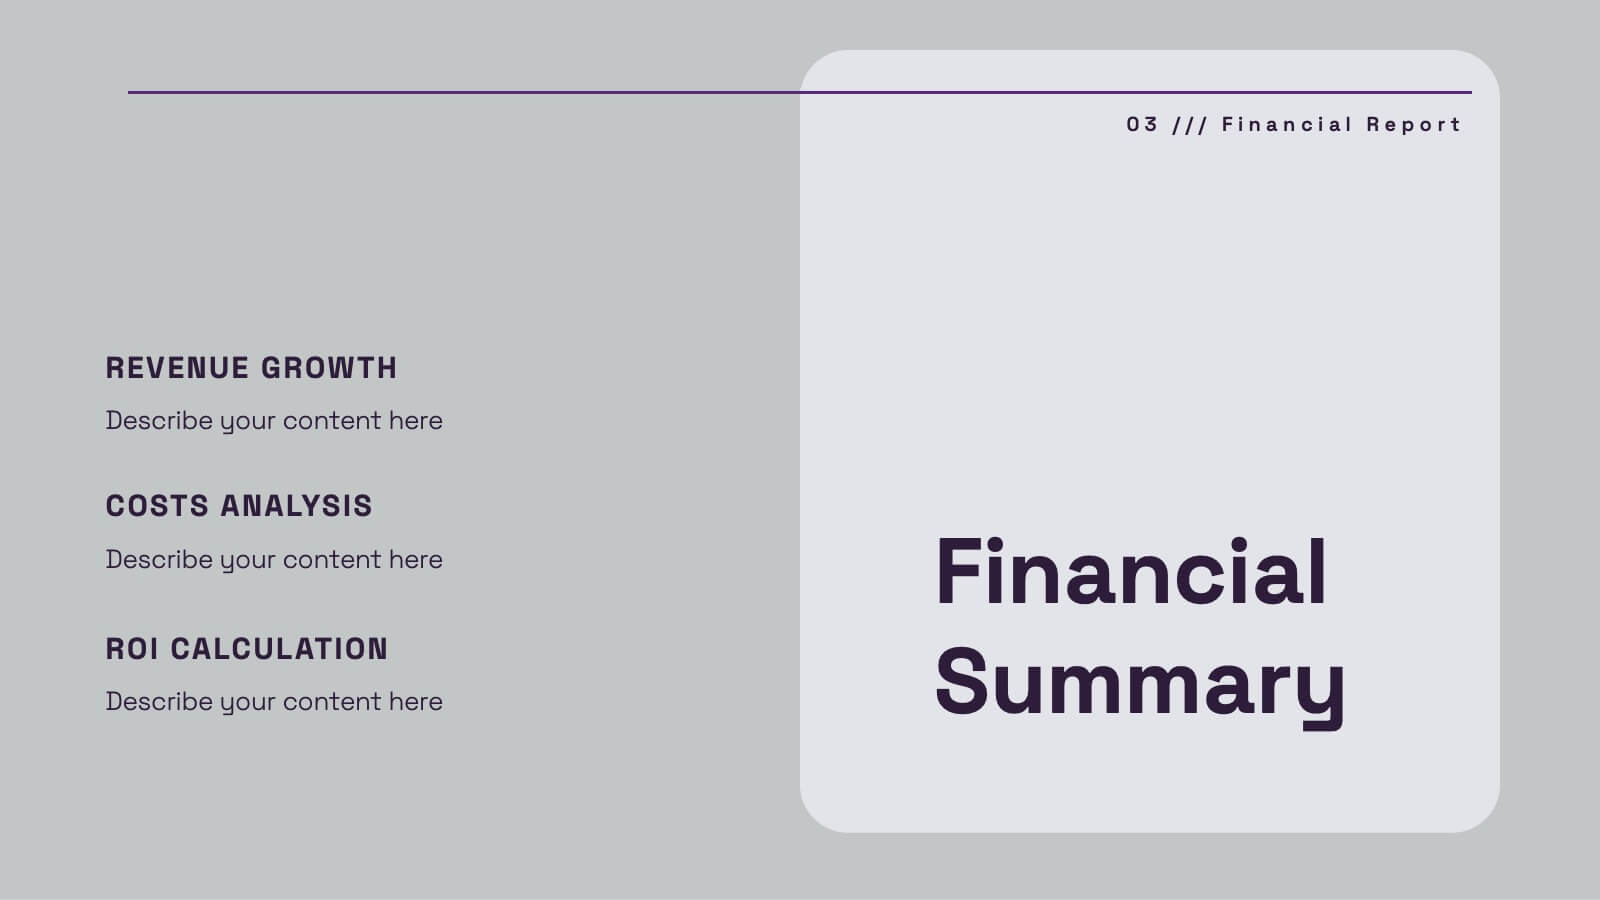
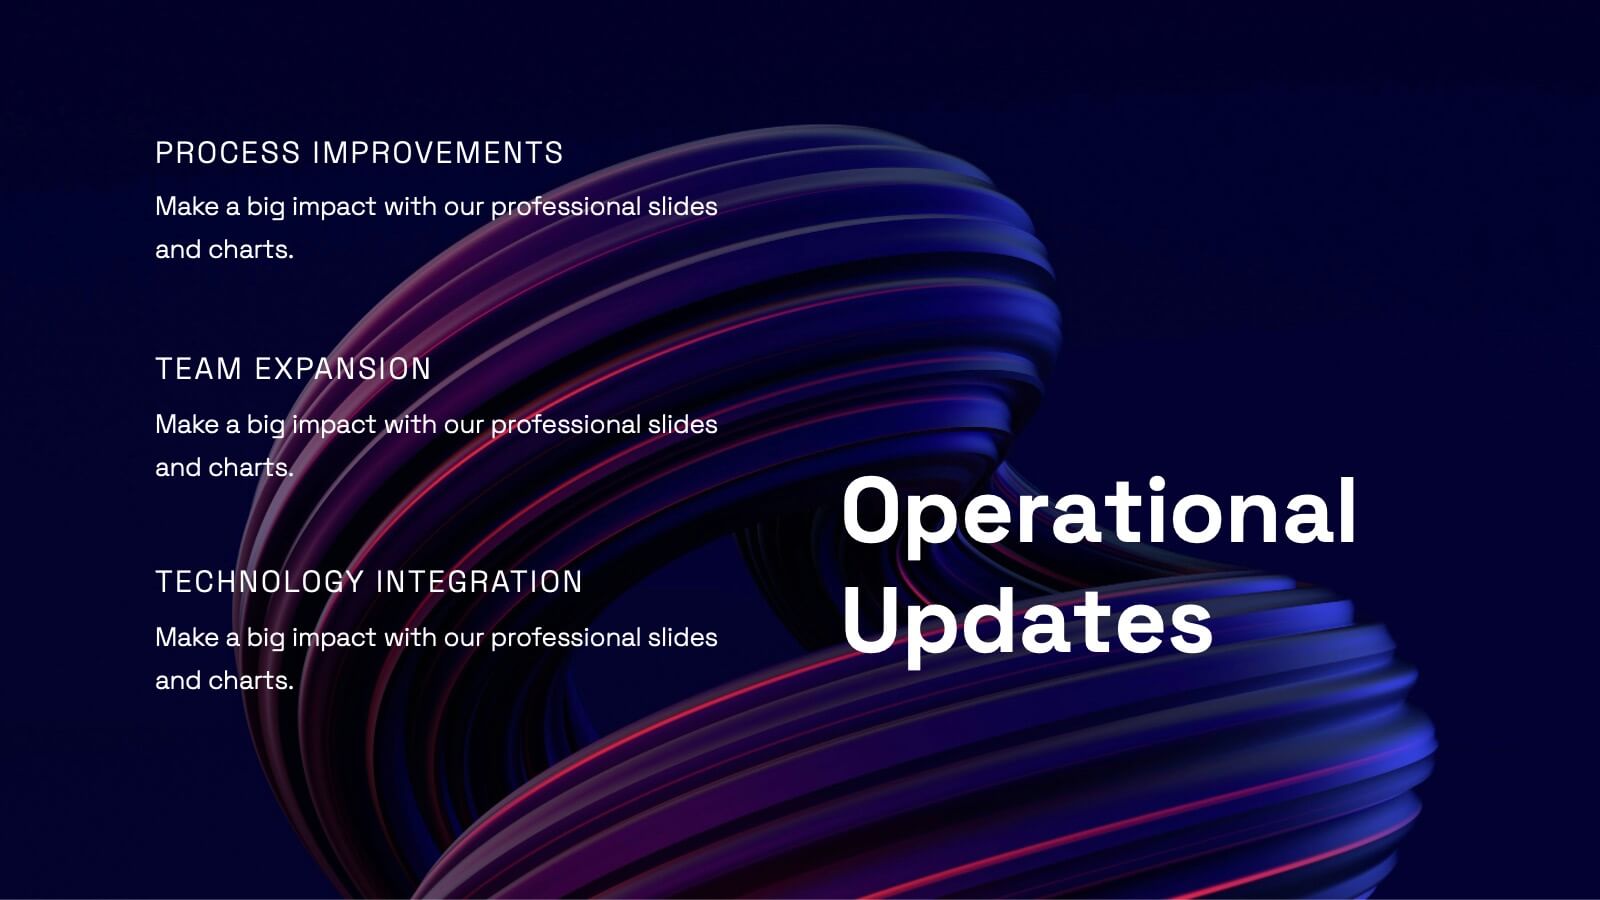
Uplift Financial Report Presentation
Present your financial or business report with this sleek and modern presentation template! It includes essential sections such as performance metrics, financial summaries, project progress, and market trends analysis, ensuring a comprehensive overview. Whether you're discussing key achievements or competitor insights, this template is perfect for delivering a professional and polished report. Compatible with PowerPoint, Keynote, and Google Slides for easy use and customization.


26 slides
Corporate Social Responsibility (CSR) Presentation
Make a difference with our Corporate Social Responsibility (CSR) presentation template, perfect for PowerPoint, Keynote, and Google Slides. This template is designed for leaders and organizations committed to ethical practices, environmental stewardship, and community engagement. Our CSR template empowers you to showcase your company's commitment to social responsibility. It provides a structured format to present your sustainability efforts, ethical initiatives, and community projects. It helps you to communicate the value of CSR to stakeholders and illustrates how responsible business practices contribute to overall success. With customizable visuals, you can highlight your CSR achievements and goals, fostering transparency and trust. This template is SEO-optimized, ensuring that your message of commitment to social responsibility reaches a broad audience. Use this template to promote your CSR strategy and demonstrate how your organization is playing a pivotal role in building a sustainable and equitable future.


5 slides
Business Objectives and Strategic Goals Presentation
Clarify your roadmap to success with this visually structured Business Objectives and Strategic Goals slide. Featuring five segmented goal icons arranged in a semi-circle layout, this template is perfect for strategic planning, quarterly reports, and team briefings. Each section allows space to detail your specific objectives with matching visuals for easy comprehension. Fully editable in PowerPoint, Keynote, and Google Slides.


6 slides
Corporate Training Plan Layout Presentation
Bring structure and clarity to your business training process with this clean and professional layout. Each gear-shaped section highlights a key stage in your program, allowing you to present goals, skills, and milestones with precision. Ideal for planning sessions or executive briefings, this template is fully compatible with PowerPoint, Keynote, and Google Slides.