


Features
- 4 Unique slides
- Fully editable and easy to edit in Microsoft Powerpoint, Keynote and Google Slides
- 16:9 widescreen layout
- Clean and professional designs
- Export to JPG, PDF or send by email


Do you have any questions?
Recommend


5 slides
Water Crisis Infographics
Navigate the pressing issues of the global water crisis with our water crisis infographics template. Rendered in profound shades of blue, this creative and vertical design emulates the urgency surrounding water-related concerns. It's an essential asset for environmental activists, and educational institutions, facilitating the dissemination of crucial data and impactful stories. Compatible with Powerpoint, Keynote, and Google Slides. This collection integrates striking graphics, thematic icons, and flexible image placeholders, designed to convey complex information on water scarcity, conservation strategies, and global impacts in an accessible, visually engaging manner.


7 slides
Porter's Five Forces Diagram
Porter's Five Forces is a strategic framework developed by Michael Porter that helps analyze the competitive environment of an industry. The five forces are represented in a diagram to understand the competitive dynamics and attractiveness of an industry or market. In this infographic template, the forces are represented as five segments of a circle or a graphical illustration with arrows and descriptions. Compatible with Powerpoint, Keynote, and Google Slides. This template is a powerful, bold, and insightful tool that dissects competitive forces, revealing strategic insights for businesses.


7 slides
Big Data Management Infographic
Step into the dynamic realm of big data with our big data management infographic. Set against a palette of green, blue, and white, this template illuminates the intricacies of managing vast amounts of information in today's digital age. Tailored for data scientists, IT professionals, business analysts, and educators, this infographic offers a clear visual breakdown of complex data processes. Its informative style ensures comprehension and engagement, making it a must-have for those aiming to demystify big data. Compatible with PowerPoint, Keynote, or Google Slides, it promises versatility in presentations.


6 slides
Problem-Solving with Design Thinking Presentation
Master complex challenges with the Problem-Solving with Design Thinking presentation. This structured layout helps visualize ideas, collaboration, and strategic solutions through an intuitive, professional design. Ideal for workshops, business innovation, and strategic planning. Fully customizable and compatible with PowerPoint, Keynote, and Google Slides for a seamless experience.


6 slides
Construction Project Management Infographic
Construction project management is the process of planning, organizing, and overseeing construction projects from inception to completion. This infographic template is designed to showcase the essential elements and processes involved in managing a construction project. It is a concise and easy-to-understand visual representation of key aspects that play a vital role in successful project execution. This provides an overview of the project's key elements, progress, and success factors. This visually appealing infographic helps in effective communication, decision-making, and project monitoring throughout the construction process.


4 slides
IT Operations Management Presentation
Enhance your IT strategy with the IT Operations Management Presentation template. This clean, modern slide layout helps illustrate key operational processes, performance metrics, and strategic improvements with an easy-to-follow, upward trajectory design. Ideal for IT managers and business leaders looking to showcase efficiency, scalability, and innovation. Fully editable in PowerPoint, Keynote, and Google Slides for seamless customization.


3 slides
Clear Navigation Table of Content Presentation
Streamline your presentation flow with this Clear Navigation Table of Content layout. Featuring labeled sections, visual cues, and photo placeholders, this slide helps guide your audience through key topics. Perfect for reports, proposals, or training decks. Fully customizable in PowerPoint, Keynote, and Google Slides for seamless integration and personalization.


22 slides
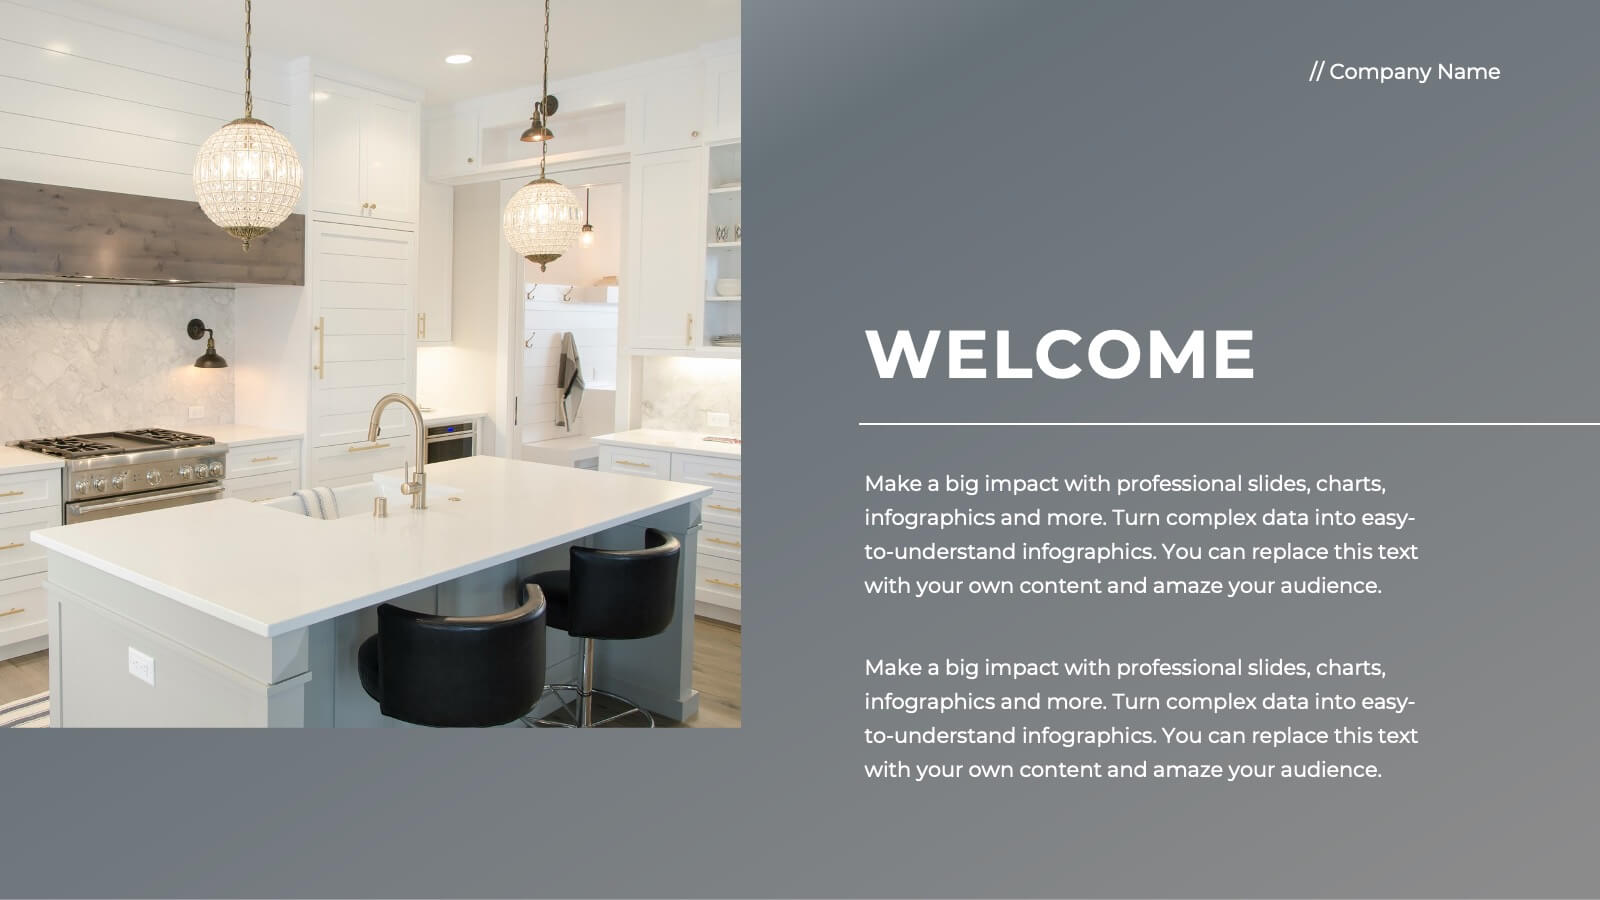
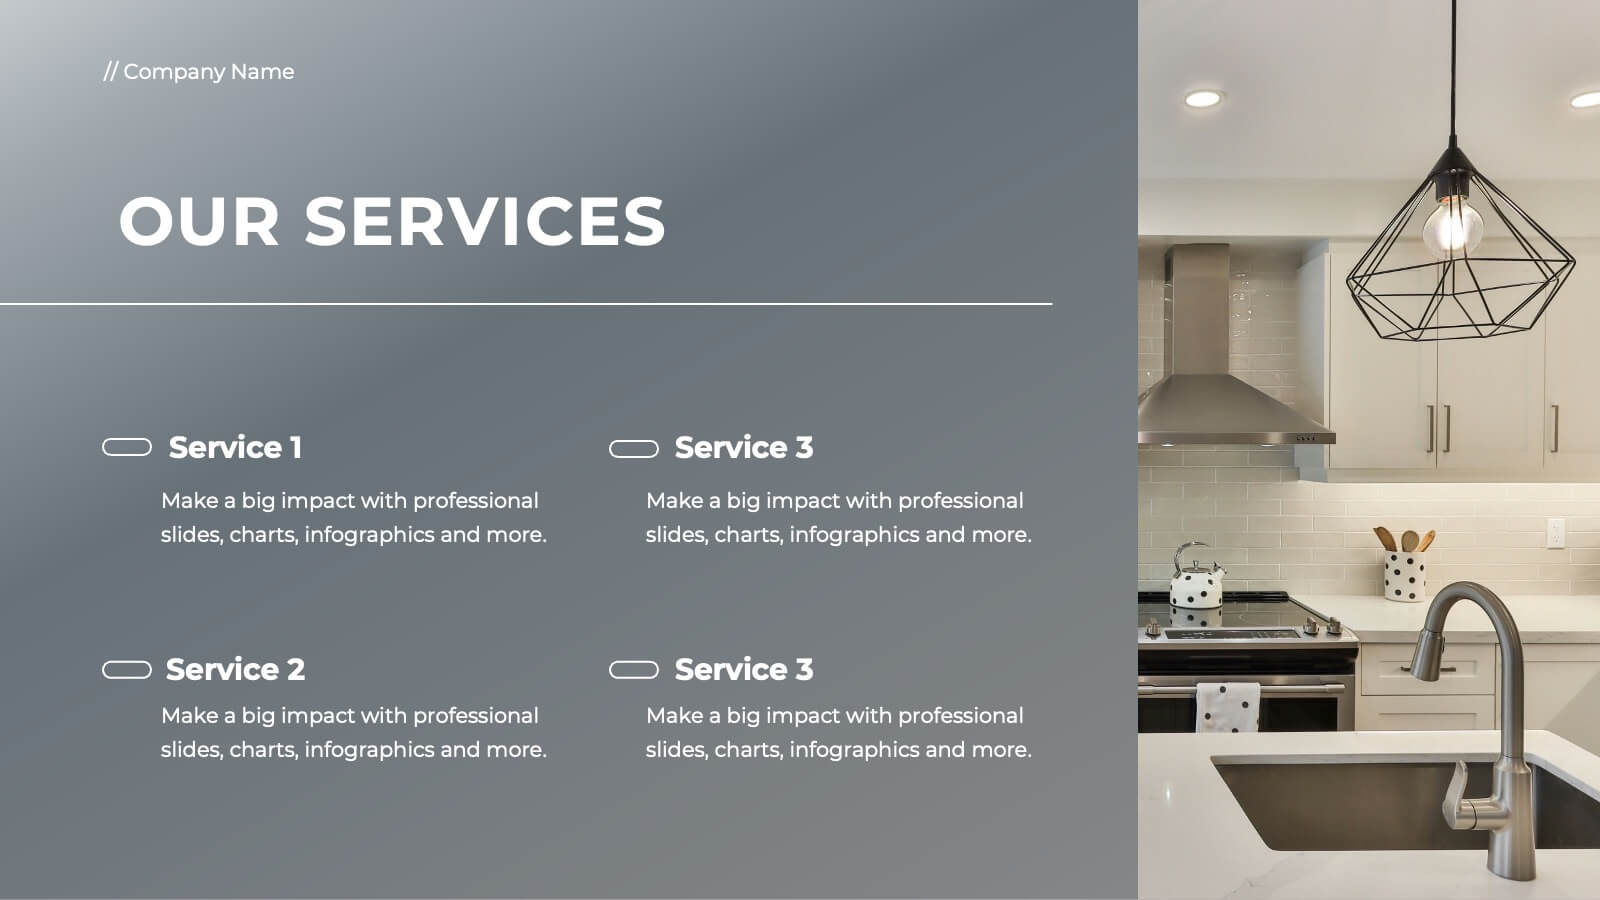
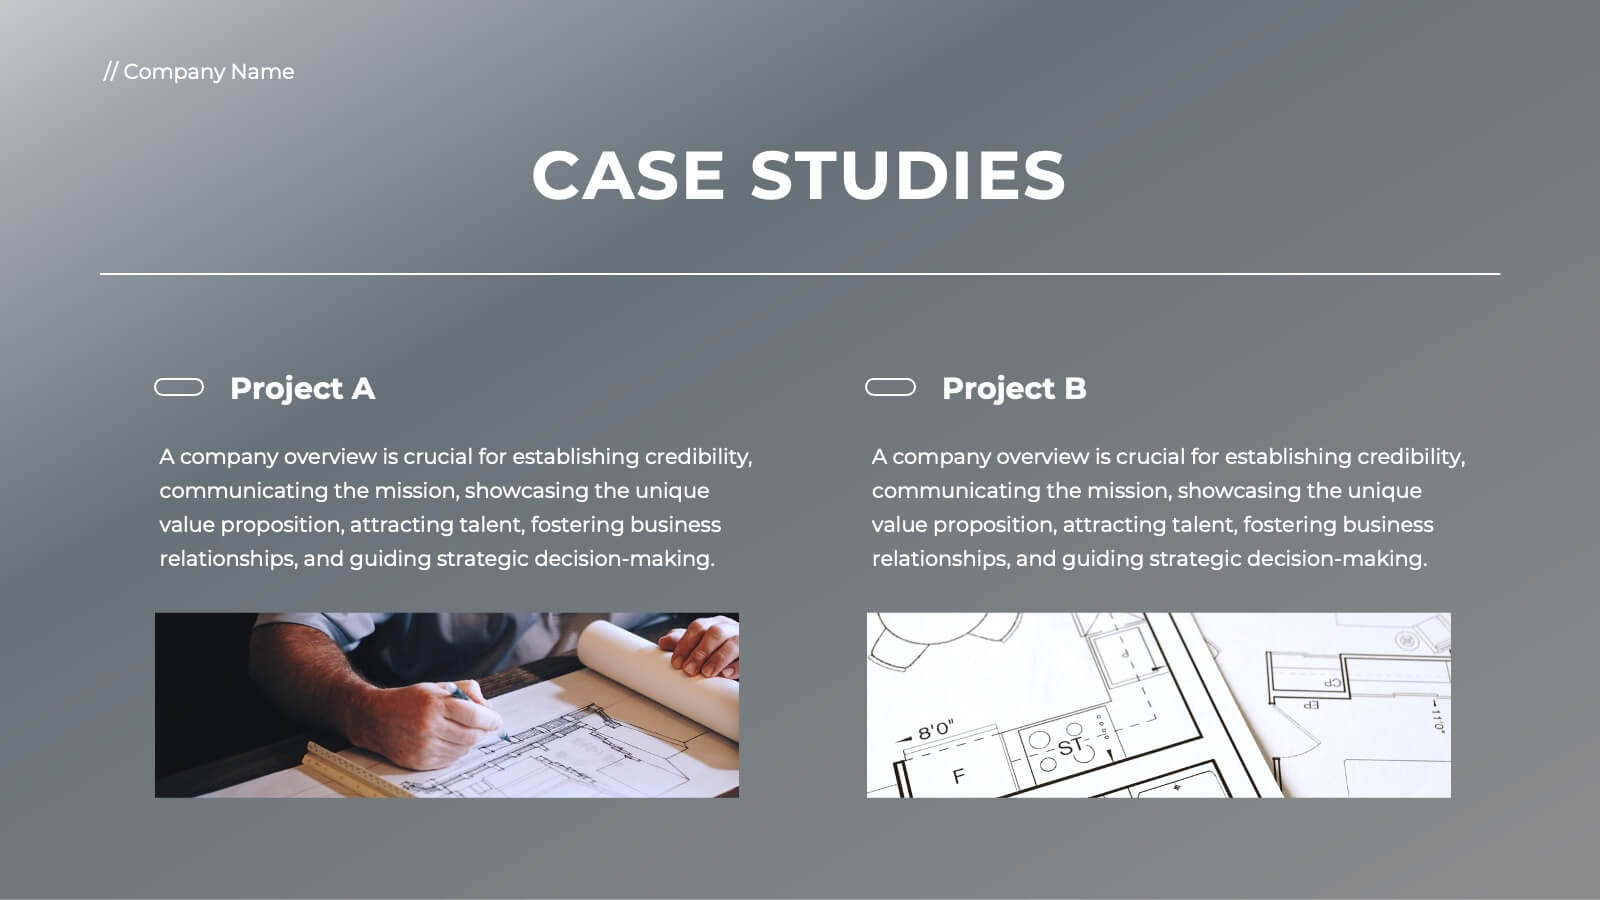
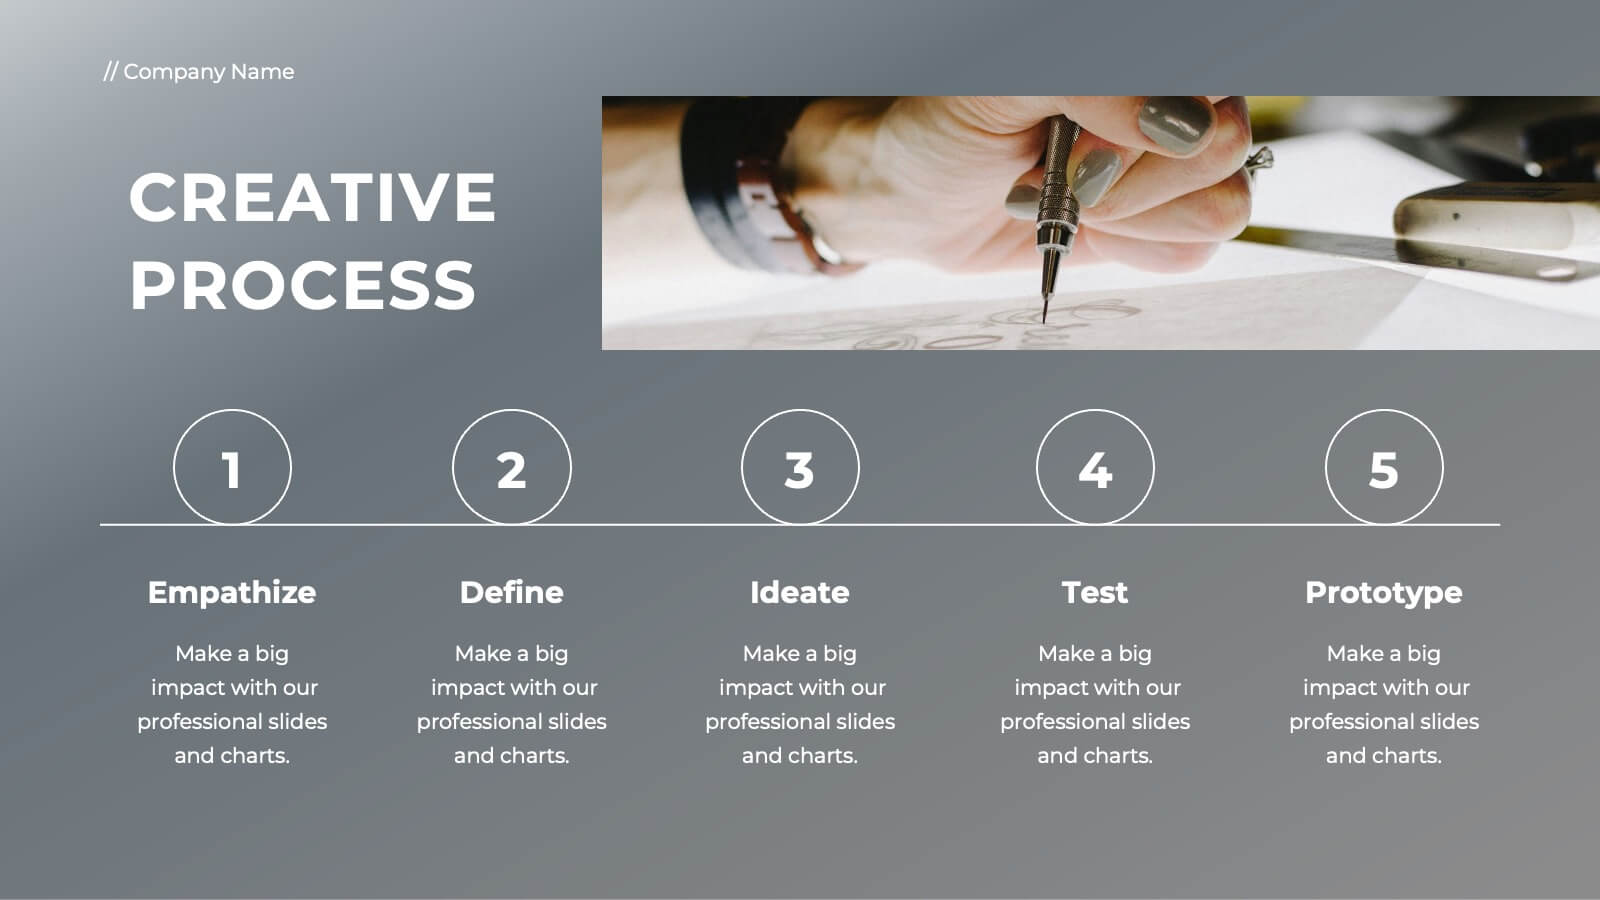
Ember Full-Service Agency Project Plan Presentation
Elevate your agency's presentation with this sleek project plan template! Ideal for showcasing your team's vision, market analysis, and client success stories, it includes slides for strategic development, campaign execution, and partnerships. Impress clients and stakeholders with professional visuals and detailed content. Compatible with PowerPoint, Keynote, and Google Slides for seamless presentations on any platform.


6 slides
North America Market Map Infographic
North America is the third largest continent in the world and home to over 50 countries, with a population of over 400 million. This infographic template is designed to show you where each country is located within North America, as well as its population, annual GDP per capita, and other important data points that make it unique. This template is the perfect tool for navigating the international market. This infographic map allows you to get a bird's eye view of how your business is performing across the region, and what areas need more attention. Fully customizable and compatible with Powerpoint, Keynote, and Google Slides.


5 slides
Risks Assessment Matrix Presentation
Visualize risk like never before with a clear, color-coded grid that helps you evaluate impact, likelihood, and priority in seconds. Perfect for project planning, compliance reviews, or business strategy sessions, this presentation makes complex assessments simple. Fully compatible with PowerPoint, Keynote, and Google Slides for effortless editing.


6 slides
5-Step SEO Marketing Funnel Presentation
Ignite your marketing story with a bold, flowing visual that makes every step feel purposeful and easy to follow. This presentation breaks down each stage of the SEO funnel, helping you explain strategy, performance, and conversion paths with clarity. Fully compatible with PowerPoint, Keynote, and Google Slides.


4 slides
AI Trends and Use Cases Presentation
Step into the future with a clean, modern layout that makes complex technology easy to grasp and exciting to explore. This presentation helps you break down emerging innovations, real-world applications, and industry opportunities using clear visuals and structured sections. Fully customizable and compatible with PowerPoint, Keynote, and Google Slides.


12 slides
Employee Feedback Smile Score Presentation
Track employee sentiment with this engaging employee feedback smile score template! Featuring a visually intuitive gauge design, this layout helps HR teams and managers assess workplace satisfaction and identify areas for improvement. Ideal for performance reviews, team surveys, and organizational assessments. Fully customizable and compatible with PowerPoint, Keynote, and Google Slides.


4 slides
Visual Decision-Making with Harvey Balls
Make smart decisions faster with this clean and strategic Harvey Balls layout. Ideal for comparing key business factors or project options, this slide helps illustrate progress and priorities through four percentage-based visuals. Fully customizable in PowerPoint, Keynote, and Google Slides.


5 slides
Search Engine Ranking Presentation
The Search Engine Ranking Presentation template is designed to clearly communicate strategies for improving search engine optimization (SEO). This template visually outlines key concepts in SEO such as enhancing site visibility, optimizing content, reducing bounce rates, and improving branding through intuitive graphical elements and concise bullet points. Each section of the template focuses on a specific aspect of SEO strategy, such as "Improved," "Reduce," "Increase," and "Branding," making it an invaluable tool for marketers looking to present actionable insights. This presentation is perfect for SEO specialists, digital marketers, and content managers aiming to educate teams or clients on the intricacies of boosting online presence effectively.


4 slides
Green Business and Climate Goals Presentation
Bring your sustainability message to life with a fresh and vibrant layout that guides viewers through key milestones. This template helps communicate eco-friendly initiatives and climate strategies in a simple timeline format. Ideal for showcasing goals, progress, and impact. Fully compatible with PowerPoint, Keynote, and Google Slides for easy editing.


4 slides
Machine Learning Overviews Presentation
Bring your audience into the world of intelligent automation with a bold, visual layout that makes complex concepts feel simple and engaging. This presentation breaks down key processes, workflows, and insights using clear graphics that support your message. Fully customizable and compatible with PowerPoint, Keynote, and Google Slides.