Benefits of Good Nutrition Infographics
PowerPoint Template and Google Slides Theme


Features
- 4 Unique slides
- Fully editable and easy to edit in Microsoft Powerpoint, Keynote and Google Slides
- Vertical widescreen layout
- Clean and professional designs
- Export to JPG, PDF or send by email
- Remove from favorites
Powerpoint Template
1 MB
Google Slides Template
External link
Keynote Template
1 MB
Recommend
- Remove from favorites
Powerpoint Template
1 MB
Google Slides Template
External link
Keynote Template
2 MB
6 slides
Comparative Analysis with Butterfly Chart Presentation
The "Comparative Analysis with Butterfly Chart" presentation template offers a visually striking way to compare and contrast data between two entities, such as Supplier A and Supplier B, across multiple variables. This format is particularly useful for presentations aiming to showcase cost comparisons, performance evaluations, or any side-by-side metric analysis in a concise and impactful way. Each variable is represented by a row of circles, where the color intensity and the number of circles filled can denote different levels of achievement or value, making it clear at a glance where strengths and disparities lie.
- Remove from favorites
Powerpoint Template
1 MB
Google Slides Template
External link
Keynote Template
1 MB
6 slides
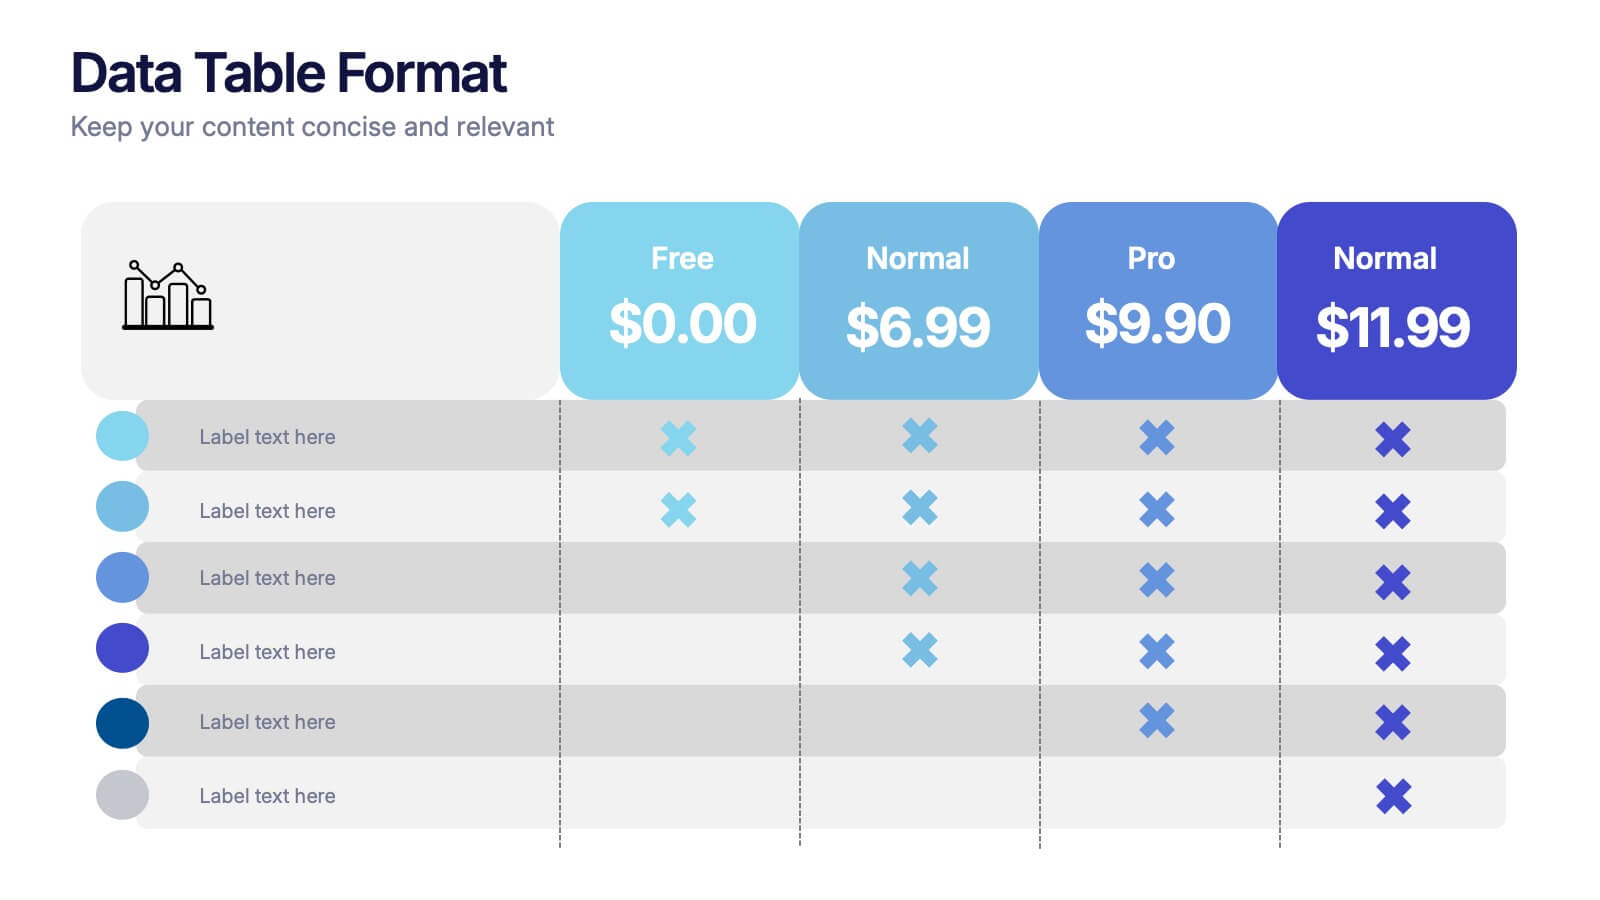
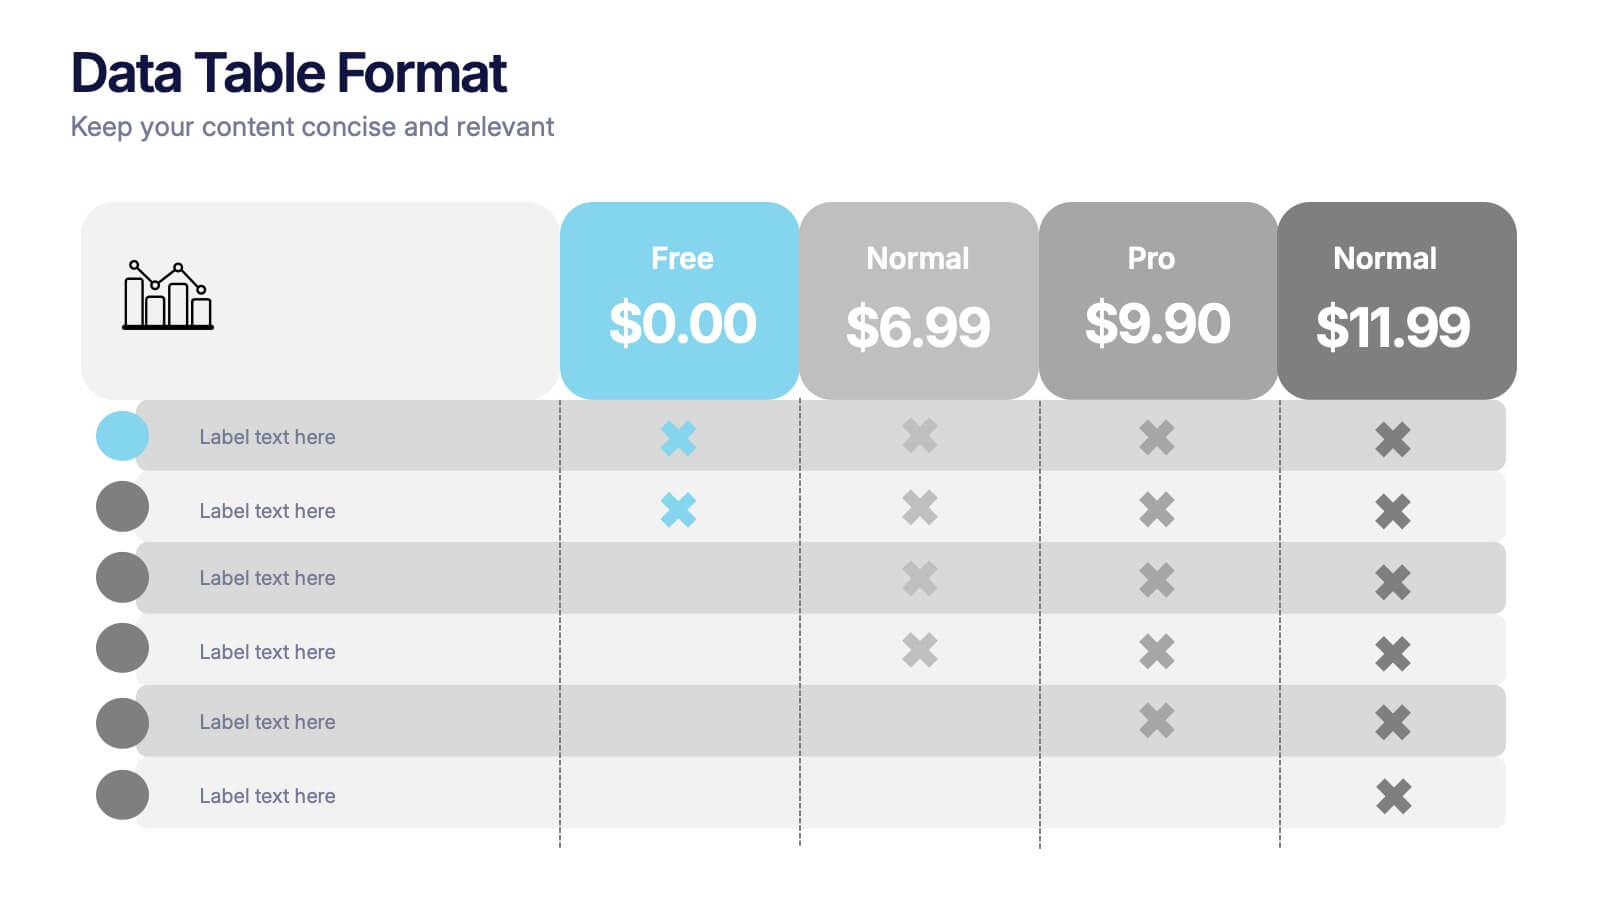
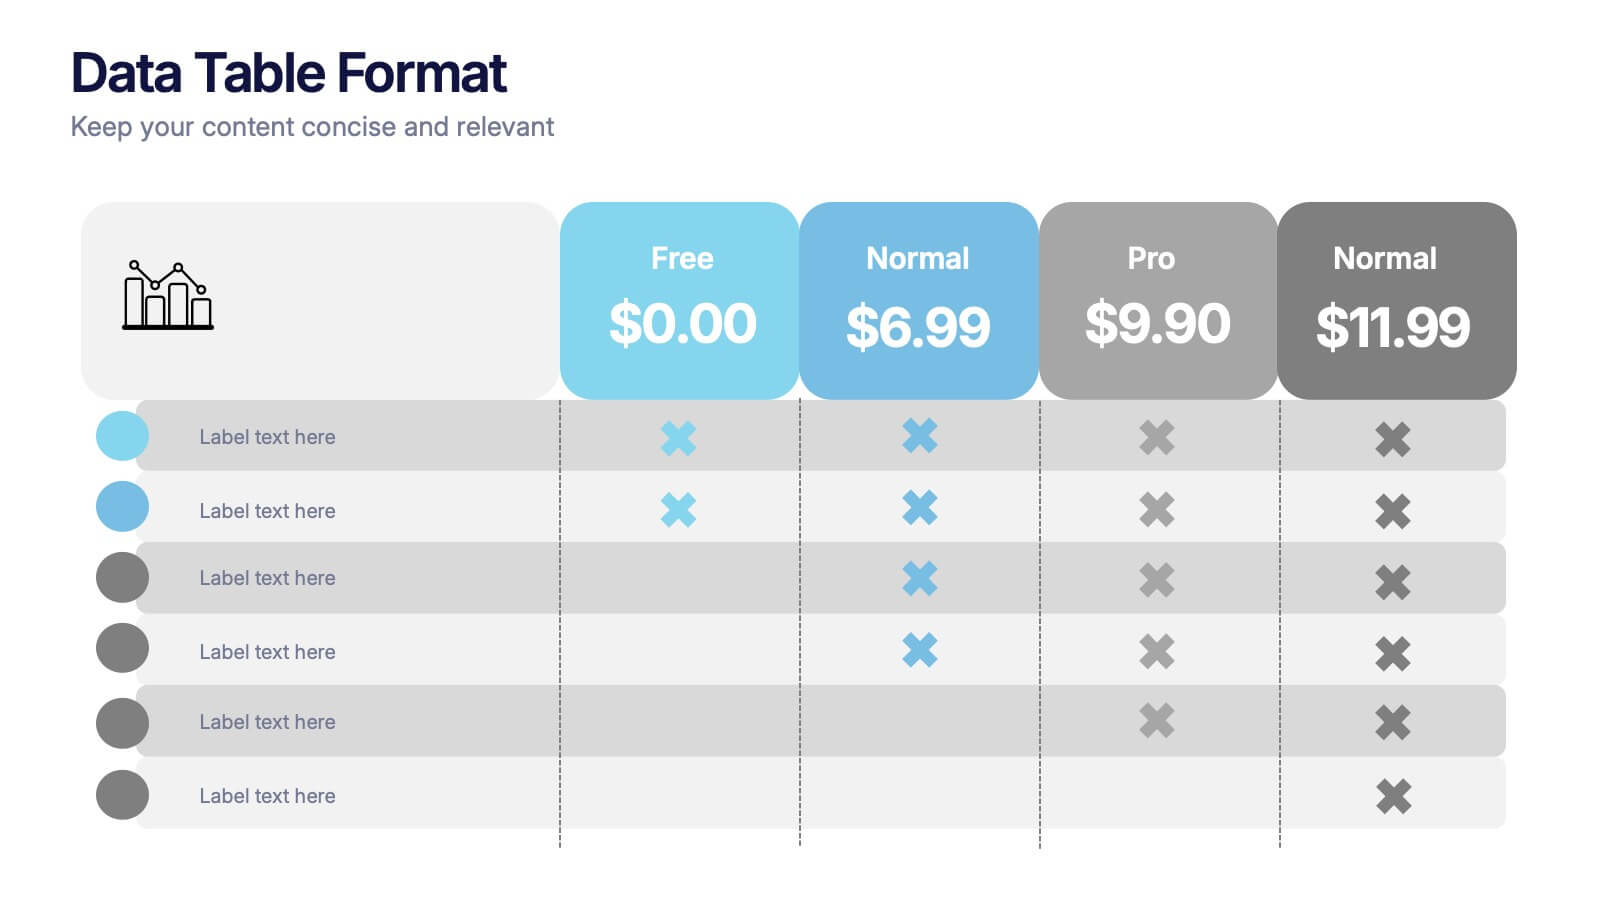
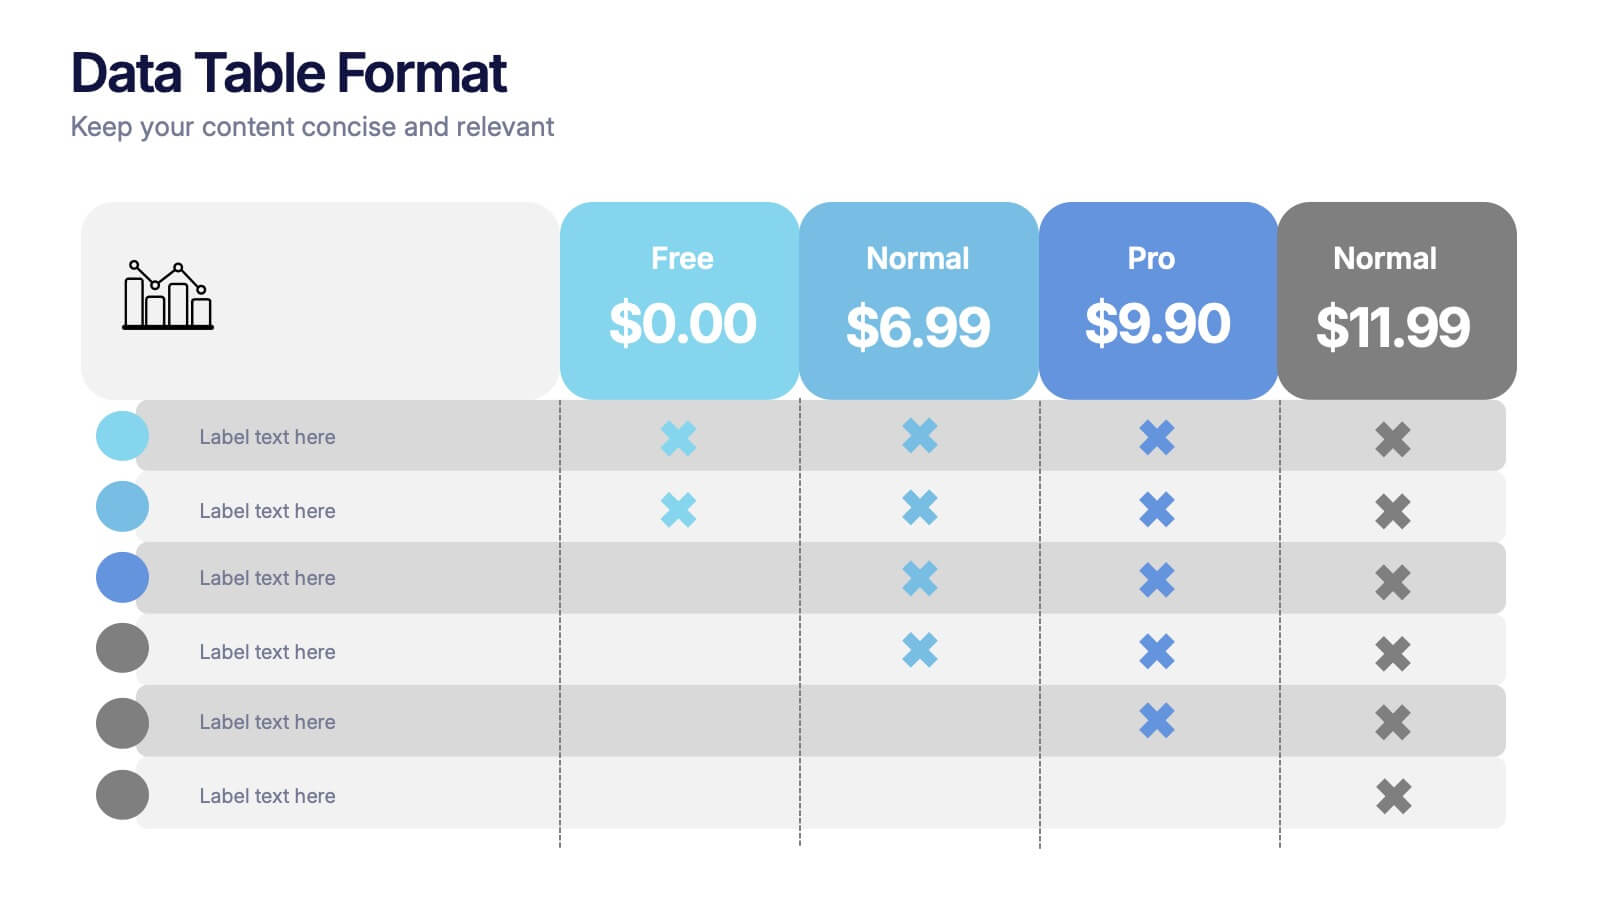
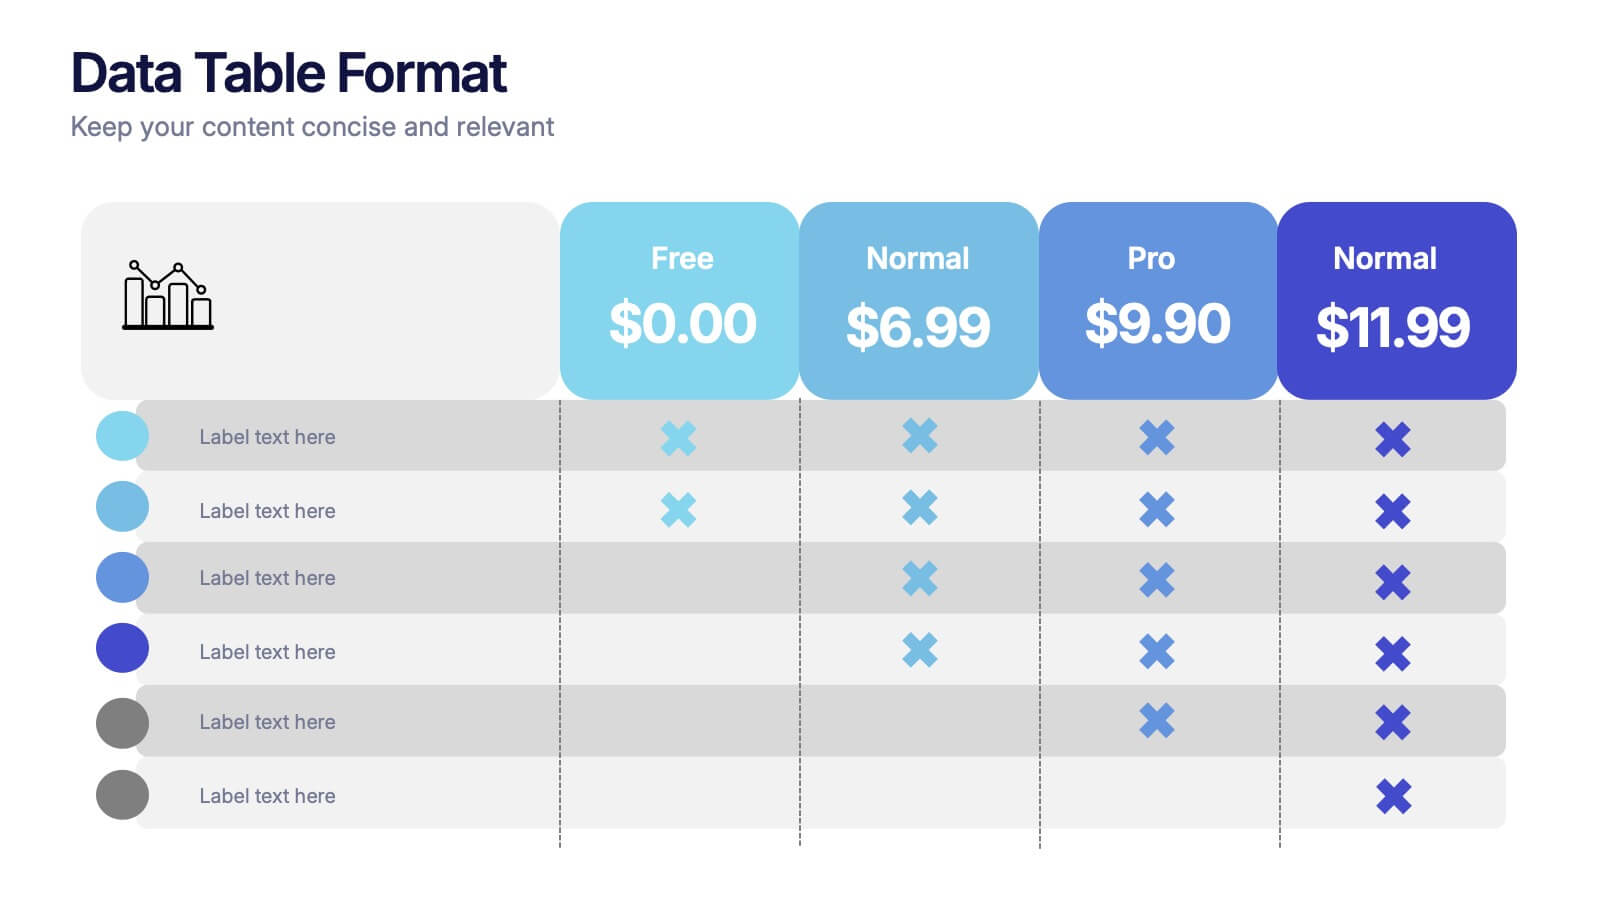
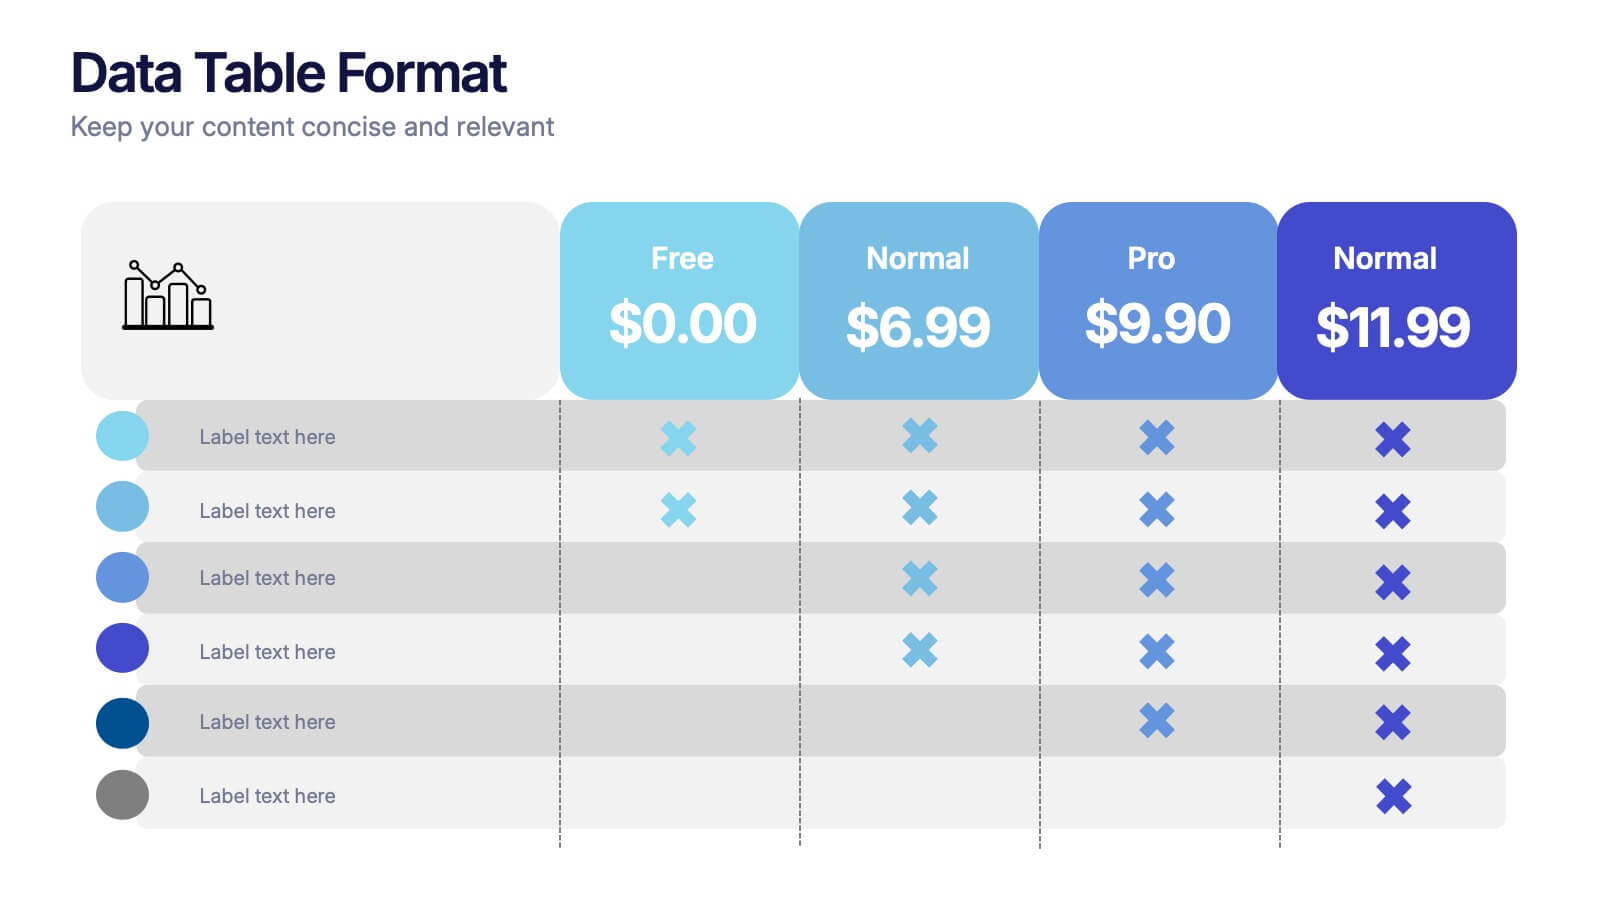
Data Table Format Presentation
Bring clarity to your data with a clean, modern layout that helps your audience compare details at a glance. This presentation is perfect for pricing, feature breakdowns, or structured business insights, keeping information organized and easy to read. Fully compatible with PowerPoint, Keynote, and Google Slides.
- Remove from favorites
Powerpoint Template
1 MB
Google Slides Template
External link
Keynote Template
1 MB
5 slides
Demographic and Psychographic Segments Presentation
Break down your audience with clarity using the Demographic and Psychographic Segments Presentation. This slide is ideal for showcasing four key consumer dimensions through a centered circular layout and quadrant icons. Perfect for marketing campaigns, branding strategies, and audience targeting. Fully editable in Canva, PowerPoint, Keynote, or Google Slides.
- Remove from favorites
Powerpoint Template
1 MB
Google Slides Template
External link
Keynote Template
1 MB
7 slides
Step Numbers Infographic
A numbers infographic is a visual representation of data, statistics, or numerical information presented in a clear, concise, and visually appealing manner. This infographic template aims to communicate complex numerical data or figures in a way that is easy to understand and interpret. Compatible with Powerpoint, Keynote, and Google Slides. Utilizes the charts, graphs, icons, and other graphical elements to represent numerical data. These infographic visuals make it easier for viewers to grasp the meaning behind the numbers. This template will allow you to focus on presenting key numerical insights.
- Remove from favorites
Powerpoint Template
1 MB
Google Slides Template
External link
Keynote Template
1 MB
4 slides
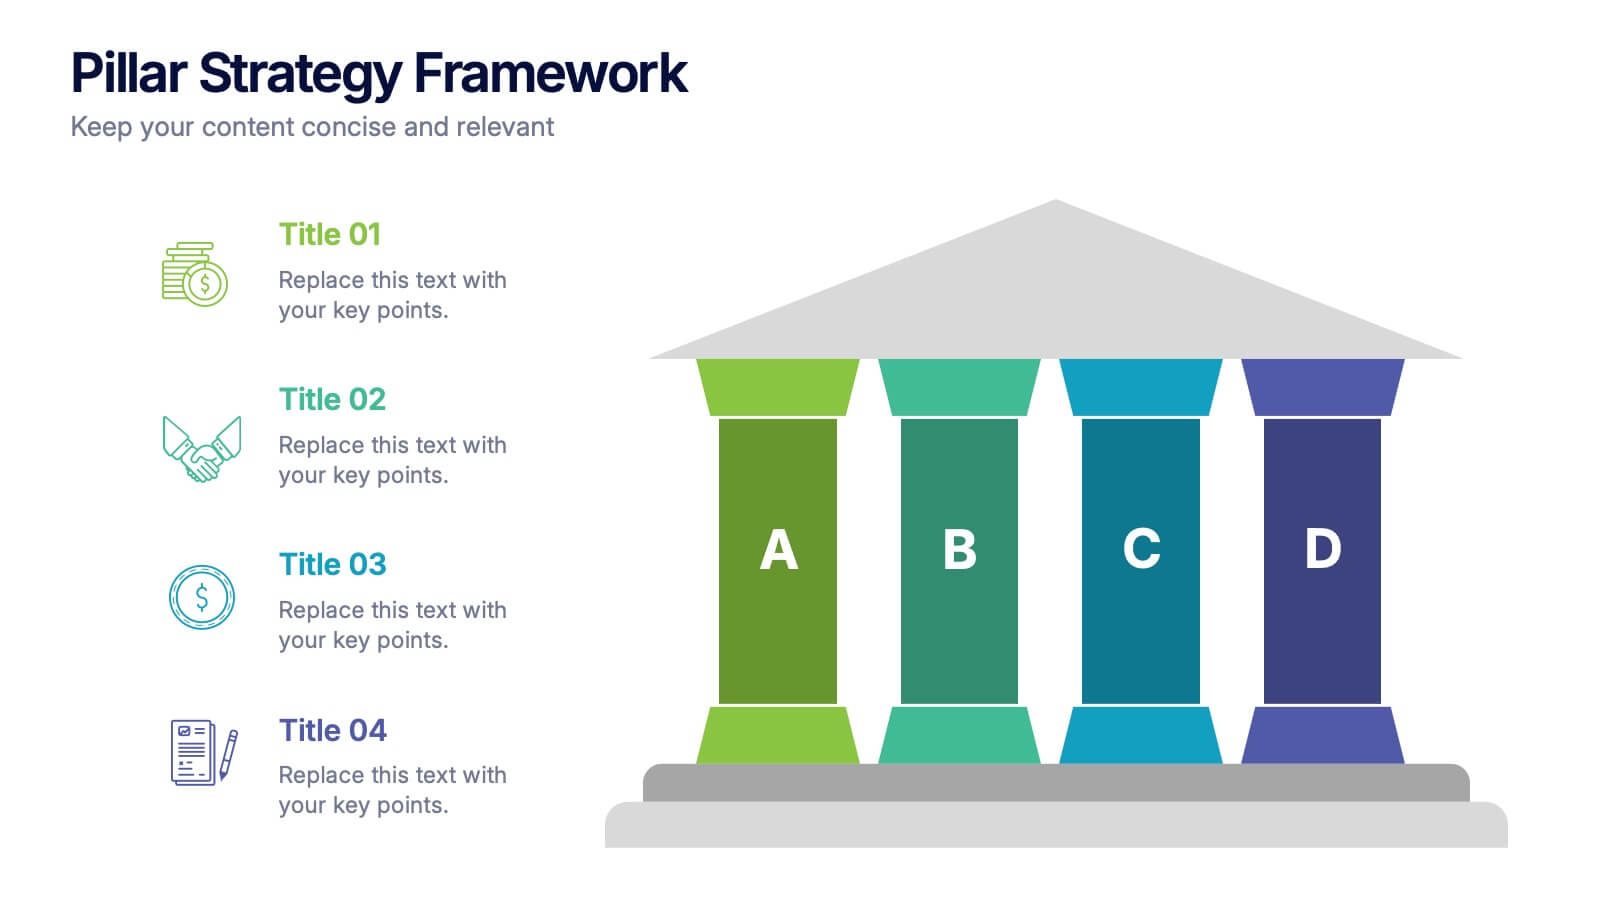
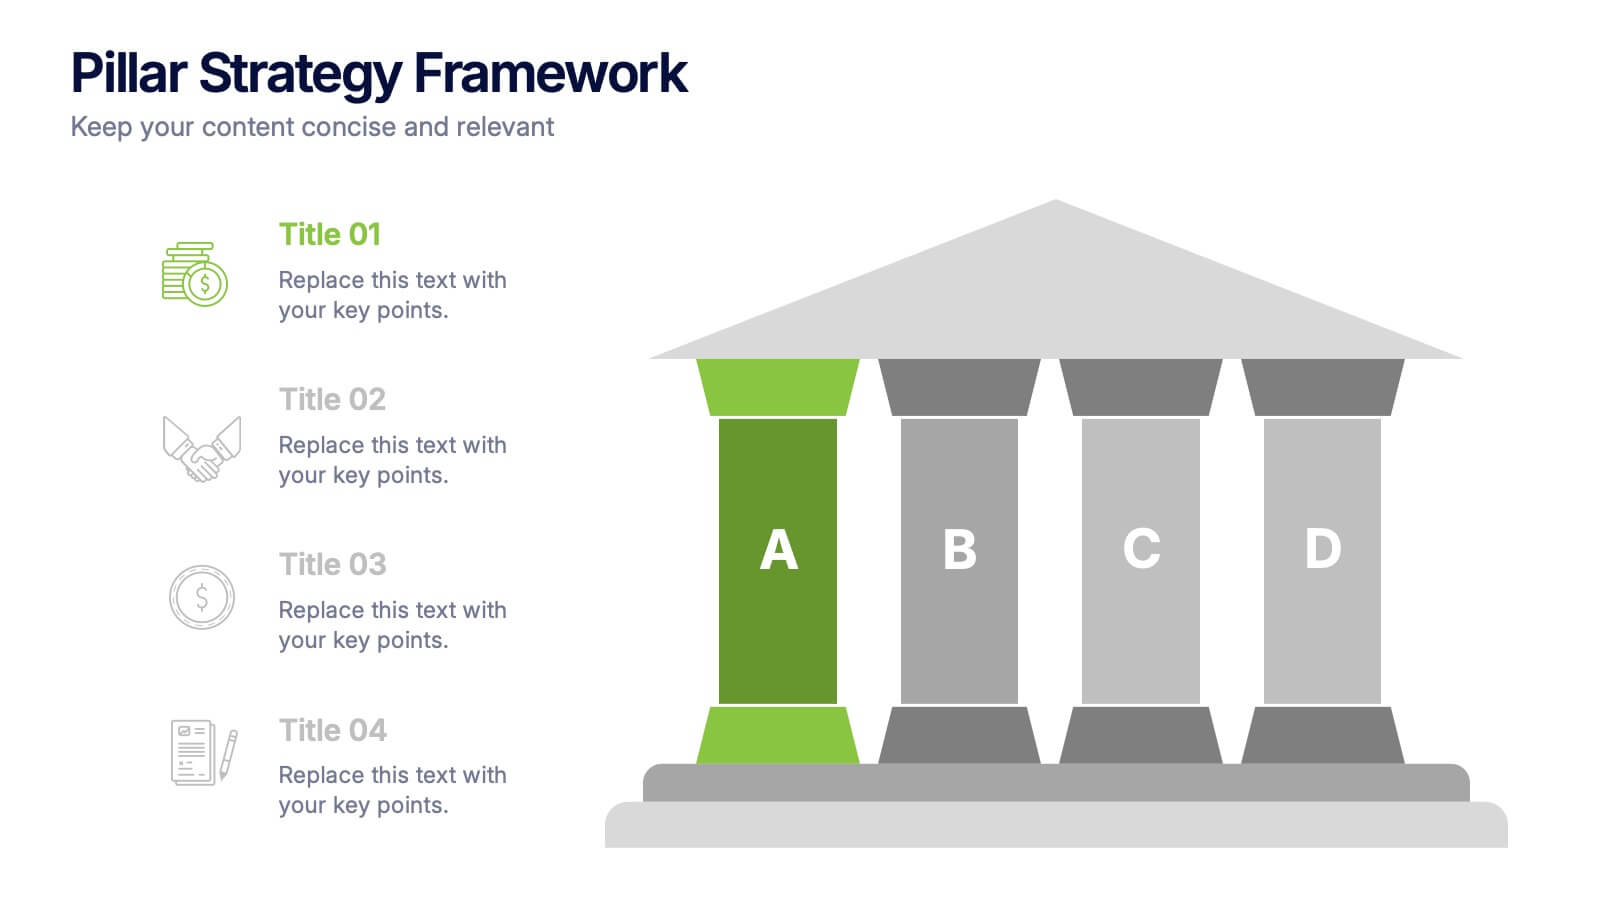
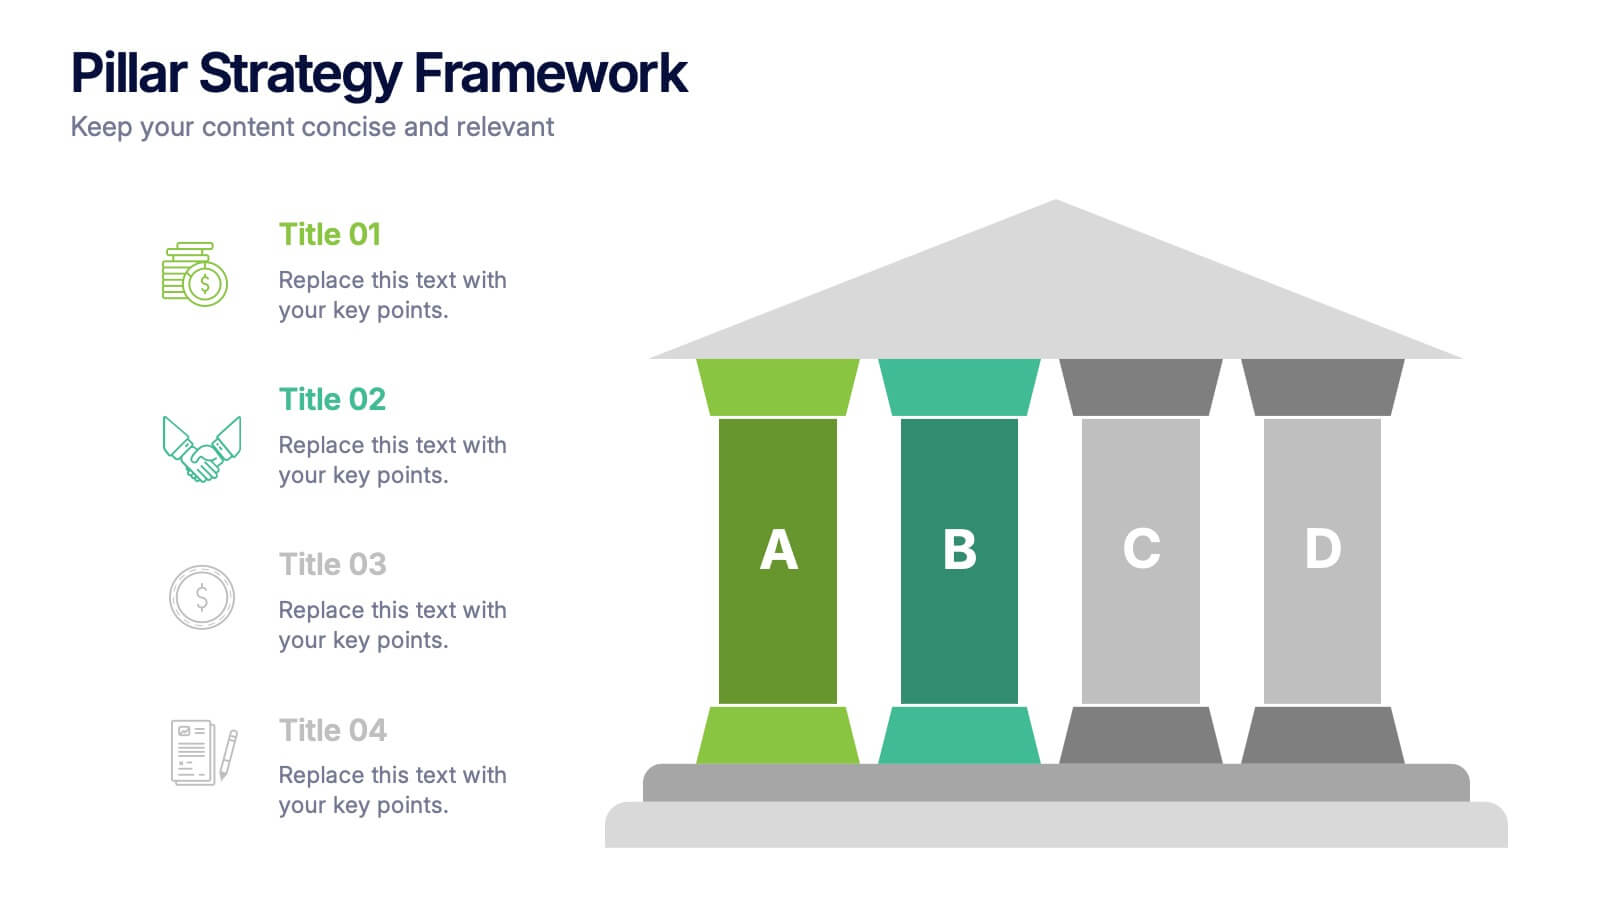
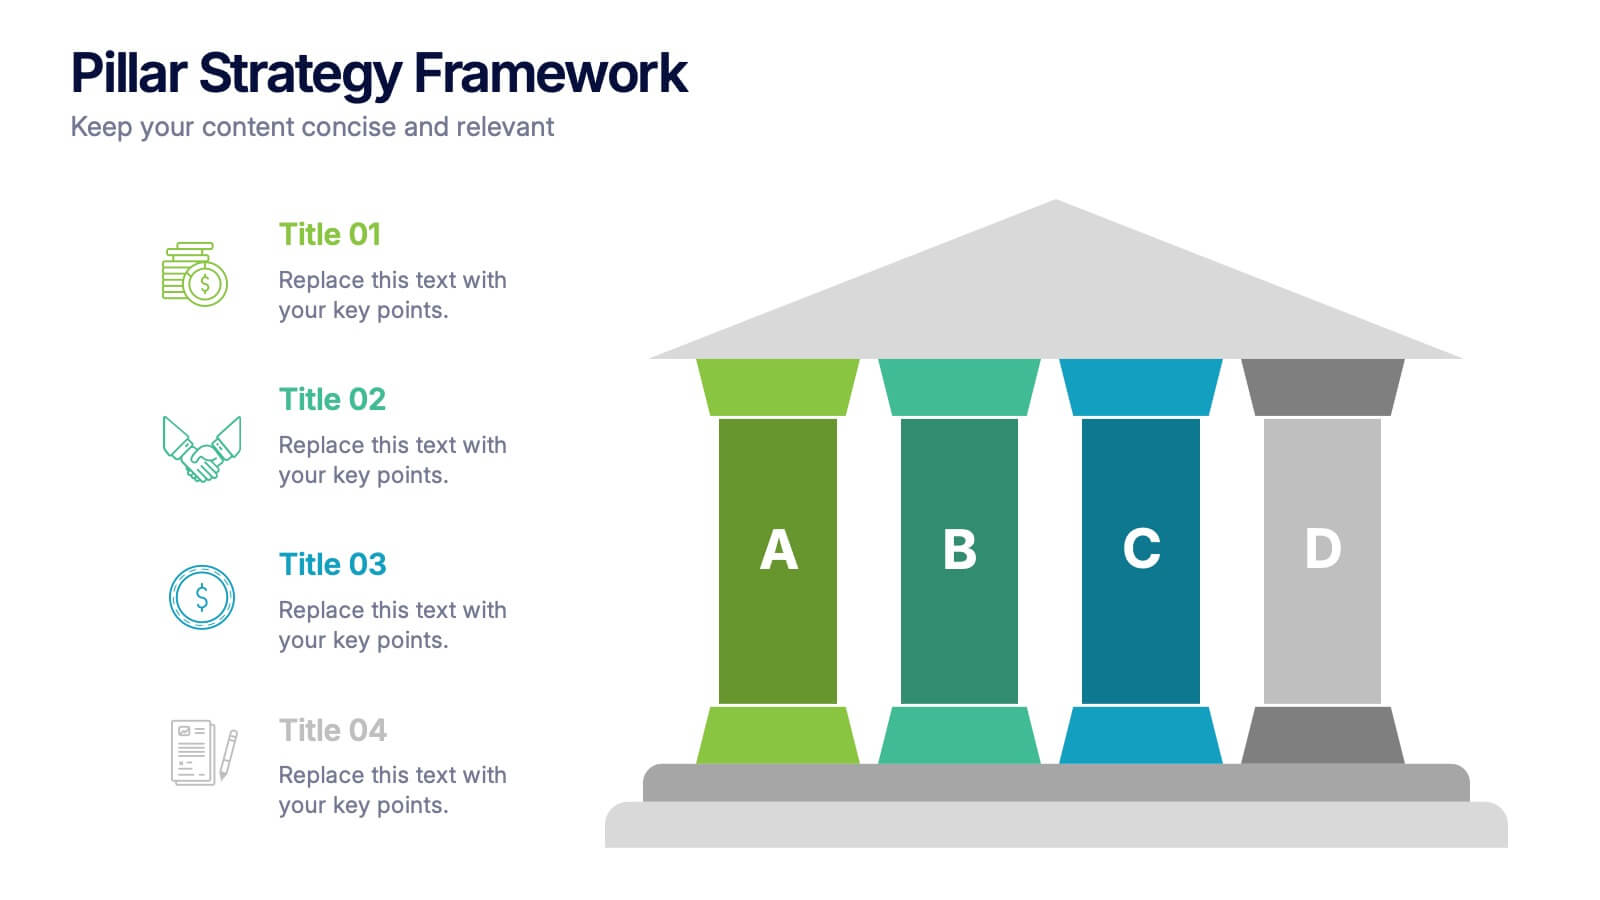
Pillar Strategy Framework Presentation
Turn complex strategies into clear, structured visuals with this elegant infographic design. Ideal for showcasing key principles, organizational foundations, or business frameworks, it helps communicate ideas with precision and balance. Fully customizable and compatible with PowerPoint, Keynote, and Google Slides for effortless editing and professional results.
- Remove from favorites
Powerpoint Template
1 MB
Google Slides Template
External link
Keynote Template
2 MB
6 slides
Business Law and Compliance
Simplify complex legal processes with this business law and compliance slide. Featuring a dynamic hexagon cycle diagram, it’s ideal for showcasing policies, regulatory frameworks, and compliance workflows. Designed for corporate, legal, and risk management presentations. Fully editable and compatible with PowerPoint, Keynote, and Google Slides.
- Remove from favorites
Powerpoint Template
1 MB
Google Slides Template
External link
Keynote Template
1 MB
7 slides
Tree Diagrams Infographics Presentation Template
Tree diagrams are visual diagrams of different outcomes that can result when you take a certain action. They can be used to depict the various possible outcomes of an event or problem, helping you understand your options and choose the best one for a given purpose. They can be used to show statistical probabilities, or general issues that result in many possible ways of moving forward. Use this template to create your own tree diagram, as a new business planning tool to develop goals and objectives. This tree diagram template can help you visualize any project, large or small.
- Remove from favorites
Powerpoint Template
1 MB
Google Slides Template
External link
Keynote Template
2 MB
5 slides
Economic Analysis of Europe Map Presentation
Visualize key economic indicators across European regions with this impactful map-based presentation. Use shaded country highlights and accompanying bar charts to present comparative data, performance trends, and regional growth. Ideal for economic reports, investor updates, or strategic planning. Fully editable and works seamlessly with PowerPoint, Keynote, and Google Slides.
- Remove from favorites
Powerpoint Template
1 MB
Google Slides Template
External link
Keynote Template
1 MB
6 slides
Matrix Diagram Business Analysis Infographic
Streamline your business analysis with our Matrix Diagram Infographic Template. This versatile tool is designed for clarity and impact, helping you compare and contrast various data points. Whether you're assessing risks, evaluating performance, or categorizing information, our template provides a visually appealing and easy-to-understand matrix layout. Compatible with PowerPoint, Google Slides, and Keynote, it's the perfect addition to your business presentations. With its customizable design, you can tailor the colors, shapes, and text to fit your specific needs. Use this template to bring a professional edge to your strategic planning and stakeholder communication.
- Remove from favorites
Powerpoint Template
1 MB
Google Slides Template
External link
Keynote Template
1 MB
5 slides
Financial Budget Infographics
Financial goals refer to specific objectives and targets that individuals or businesses set to manage their finances effectively and achieve financial success. These vertical infographics are designed to help individuals and businesses effectively present their financial budgets and plans. Whether you're a financial analyst or a business owner, this template is perfect for conveying complex financial information in a clear and concise manner. These infographics provide an overview of the budget, showcasing key financial goals, total income, and total expenses. This features visuals to help users set and track financial goals.
- Remove from favorites
Powerpoint Template
1 MB
Google Slides Template
External link
Keynote Template
1 MB
7 slides
Agile Methodology Process Infographic
Introducing our agile methodology infographic template, designed to help you visualize and communicate the principles and processes of Agile project management. Agile is about flexibility, collaboration, and achieving efficient results. This template makes it easy to convey these concepts in a clear and engaging manner. This infographic is fully customizable and compatible with Powerpoint, Keynote, and Google Slides. This is clearly structured and sectioned to represent key aspects of Agile, from sprints to retrospectives. Utilize pie charts, timelines, and process flows to demonstrate Agile workflows and iterations.
- Remove from favorites
Powerpoint Template
1 MB
Google Slides Template
External link
Keynote Template
1 MB
3 slides
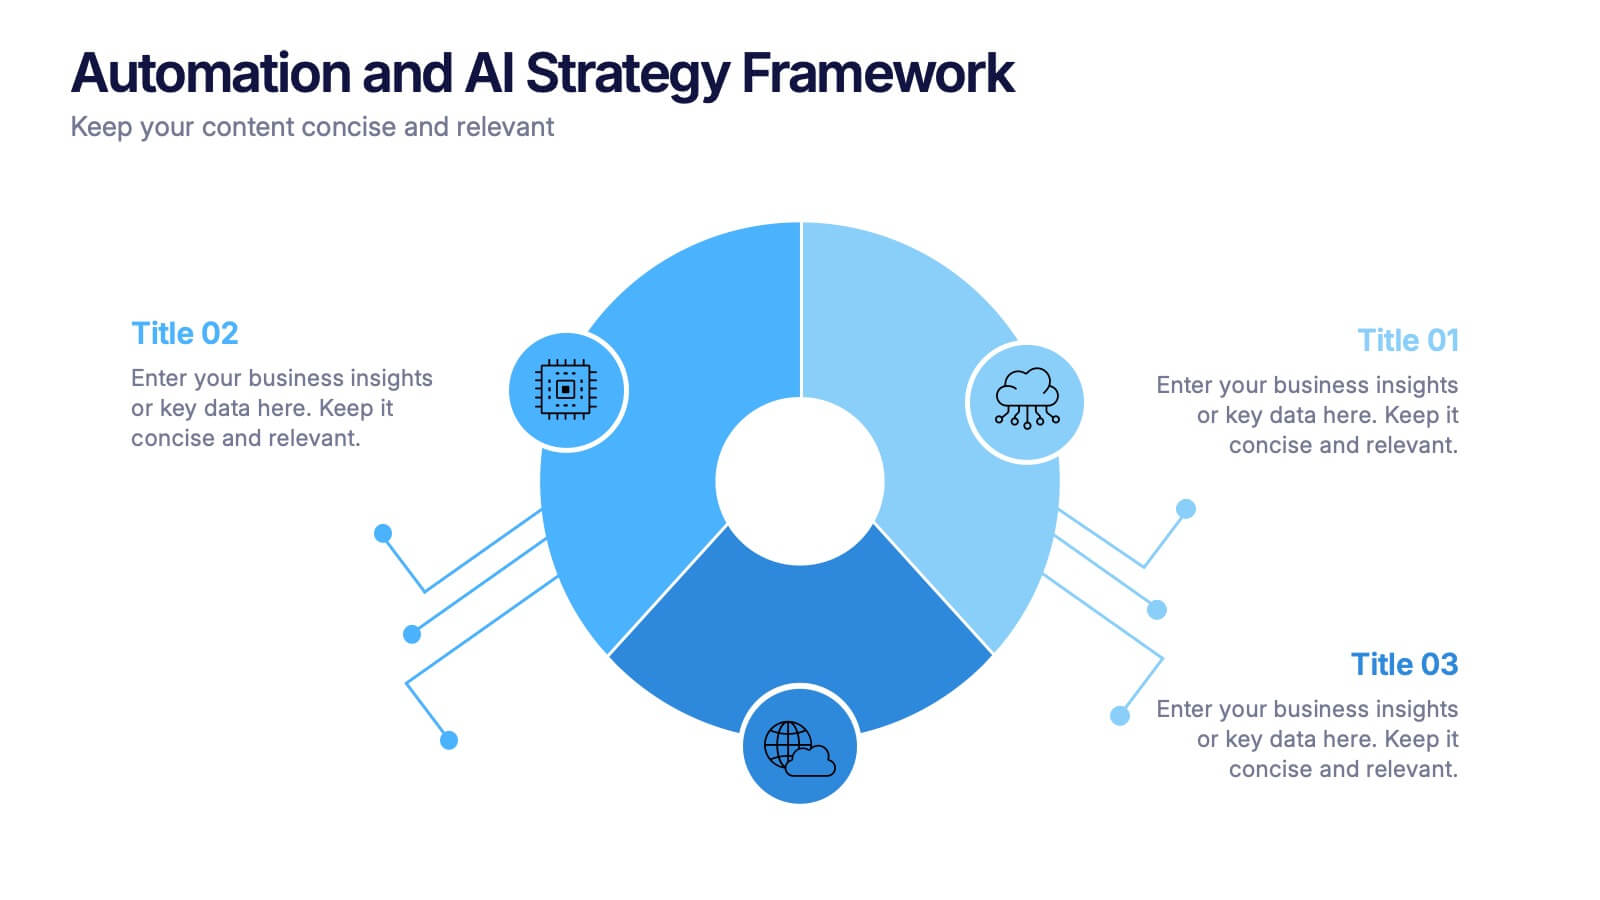
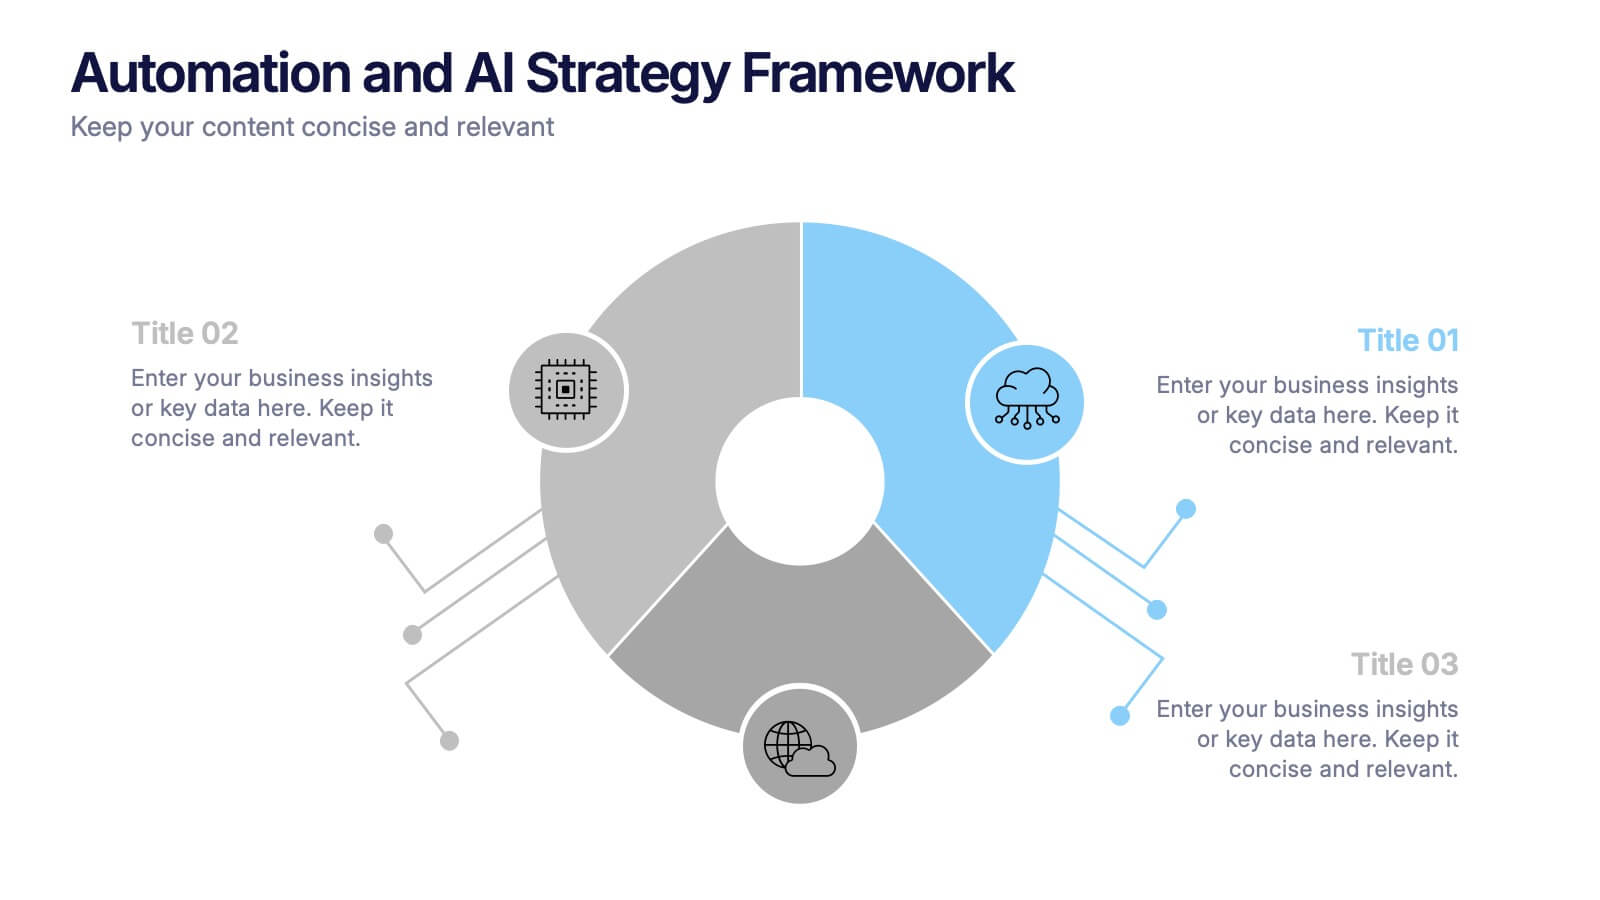
Automation and AI Strategy Framework Presentation
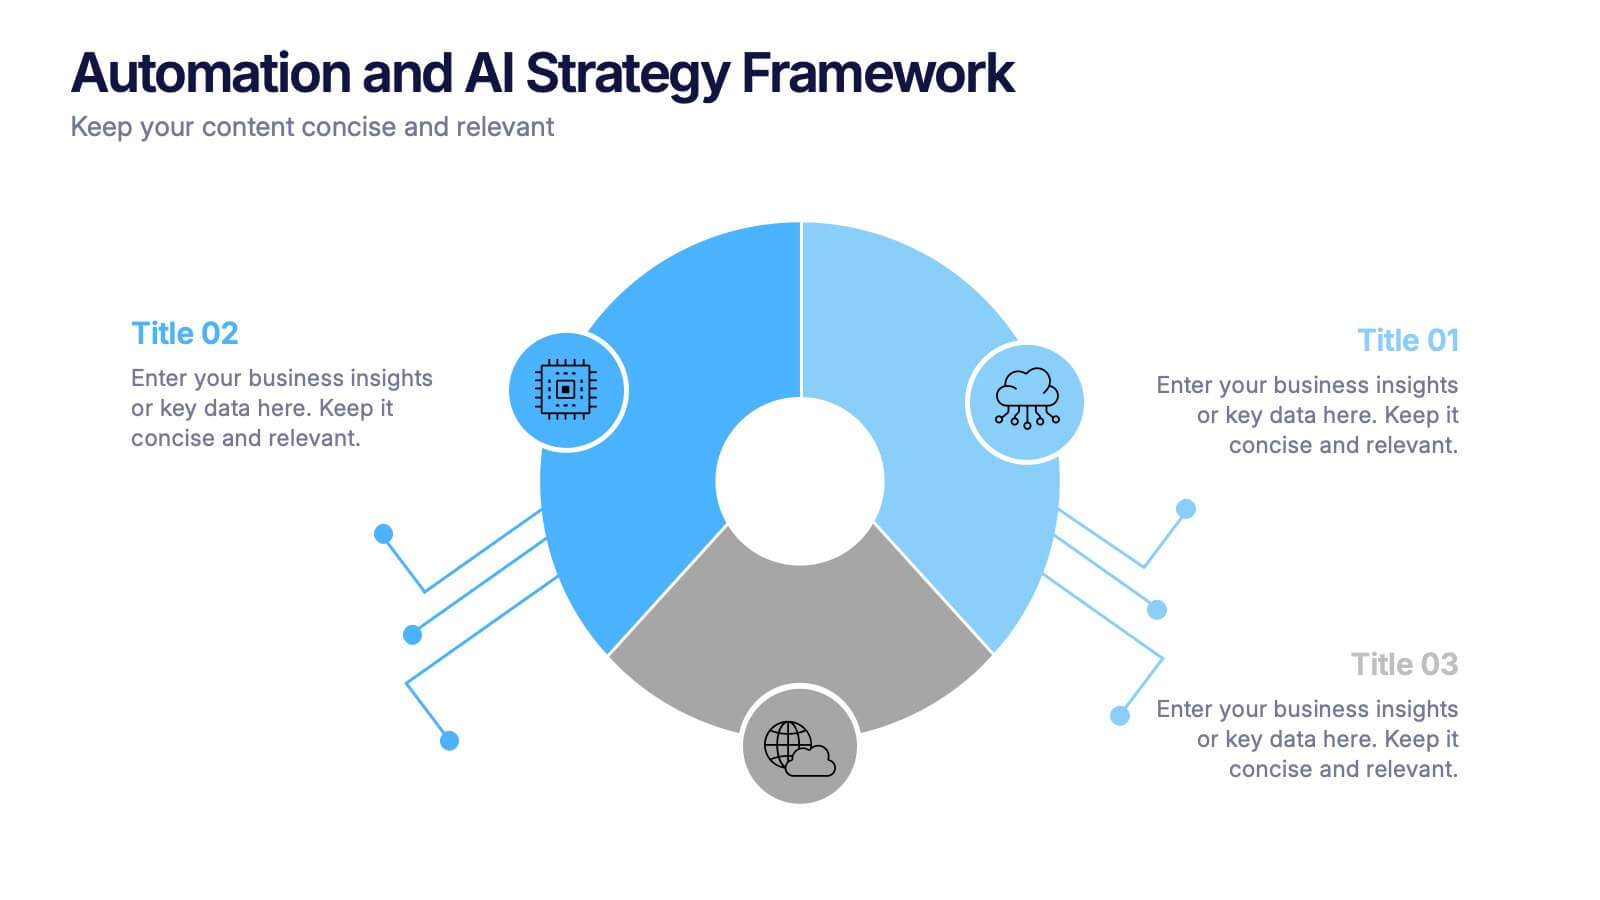
Take your ideas for a high-tech spin with this bold and modern layout! This template visually breaks down strategic frameworks for automation and AI by using a clean, segmented circular flow. Ideal for showcasing processes, data integration, or tech-driven initiatives. Fully compatible with PowerPoint, Keynote, and Google Slides for seamless editing.
- Remove from favorites
Powerpoint Template
1 MB
Google Slides Template
External link
Keynote Template
2 MB
6 slides
Amortization Schedule Infographic
An amortization schedule is a detailed table that outlines the repayment of a loan over time. This infographic can be a helpful way to visually explain the repayment schedule of a loan or mortgage. Divide it into sections, including an introduction, explanation of terms, example calculations, and key takeaways. Compatible with Powerpoint, Keynote, and Google Slides. Use icons or visuals to represent loan-related concepts, such as a house for mortgages, a money bag for payments, or a graph for interest rates. The line graphs included can show the decreasing principal balance over time, with interest and principal portions highlighted.
- Remove from favorites
Powerpoint Template
1 MB
Google Slides Template
External link
Keynote Template
1 MB
7 slides
Technology Skills Gap Infographic Presentation
A Skills Gap Infographic is a visual representation of the difference between the skills that employers need and the skills that are possessed by job seekers or employees. This template illustrates the gap between the skills that are required for a particular job and the skills that are currently available in the workforce. This template include charts, diagrams, and other visual elements that help to explain the extent of the skills gap, as well as its impact on the economy, businesses, and individuals. Use this to raise awareness about the skills gap and its implications to encourage action.
- Remove from favorites
Powerpoint Template
1 MB
Google Slides Template
External link
Keynote Template
1 MB
4 slides
Project Task Ownership with RACI Chart Presentation
Assign roles clearly with the Project Task Ownership with RACI Chart Presentation. This template simplifies responsibility mapping across tasks using the RACI framework (Responsible, Accountable, Consulted, Informed). With a clean matrix layout, it's perfect for project planning, stakeholder alignment, and workflow transparency. Fully editable in PowerPoint, Canva, and Google Slides.
- Remove from favorites
Powerpoint Template
1 MB
Google Slides Template
External link
Keynote Template
1 MB
5 slides
Strategic Budget Planning Forecasting
Tired of messy spreadsheets? This clean and creative template makes budget forecasting easier to visualize and share. Centered around a playful piggy bank illustration, it lets you outline strategic goals, savings plans, and key metrics in a format that’s easy to follow. Fully compatible with PowerPoint, Keynote, and Google Slides.
- Remove from favorites
Powerpoint Template
1 MB
Google Slides Template
External link
Keynote Template
2 MB
12 slides
Business Strategy with 7S Model Presentation
Streamline your strategic discussions with our Business Strategy with 7S Model presentation template, crafted for professionals who demand precision and clarity. Each slide methodically details the seven interrelated elements—Structure, Strategy, Systems, Skills, Staff, Style, and Shared Values—ensuring a comprehensive analysis of your organization's alignment. This versatile template enhances your presentations in PowerPoint, Keynote, and Google Slides, providing a visually engaging way to explore complex business strategies and foster insightful conversations.


