


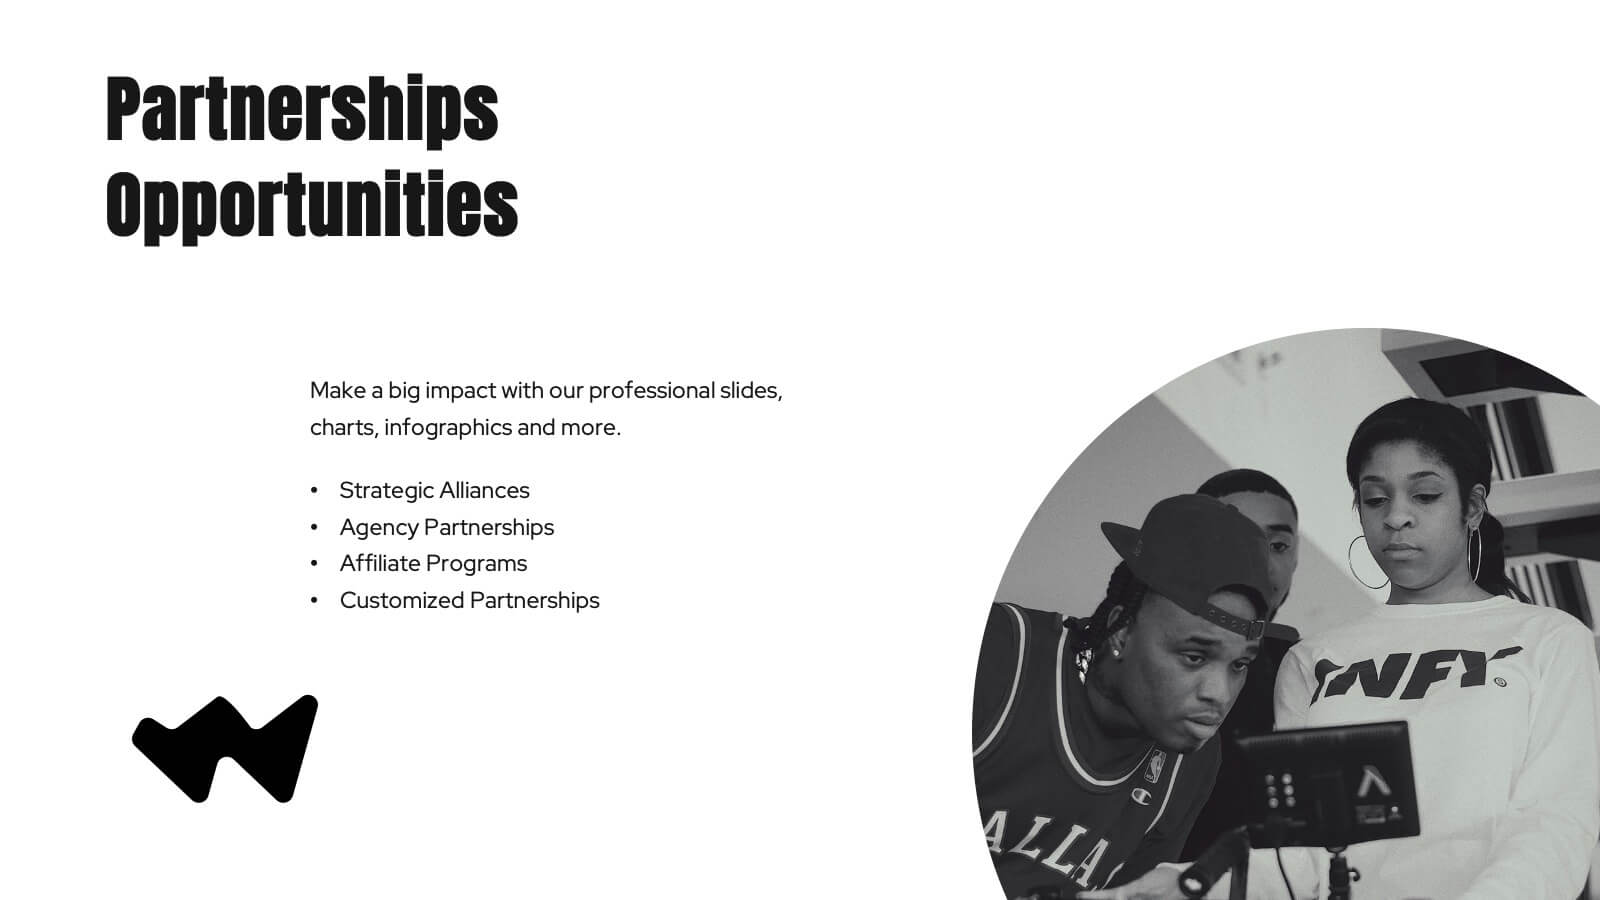
Features
- 6 Unique slides
- Fully editable and easy to edit in Microsoft Powerpoint, Keynote and Google Slides
- 16:9 widescreen layout
- Clean and professional designs
- Export to JPG, PDF or send by email


Do you have any questions?
Recommend


7 slides
Business Office Scenes Infographic Presentation
Office Scene Infographics can be a valuable tool for businesses or organizations that want to showcase their workplace culture or attract potential employees by providing a visual representation of what it's like to work at their company. This template is designed to provide a visual representation of different office scenarios and activities. The template is fully customizable and can be used for a variety of purposes, such as internal communication, training, marketing, and educational. It has a unique design, easy customization, and compatibility with Powerpoint, Keynote and Google Slides.


7 slides
Digital Marketing Infographics Presentation Template
Digital marketing is essential for your business and brand awareness. From website design to social media advertising, learn about all the ways digital marketing can help grow your company with this template. Digital marketing can be a powerful and effective way to promote your business.


7 slides
Sales Funnel Infographic Presentation Template
The Sales Funnel is a marketing concept that is a useful tool for marketers to understand how people evaluate and decide their product or service. A sales funnel is a consumer-focused marketing model with the aim of making a sale. There are several steps to a sales funnel, usually known as top, middle, and bottom of the funnel, these vary from one model to another. With this template, you'll learn how to build a sales funnel that works best for your business and generates more leads and sales. This sales funnel template is designed to plan out your marketing strategy and is easy to use.


6 slides
Risk Management Jobs Infographics
Our Risk Management Jobs infographic is meticulously crafted for Powerpoint, Keynote, and Google Slides, providing a valuable resource for HR professionals, risk consultants, and corporate trainers. This infographic is designed to delineate various job roles within the risk management field, detailing responsibilities, qualifications, and career paths. The infographic outlines the hierarchy and scope of positions, ranging from entry-level risk analysts to chief risk officers, and includes essential information on the skill sets and expertise required for each role. By presenting this data in a visually engaging format, the infographic simplifies the complexity of risk management career structures. Incorporating this infographic into career development workshops, job fairs, or internal training sessions will enhance understanding of the professional opportunities within risk management. It can also serve as a guide for those looking to advance in the field, providing clarity on the progression and specializations available. Use this infographic to effectively communicate the diverse range of roles and career trajectories in risk management.


24 slides
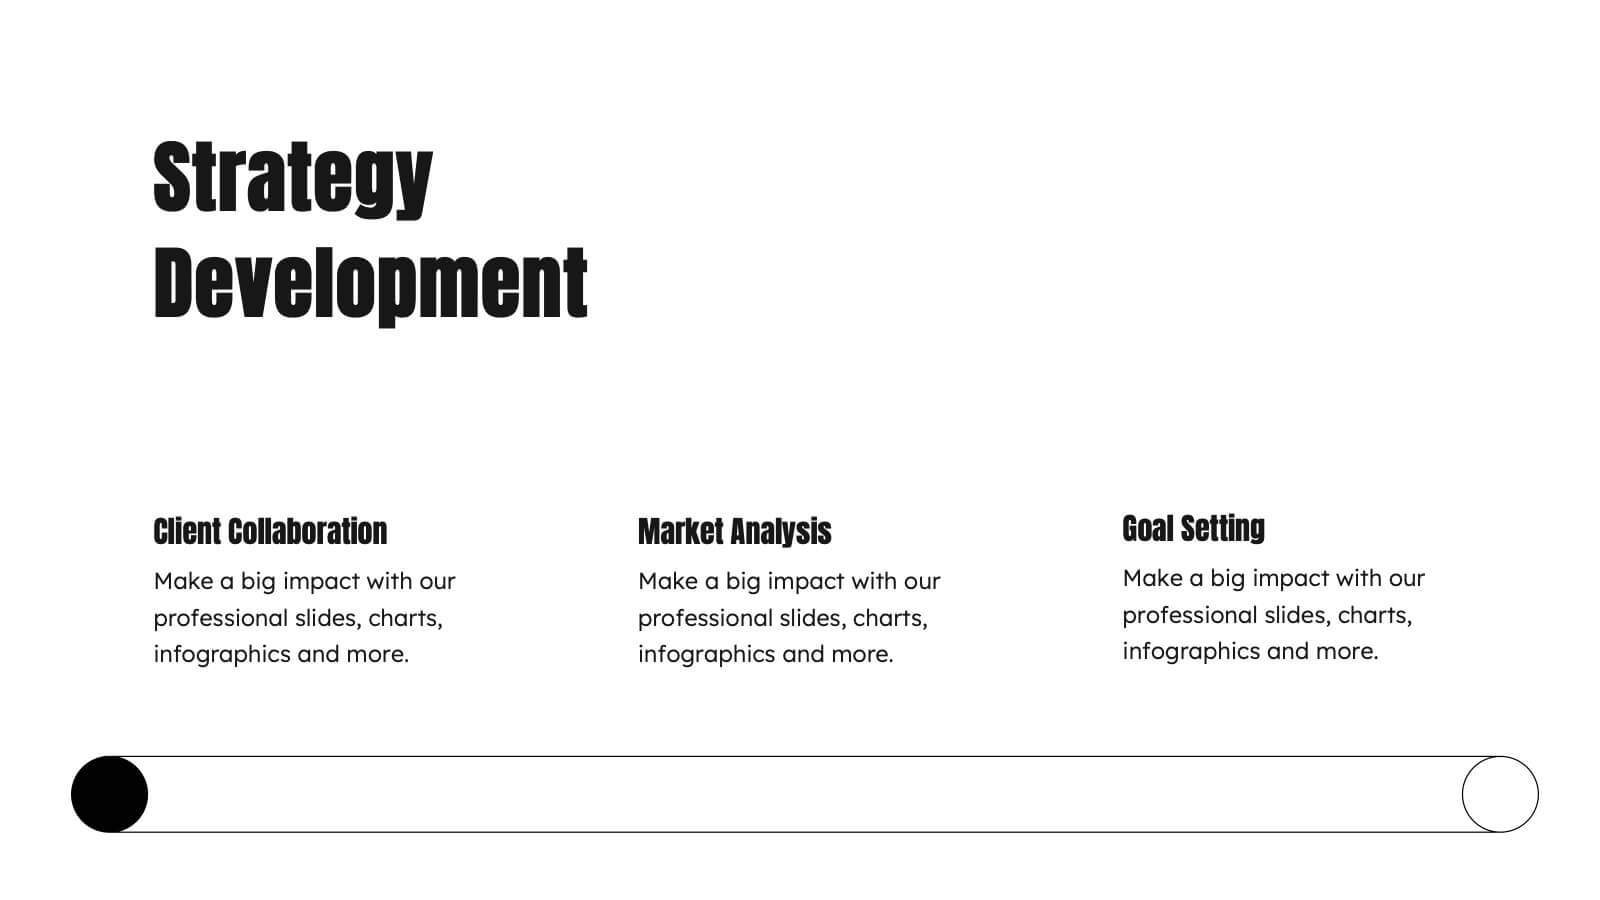
Catalyst Strategic Planning Report Presentation
Unleash your strategic vision with the Catalyst Strategic Planning Report template! This vibrant and dynamic layout is designed to make your strategic planning presentations not only effective but also visually captivating. The template’s playful yet professional design elements, including bold color blocks and creative graphics, draw attention to key points, ensuring your message resonates with your audience. From SWOT analysis to market trends, and resource allocation to action plans, every slide is crafted to communicate your strategic objectives clearly and compellingly. Perfect for business reviews, strategic meetings, or investor presentations, this template allows you to present data-driven insights and actionable steps in an engaging manner. It’s fully customizable, making it easy to adapt to your brand’s colors and style. Whether you’re presenting to a team or stakeholders, the Catalyst template provides the perfect platform to articulate your vision. Compatible with PowerPoint, Keynote, and Google Slides, it’s your go-to tool for impactful strategic presentations!


7 slides
Strategic Highlights Executive Summary Presentation
Showcase your business priorities with the Strategic Highlights Executive Summary Presentation. This layout features up to seven colorful, clearly labeled content blocks—perfect for summarizing goals, KPIs, initiatives, or focus areas. Easy to edit in PowerPoint, Keynote, Google Slides, or Canva for quick customization and clean executive reporting.


7 slides
Human Resources Infographic Presentation Template
A human resources infographic is data related to the management of people in an organization. This template can be used to cover various HR-related topics, such as recruitment and selection, employee benefits, performance management, and career development. The purpose of our HR infographic is to communicate information in a clear and engaging way, making complex HR concepts and processes easier to understand. This well-designed infographic template can help you effectively communicate HR information, improve engagement and understanding, and support the overall success of your presentation.

22 slides
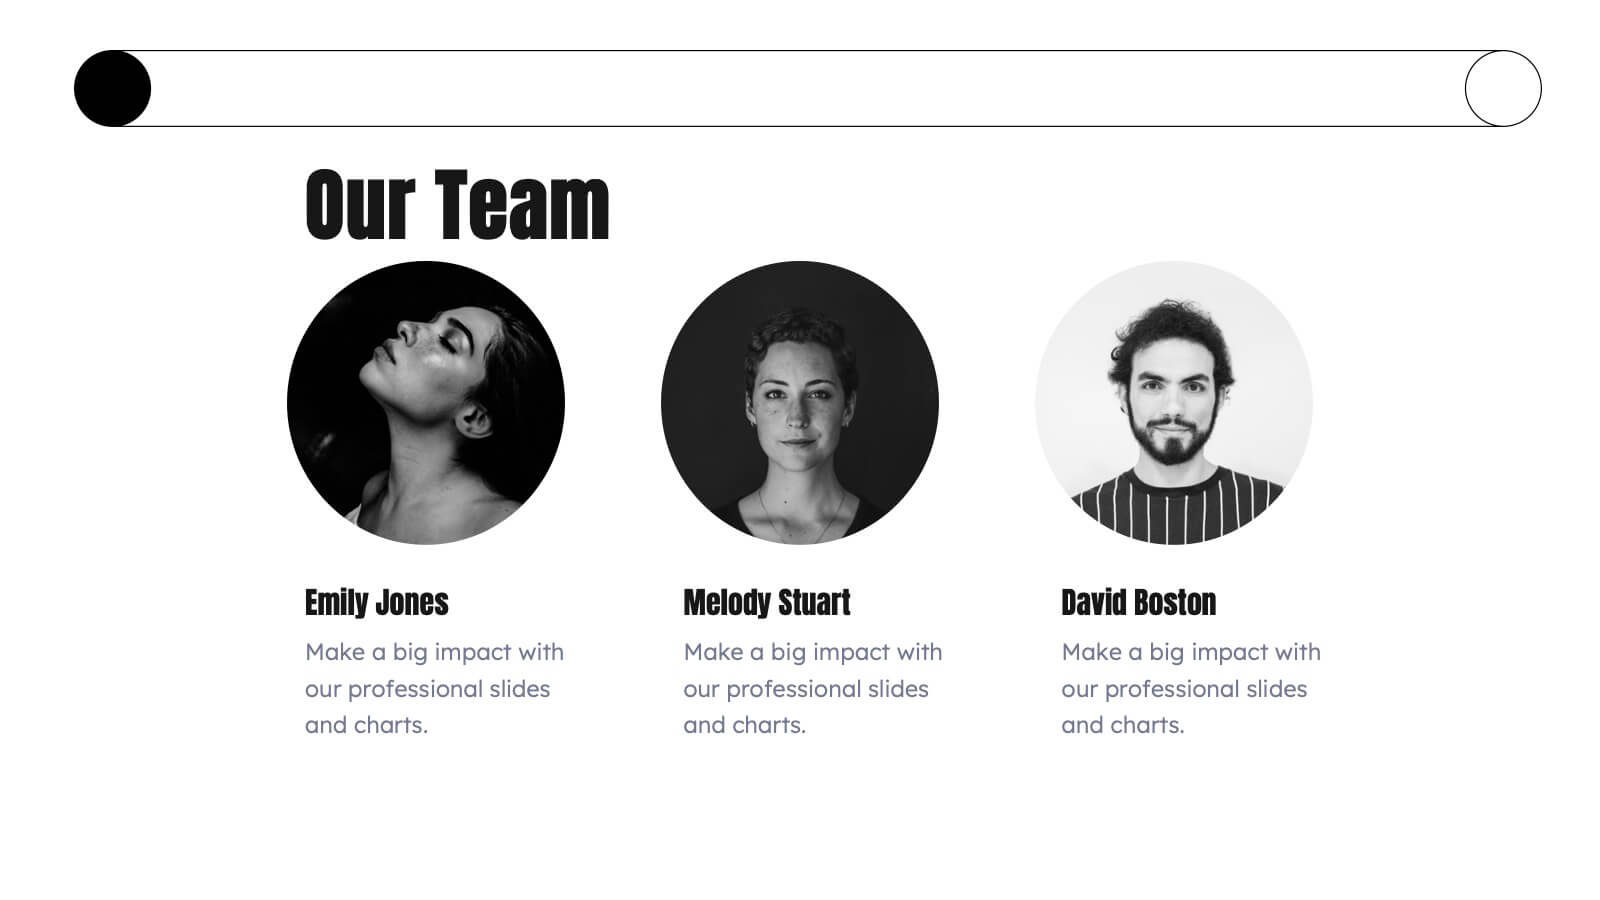
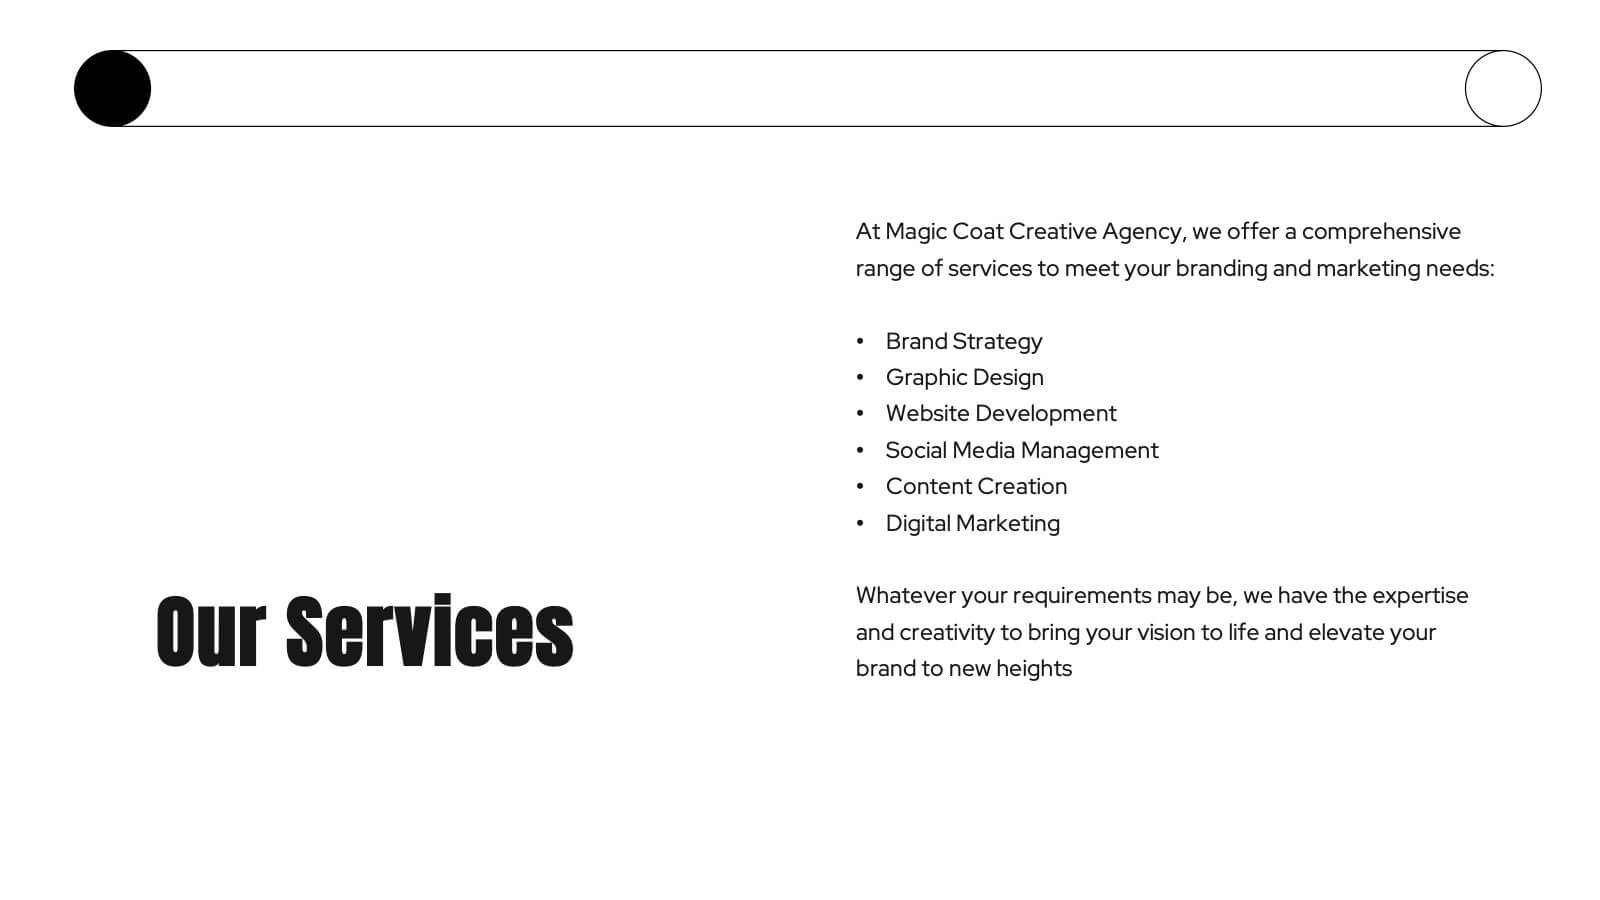
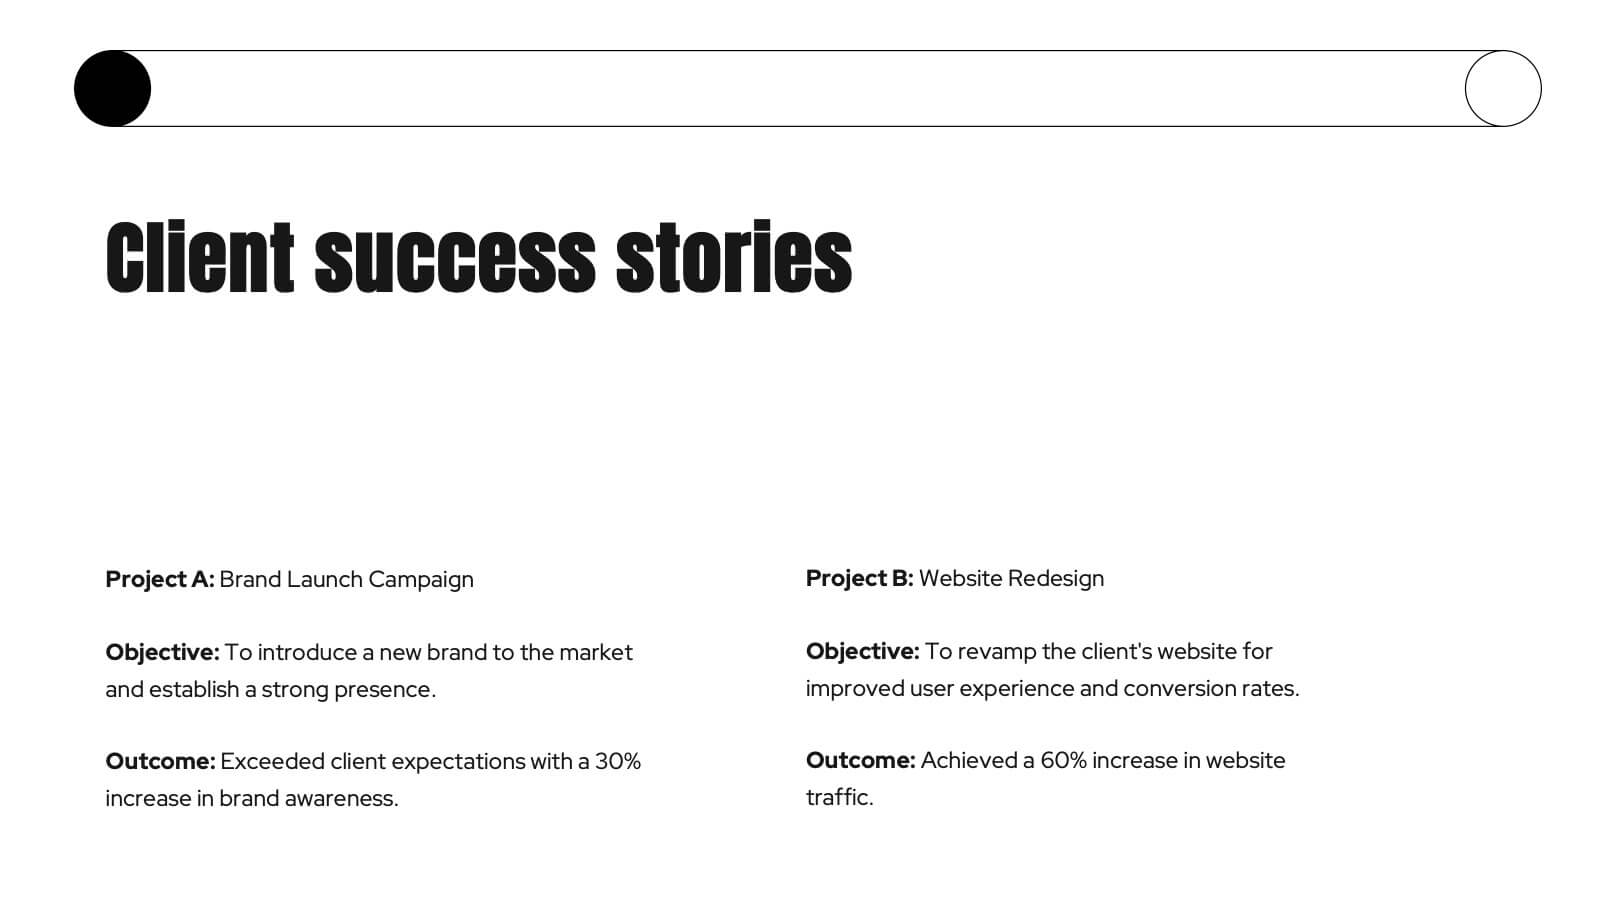
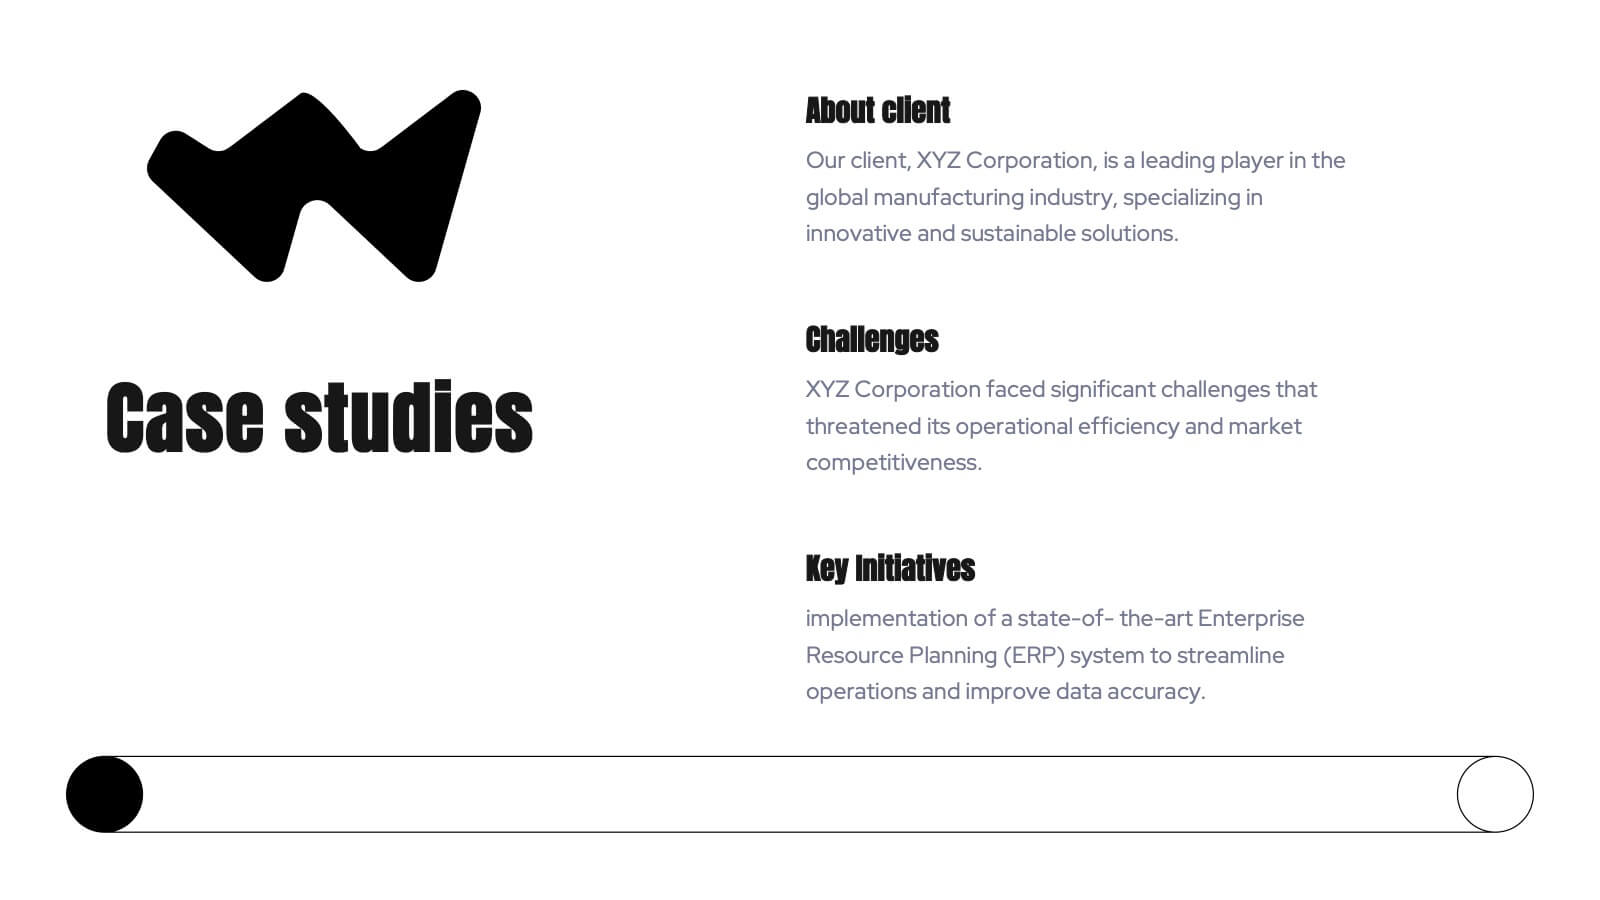
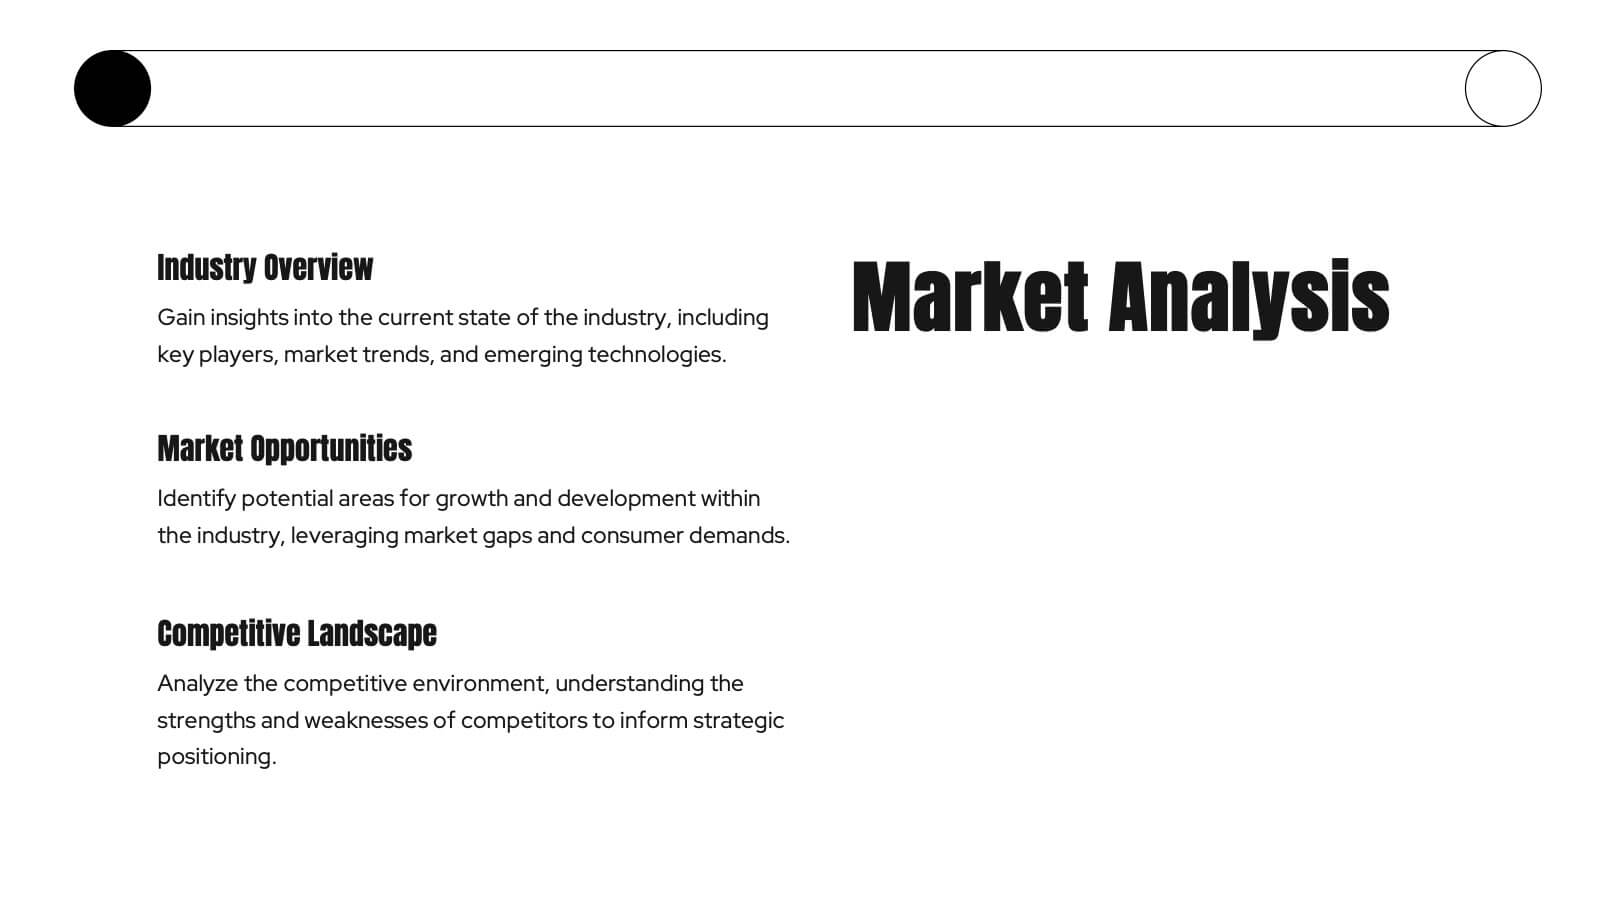
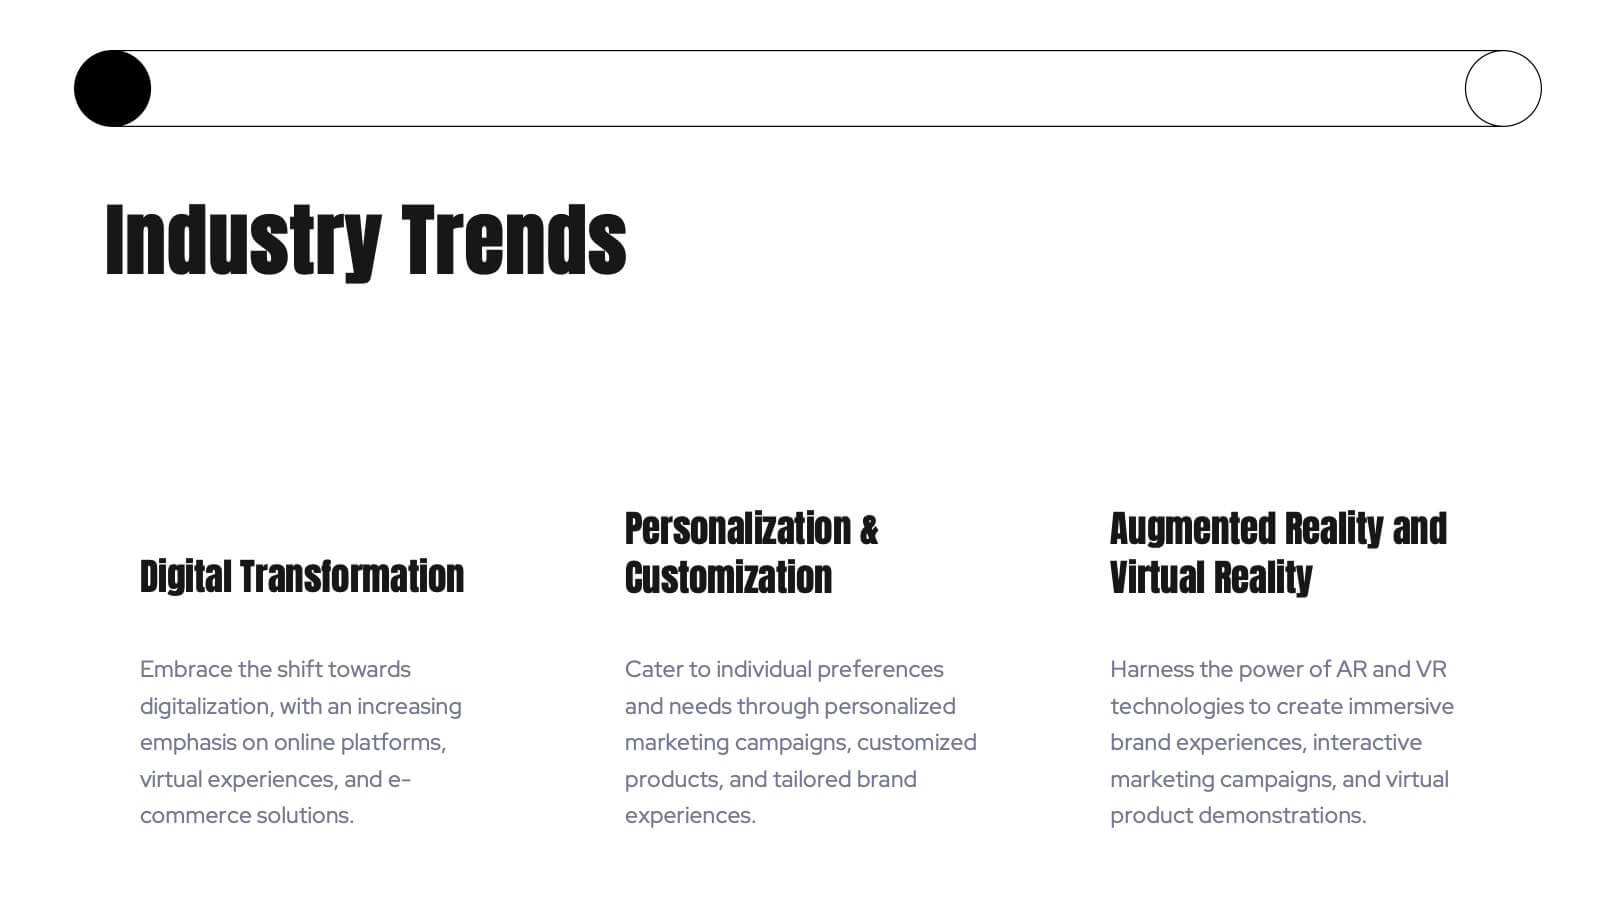
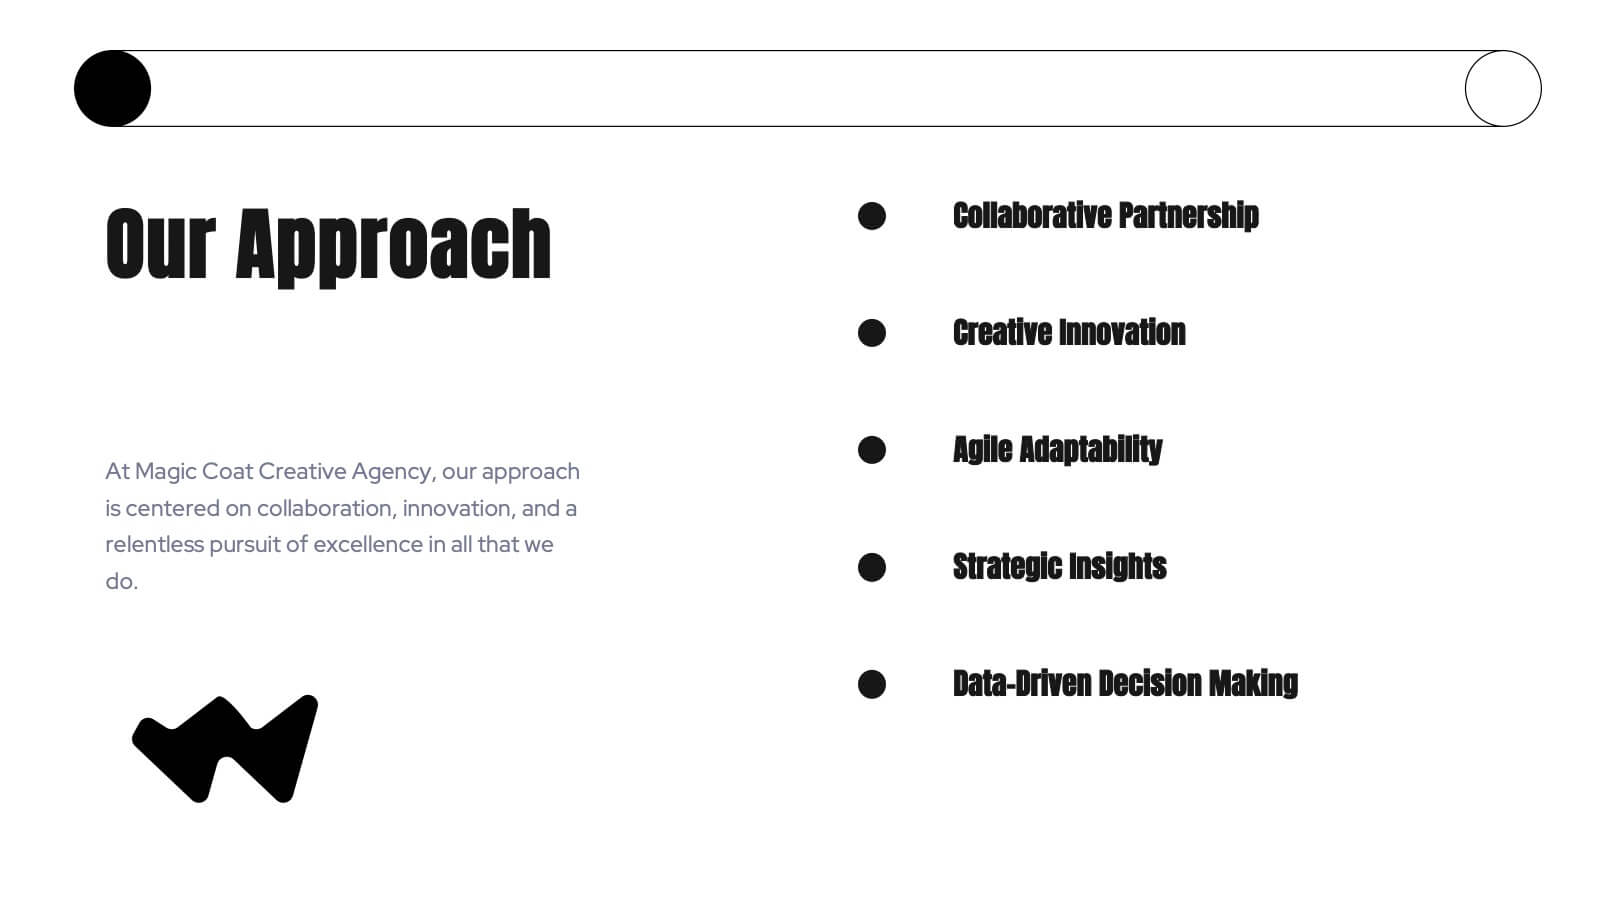
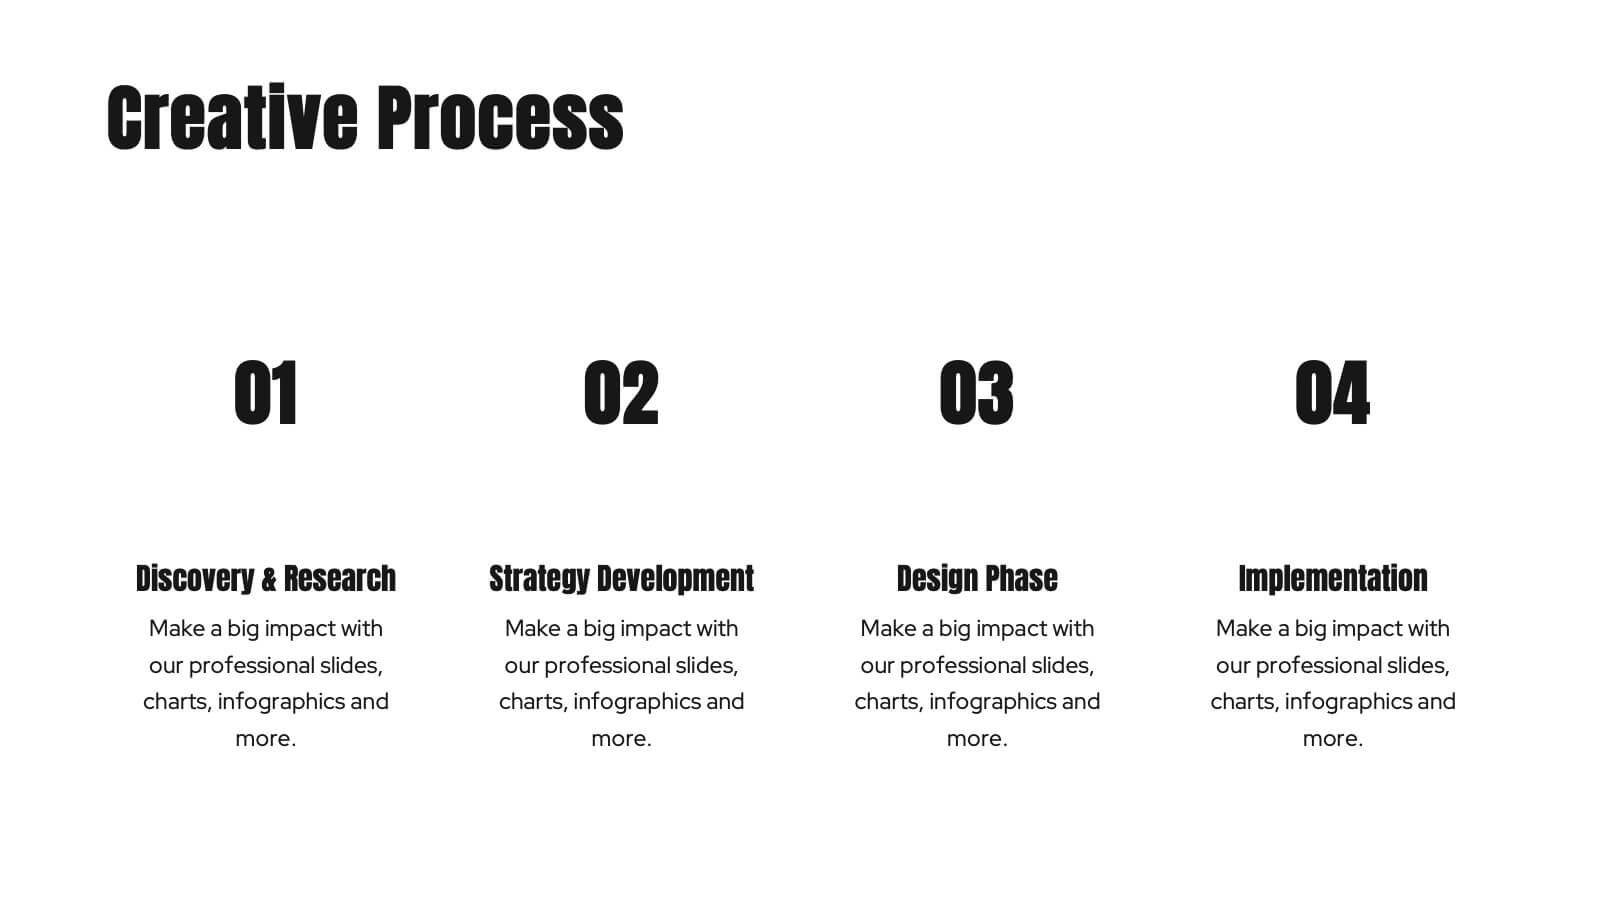
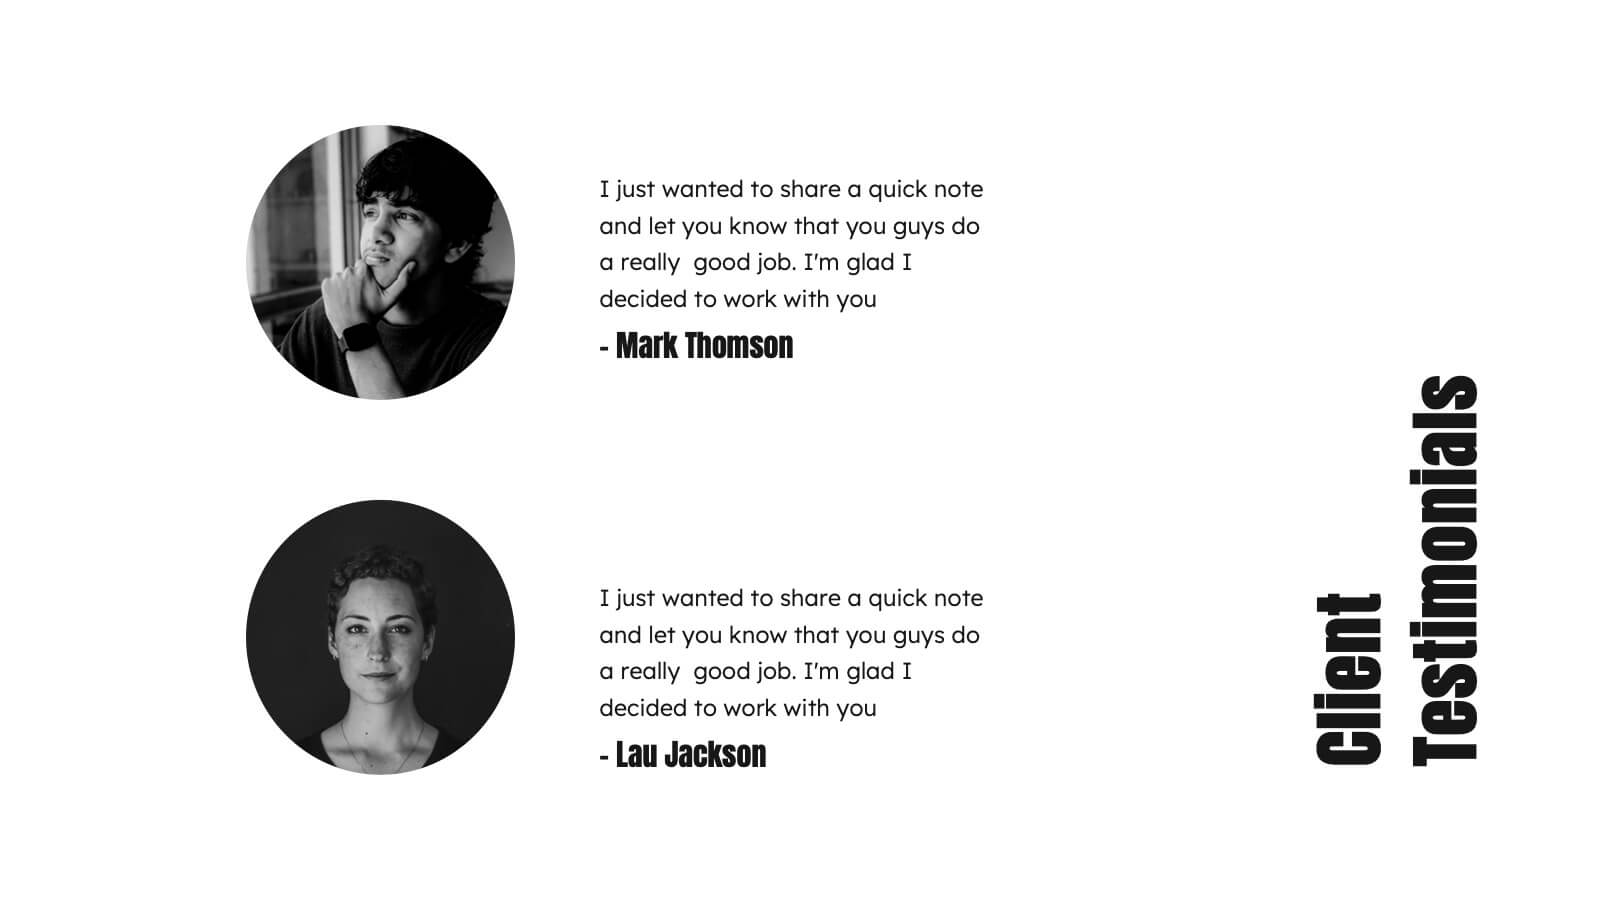
Kraken Agency Portfolio Presentation
This agency portfolio template showcases your agency's work and expertise with a sleek, modern design. It features slides for client success stories, case studies, services, market analysis, and creative process. Perfect for demonstrating your team’s skills and approach. Compatible with PowerPoint, Keynote, and Google Slides for easy customization and presentation.


5 slides
Historical Event Timeline Overview Presentation
Bring history to life with the Historical Event Timeline Overview Presentation. This visually engaging slide is perfect for educators, researchers, or historians looking to showcase five key milestones in chronological order. Fully editable in Canva, PowerPoint, Keynote, and Google Slides—making it easy to adapt for any historical topic.


4 slides
Veterinary Medicine and Animal Health Presentation
Bring animal healthcare insights to life with this playful and professional slide, featuring an illustrated dog and four food bowls to represent key veterinary topics. Ideal for clinics, pet wellness brands, or animal science presentations. Fully editable in PowerPoint, Keynote, or Google Slides.


4 slides
Corporate Portfolio of Achievements Presentation
Present your professional milestones with this sleek, image-focused layout. Featuring a large photo placeholder and three clearly defined highlights, this slide is ideal for showcasing company achievements or project phases. Fully editable in PowerPoint, Keynote, and Google Slides—perfect for client updates, internal reviews, or corporate storytelling.


7 slides
North America Population Infographic Presentation
North America is a continent located in the northern hemisphere of the Earth, bordered by the Pacific Ocean to the west. It includes countries such as the United States, Canada, Mexico, and several others in the Caribbean and Central America. This template can be a powerful tool to communicate information about the continent in an informative and engaging way. This can help people understand and appreciate the diversity and complexity of North America, and can be used for a variety of purposes, from education to marketing. This template is compatible with Powerpoint, Keynote and Google Slides.


7 slides
3D Models Infographic Presentation
A 3D Model Infographic is a graphic design element that utilizes three-dimensional models to present information in a visually engaging and interactive way. This 3D model template can be used as a digital representation of an object that can be viewed and manipulated from different angles and perspectives. This Infographic can be customized to represent data or information in a variety of ways. For example, a 3D model of a building or product could be used to highlight different features or components. Compatible with Powerpoint, Keynote and Google Slides this template is easily customizable.


5 slides
Coffee Tasting Infographics
Coffee Tasting, also known as coffee cupping, is the process of evaluating and appreciating the flavors, aromas, and characteristics of different coffee beans. These infographic templates are designed to educate participants about the art of coffee tasting. The captivating visuals will empower your audience to appreciate the flavors and nuances of different coffee varieties. Whether you're hosting a coffee tasting event or sharing information with coffee enthusiasts, this template will help you deliver an engaging and visually appealing presentation that celebrates the joy of coffee tasting. Compatible with Powerpoint, Keynote, and Google Slides.


22 slides
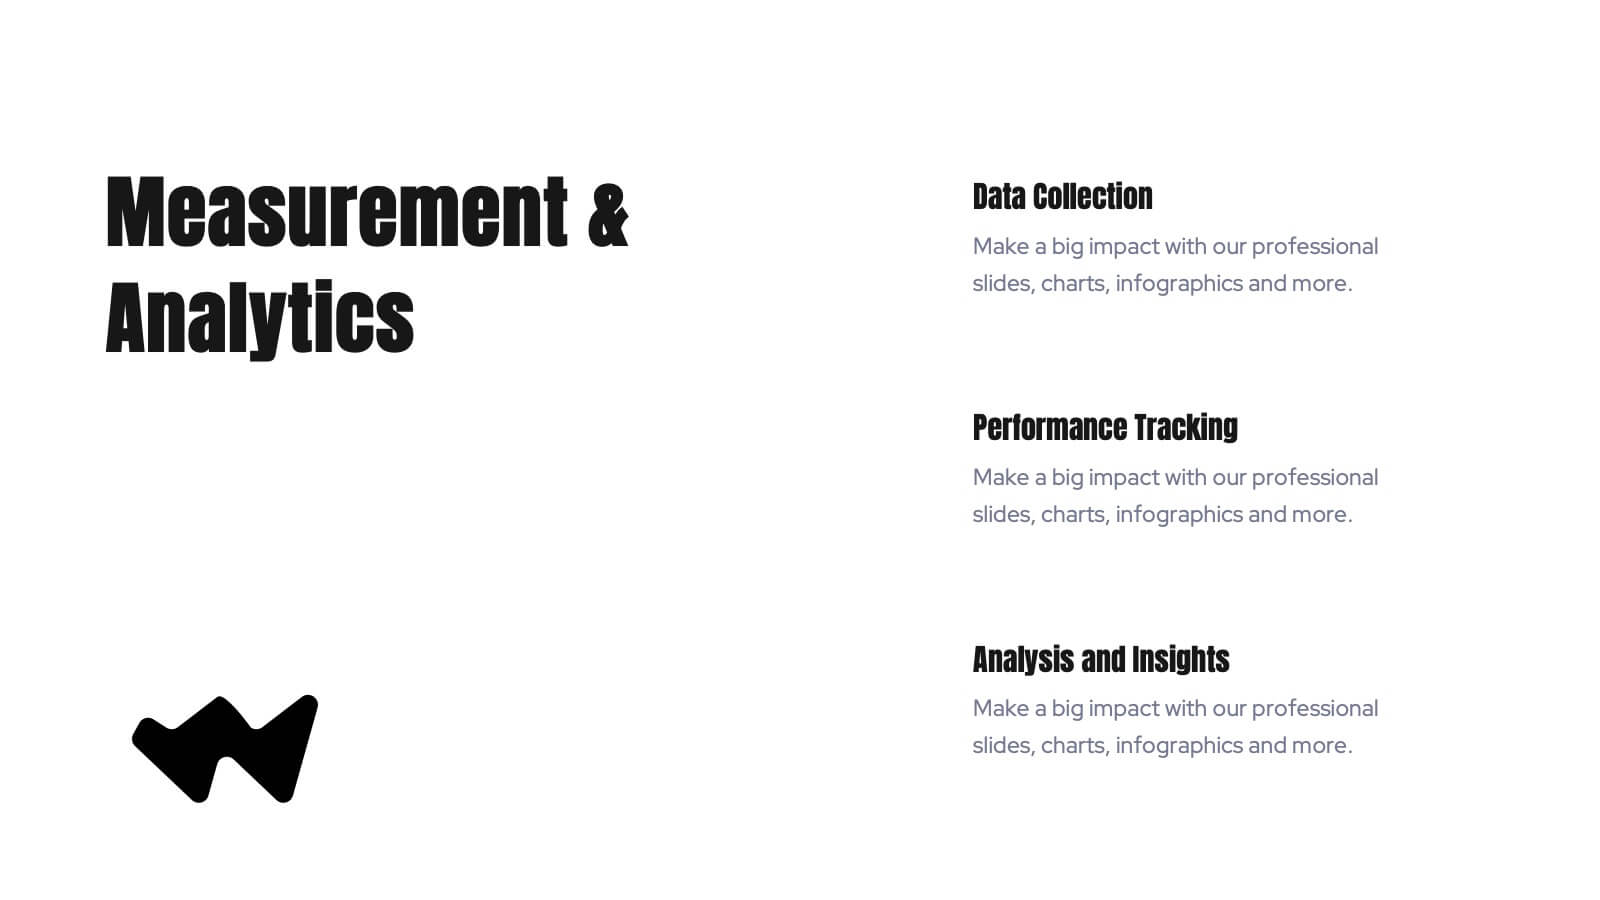
Tranquil Project Status Report Presentation
This dynamic project report template delivers key insights with a bold, modern design. From performance metrics to market trends and client feedback, it's crafted for comprehensive yet visually appealing updates. Perfect for team presentations, this template ensures clarity and engagement. Compatible with PowerPoint, Keynote, and Google Slides, it’s ideal for project leaders!


6 slides
Root Cause Analysis of Key Problems Presentation
Get to the heart of business issues with this Root Cause Analysis of Key Problems presentation. This template helps you break down complex challenges into actionable components: Who, What, When, Where, Why, and How. Clean, color-coded arrows ensure clarity. Ideal for strategic reviews and process optimization. Fully editable in Canva, PowerPoint, and Google Slides.


5 slides
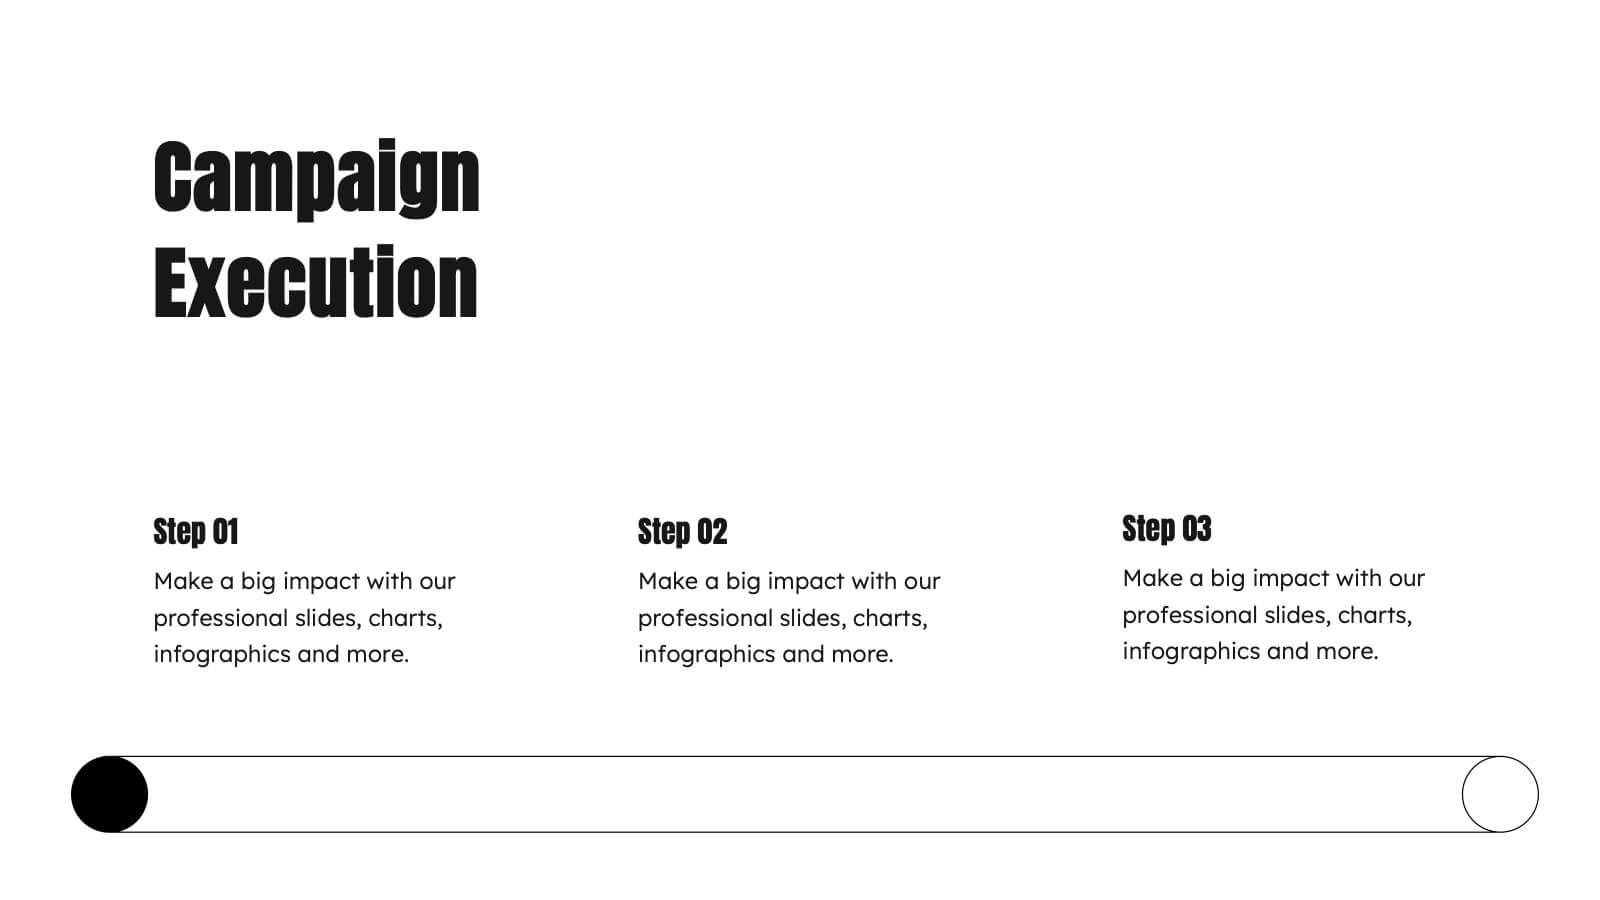
Five Essential Steps for Business Success Presentation
Visualize your growth plan with the Five Essential Steps for Business Success Presentation. This step-by-step layout highlights key milestones using a modern isometric staircase design, with speech bubble markers for added clarity. Ideal for roadmaps, strategic planning, or onboarding workflows. Fully editable in PowerPoint, Keynote, and Google Slides.