


Features
- 4 Unique slides
- Fully editable and easy to edit in Microsoft Powerpoint, Keynote and Google Slides
- 16:9 widescreen layout
- Clean and professional designs
- Export to JPG, PDF or send by email


Do you have any questions?
Recommend

20 slides
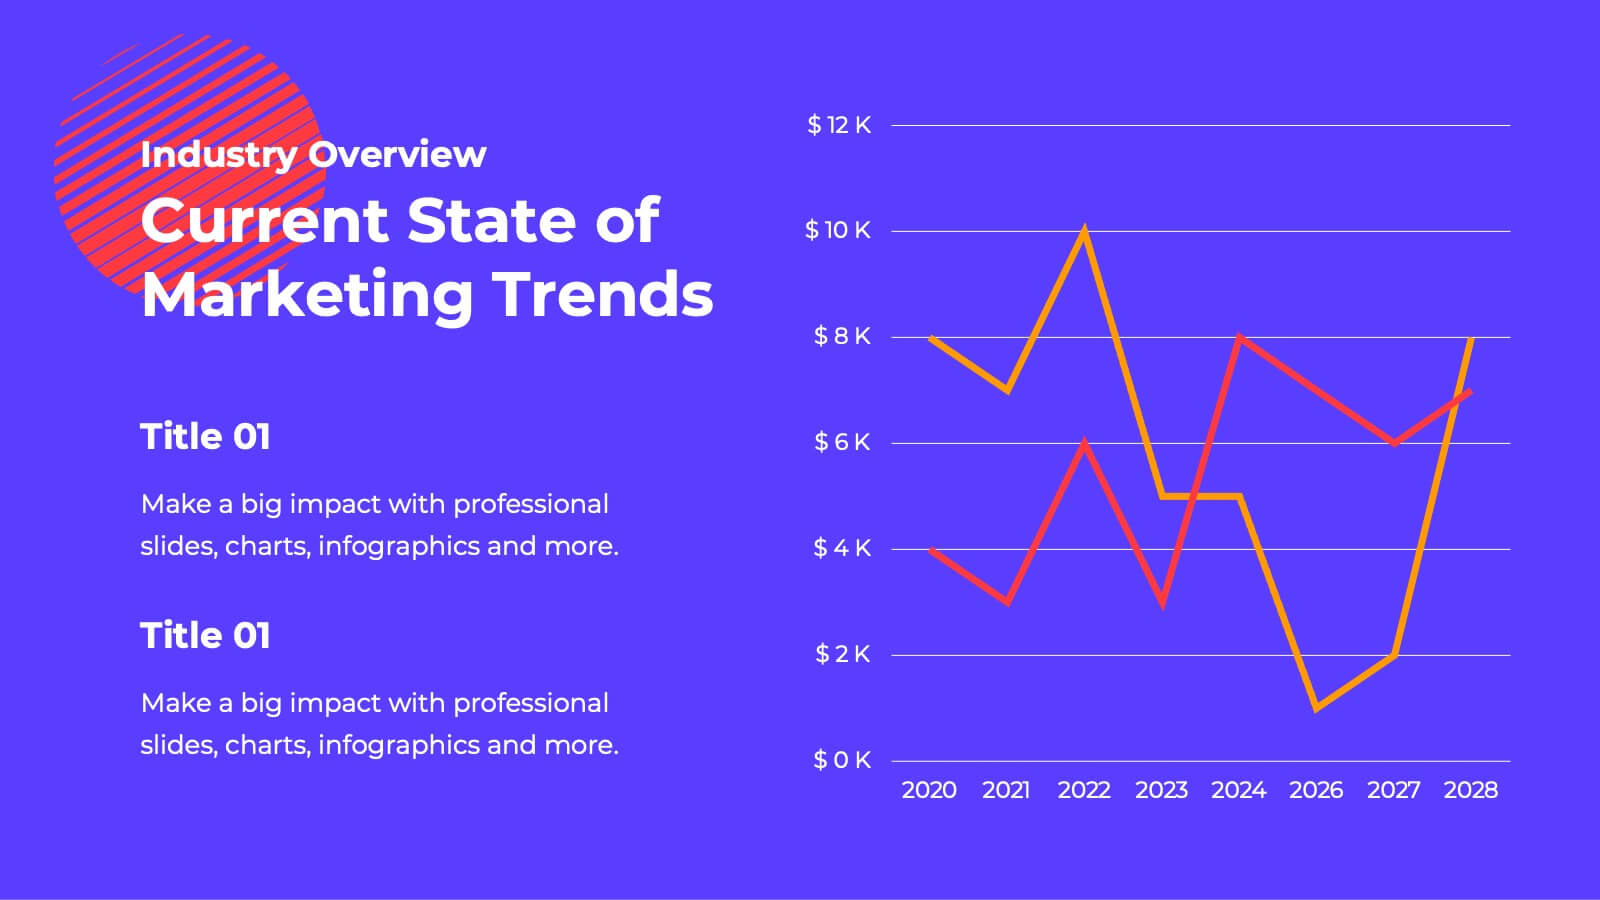
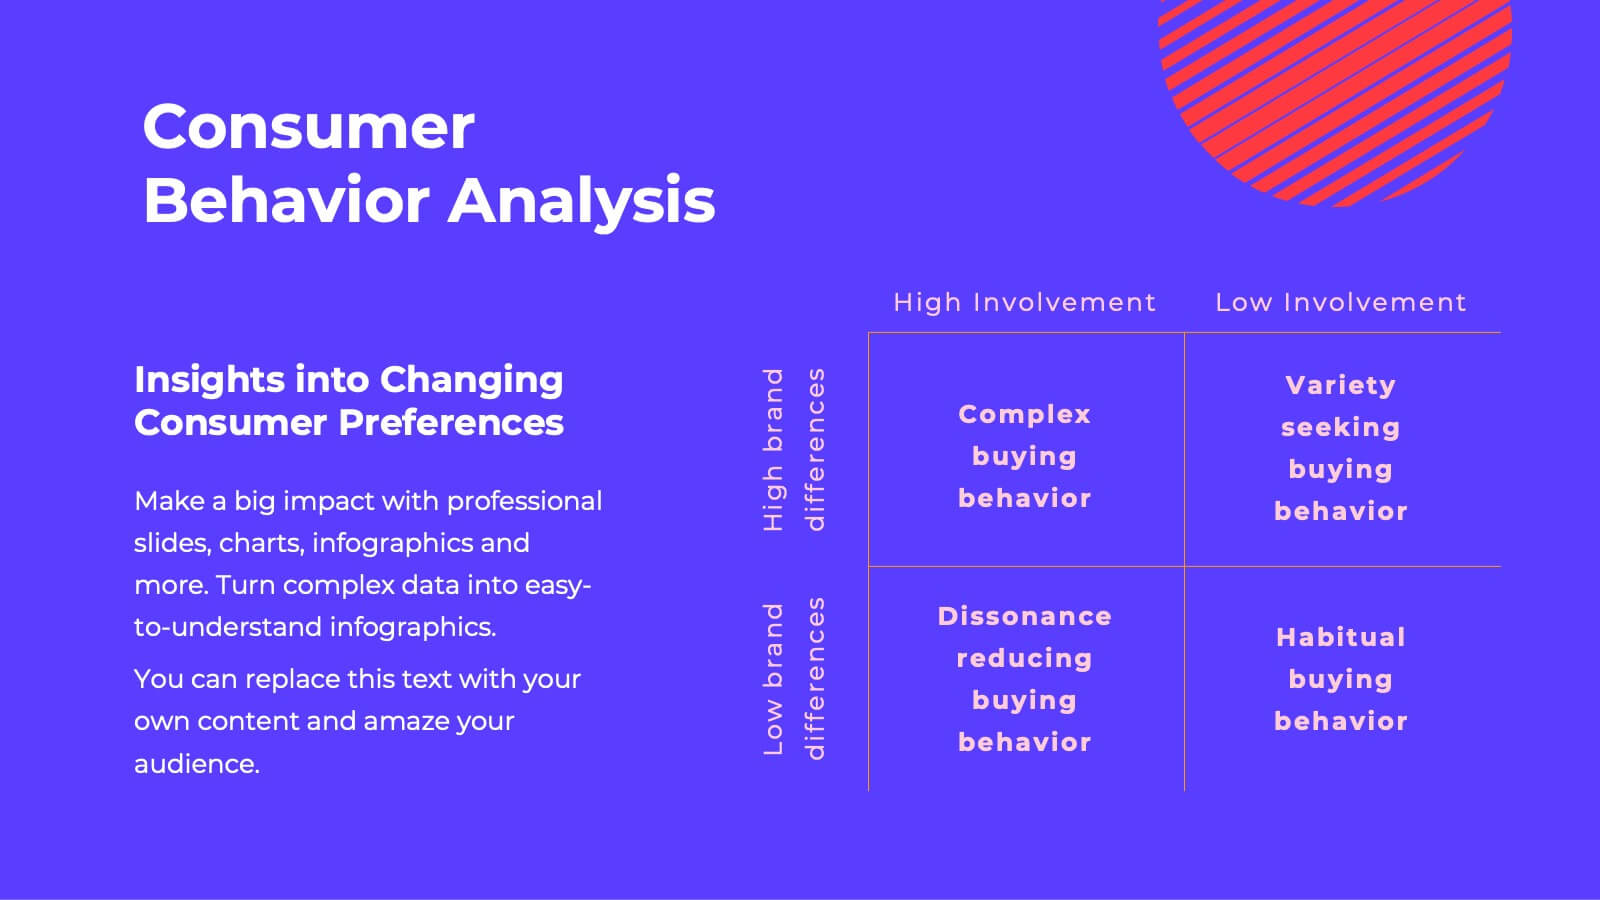
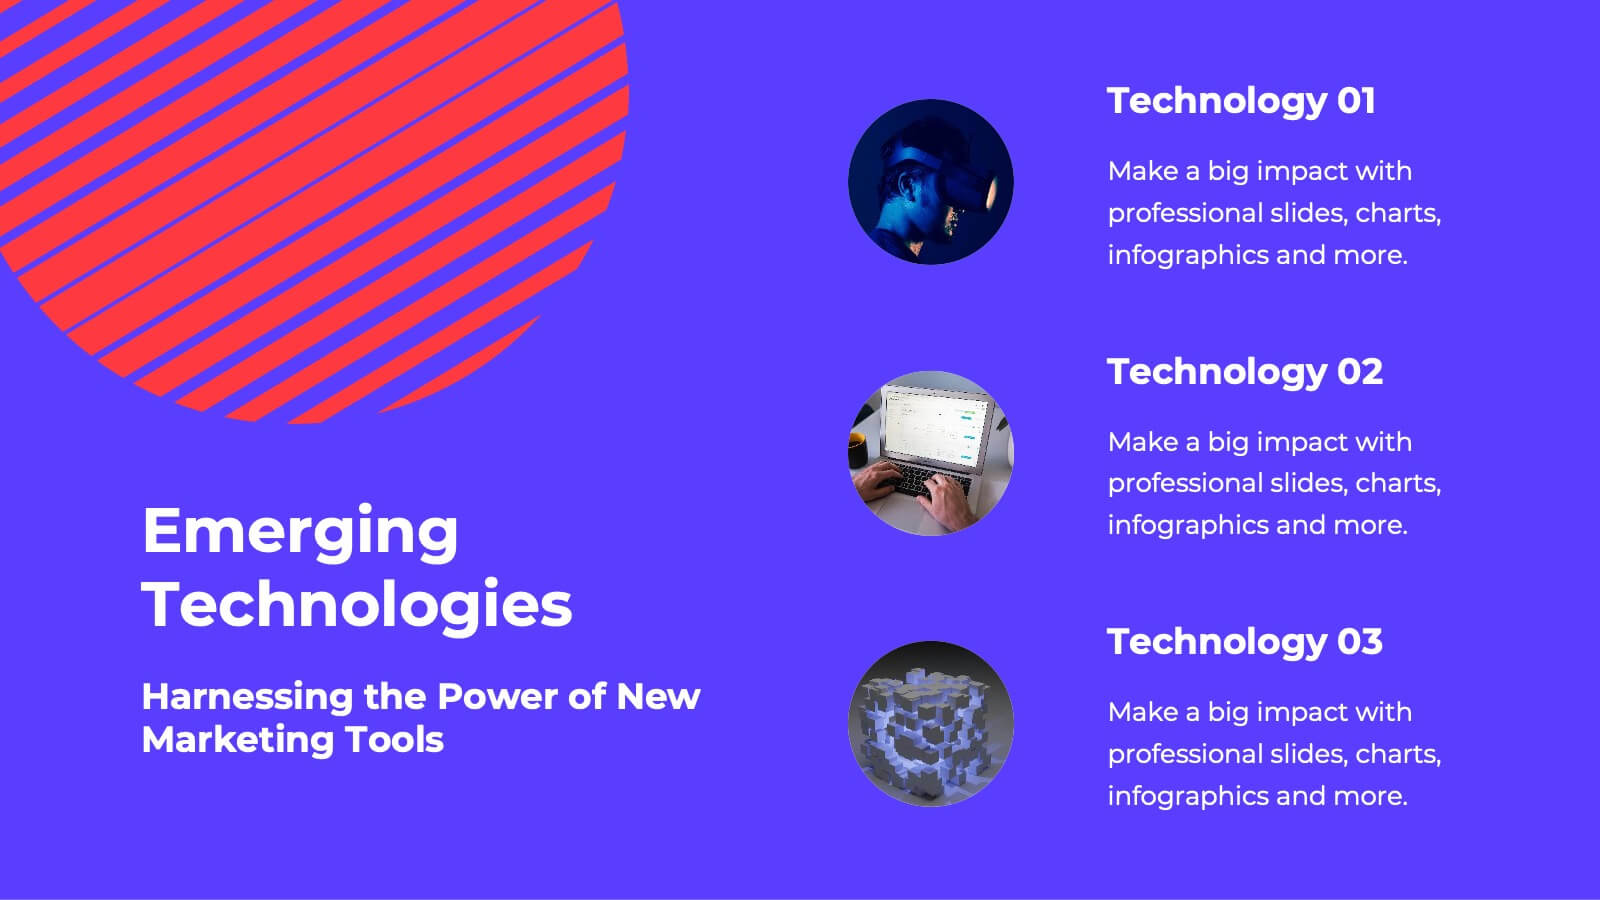
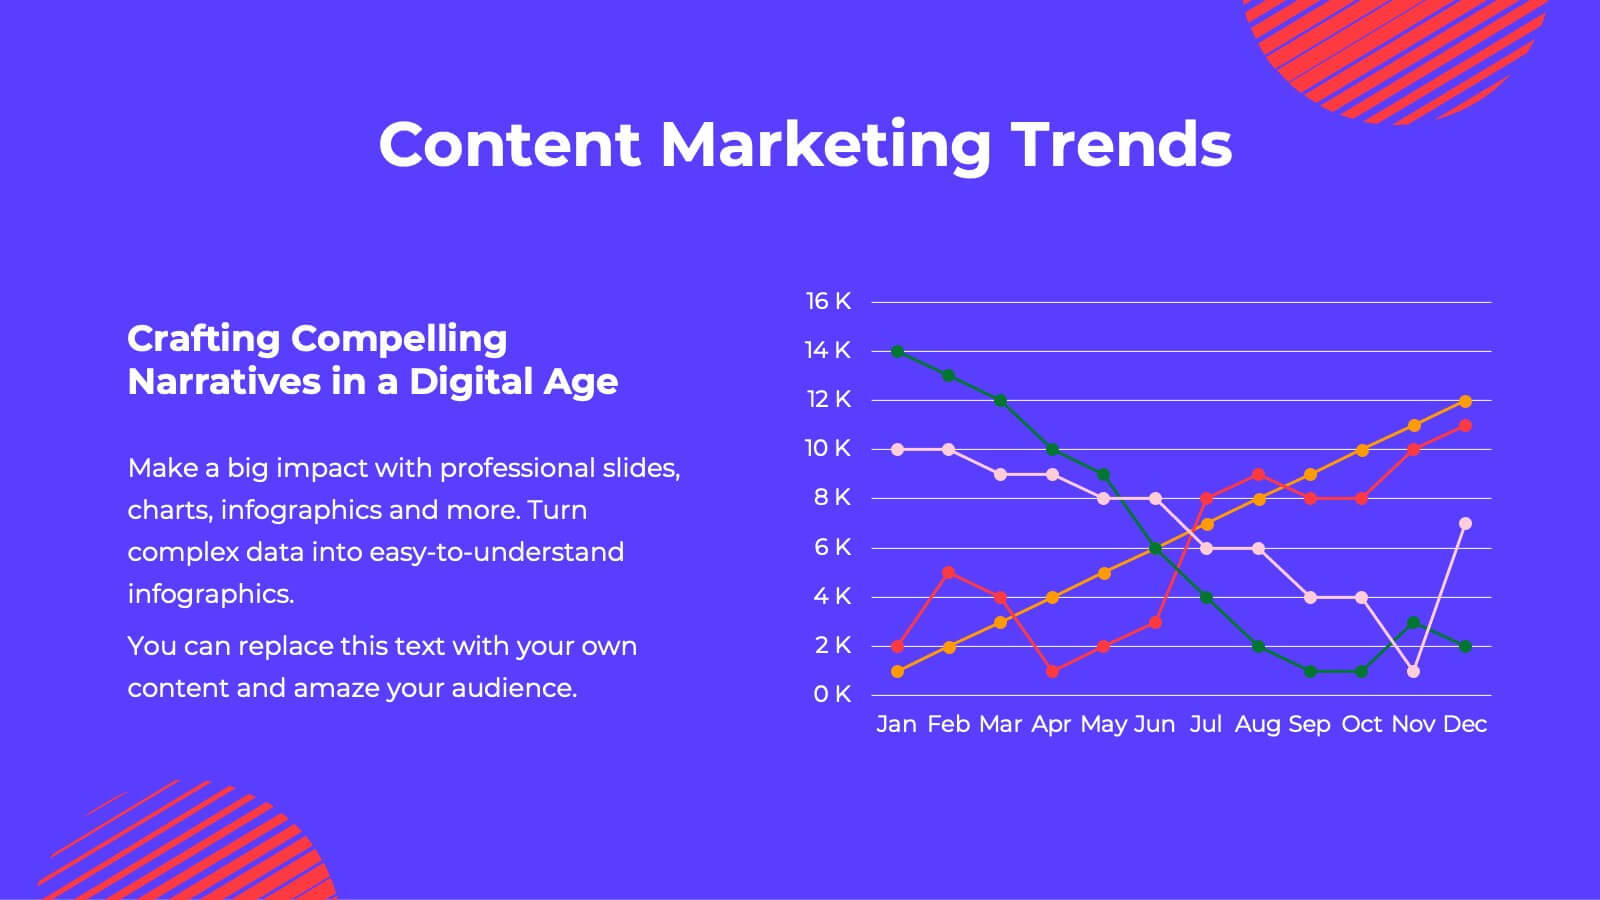
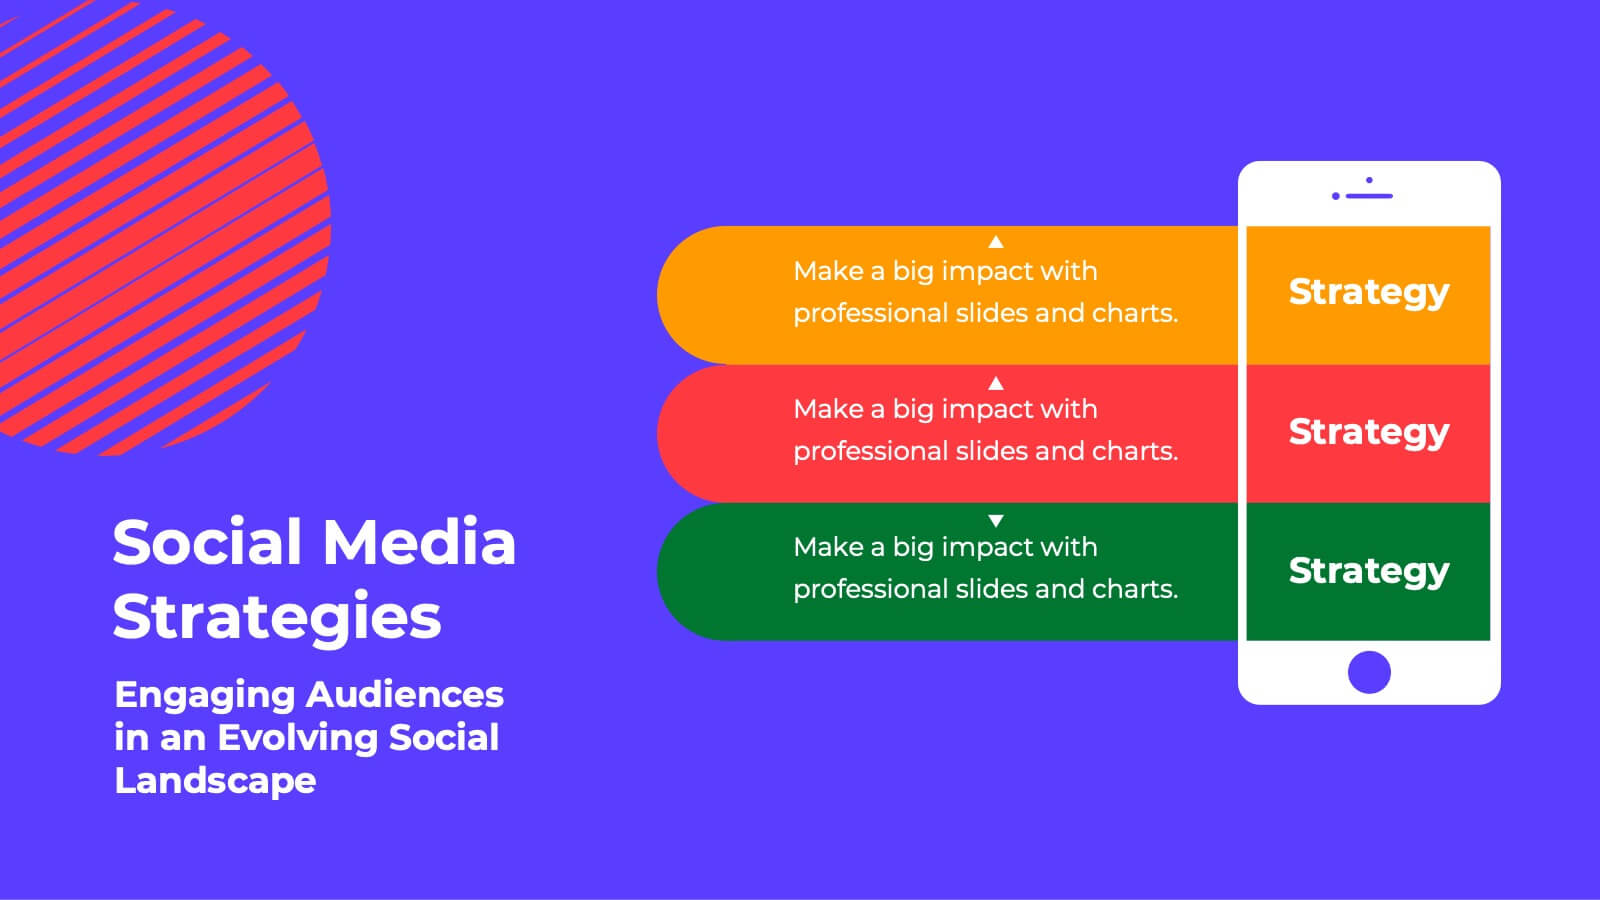
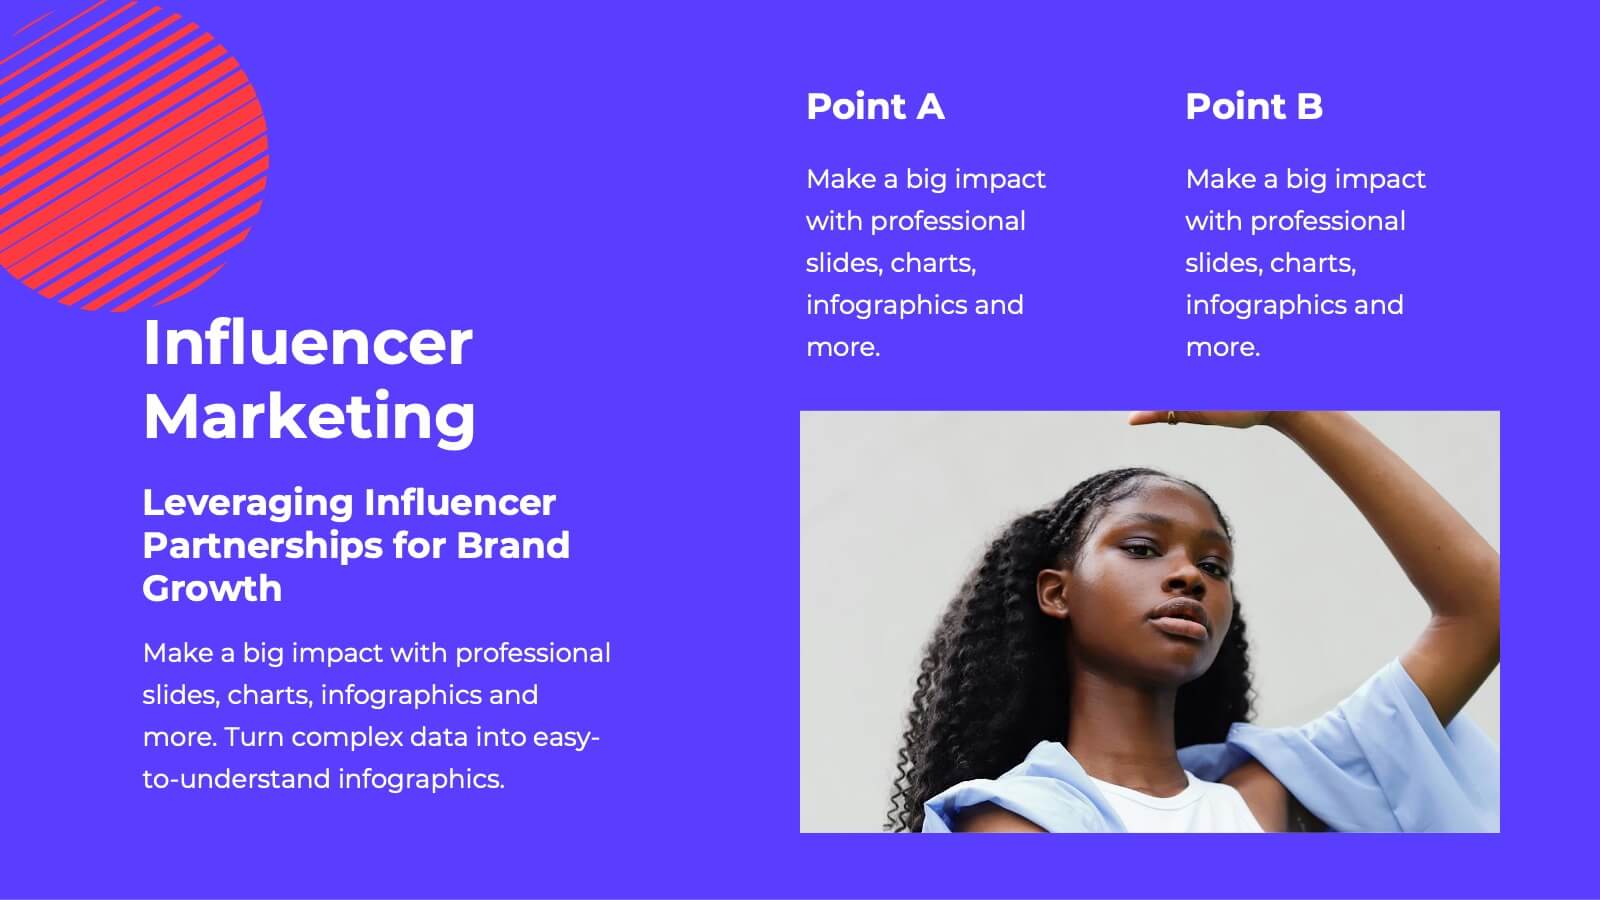
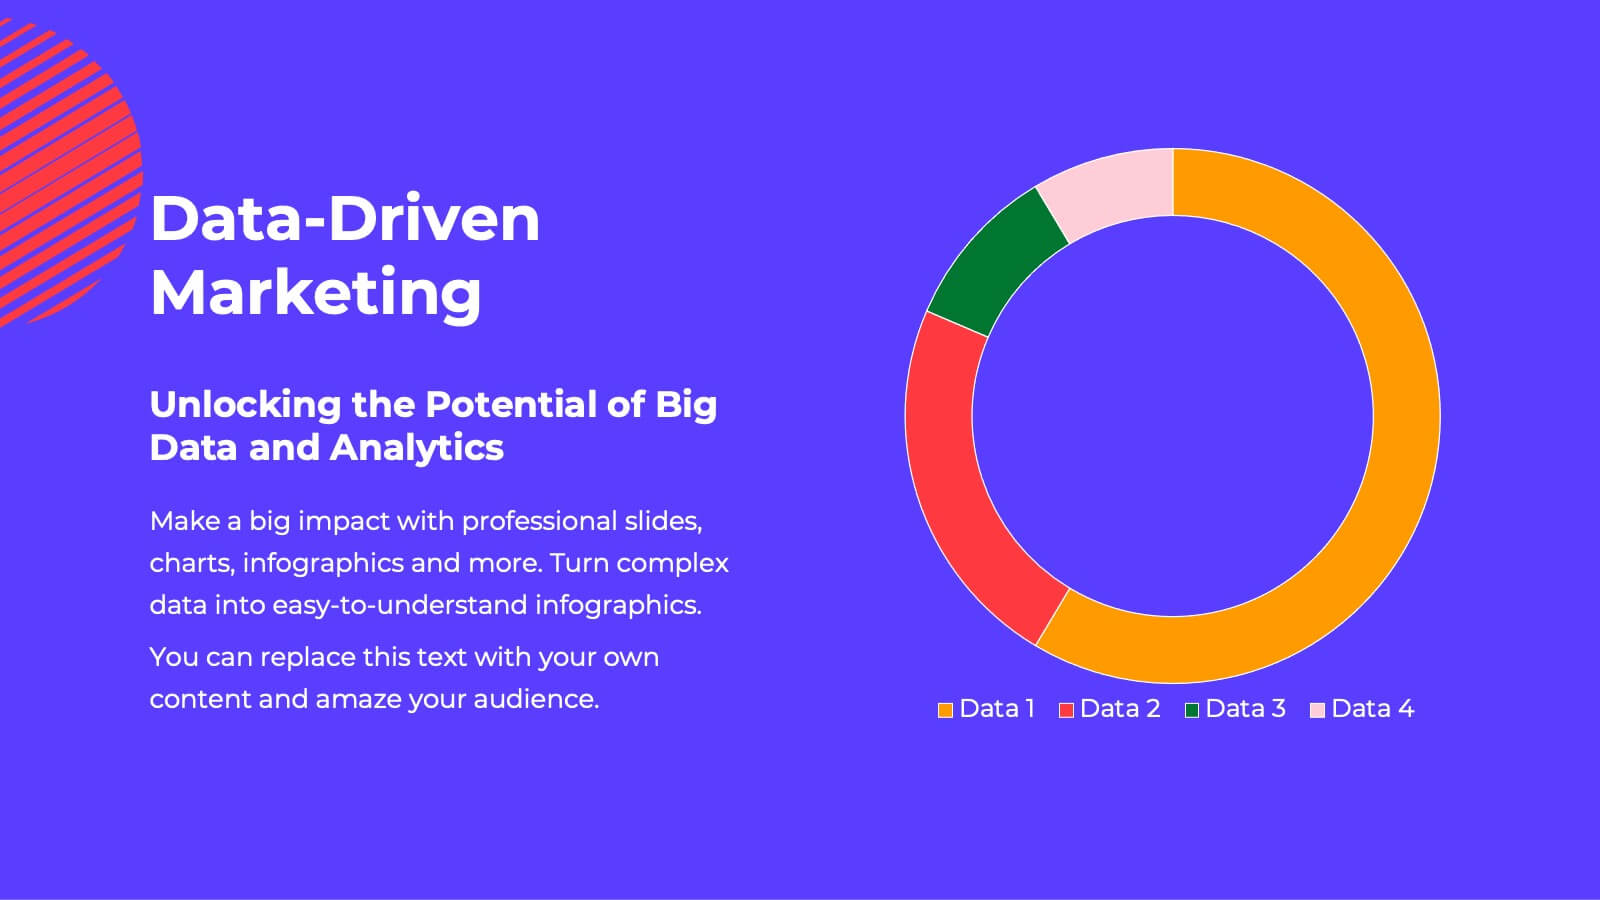
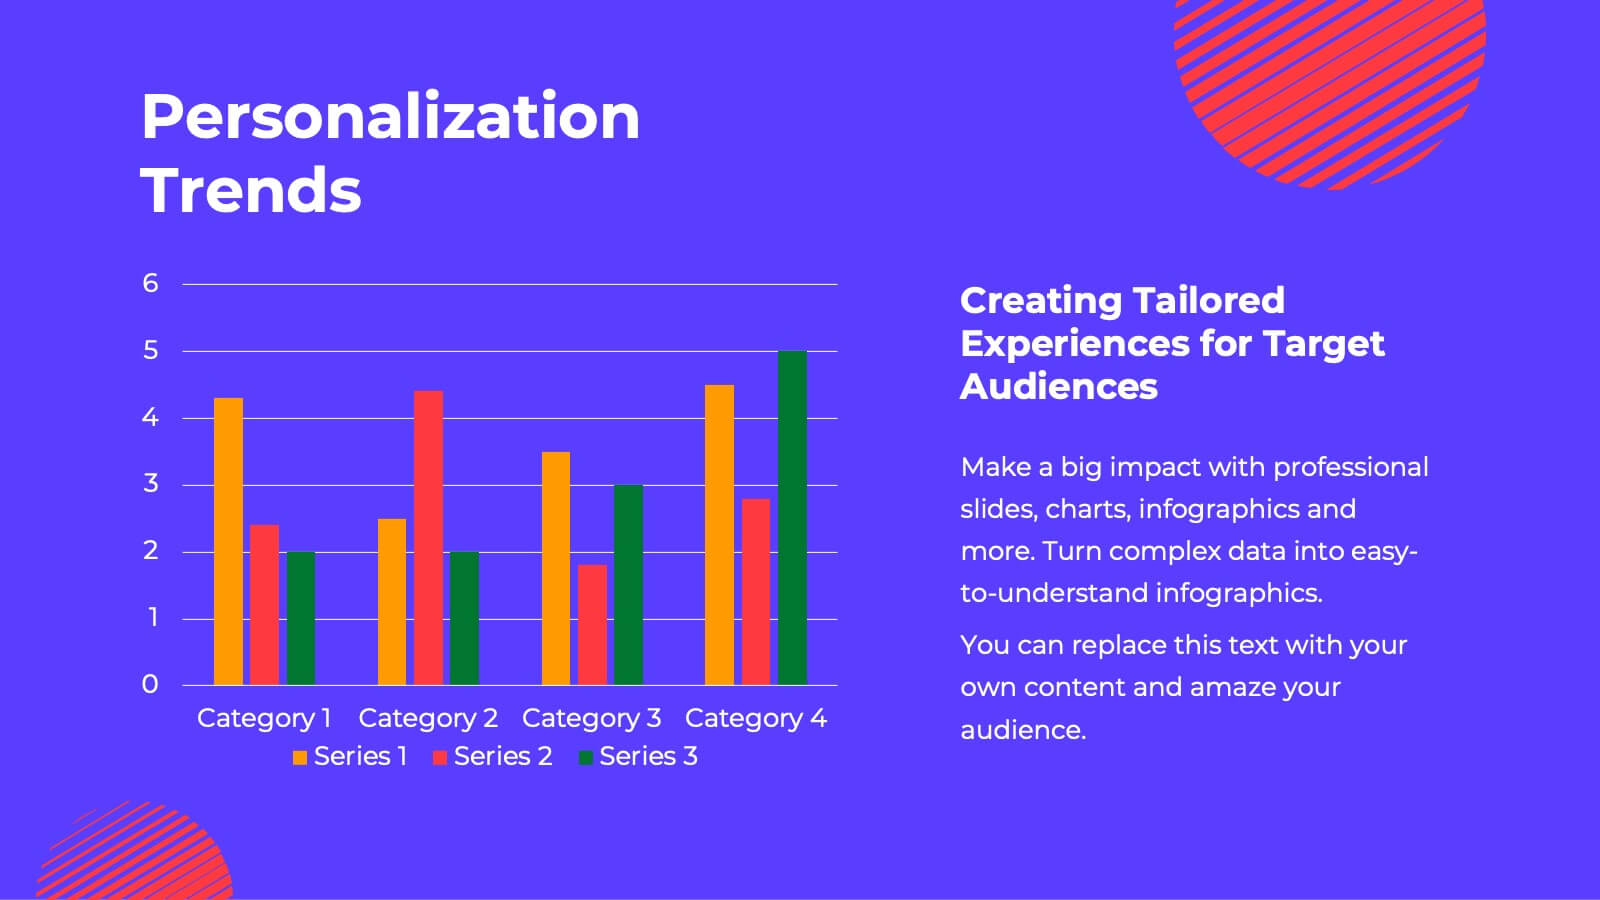
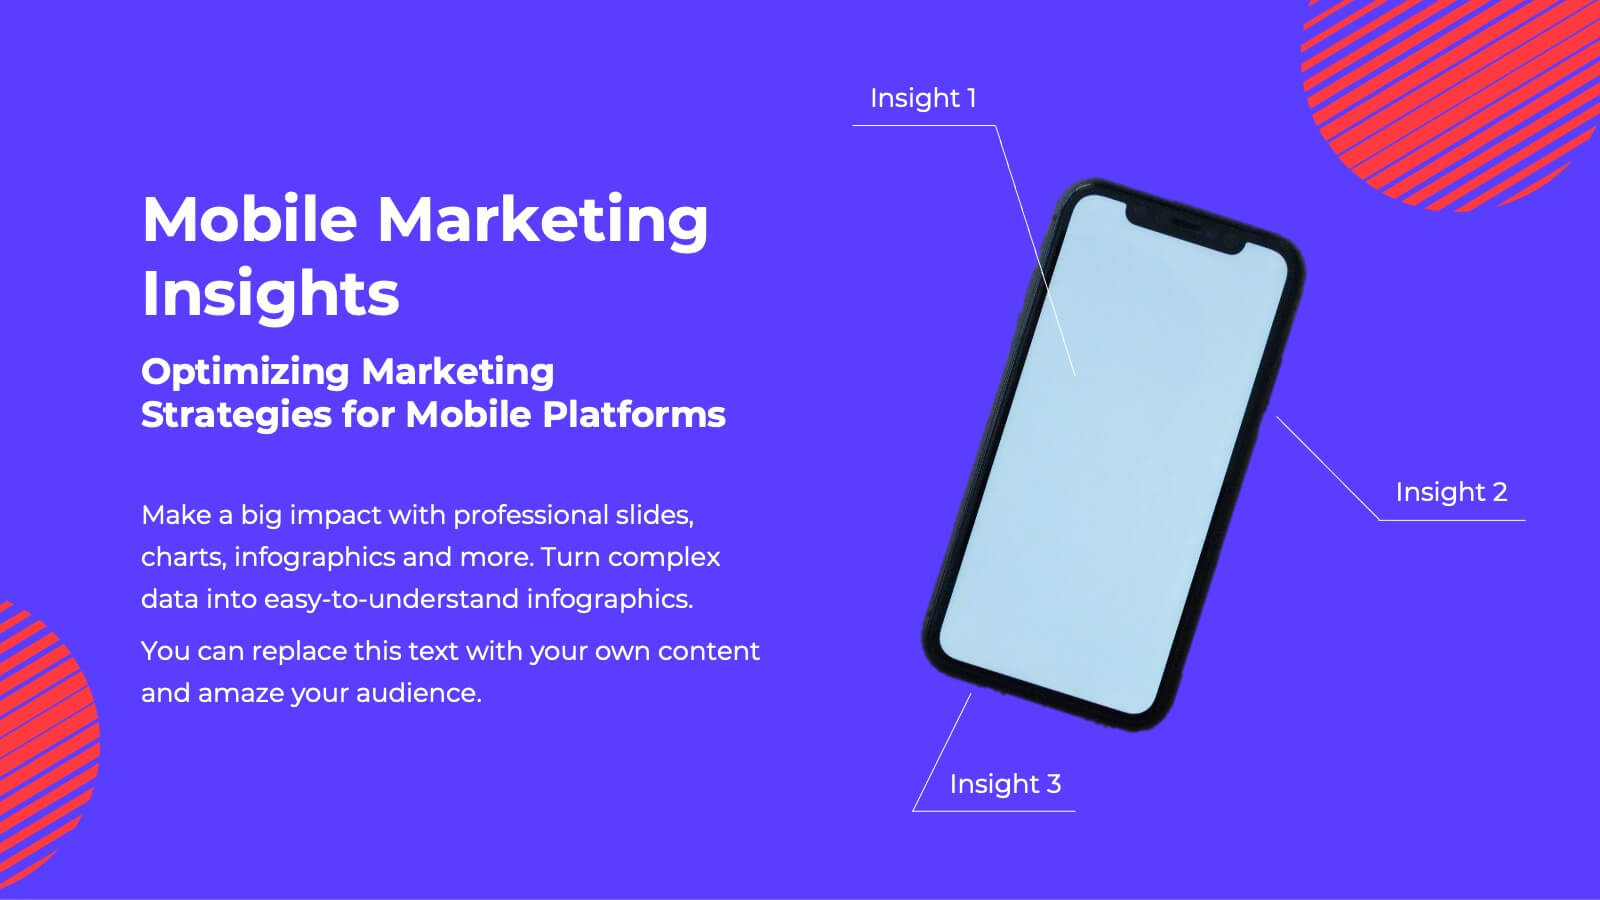
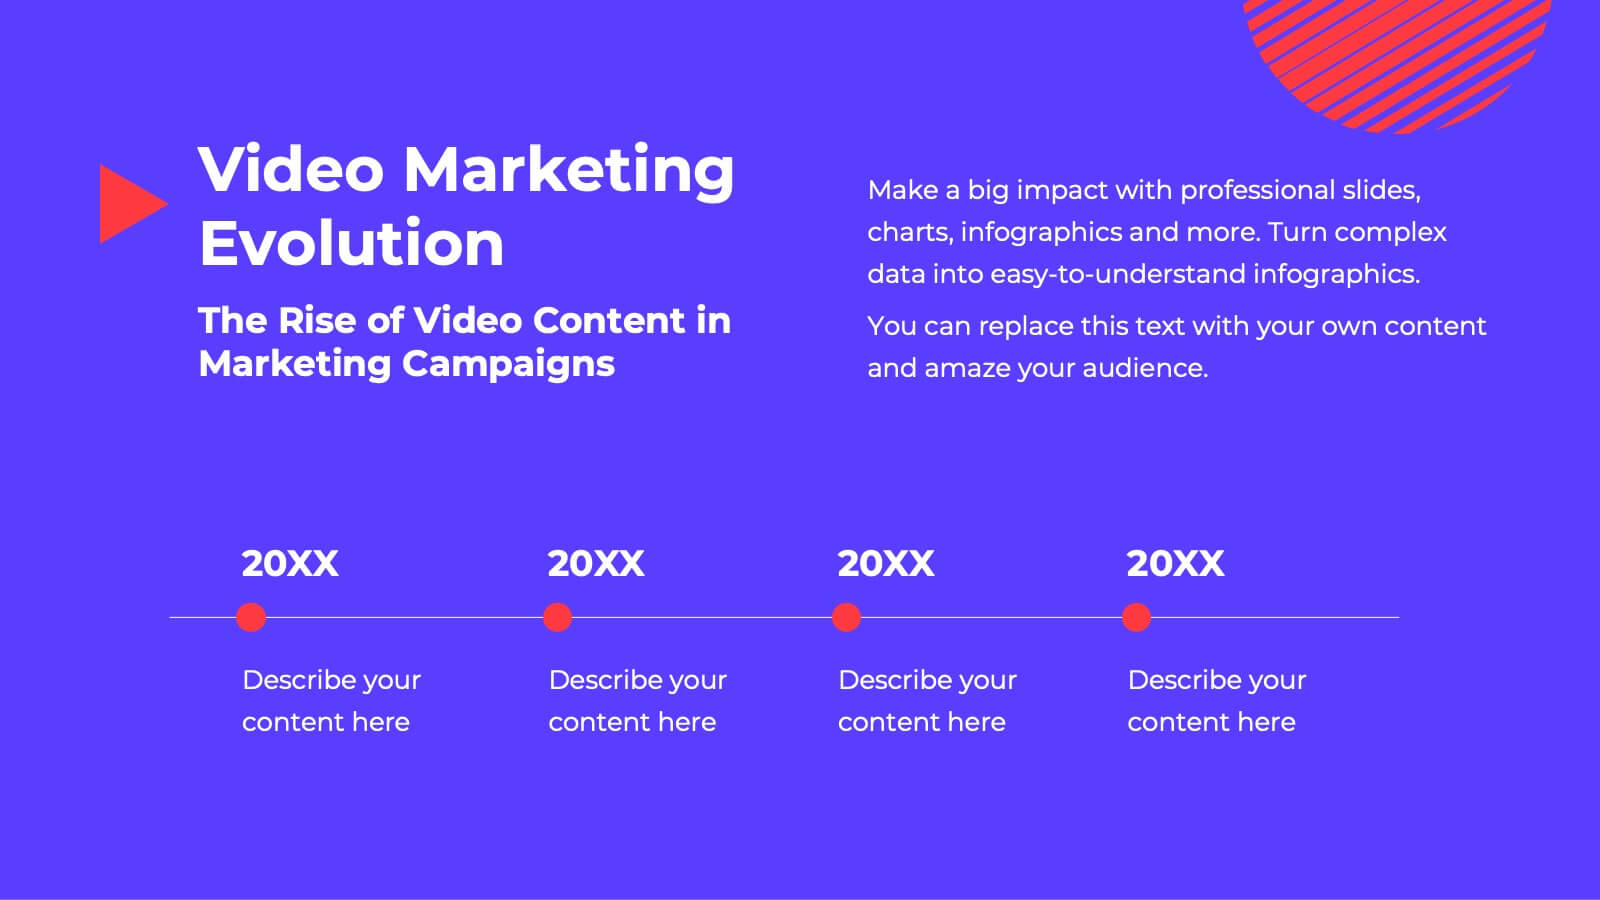
Fusion Marketing Campaign Presentation
Unleash the power of your marketing campaigns with this vibrant marketing campaign template! Dive into social media strategies, influencer marketing, data-driven insights, and more. Perfect for presenting to stakeholders and team members. Fully customizable and compatible with PowerPoint, Keynote, and Google Slides.


5 slides
Monthly Report Statistics Infographics
A Monthly Report is a document that provides an overview of activities, progress, achievements, and challenges within a specific month. These infographic templates are designed to present monthly data and statistics in a clear and engaging manner. These infographics will help you showcase key information effectively. This is perfect for preparing reports for management, stakeholders, clients, or colleagues, this template will help you communicate your findings clearly and impressively. Compatible with Powerpoint, Keynote, and Google Slides, its customizable design and visual appeal will ensures that your monthly reports are engaging and informative.


7 slides
Root Cause Model Infographic
Unlock problem-solving efficiency with our Root Cause Analysis Model Infographic, designed for process engineers, quality assurance teams, and business managers. This infographic is a strategic tool to dissect complex issues and identify underlying causes of operational challenges. Our infographic outlines a step-by-step methodology to trace problems back to their fundamental causes, using visual diagrams to map out cause-and-effect relationships. It's crafted to facilitate a thorough examination of processes, systems, and outcomes, promoting a deep understanding of business issues. Customizable elements allow you to detail specific causes, impacts, and the interplay between different contributing factors. This SEO-optimized infographic is designed to be an accessible resource for professionals dedicated to continuous improvement and corrective action planning. Employ this infographic to guide your team through root cause analysis, fostering a culture of proactive problem-solving and sustainable solutions within your organization.


7 slides
Six Sigma Training Infographic
Six Sigma is a data-driven methodology and approach for eliminating defects and improving processes in any business. This is a bold, transformative tool designed to equip individuals and organizations with the prowess of Six Sigma methodology. This template is the roadmap to excellence, paving the way for achieving remarkable improvements and efficiency. Fully customizable and compatible with Powerpoint, Keynote, and Google Slides. Unleash the power of Six Sigma through our Six Sigma Training Infographic. Let this be your guide to mastering the art of perfection, driving transformative change, and marching boldly towards operational excellence.


4 slides
Company Vision and Long-Term Goals Presentation
Present your company’s future with clarity and impact using this Company Vision and Long-Term Goals slide. Featuring a bar chart-style graphic with ascending growth stages, this template allows you to showcase strategic milestones, business values, or development phases. Each bar is paired with icons and editable text to highlight specific goals, making it ideal for leadership meetings, strategic planning, or investor pitches. Clean, modern, and customizable in PowerPoint, Keynote, and Google Slides.


5 slides
Innovation & IT Solutions Presentation
Spark fresh ideas with a slide designed to showcase technology, creativity, and strategic thinking in a clear, modern layout. Use it to break down IT processes, highlight innovative solutions, and communicate complex concepts with ease. Clean icons and thoughtful structure keep everything engaging. Fully compatible with PowerPoint, Keynote, and Google Slides.


20 slides
Elysium Product Launch Presentation
Launch your new skincare product with this stylish presentation template. Highlight key features, target market, pain points, and unique selling propositions. Perfect for marketing strategies and production processes. Fully compatible with PowerPoint, Keynote, and Google Slides.


7 slides
Security Service Infographic Presentation
Security is the practice of protecting people, information, and assets from harm or damage. It is essential for compliance, business continuity, and protecting an organization's reputation. This template is designed to help you showcase or discuss security services, products or any other topic related to this. This template contains security graphics, and you can easily add your logo or icon to make the template more fun and eye catchy. This template allows you to customize the slides with any color scheme that suits your brand and communicate important features of your business.


8 slides
Value Creation Strategy
Present your strategic pillars with clarity using this linear, milestone-style layout. Ideal for business consultants, growth strategists, and product teams aiming to showcase value drivers, innovation stages, or competitive differentiators. Fully editable in PowerPoint, Keynote, and Google Slides—customize icons, colors, and text for a branded, professional finish.


7 slides
Budget Planner Infographic Presentation
A Budget Forecasting Infographic is a visual representation of the projected financial performance of a business or organization over a specific period of time. This template is a perfect way to communicate complex financial information in a simplified and visually engaging way, allowing stakeholders to better understand the financial health and future prospects of the organization. This budget forecasting infographic includes table, charts, graphs, and other visual elements that illustrate key financial metrics, such as revenue, expenses, and profits, over the forecast period.


2 slides
Creative Brainstorming Infographic Presentation
Spark fresh ideas with a bold, visually rich layout designed to inspire creative thinking and dynamic collaboration. This presentation blends engaging imagery with clear sections that help you organize concepts, map insights, and share innovative solutions effortlessly. Fully compatible with PowerPoint, Keynote, and Google Slides.


5 slides
Team Role Distribution Matrix Presentation
Clarify responsibilities and improve collaboration with the Team Role Distribution Matrix Presentation. This RACI-style slide helps visualize team accountability across multiple tasks, making it ideal for project management, cross-functional teams, or workflow planning. Each layout option includes clearly labeled roles and color-coded responsibilities: Responsible, Accountable, Consulted, and Informed. Fully editable in Canva, PowerPoint, Keynote, and Google Slides.


6 slides
Agile Development Process Presentation
Bring your process to life with a bold circular workflow that makes each development stage easy to explain and visually engaging. This presentation helps teams outline steps, refine tasks, and communicate progress with clarity and flow. Fully editable and compatible with PowerPoint, Keynote, and Google Slides.


5 slides
Health Benefits Infographics
Health Benefits refer to the positive effects that certain practices, behaviors, or conditions have on a person's physical, mental, and emotional well-being. These informative infographic templates are an effective tool to educate and motivate individuals to prioritize their health and make informed lifestyle choices. Its visually appealing design, concise information, and emphasis on positive outcomes will engage and inspire readers to take action towards a healthier and happier life. This template is designed to present key information in an appealing and concise manner, making it suitable for presentations, websites, social media posts, and educational materials.


23 slides
Infinitum Business Plan Presentation
Present your ideas with confidence using this sleek and professional business plan presentation template. Designed for entrepreneurs, startups, and business professionals, this template offers a clear structure to articulate your vision, strategy, and goals effectively. Featuring sections for executive summaries, SWOT analysis, market research, and financial forecasts, this template ensures every detail is covered. Visually engaging charts, graphs, and infographics make data presentation straightforward and compelling. Team profiles, product highlights, and future projections allow you to showcase your competitive edge. Fully editable in PowerPoint, Google Slides, and Keynote, this template is easy to adapt to your branding and business requirements. With its modern design and structured format, it’s perfect for pitching to investors, stakeholders, or clients. Make an impact and leave a lasting impression with this versatile and comprehensive business plan presentation tool.
10 slides
Professional Business People Icons Presentation
The "Professional Business People Icons" presentation template offers a range of icons designed to represent business roles or activities visually. These slides are structured to incorporate iconography alongside text placeholders, allowing for easy customization to describe specific business functions or departments. The use of simple, clean icons ensures that the content is accessible and straightforward, suitable for professional presentations that require a blend of visual appeal and clarity. This template can effectively communicate various aspects of business operations or team roles in corporate presentations.


5 slides
Corporate Annual Report Insights Presentation
Showcase Your Corporate Success! The Corporate Annual Report Insights Presentation delivers financial highlights, key performance indicators, and strategic insights in a structured, visually appealing format. Ideal for executives and stakeholders, this template ensures clarity and professionalism. Fully customizable and compatible with PowerPoint, Keynote, and Google Slides, it enhances impactful business storytelling.