


Features
- 4 Unique slides
- Fully editable and easy to edit in Microsoft Powerpoint, Keynote and Google Slides
- 16:9 widescreen layout
- Clean and professional designs
- Export to JPG, PDF or send by email


Do you have any questions?
Recommend


5 slides
Consideration in Contract Law Infographics
Navigate the complexities of contract law with our consideration in contract law infographics. Crafted with a vintage aesthetic, using a palette of brown, tan, and blue, this sophisticated template radiates a classic legal ambiance. Ideal for law students, legal professionals, and educators, this collection aids in dissecting intricate contractual principles with clarity and elegance. Compatible with Powerpoint, Keynote, and Google Slides. The creative, vintage-themed design, adorned with graphics and icons, not only enriches your presentation but also serves as a compelling educational tool, transforming legal jargon into accessible information.


2 slides
Creative Brainstorming Infographic Presentation
Spark fresh ideas with a bold, visually rich layout designed to inspire creative thinking and dynamic collaboration. This presentation blends engaging imagery with clear sections that help you organize concepts, map insights, and share innovative solutions effortlessly. Fully compatible with PowerPoint, Keynote, and Google Slides.


6 slides
Biological Structure and Function
Visualize anatomical frameworks with this dynamic skeletal structure infographic. Ideal for biology education, health science overviews, or anatomy lessons, this slide clearly marks major bones and allows for quick content customization. Fully editable in PowerPoint, Google Slides, and Keynote for seamless integration into any curriculum or report.


21 slides
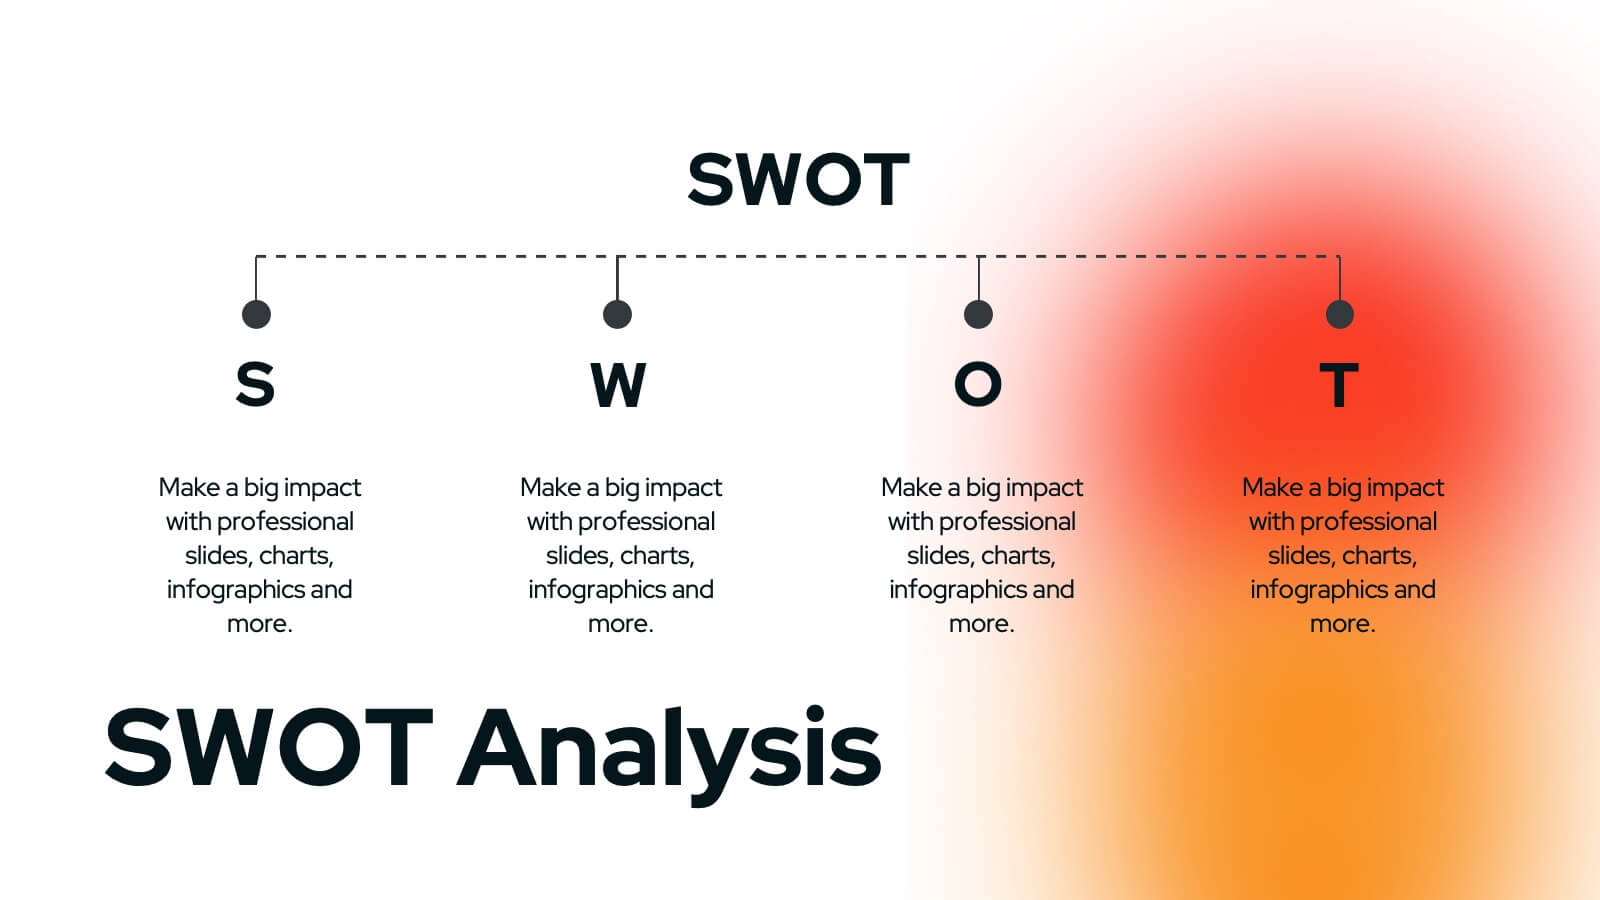
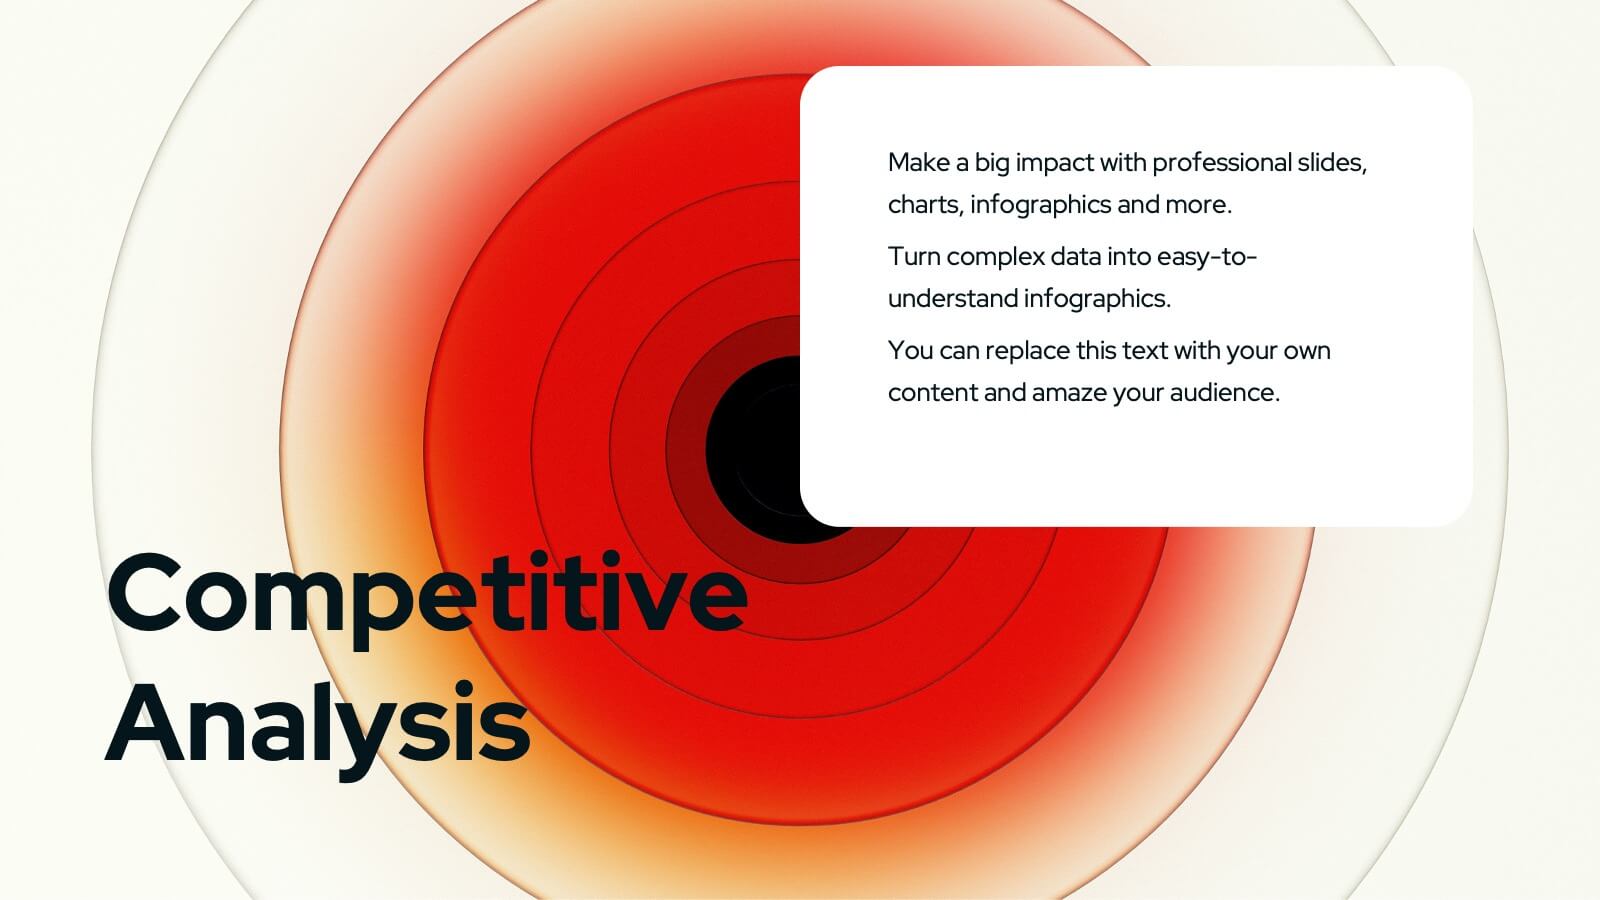
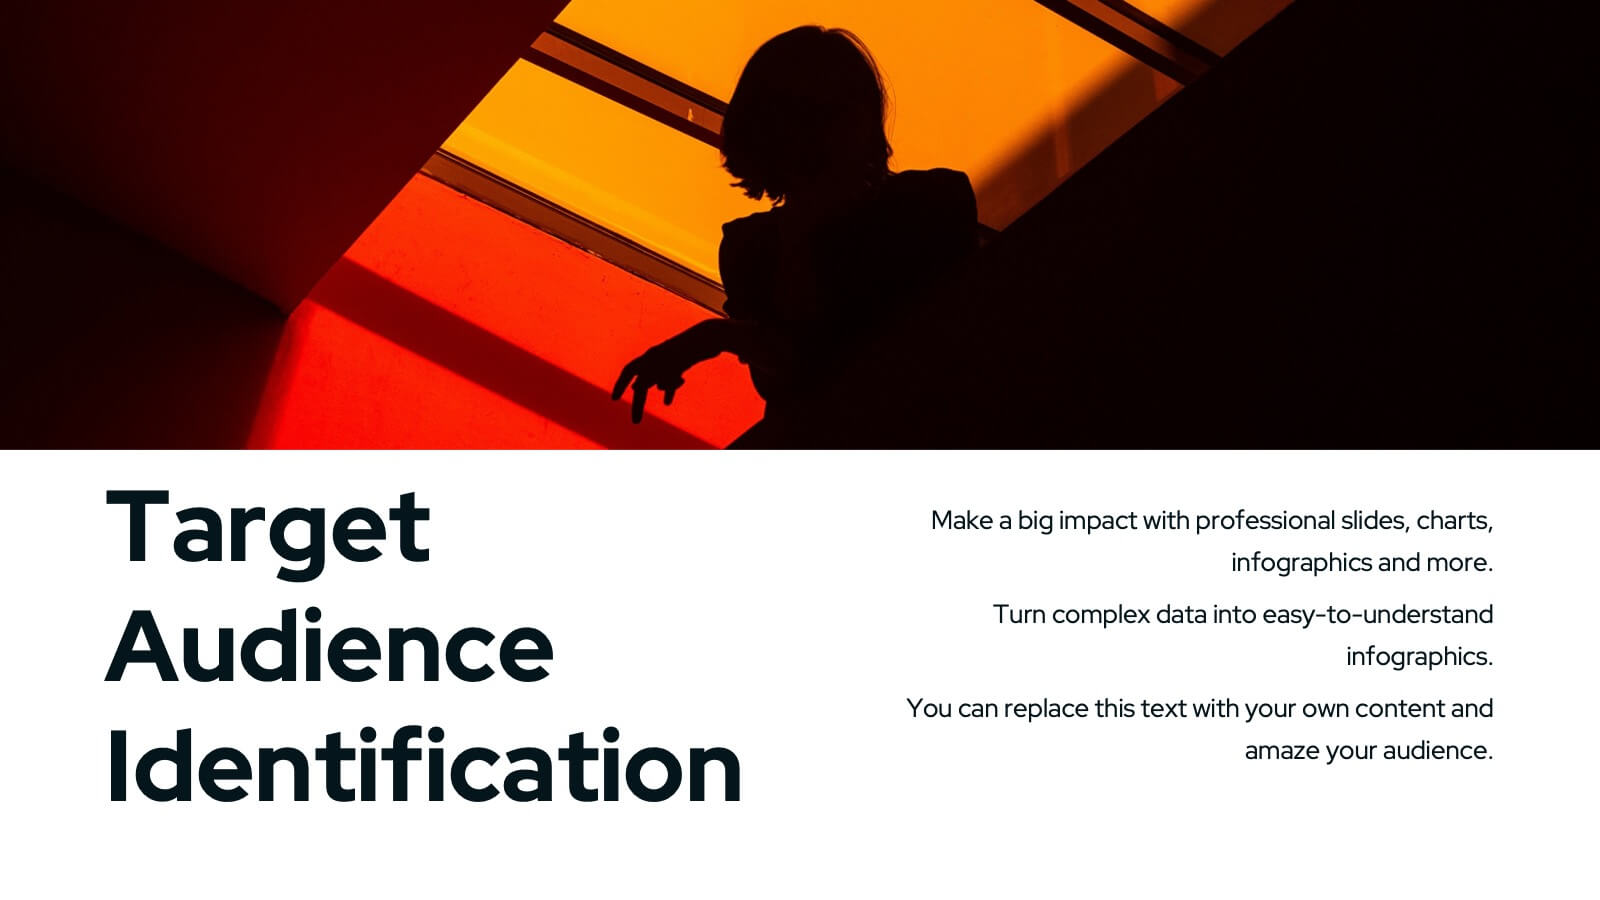
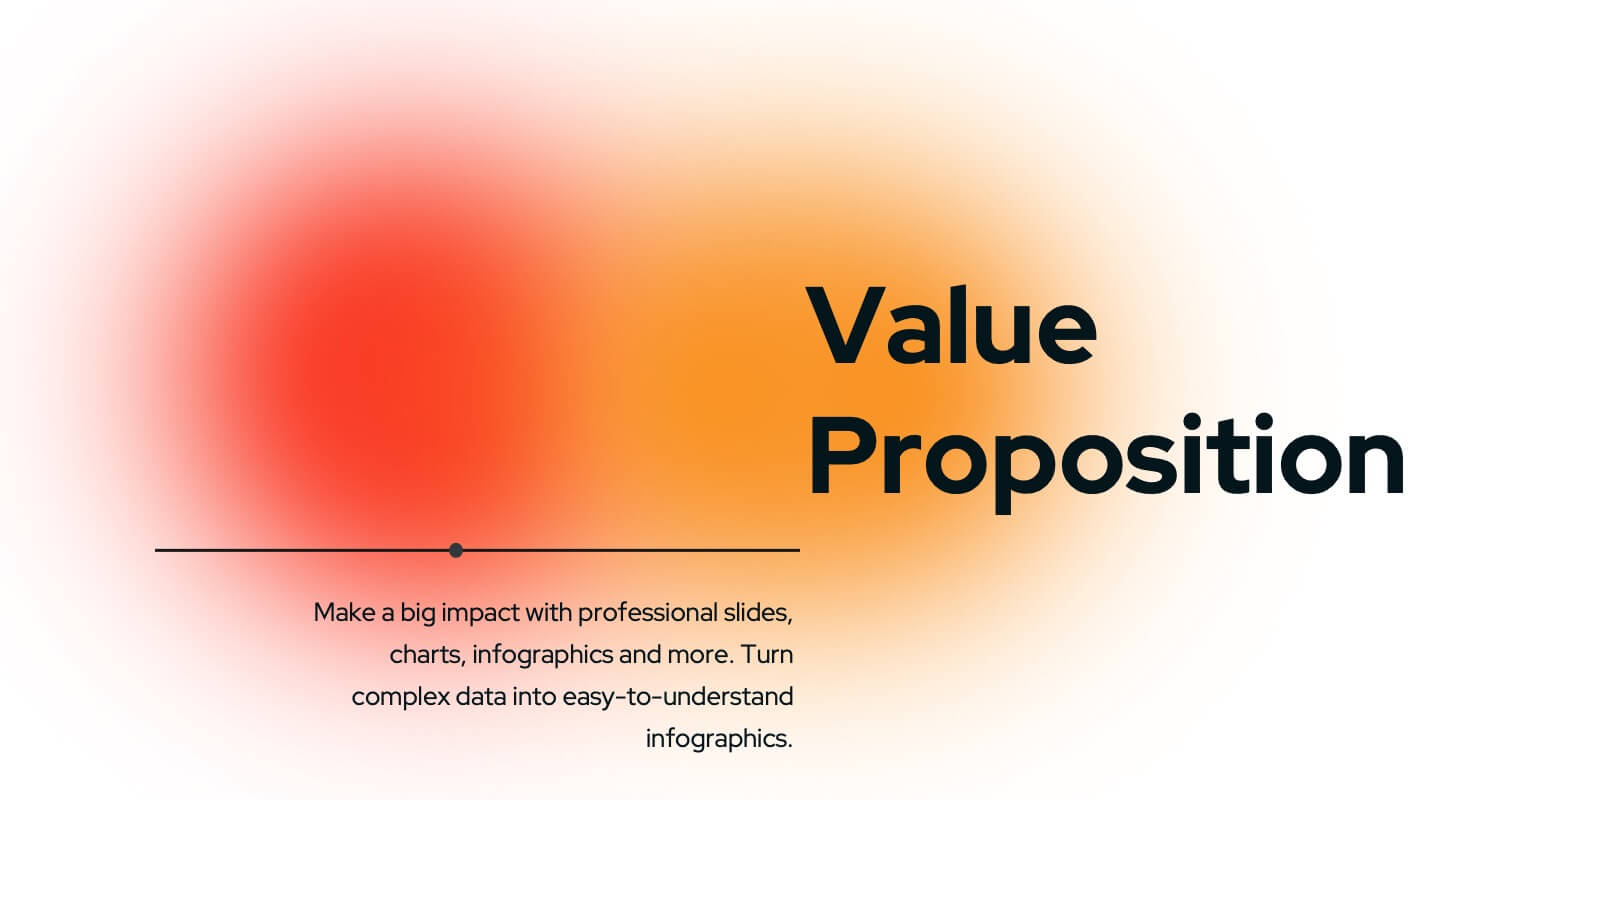
Wyrm Marketing Strategy Plan Presentation
Unleash the power of your marketing strategy with this bold and dynamic presentation template! Perfect for covering everything from landscape analysis and target audience identification to performance metrics and risk management. This template helps guide your audience through key challenges, SWOT analysis, and strategic initiatives with clarity and impact. Compatible with PowerPoint, Keynote, and Google Slides for effortless and engaging presentations.


5 slides
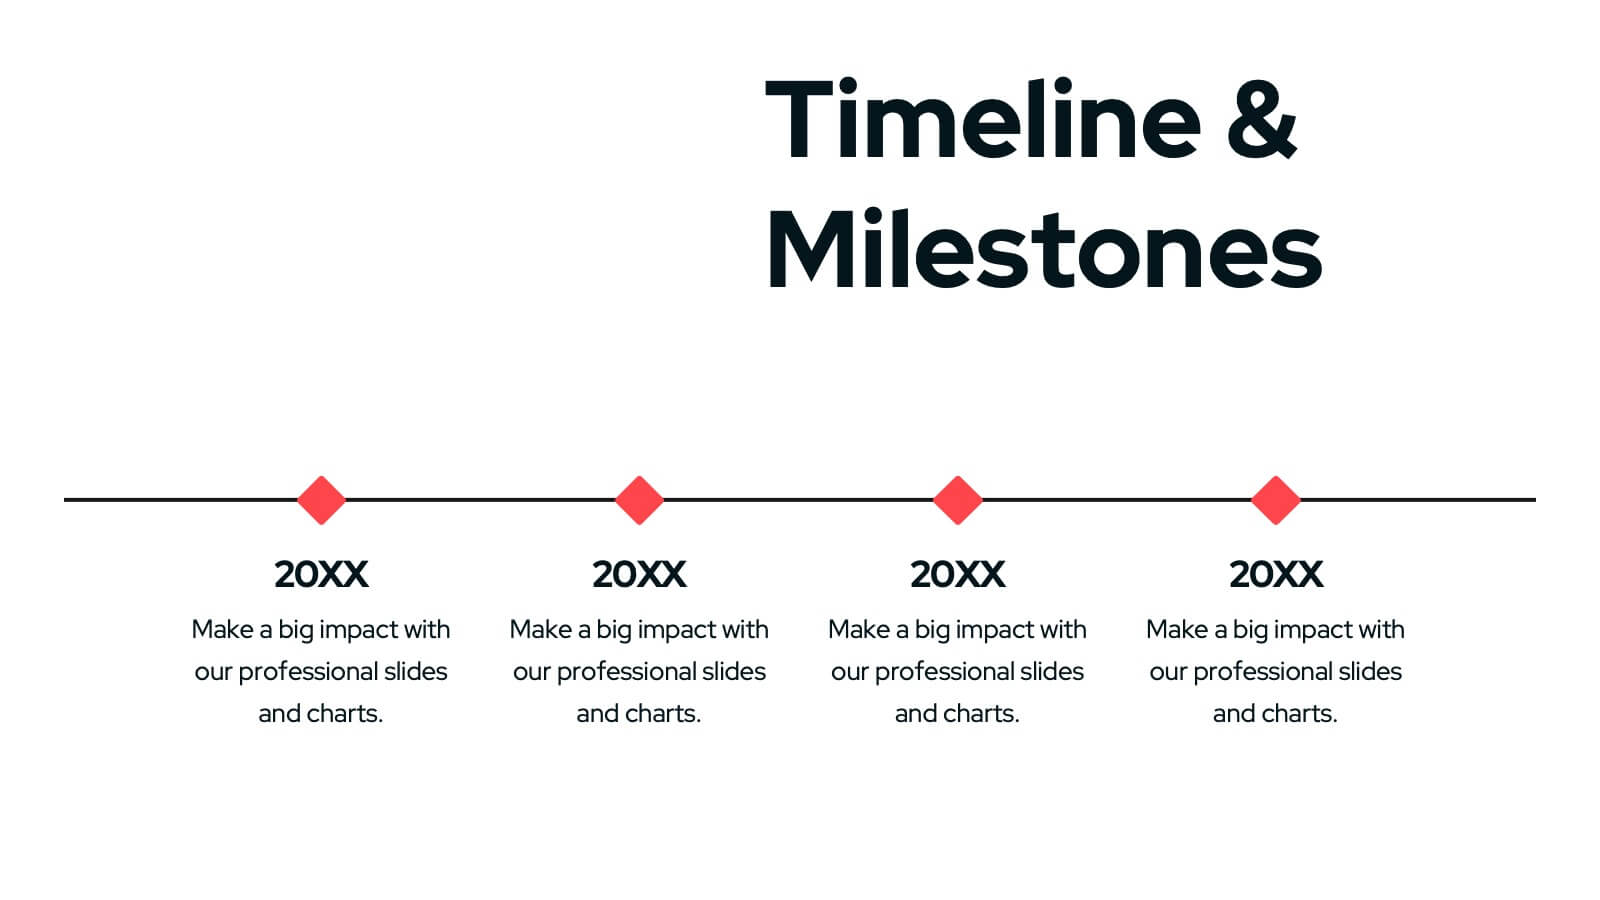
Milestones Timeline Presentation
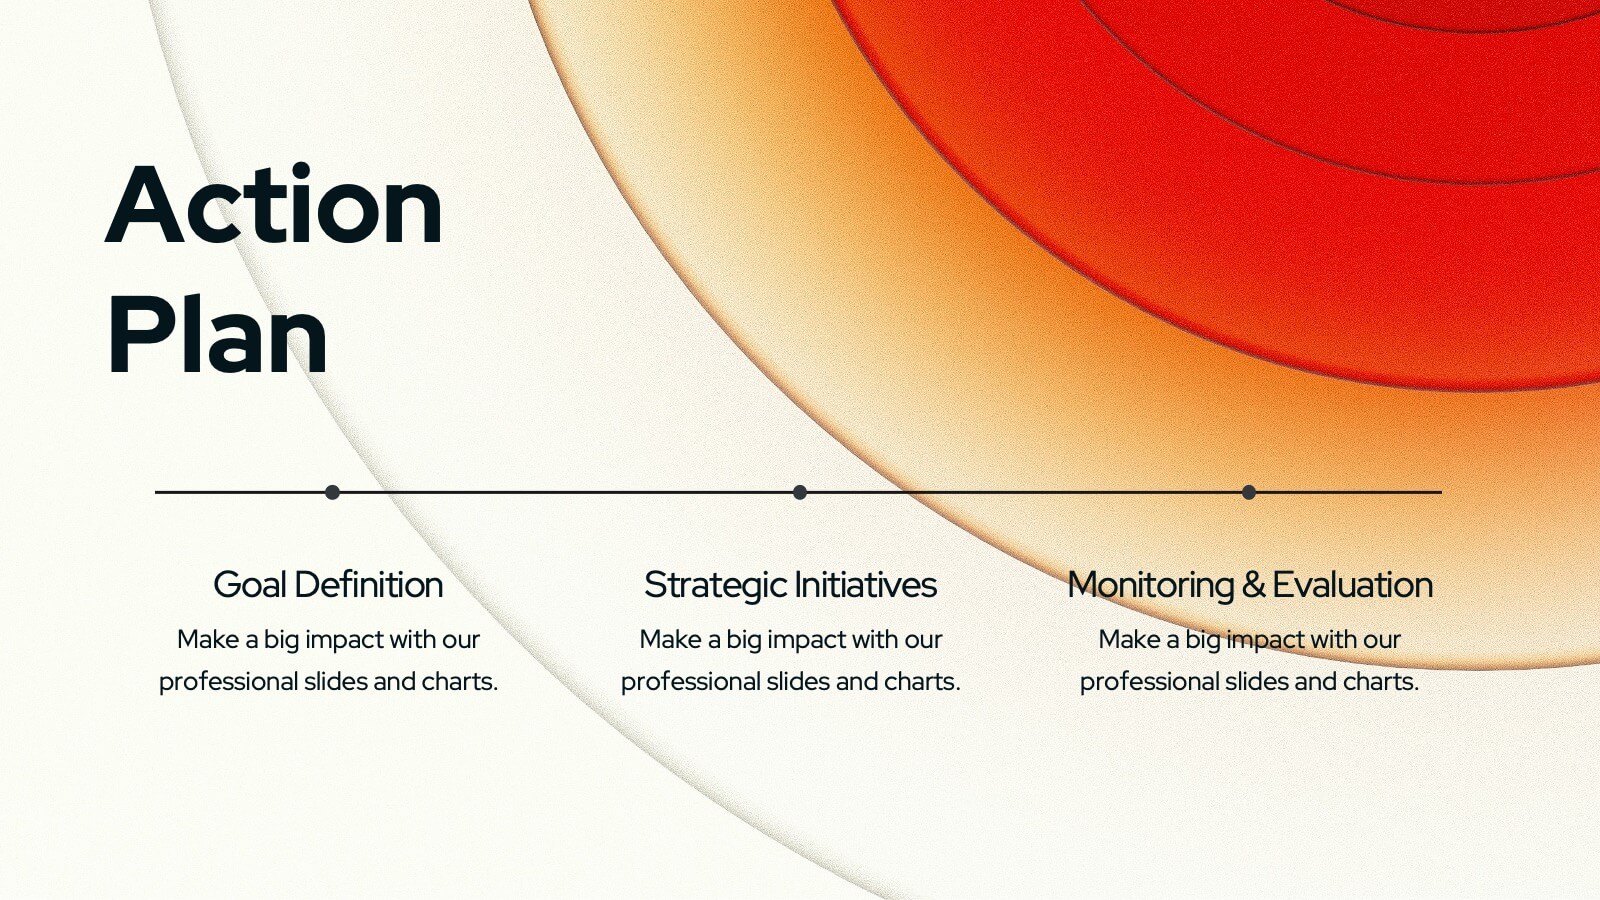
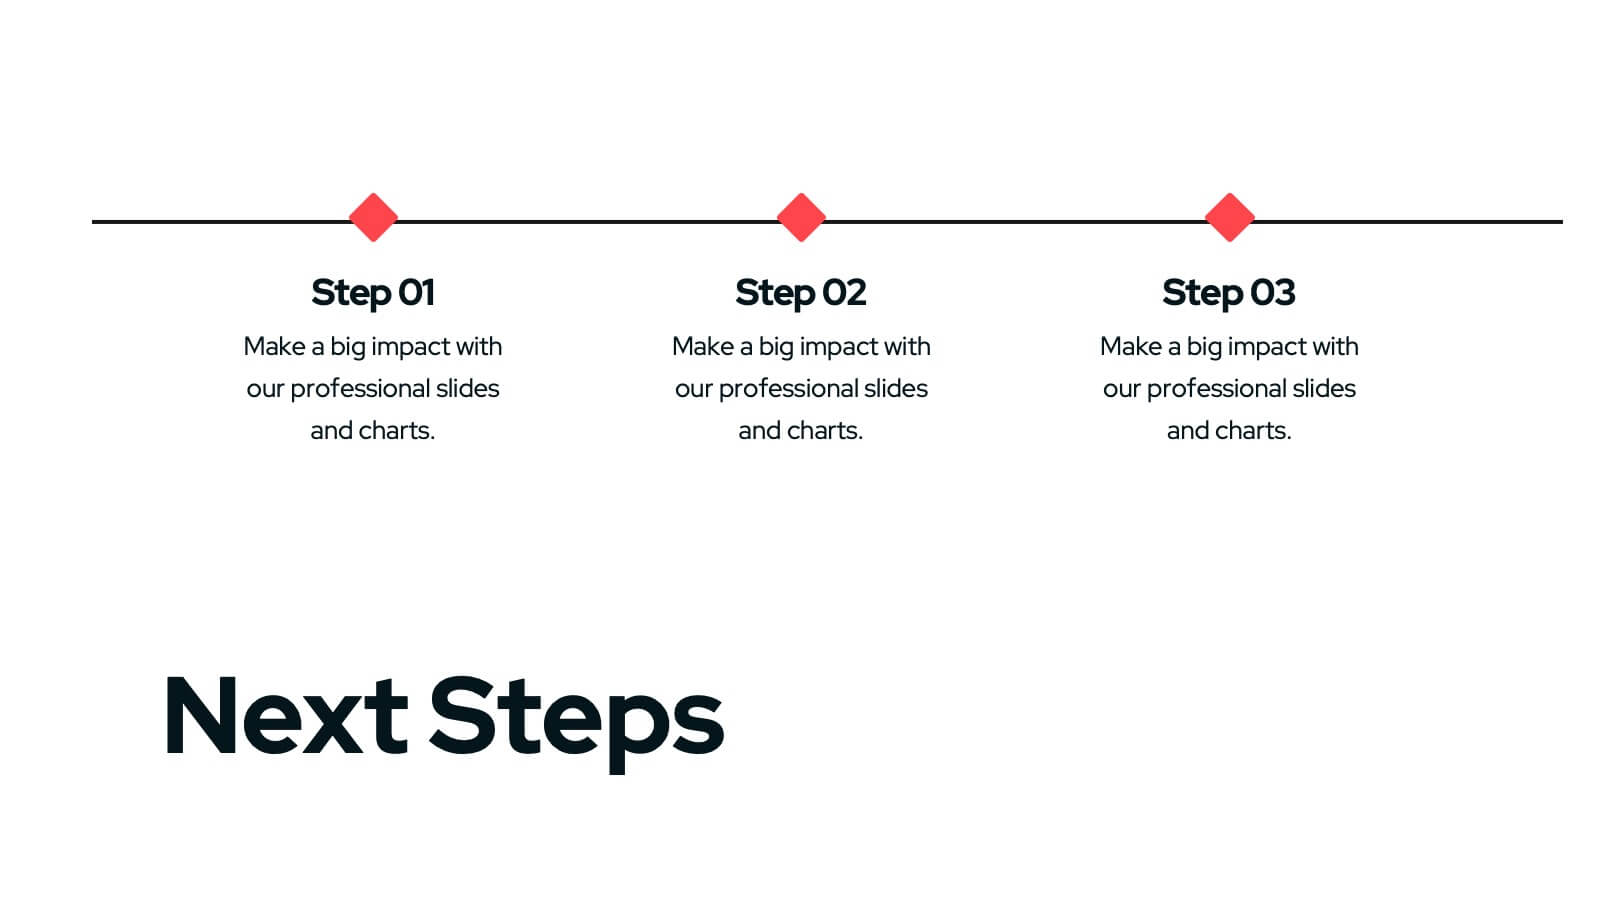
The "Milestones Timeline Presentation" template is designed to illustrate the chronological development of a project or event. It's an effective visual tool that aligns milestones along a straightforward horizontal pathway, enhancing clarity and focus on important dates and goals. Each milestone is marked with distinct icons and titles, making it easy to convey progress and upcoming objectives. This template is particularly useful for project managers, team leaders, and educators who need to communicate key phases and achievements in a temporal context. It serves as an invaluable asset for meetings, reports, or educational materials, ensuring that each milestone is clearly highlighted and easily understood.
4 slides
Growth Path Arrow Design Presentation
Rise with momentum as you visualize progress in a clean, modern layout built for showcasing goals, achievements, and forward movement. This presentation highlights each stage in a clear upward path, helping audiences follow your narrative with ease. Fully editable and compatible with PowerPoint, Keynote, and Google Slides.


6 slides
McKinsey 7S Model Articles Infographics
Explore the seven critical elements that make up the McKinsey 7S Model, including Strategy, Structure, Systems, Shared Values, Skills, Style, and Staff. Each of these components plays a vital role in shaping your company's success. This infographic is compatible with popular presentation tools like PowerPoint, Keynote, and Google Slides, making it effortless to incorporate into your next business presentation. Unlock the secrets of organizational effectiveness with this concise and visually appealing resource. Enhance your understanding of the McKinsey 7S Model and supercharge your company's performance today. Get ready to transform your business strategy with this user-friendly infographic.


8 slides
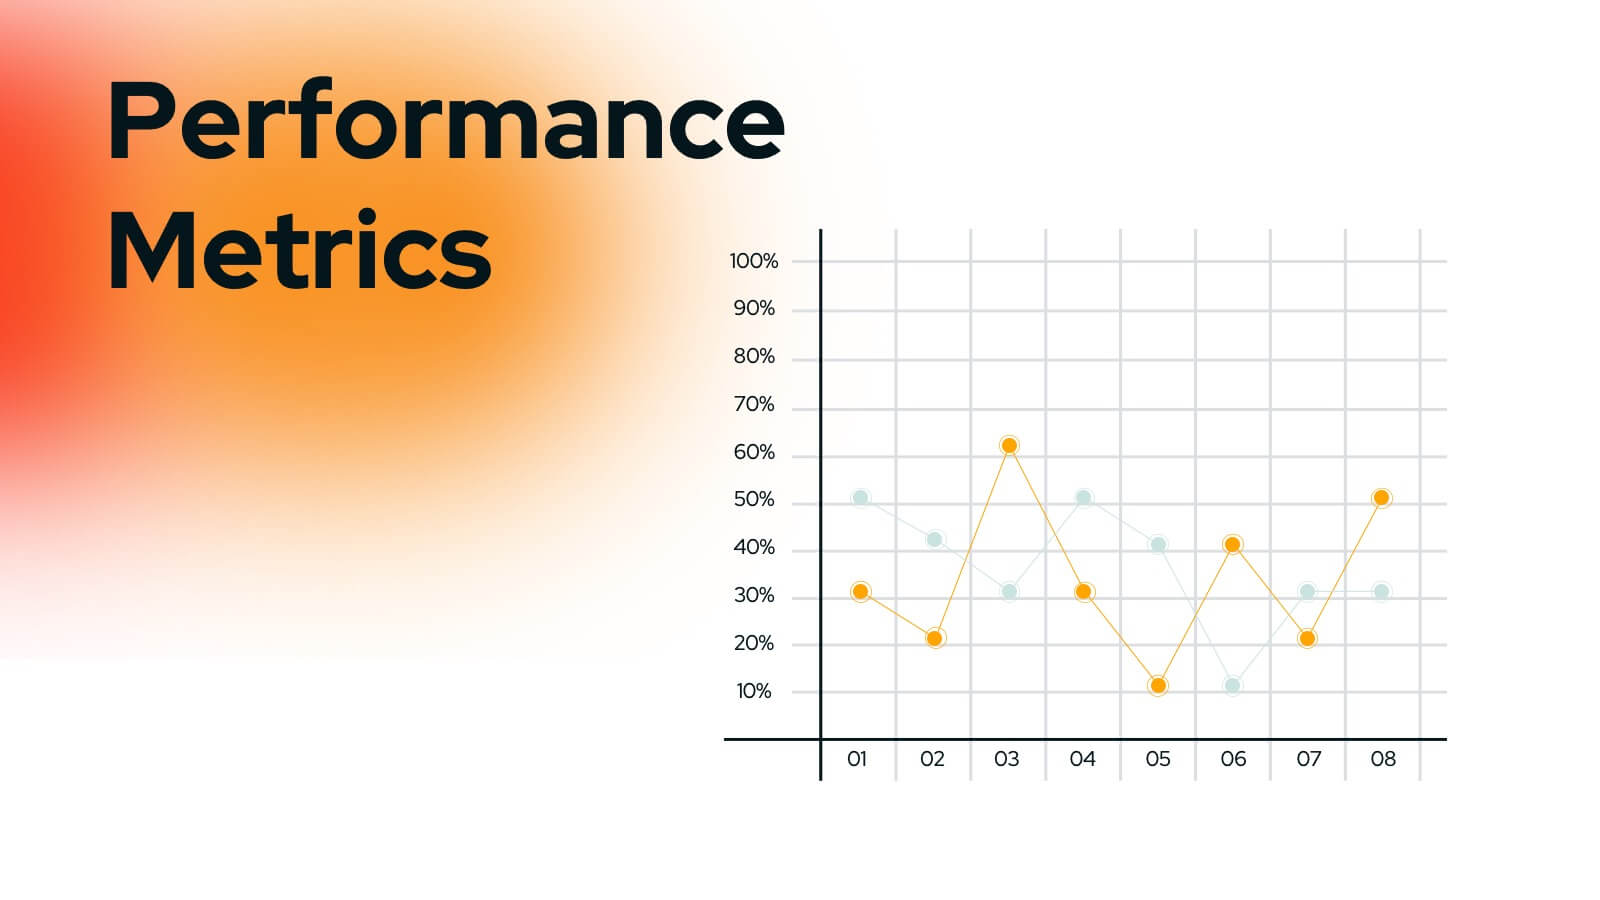
Success Metrics and Performance Presentation
Showcase your Success Metrics and Performance with this data-driven presentation template. Designed with bar-style visualizations and percentage-based highlights, this layout is ideal for business analysts, project managers, and executives looking to present key performance indicators (KPIs) with clarity. Featuring customizable colors, icons, and text placeholders, this template ensures clear and impactful storytelling. Compatible with PowerPoint, Keynote, and Google Slides for easy integration.


7 slides
Creative Timeline Infographic Presentation Template
A Timeline is an essential tool to illustrate the chronology of events; it also provides a method for organizing and summarizing material. With the timelines provided in this template you will be able to visualize the passage of time, so that you can better understand how influences from the past still impact your life today. This template is designed to assist you with crafting your timeline so that it can be easily understood. The color-coding makes it easy to see daily progress. Use the timelines in this template to create useful visualization, and convey the growth of your business or brand.


6 slides
Numeric Data Slide Layout Presentation
Bring your numbers to life with a clean, flowing visual that turns data into an easy-to-follow story. This presentation guides viewers through each step of your process, helping them understand key insights without overwhelm. Ideal for analytics, reporting, and planning. Fully compatible with PowerPoint, Keynote, and Google Slides.


11 slides
Moodboard Presentation
This Moodboard template is a vibrant tool for designers and creatives looking to showcase the aesthetic direction of their project. It starts with a dynamic cover slide, drawing you into the visual theme. As you progress through the slides, you are greeted with rich textures and a spectrum of colors carefully selected to inspire and evoke emotion. The slides dedicated to 'Textures' and 'Colors' serve not only as a palette but also as a canvas to communicate the essence of your creative vision. Questions like "Have you chosen your colors yet?" engage the audience, encouraging interaction and reflection on their choices. The 'Concept' and 'Keys' slides further detail the creative process and the core elements that will define the final design. The comprehensive Moodboard culminates in a credits slide, attributing all the inspirational sources that fueled the visual journey.


23 slides
Staccato Business Plan Presentation
Present your business plan with this elegant and structured template, designed for clarity and professionalism. This presentation layout provides all the essential elements for showcasing your strategy, goals, and objectives, ideal for entrepreneurs, startups, and established businesses alike. Featuring dedicated sections for company overview, panel discussions, workshop sessions, and closing remarks, the slides are organized for seamless storytelling. Highlight your team, workshop takeaways, and key resources with polished visuals and easy-to-follow layouts. The Q&A and networking break slides allow you to engage your audience effectively while maintaining a professional tone. Fully compatible with PowerPoint, Google Slides, and Keynote, this template is fully editable, allowing you to customize colors, text, and images to reflect your brand. Deliver your business ideas confidently with a presentation template that ensures a strong, lasting impression.


5 slides
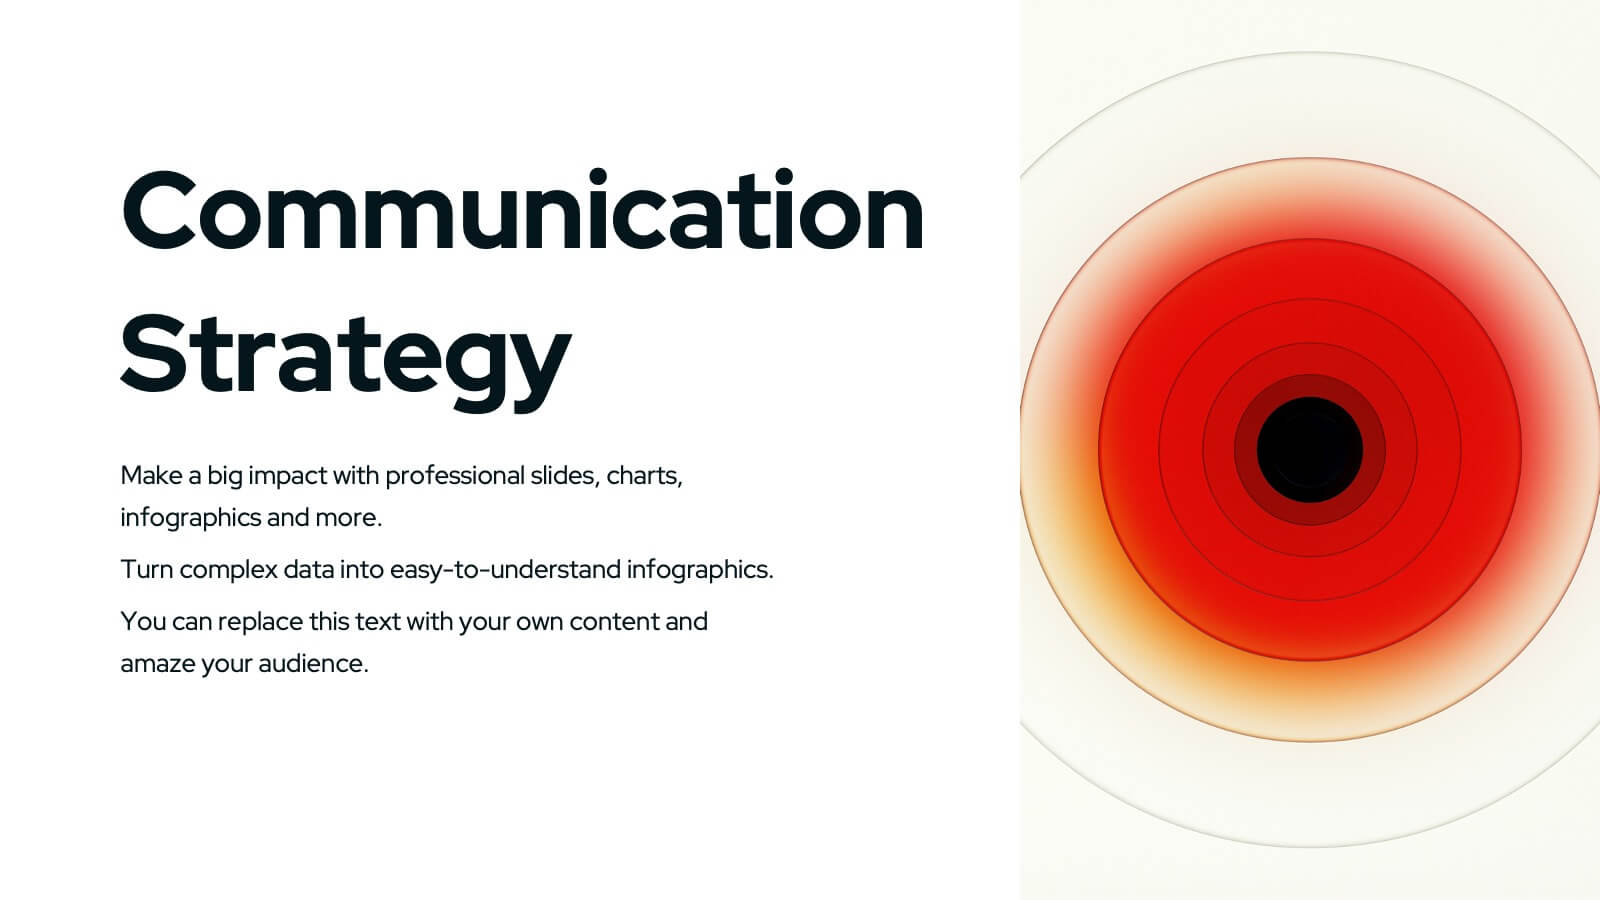
Breast Cancer Awareness Day
Raise awareness and educate with this visually impactful Breast Cancer Awareness Day template. Featuring circular infographic elements styled in a breast tissue-inspired layout, this slide design is ideal for campaigns, health education, corporate wellness events, and social initiatives. Each section can be customized with key data, statistics, or actionable messages. Fully editable in PowerPoint, Keynote, and Google Slides.


4 slides
Machine Learning Overviews Presentation
Bring your audience into the world of intelligent automation with a bold, visual layout that makes complex concepts feel simple and engaging. This presentation breaks down key processes, workflows, and insights using clear graphics that support your message. Fully customizable and compatible with PowerPoint, Keynote, and Google Slides.


5 slides
Data Density Visualization via Heat Mapping Presentation
Turn complex datasets into clear insights with the Data Density Visualization via Heat Mapping Presentation. This layered area chart template is perfect for showcasing data intensity over time—ideal for monthly trends, usage spikes, or multi-variable performance analysis. Fully customizable in Canva, PowerPoint, Keynote, and Google Slides.


5 slides
Business Strategy Briefcase Presentation
Unlock the potential of strategic planning with our "Business Strategy Infographic" template! This design cleverly uses suitcase icons to represent different aspects of your strategy, making it perfect for executives and teams who aim to present their business insights and objectives clearly and engagingly. Each segment of the suitcase aligns key data points with your strategic goals, offering a visual roadmap to success. Compatible with PowerPoint, Keynote, and Google Slides, this template is a powerful tool for conveying complex business strategies in a straightforward, visually appealing manner.


8 slides
Geographic Heat Map Analysis Presentation
Bring your data to life with a vibrant map that instantly reveals regional patterns and performance differences. Ideal for presenting location-based insights, sales metrics, or demographic trends, this presentation combines clarity with visual impact. Fully compatible with PowerPoint, Keynote, and Google Slides for easy editing and professional results.