


Features
- 4 Unique slides
- Fully editable and easy to edit in Microsoft Powerpoint, Keynote and Google Slides
- 16:9 widescreen layout
- Clean and professional designs
- Export to JPG, PDF or send by email


Do you have any questions?
Recommend


8 slides
Asia Geographics and Business Analysis Map Presentation
Visualize regional insights with this Asia map template. Highlight business data, performance indicators, or strategic regions using callouts and color-coded zones. Perfect for market analysis, logistics, or geographic reporting. Fully customizable in PowerPoint, Keynote, or Google Slides to match your branding and presentation goals with clear, location-based storytelling.


5 slides
SEO Strategies Infographics
Immerse yourself in the dynamic world of digital marketing with our SEO strategies infographics. Rendered in bold black, vibrant orange, and various eye-catching colors, this creative and vertical template serves as a beacon for marketing professionals, digital strategists, and entrepreneurs who aim to conquer the digital space. Each element, from engaging graphics to interpretative icons, is specifically tailored to present SEO methodologies with clarity and charisma. This infographic template is not only a visual treat but a reservoir of insights, facilitating users to communicate influential SEO tactics effectively and drive their brand's online visibility forward.


6 slides
Insurance Comparison Infographic
Insurance comparison is the process of evaluating and comparing different insurance policies offered by various insurance companies to find the one that best meets your needs and requirements. This infographic template is a visual representation of different types of insurance policies and their key features, designed to help consumers compare and make informed decisions about their insurance needs. This infographic aims to simplify complex insurance information. This can be used on insurance websites, marketing materials, and educational resources to assist consumers in making well-informed insurance choices based on their unique needs and preferences.


7 slides
Investment Group Infographic
An investment group, is a collective of individuals or entities that pool their financial resources to invest in various financial instruments or assets. This infographic template is a high-octane journey through the dynamic world of investments, designed to empower and energize your financial understanding. Prepare to take you audience through a thrilling ride through the investment cosmos, where your money takes center stage and financial growth is the ultimate goal. This Investment Infographic isn't just about numbers and charts, it's a thrilling expedition through the realms of finance.


6 slides
Section Breakdown Table of Content Presentation
Present your topics in a clear, structured way with the Section Breakdown Table of Content template. Featuring a two-column layout with colorful icons and labeled sections, it’s perfect for outlining multiple categories. Fully editable in Canva, PowerPoint, and Google Slides to match your brand style and improve presentation flow.


10 slides
Corporate Sustainability Goals Planning
Drive environmental impact with clarity using the Corporate Sustainability Goals Planning Presentation. This clean, circular infographic helps communicate sustainability initiatives, eco-objectives, and long-term strategy with ease. Perfect for ESG reports, internal goal tracking, or stakeholder updates. Fully editable in PowerPoint, Keynote, and Google Slides.


6 slides
7S Framework for Organizational Alignment Presentation
Present a cohesive organizational strategy using the 7S Framework slide. With hexagonal visuals highlighting key elements—Strategy, Structure, Systems, Shared Values, Style, Staff, and Skills—this template simplifies complex alignment concepts. Ideal for leadership, consulting, or HR presentations. Fully editable for PowerPoint, Google Slides, and Keynote to match your brand.


5 slides
Vegan Guide Infographics
A Vegan Guide is a comprehensive resource that provides information about a plant-based diet that excludes all animal products, including meat, dairy, eggs, and honey. These Vegan Guide Infographics are visual representations of information related to the vegan lifestyle. Cover a wide range of topics, including the benefits of veganism, how to transition to a vegan diet, common misconceptions about veganism, ethical and environmental considerations, and the nutritional requirements of a vegan diet. This can be used by individuals who are interested in adopting a vegan lifestyle, and educators who want to provide information about veganism to their clients and students.


4 slides
Business Plan in 4 Clear Steps
Break down your business strategy into four simple, actionable stages with this bold, visual template. Featuring a colorful quadrant layout inside a professional case graphic, it's perfect for business plans, roadmaps, or project overviews. Easily editable in PowerPoint, Keynote, and Google Slides.


6 slides
Effective Leadership Skills Presentation
Build stronger teams with this effective leadership skills template, featuring a colorful building block design to represent key competencies. Ideal for leadership workshops, corporate training, and professional development, it visually organizes six core skills. Fully editable in Canva, PowerPoint, or Google Slides for easy customization to match your organization’s style.


5 slides
Online Learning Platforms and Strategies Presentation
Simplify complex educational strategies with this layered house-shaped diagram designed for digital learning topics. Each tier represents a strategic element of your e-learning platform, from planning to implementation. Featuring five clearly labeled sections with editable icons and text, this slide is ideal for showcasing course structures, platform features, or training rollouts. Fully customizable in PowerPoint, Keynote, and Google Slides.


7 slides
Asia Map Geography Infographic
Explore the diverse landscapes and key data of Asia with our collection of Asia Map Infographics. These templates are expertly designed to illustrate various geographical and demographic insights across the continent, making them ideal for educational purposes, business presentations, or travel-related projects. Each infographic is crafted with a clean, clear layout that highlights different countries, regions, and significant data points such as population density, economic indicators, or cultural statistics. The use of color coding and spatial markers ensures that information is easily understandable and visually appealing. Fully customizable, these templates allow you to adjust the data points, colors, and text to suit specific presentation needs or to focus on particular areas of interest. Whether you're a teacher, a business analyst, or a traveler preparing a presentation, these slides offer a valuable resource for conveying complex geographical data in a straightforward and engaging manner.


7 slides
Work From Home Online Infographic
Work from home online refers to a work arrangement where individuals can perform their job responsibilities remotely, usually from their homes, using internet-connected devices like computers, laptops, tablets, or smartphones. Unveil the modern realm of remote work with our work from home online infographic. This visually engaging and informative template takes you on a journey through the digital landscape of remote work, showcasing its advantages, best practices, and the tools that enable seamless virtual collaboration. This infographic isn't just a visual guide it's a roadmap to thrive in the evolving world of work.


6 slides
Corporate Profiles Layout Presentation
Bring your business story to life with a clean, modern layout that makes every detail feel polished and professional. This presentation is designed to showcase company highlights, key services, and essential profile information with clarity and impact. Fully editable and easy to customize in PowerPoint, Keynote, and Google Slides.


10 slides
Customer Market Segmentation Strategy Presentation
Define and visualize your audience with the Customer Market Segmentation Strategy Presentation. This slide layout helps you categorize customer types using clean iconography and a central persona model. Ideal for marketing teams, sales strategists, or startup pitches. Customize easily in Canva, PowerPoint, Google Slides, or Keynote.
5 slides
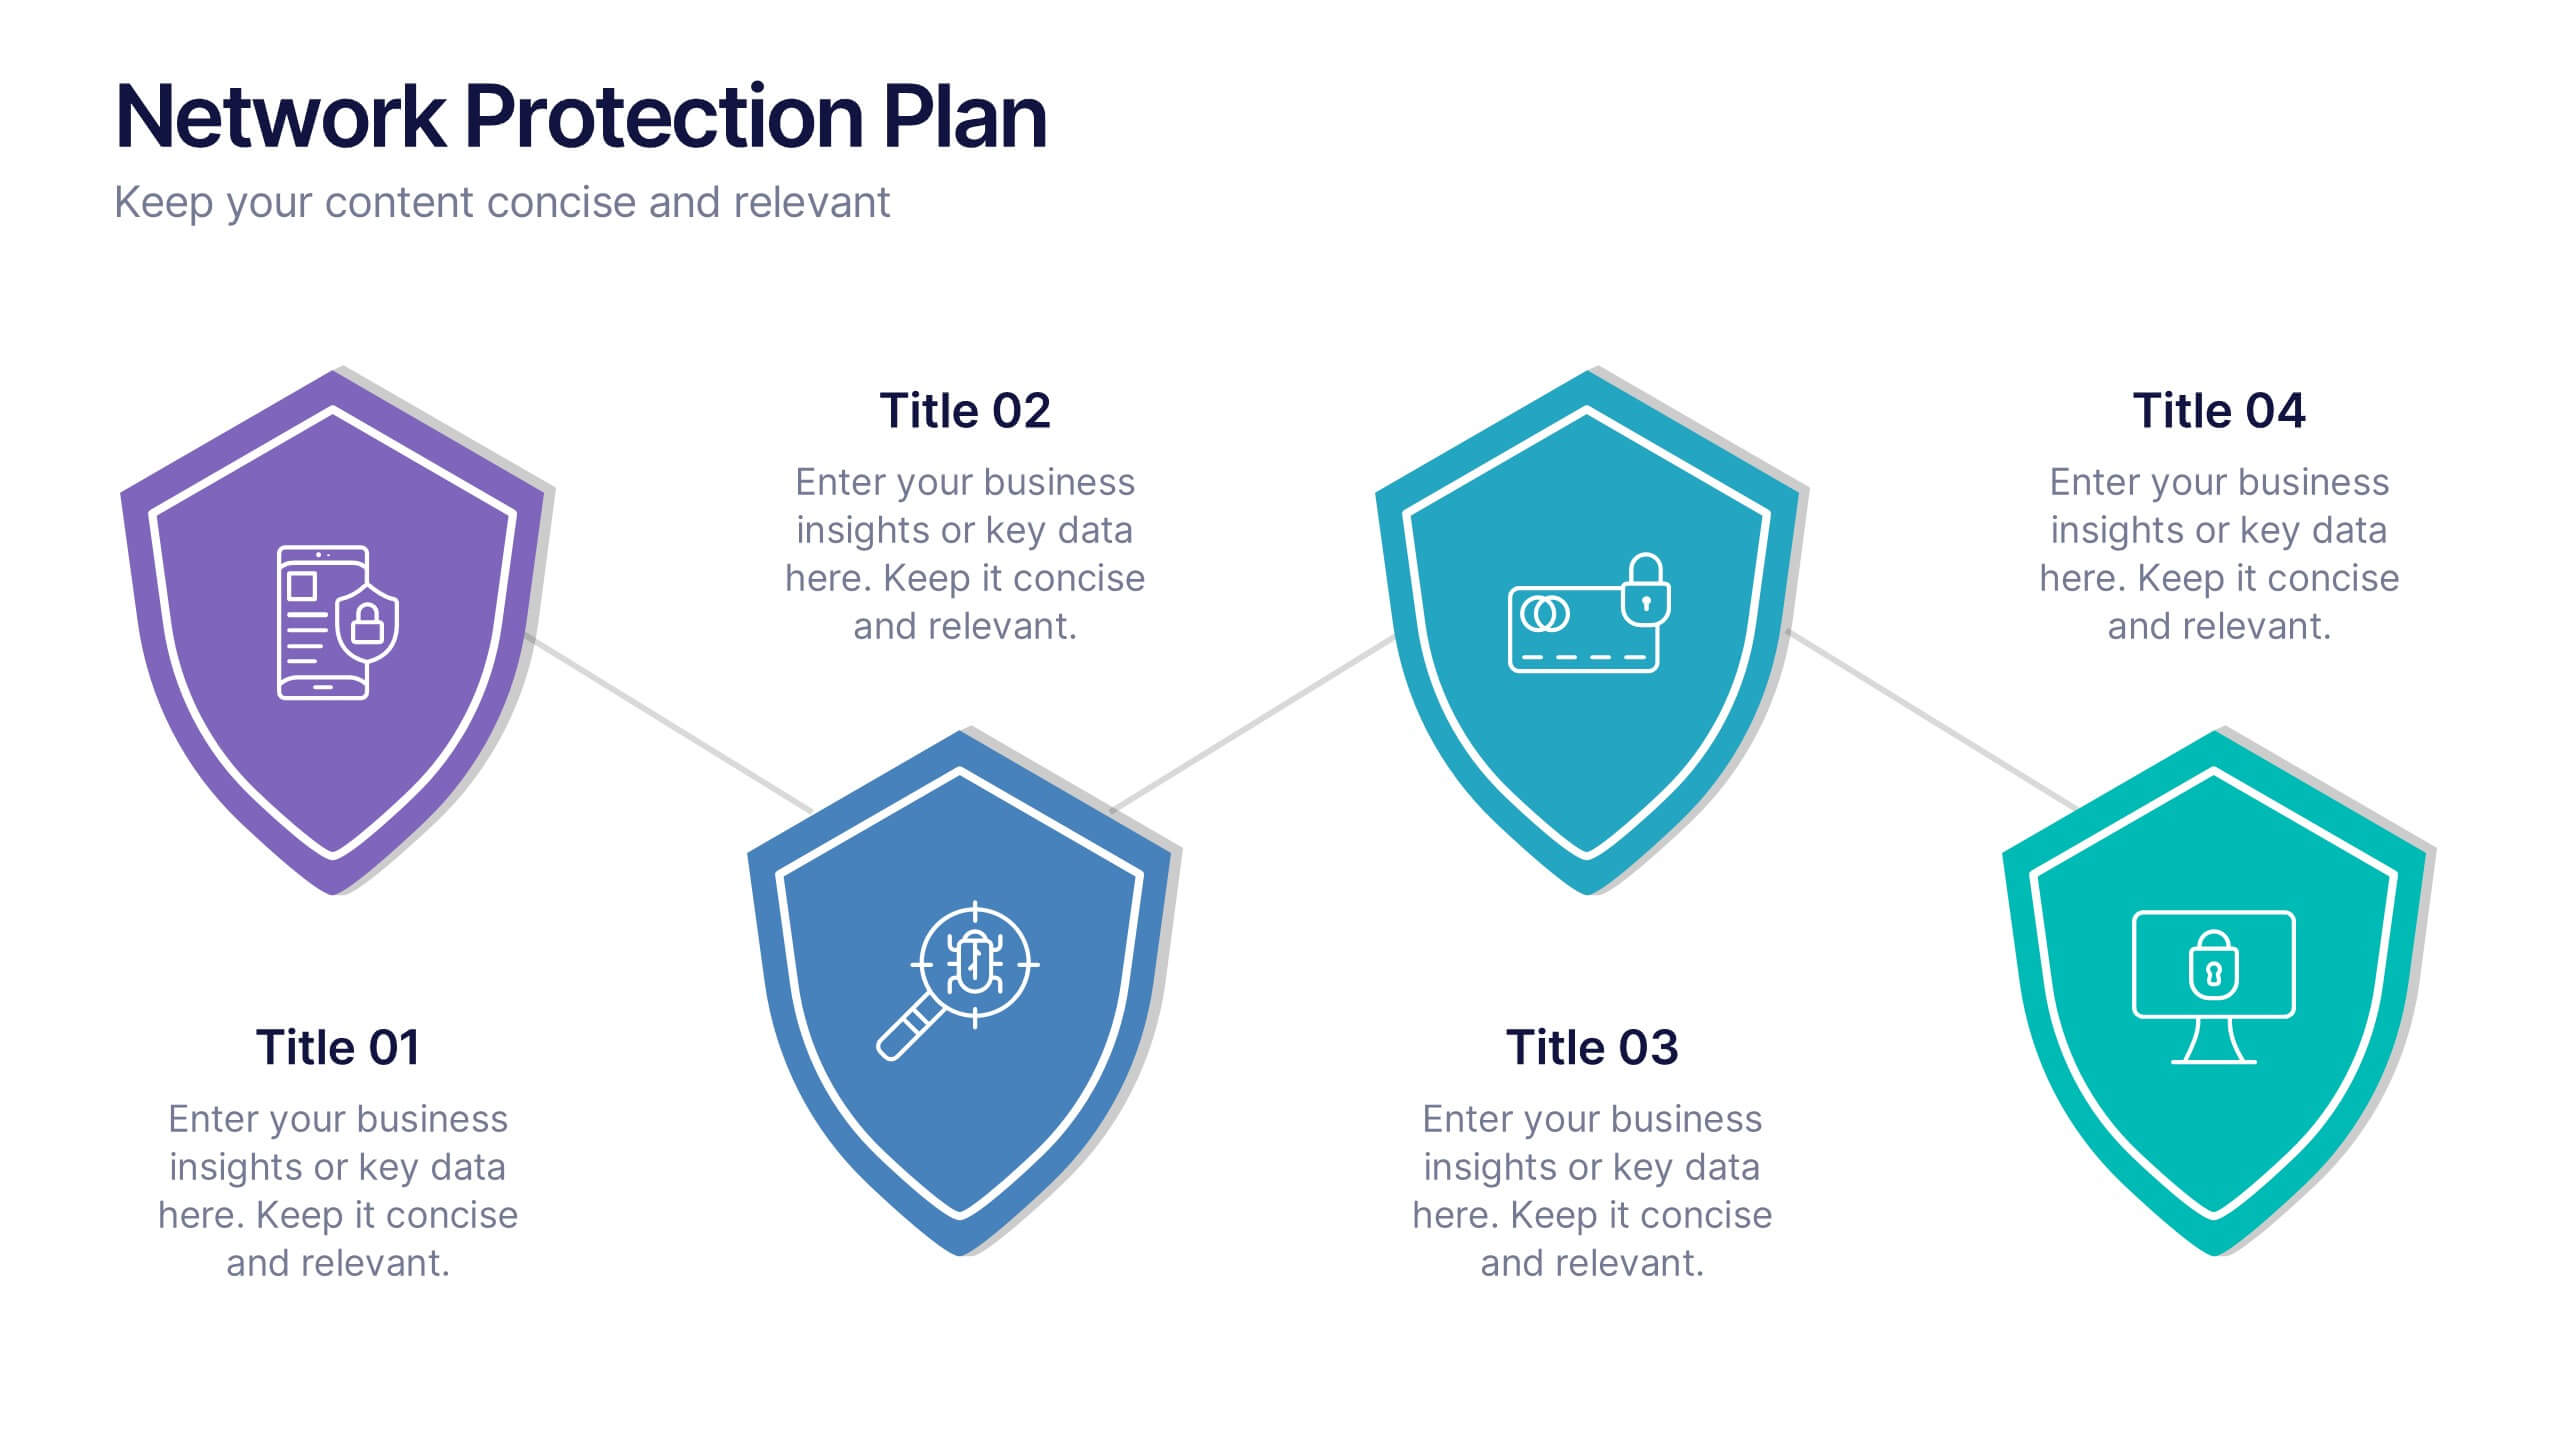
Network Protection Plan Presentation
Bold visuals and clean structure make this presentation a powerful way to communicate your protection strategy with clarity and confidence. It helps you break down key security stages, outline responsibilities, and show how each layer strengthens overall network resilience. Fully compatible with PowerPoint, Keynote, and Google Slides.


6 slides
DMAIC Six Sigma Framework Presentation
Dive into process perfection with our DMAIC Six Sigma Framework template! This visually appealing guide breaks down each phase—Define, Measure, Analyze, Improve, and Control—making it easier to streamline operations and enhance quality. Fully compatible with PowerPoint, Keynote, and Google Slides, it's designed for professionals dedicated to operational excellence and continuous improvement.