


Features
- 6 Unique slides
- Fully editable and easy to edit in Microsoft Powerpoint, Keynote and Google Slides
- 16:9 widescreen layout
- Clean and professional designs
- Export to JPG, PDF or send by email


Do you have any questions?
Recommend


5 slides
Real Estate Requirements Infographics
Real Estate Infographics can be an effective way to convey information about the real estate industry in a visually appealing and simple manner. This infographic template is perfect to showcase market trends, statistics, and data in a clear and concise way, making it easier for your audience to interpret the information. As well as educating and informing your clients, investors, and other stakeholders about various aspects of the real estate market. Overall, these infographic will help you communicate information about the real estate industry and help your clients make informed decisions about buying, selling, or investing in property.


5 slides
USA Trade Map Infographics
A USA Trade Map Infographic is a visual representation of the trade relationships that exist in the United States. This vertical infographic includes a vector or image of the United States map in a vertical orientation, with space for text or data to be included. This design features the maps in a bold, eye-catching color scheme allowing the data and text to stand out. The template also includes additional visual elements such as icons and illustrations to help present data and statistics related to different areas within the United States. Use this to present demographic data, election results, economic indicators, or travel and tourism information.


26 slides
Coffee Shop Warm Company Profile Presentation
Coffee shops have become an important part of modern culture, especially in urban areas, and they come in various styles and themes. This presentation template is designed to bring the essence of your coffee haven to life. From the first sip to the last drop, let this presentation showcase the soul-warming experience your coffee shop provides. Fully customizable and compatible with Powerpoint, Keynote, and Google Slides. Utilize warm colors like browns, oranges, and yellows to evoke a cozy, comforting atmosphere. The template integrates coffee cup icons, latte art, and coffee bean graphics for a coffee-centric theme.


5 slides
Monthly Report Statistics Infographics
A Monthly Report is a document that provides an overview of activities, progress, achievements, and challenges within a specific month. These infographic templates are designed to present monthly data and statistics in a clear and engaging manner. These infographics will help you showcase key information effectively. This is perfect for preparing reports for management, stakeholders, clients, or colleagues, this template will help you communicate your findings clearly and impressively. Compatible with Powerpoint, Keynote, and Google Slides, its customizable design and visual appeal will ensures that your monthly reports are engaging and informative.


7 slides
Side-by-Side Feature Comparison Presentation
Clearly showcase differences across multiple categories with this Side-by-Side Feature Comparison Presentation. Designed with a visual grid system and bold colors, it's perfect for highlighting product or service variations at a glance. Fully customizable in PowerPoint, Keynote, and Google Slides.


6 slides
Child Development Psychology Presentation
Bright colors and geometric birds bring this slide to life, making complex concepts easy to follow. This presentation template simplifies the key stages of emotional and psychological growth in children, helping you explain theories and behaviors clearly. Compatible with PowerPoint, Keynote, and Google Slides for seamless use across platforms.


8 slides
Data-Driven Feedback Analysis
Break down insights with precision using this Data-Driven Feedback Analysis presentation. Designed to showcase key points in a logical flow, this layout uses labeled segments (A–D) to categorize findings, highlight action items, and visualize patterns. Ideal for reports, audits, and feedback reviews. Fully editable in PowerPoint, Keynote, and Google Slides.


7 slides
North America Political Map Infographic
This North America Political Map infographic template provides a visual representation of various data points across the continent. It is compatible with PowerPoint, Google Slides, and Keynote, making it versatile for different presentation platforms. The template includes different styles of maps and charts, such as population statistics, demographic data, and economic indicators. Color-coded for easy interpretation, it allows presenters to highlight specific regions and data with clarity. The design is clean and professional, with icons and graph elements that enhance the presentation of geographical and statistical information.


19 slides
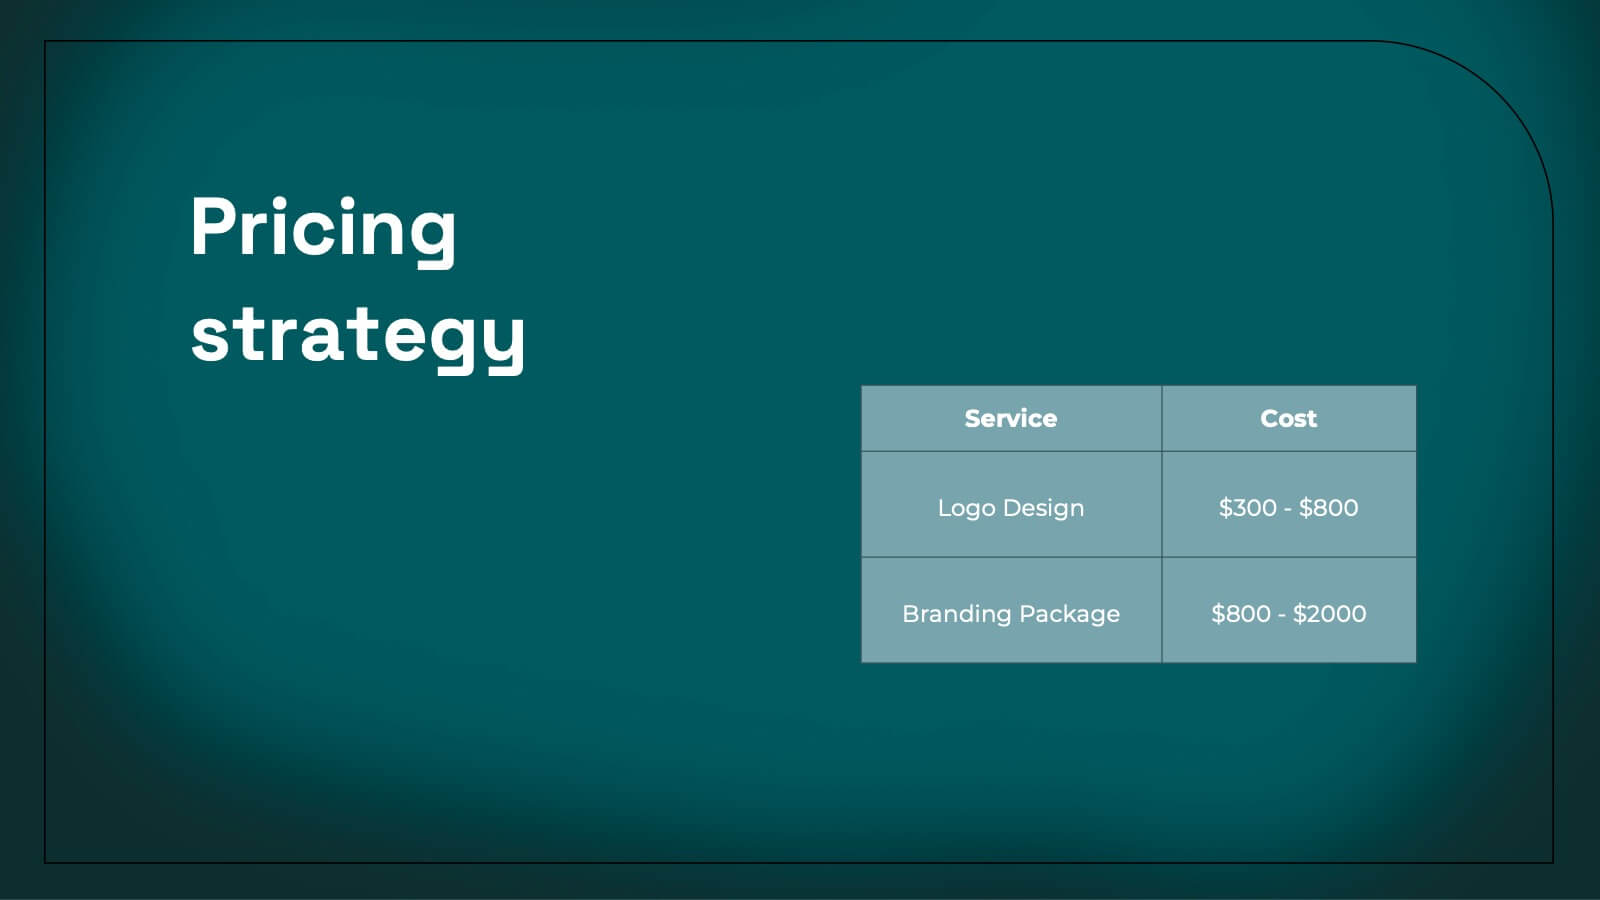
Kale Product Strategy Report Presentation
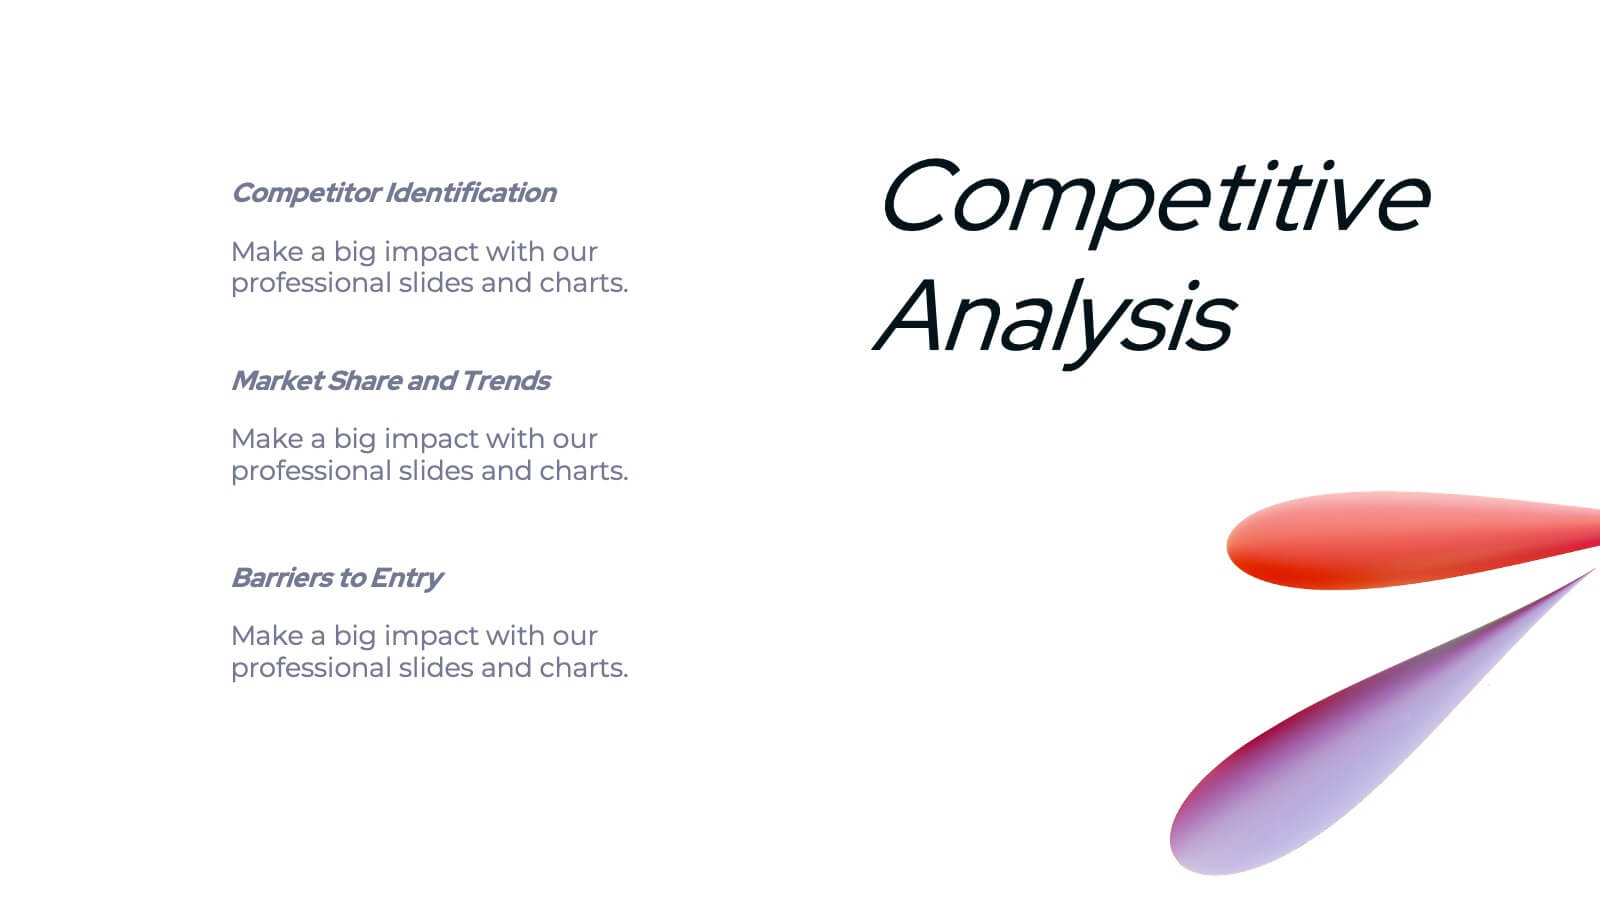
Unleash the power of your product with this bold and dynamic product strategy report template! Elevate your presentation with eye-catching designs that showcase product features, competitive analysis, and pricing strategies like never before. Captivate your audience from start to finish and leave a lasting impression. Fully compatible with PowerPoint, Keynote, and Google Slides!


21 slides
Sapphire Graphic Design Project Plan Presentation
Make your next project plan sparkle with this sleek, sapphire-inspired presentation design! This template is perfect for showcasing your graphic design project, helping you organize key milestones, timelines, and objectives. With its modern layout and clean aesthetics, your ideas will stand out beautifully. Compatible with PowerPoint, Keynote, and Google Slides.


6 slides
5-Stage Workflow Presentation
Turn complex processes into clear, visual stories with this structured step-by-step layout. Ideal for showcasing project stages, workflows, or development phases, it guides your audience through each milestone with precision and flow. Fully editable and compatible with PowerPoint, Keynote, and Google Slides for easy customization and professional results.


26 slides
Workouts for Every Body Part Presentation
Achieve total-body fitness with this dynamic presentation on targeted workouts for every muscle group. Covering effective exercises, proper form, strength training techniques, and workout plans, this template helps simplify fitness routines for all levels. Fully customizable and compatible with PowerPoint, Keynote, and Google Slides for a seamless and engaging presentation experience.


5 slides
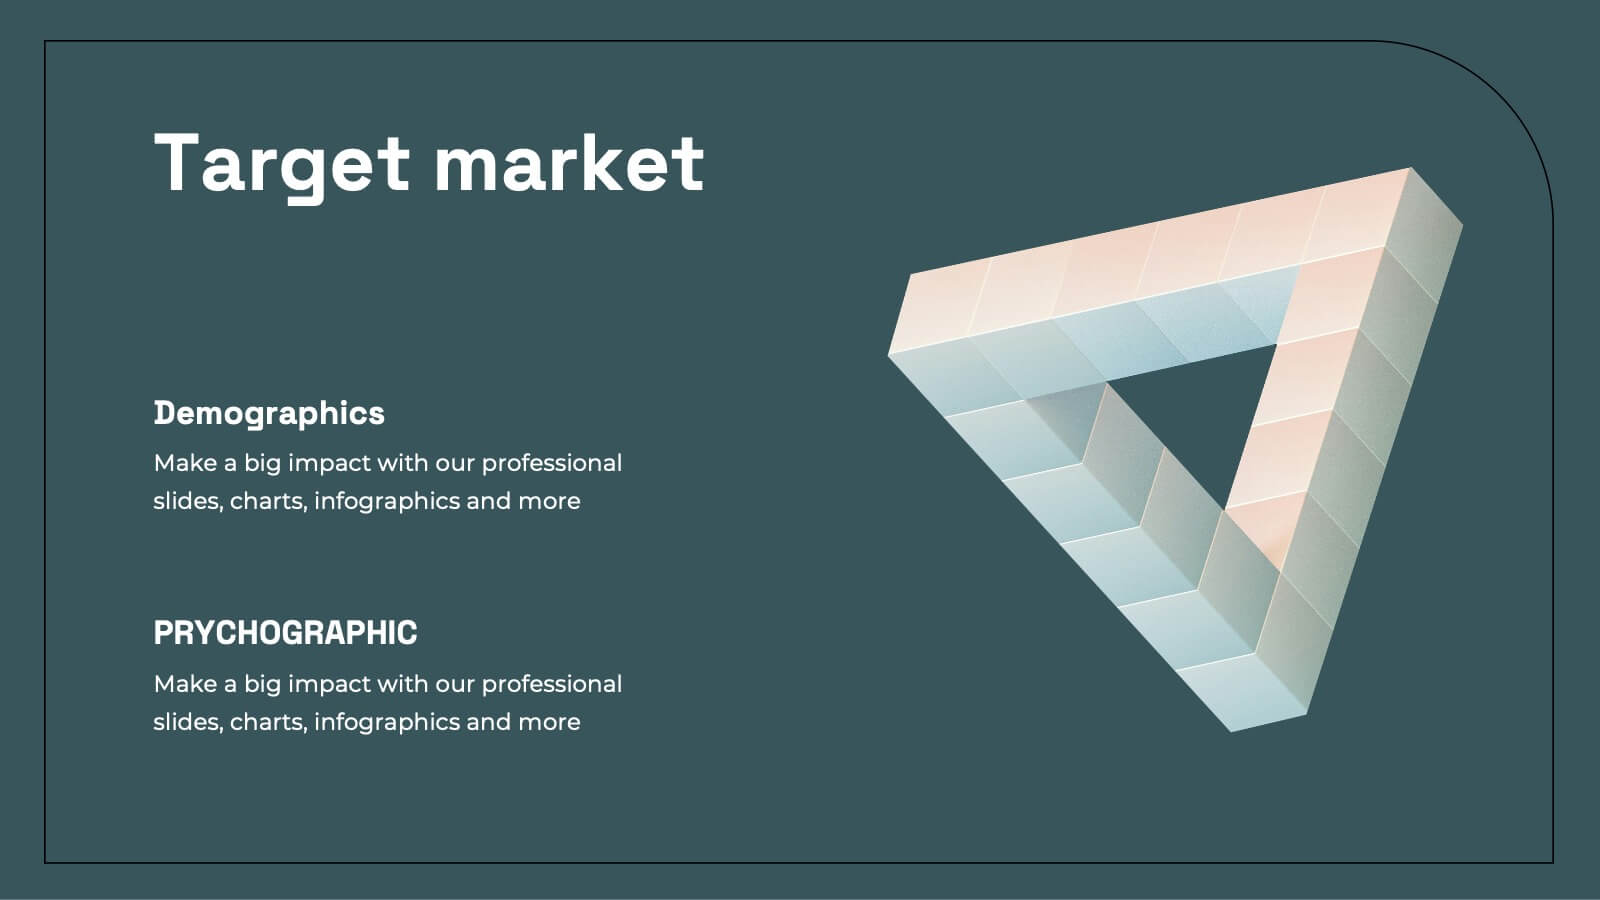
Defining Target Market and Audience Presentation
Identify and segment your ideal customer base with this visually structured pyramid slide. Designed to represent layered audience demographics or buyer personas, each level allows space for detailed insights and strategy alignment. The accompanying icons and side labels enhance clarity and storytelling for marketing, branding, or campaign planning presentations. Fully editable in PowerPoint, Keynote, and Google Slides to fit your branding and messaging needs.


4 slides
Mobile and Laptop Mockup Devices
Present your digital products with style using this modern mockup slide. Featuring a realistic laptop and smartphone duo, this layout is perfect for showcasing websites, apps, or UI designs. Fully editable in PowerPoint, Keynote, and Google Slides—customize text, colors, and layout with ease.


3 slides
Ishikawa Diagram Template Presentation
Bring clarity to complex challenges with a clean, structured visual that helps teams trace issues back to their true causes. This presentation outlines key factors, organizes insights, and supports decision-making with an intuitive, step-by-step layout. Ideal for problem-solving sessions and strategy workshops. Fully compatible with PowerPoint, Keynote, and Google Slides.


20 slides
Spark Sales Performance Report Presentation
Deliver insights and strategies with this dynamic sales performance report presentation template. Featuring an elegant and modern design, it provides dedicated sections for agenda setting, company overview, service highlights, and customer value propositions. Present competitive analysis, sales objectives, and performance metrics with ease using clean, structured layouts. Visualize sales processes, team introductions, and pricing strategies through engaging, editable infographics and data slides. The template also includes areas for showcasing promotions, customer testimonials, future opportunities, and actionable next steps. Tailored for sales teams and managers, it offers a professional framework to review and strategize effectively. Fully customizable and compatible with PowerPoint, Google Slides, and Keynote, this template ensures seamless adaptation to your branding and needs. Impress your audience while highlighting achievements and paving the way for future growth!


6 slides
Financial Report and Charts Presentation
Deliver financial insights with impact using this Financial Report and Charts Presentation Template. Featuring a clean layout with a money bag visual and percentage breakdowns, it’s perfect for showcasing profit distribution, investment categories, or budget summaries. Fully customizable in PowerPoint, Keynote, and Google Slides.