


Features
- 26 Unique slides
- Fully editable and easy to edit in Microsoft Powerpoint, Keynote and Google Slides
- 16:9 widescreen layout
- Clean and professional designs
- Export to JPG, PDF or send by email


Do you have any questions?
Recommend


21 slides
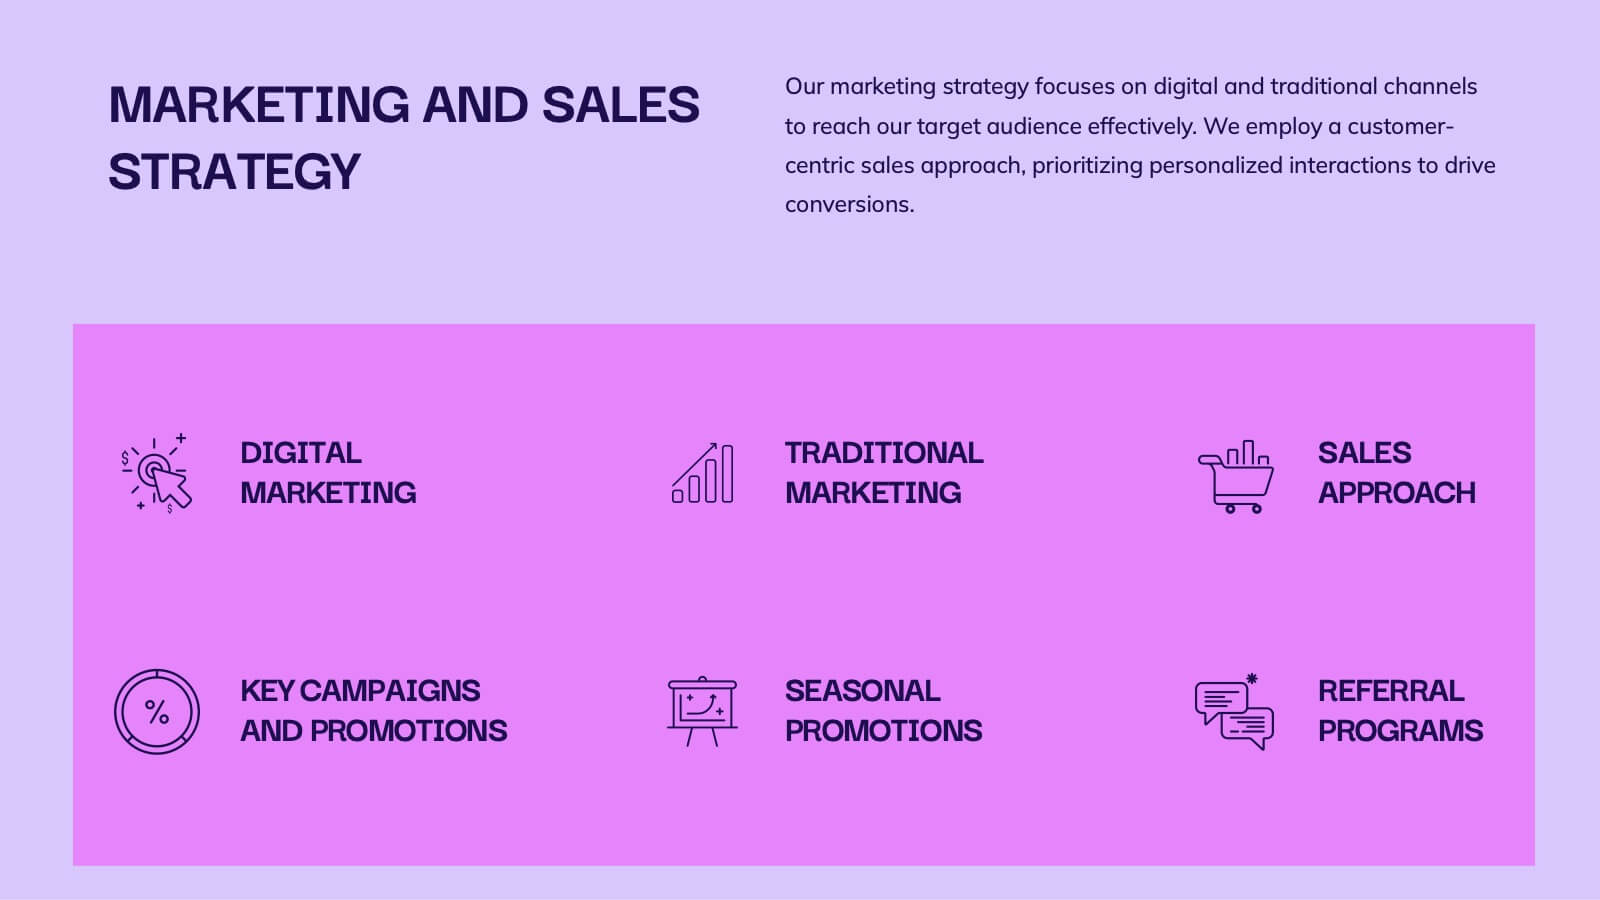
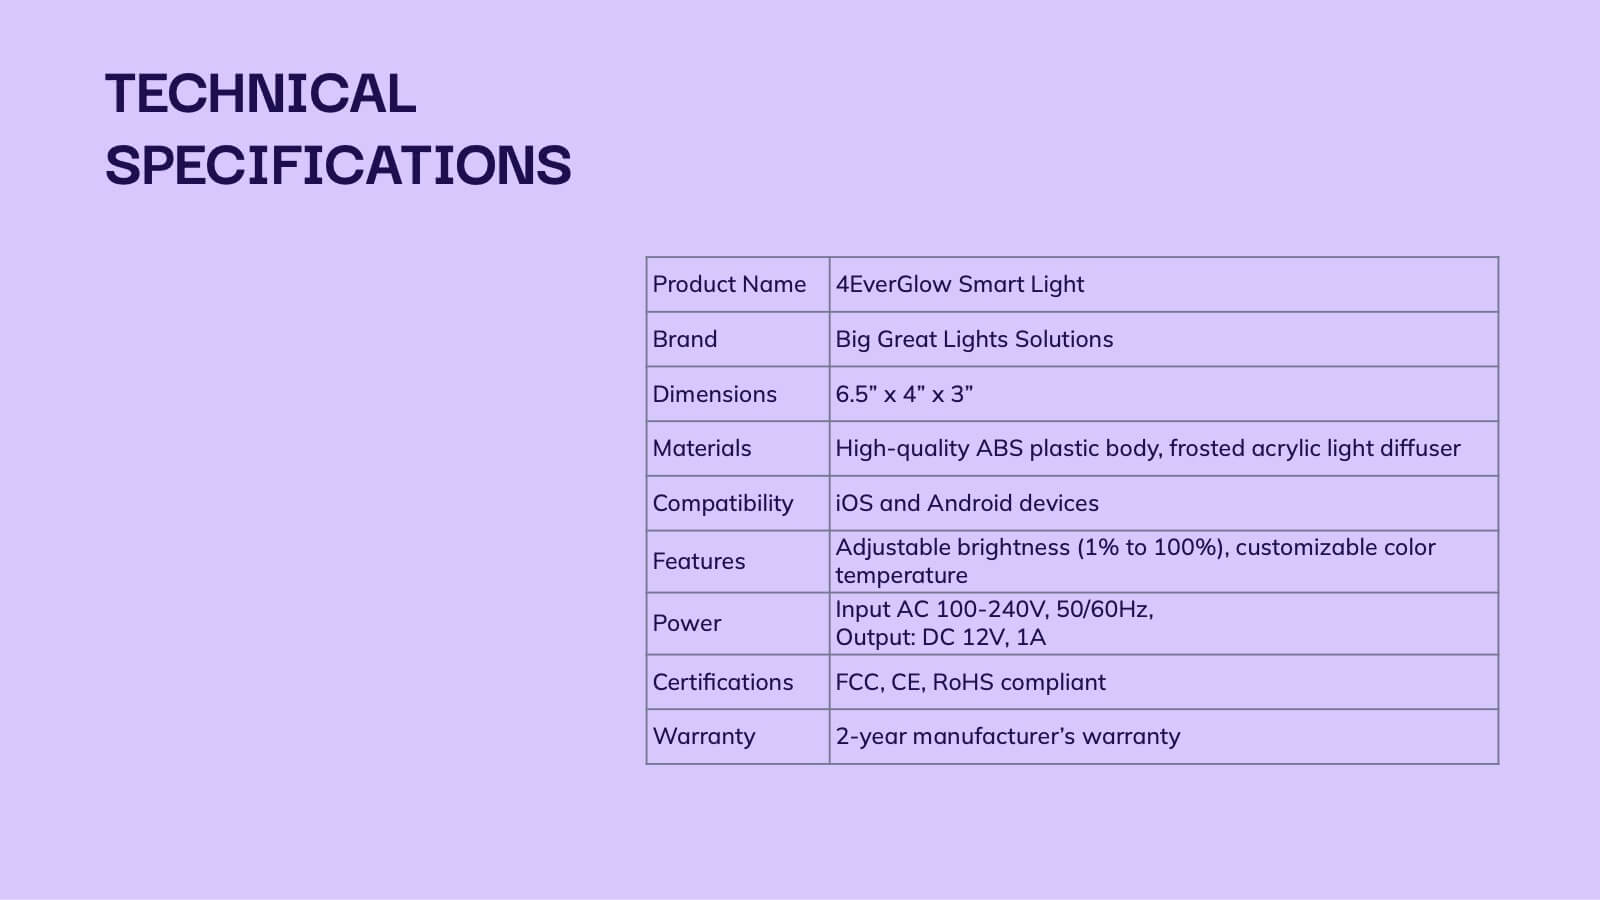
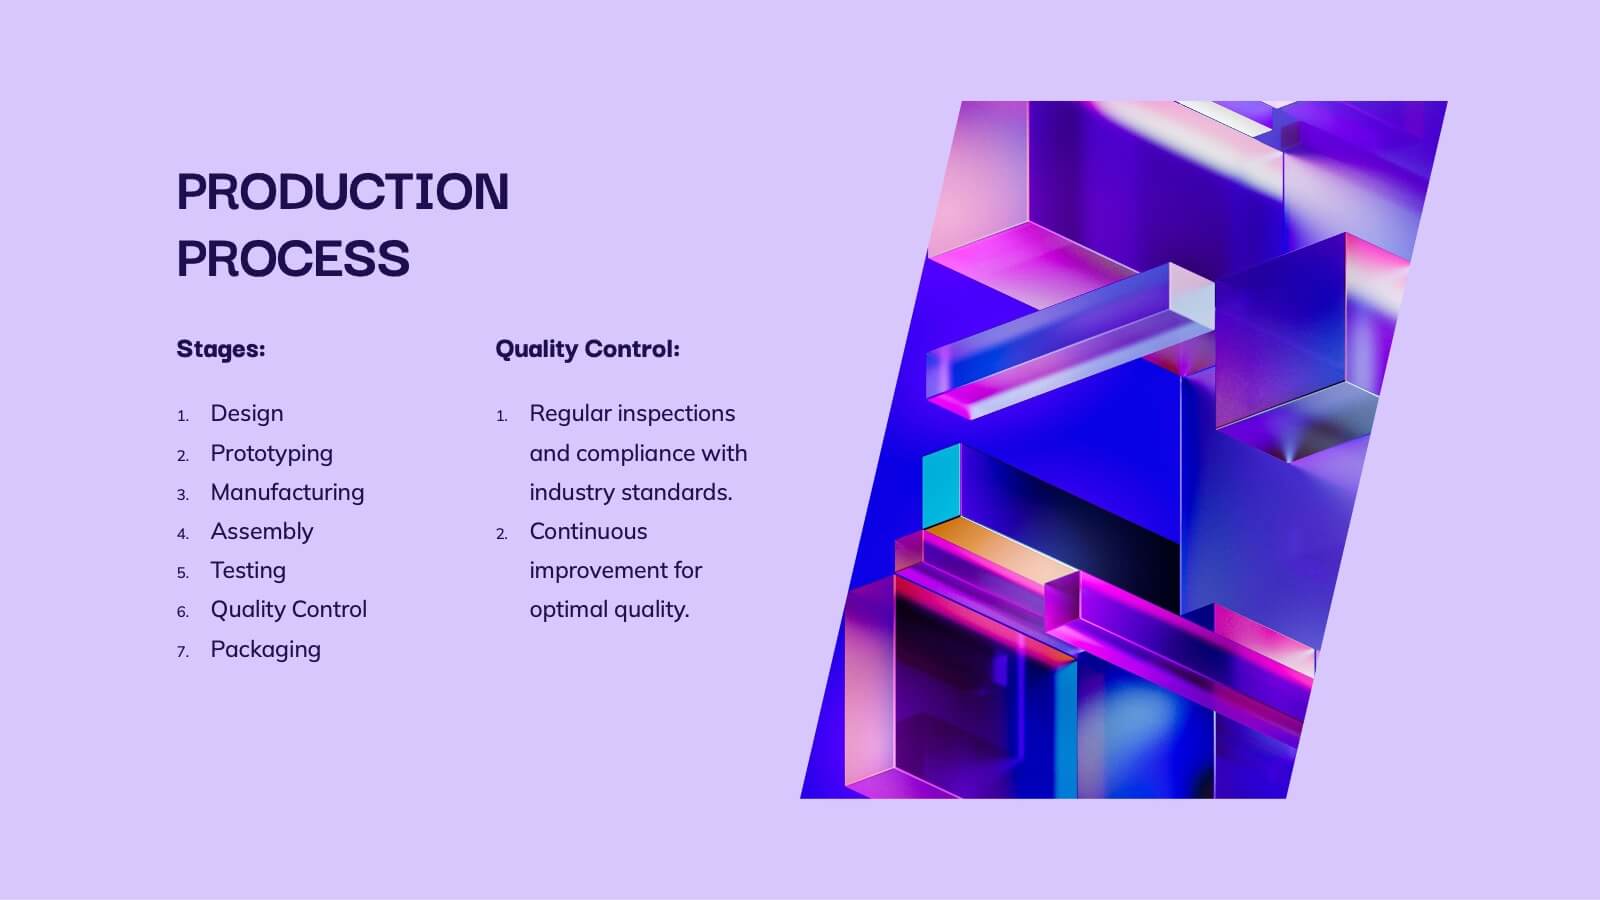
Glimmer Product Roadmap Presentation
Illuminate your product's future with this vibrant glimmer-themed presentation template! Perfect for outlining your product roadmap, it allows you to present key milestones, features, and timelines in a visually engaging way. Captivate your audience and keep them informed about your exciting journey ahead. Compatible with PowerPoint, Keynote, and Google Slides.


6 slides
6-Step Business Process Presentation
Clearly map out workflows with this 6-step business process presentation. Ideal for project managers and strategists, this horizontal timeline helps break complex tasks into digestible phases. With editable icons, color highlights, and step-by-step layout, it's easy to customize in PowerPoint, Keynote, or Google Slides for any professional setting.
22 slides
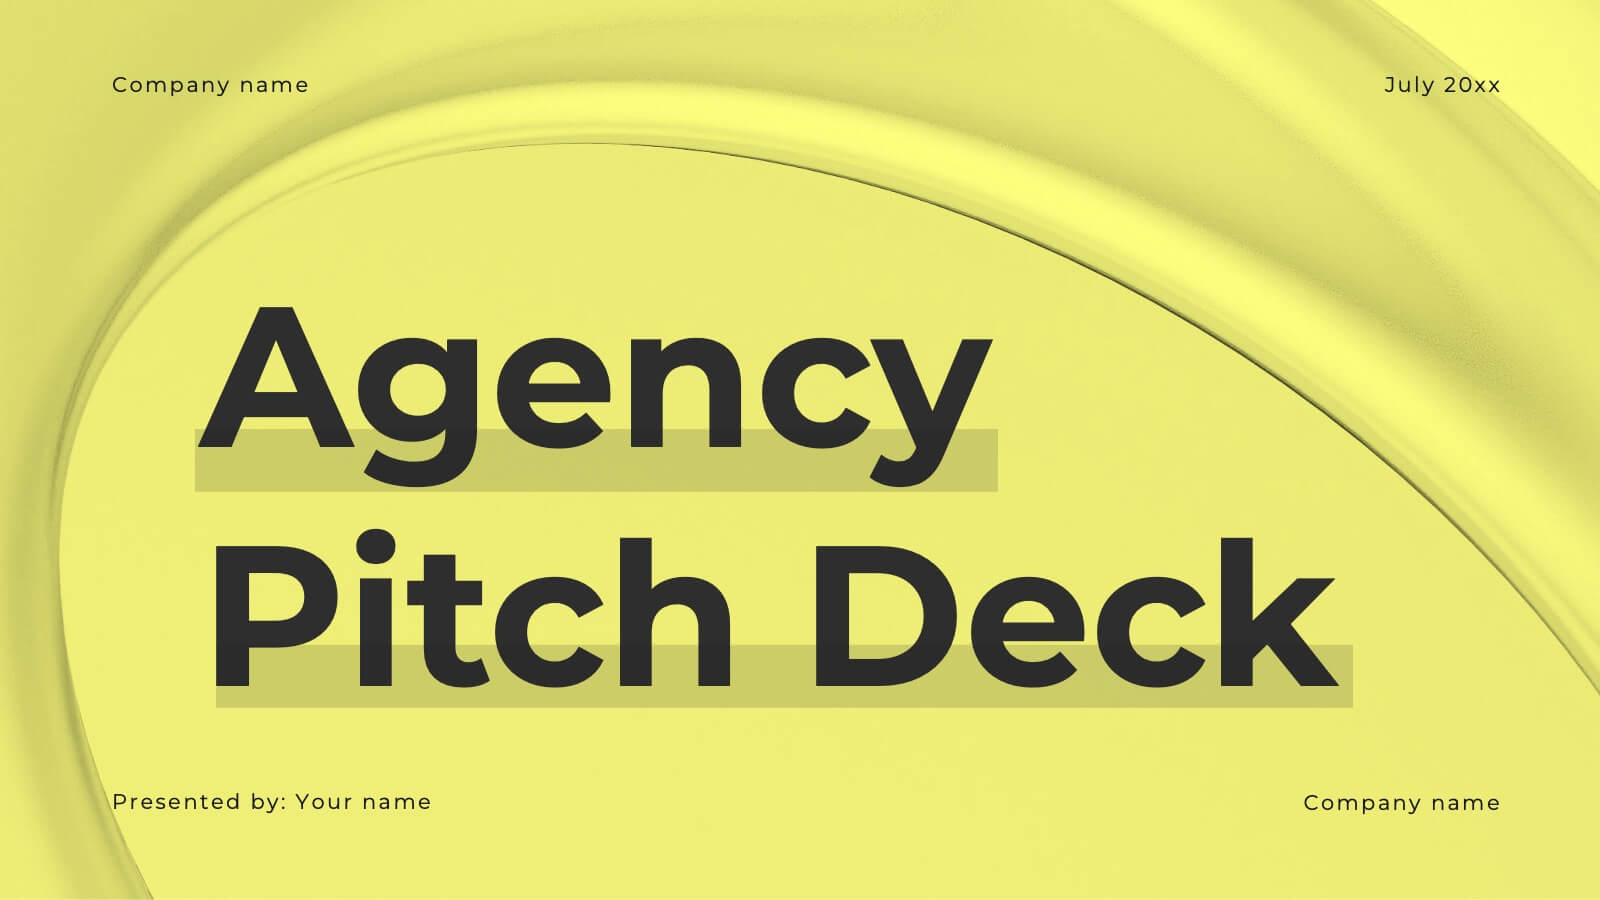
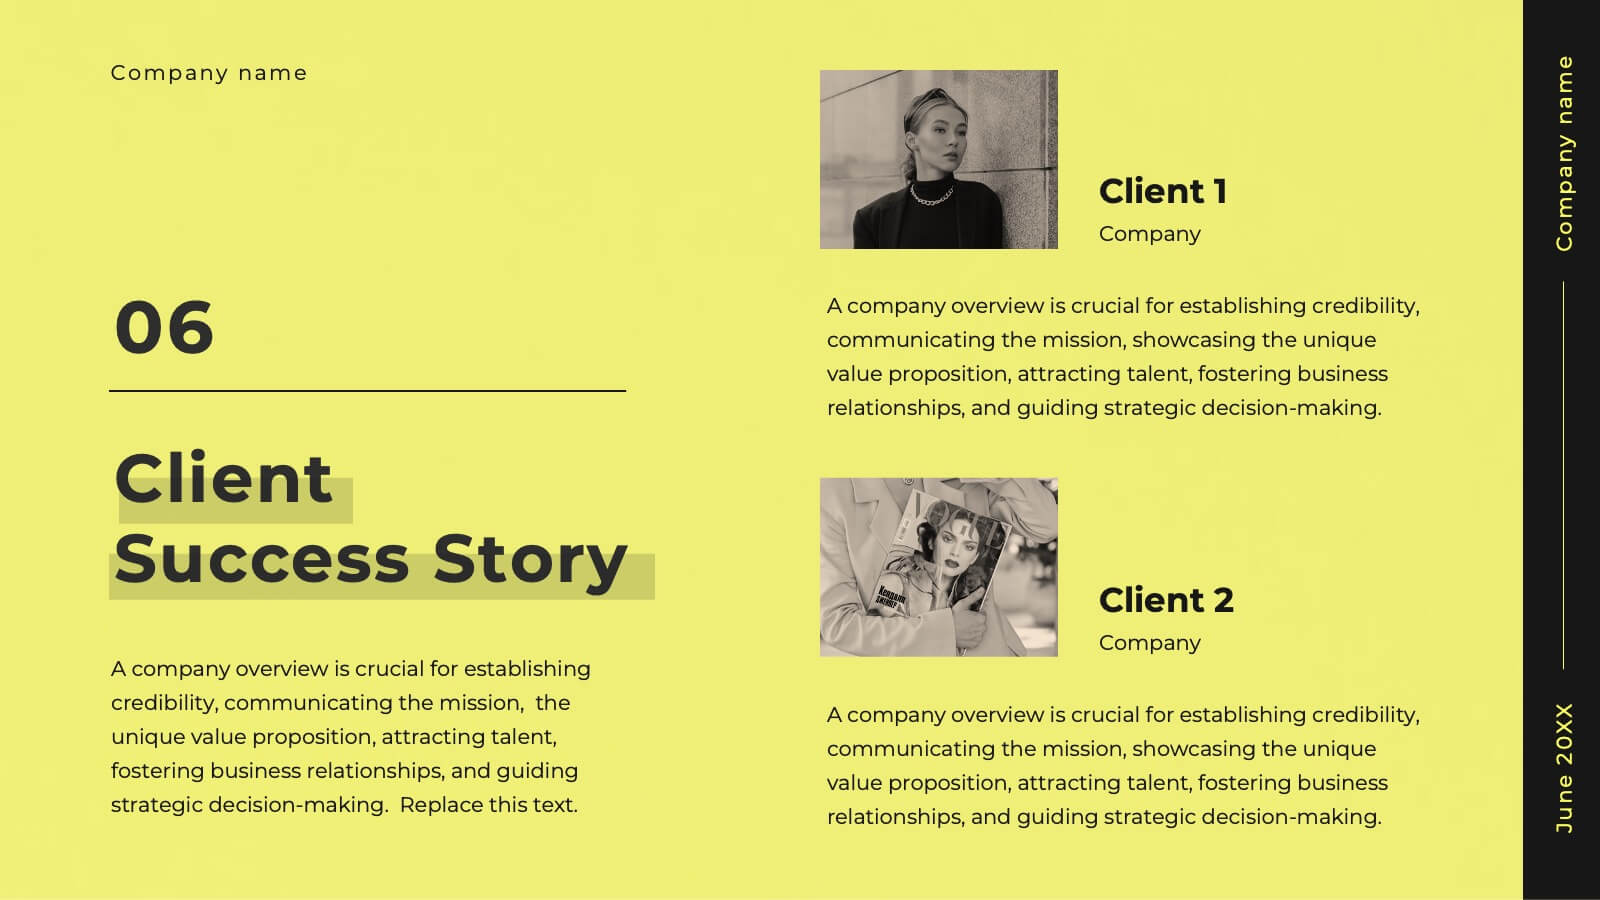
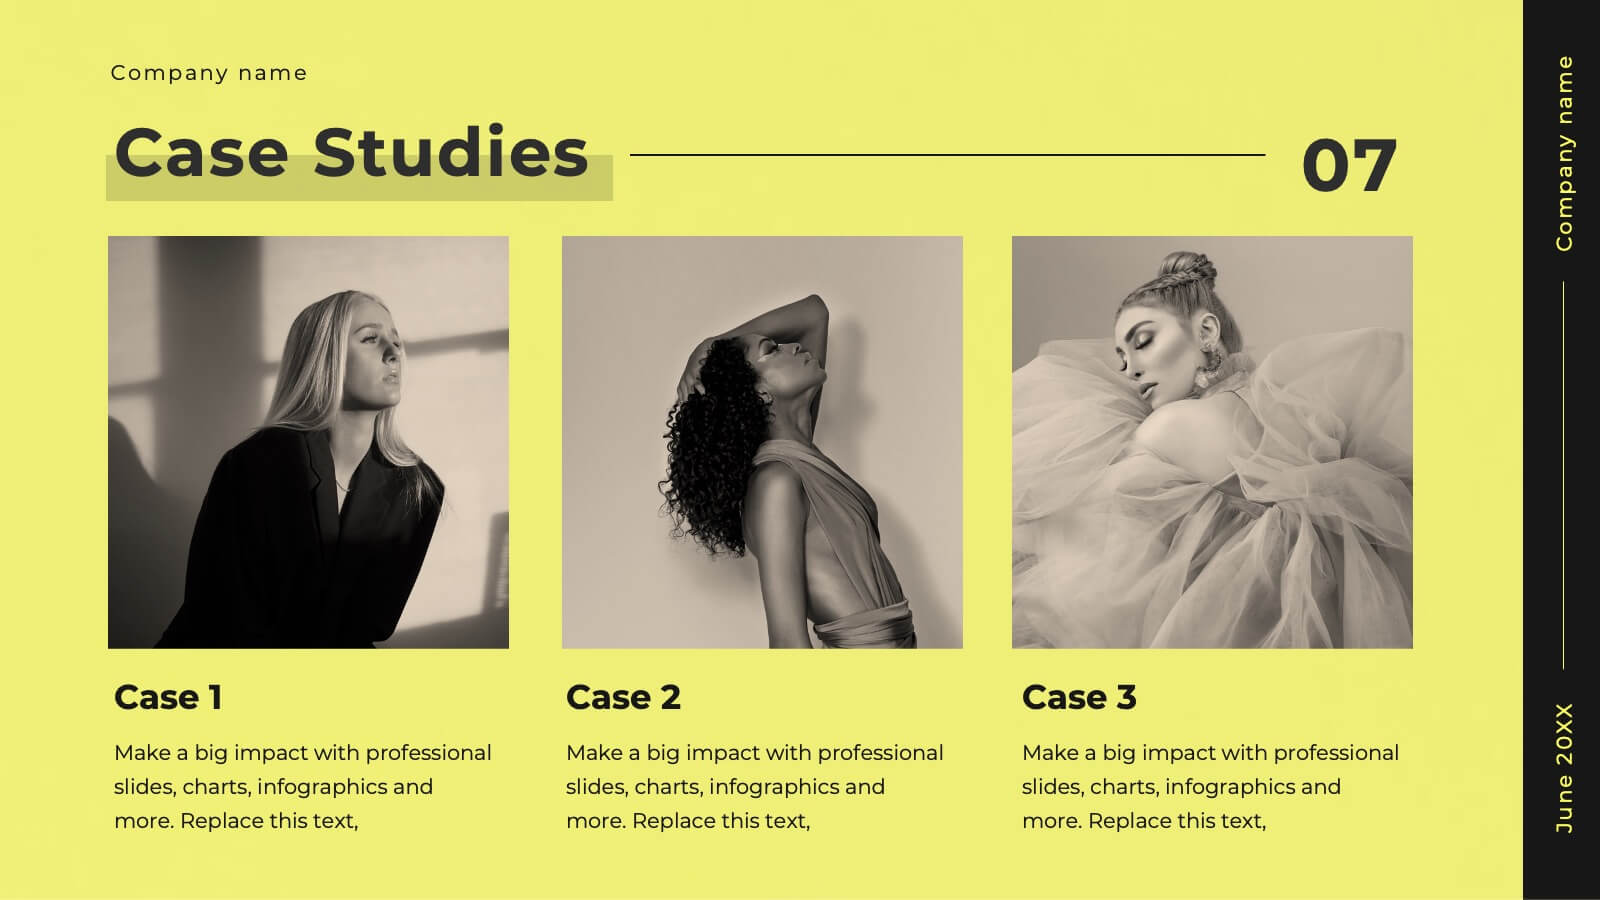
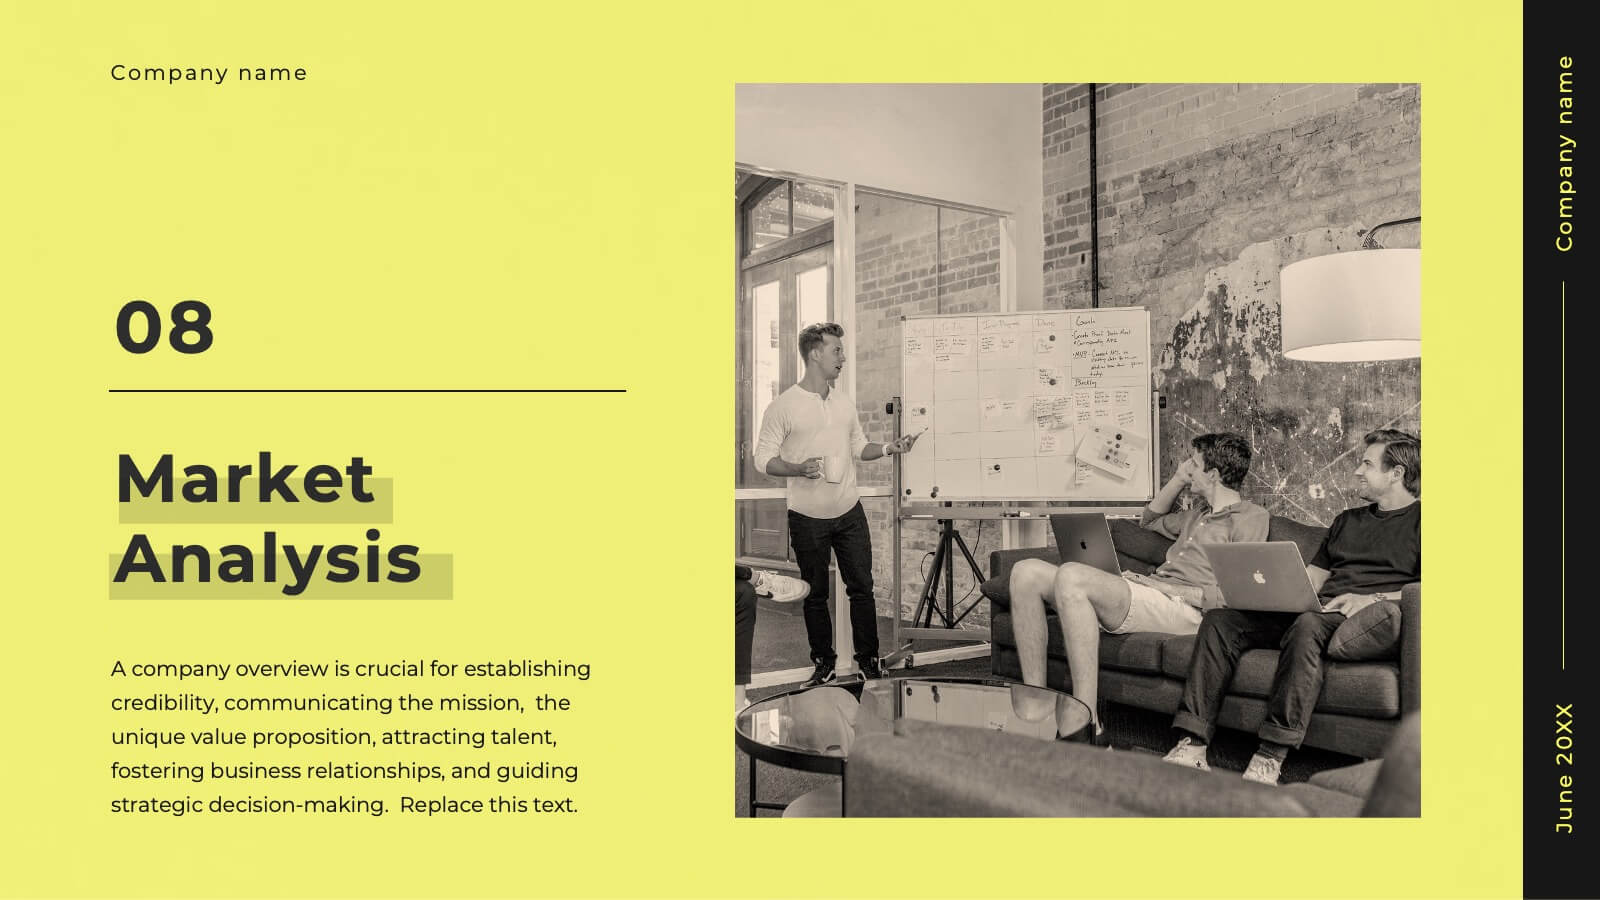
Glimmer Creative Agency Pitch Deck Presentation
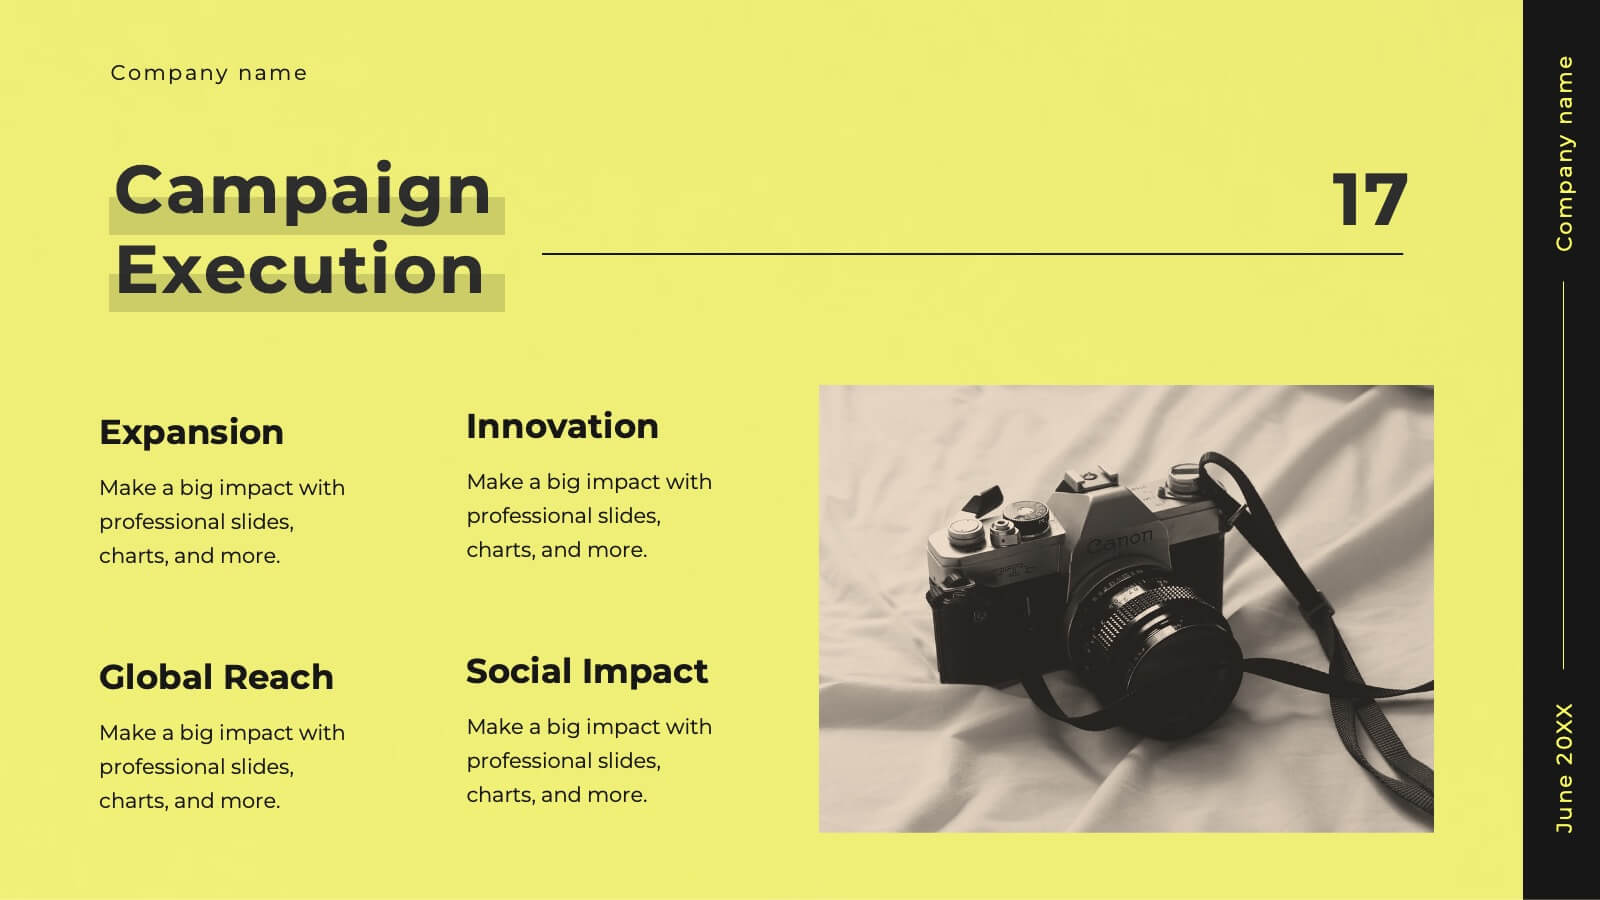
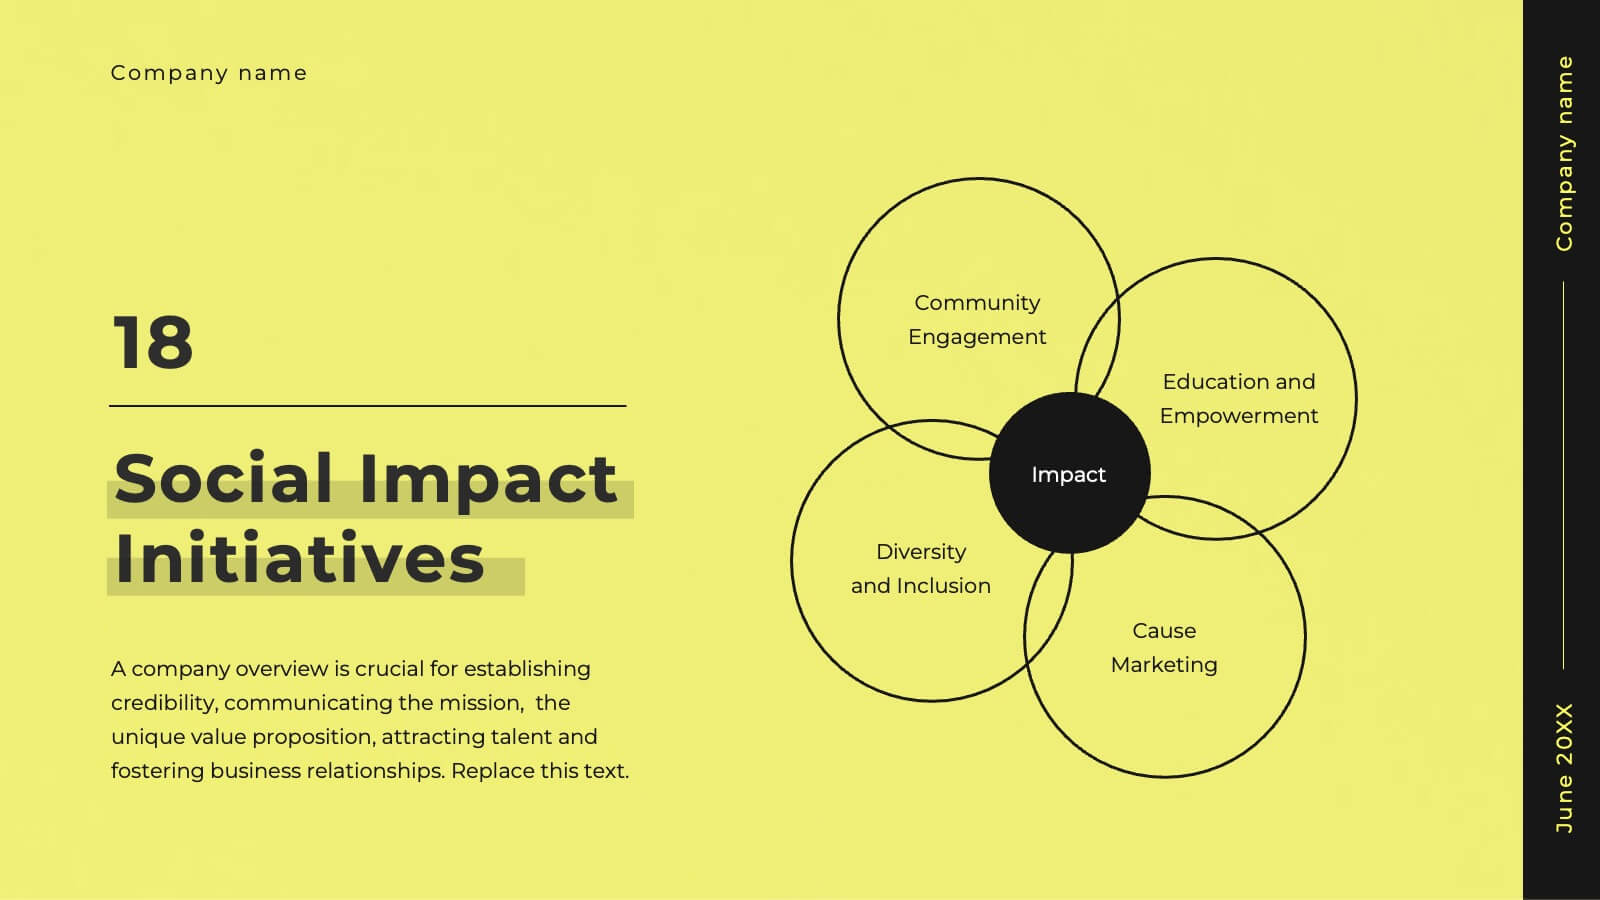
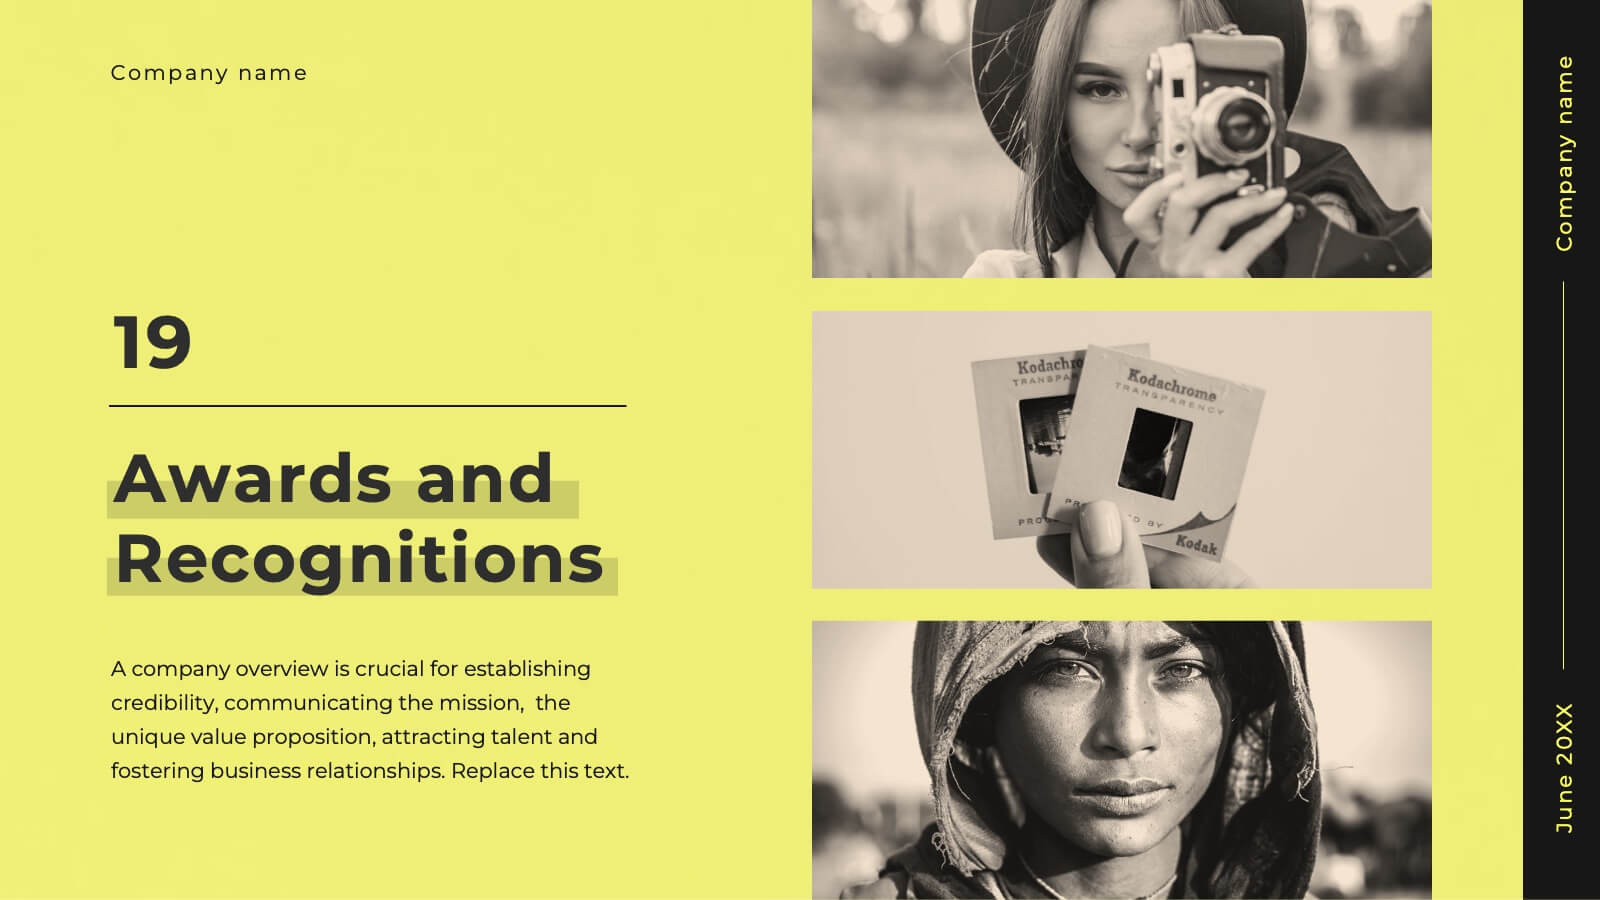
Step up your game with this vibrant agency pitch deck template! Ideal for showcasing your services, client success stories, and strategic approach, it includes dynamic slides for market analysis and campaign execution. Engage potential clients with compelling visuals and well-organized content. Compatible with PowerPoint, Keynote, and Google Slides for a smooth presentation experience on any platform.


26 slides
Remote Work Strategies Presentation
Enhance your team's flexibility with our Remote Work Strategies presentation template, designed for use with PowerPoint, Keynote, and Google Slides. This template is an invaluable asset for team leaders, HR professionals, and business consultants dedicated to cultivating a productive remote work culture. Our template is tailored to provide an in-depth analysis of remote work best practices, offering slides that cover essential strategies for communication, collaboration, and project management in a virtual environment. It also includes insights on setting up a successful home office, maintaining work-life balance, and leveraging technology for seamless remote operations. With customizable elements, you can illustrate the advantages of remote work, share success stories, and provide actionable tips to maximize team efficiency from afar. This template is SEO-optimized to ensure your presentation reaches those seeking to optimize their remote work operations and foster a thriving digital workplace.


26 slides
Luxury Hotel Professional Company Profile Presentation
Step into the opulent embrace of luxury hospitality, where every detail whispers elegance and exclusivity. Cast in a sophisticated palette of rich brown and pristine white, our template exudes the bold allure of luxe. Adorned with high-end graphics, elite icons, and evocative image placeholders, it's the embodiment of grandeur and comfort. Flawlessly tailored for Powerpoint, Keynote, or Google Slides. A prime choice for luxury hoteliers, event planners, hospitality consultants, or any brand aiming to showcase their exquisite offerings. Elevate your narrative; immerse your audience in the world of premium hospitality.


6 slides
Business Decision Venn Diagram Presentation
Make complex decision-making simple and visually impactful with this Business Decision Venn Diagram Presentation. Featuring a bold triangular layout with six segmented areas, this slide is ideal for presenting overlapping factors, interconnected strategies, or priority zones. Perfect for business planning, competitive analysis, or project evaluation. Fully editable in PowerPoint, Keynote, and Google Slides for seamless integration into your presentations.


21 slides
Blaze Blitz Graphic Design Project Plan Presentation
Introducing the Blaze Black Design Project Plan template—where sophistication meets functionality! This visually striking template is designed to captivate your audience with its bold black and white theme, exuding professionalism and creativity. Perfect for designers and creative agencies, this template is meticulously structured to guide your project from concept to completion. Each slide is designed to highlight key aspects like the Design Brief, Concept Development, Target Audience, and Design Process, ensuring your message is conveyed with clarity and impact. The sleek typography, combined with high-contrast visual elements, enhances readability while adding a modern edge to your presentation. Whether you're pitching a new design project, showcasing your design process, or planning your next creative endeavor, this template is your go-to tool for delivering presentations that leave a lasting impression. Compatible with PowerPoint, Keynote, and Google Slides, it's fully customizable to fit your brand and style. Get ready to wow your audience with this powerful design template!


4 slides
Professional Team Profiles and Roles Presentation
Showcase your team with impact using the Professional Team Profiles and Roles Presentation. Ideal for company introductions, this slide highlights key members with photo, name, title, and a brief role description. Clean, modern layout makes it easy to customize in PowerPoint, Canva, or Google Slides to match your brand.


10 slides
Data Security and Privacy Measures Presentation
Illustrate your protection protocols clearly with the Data Security and Privacy Measures presentation slide. Featuring a smartphone icon secured with lock, shield, and magnifying glass elements, this layout is ideal for communicating encryption policies, access controls, and compliance steps. Fully editable in PowerPoint, Keynote, and Google Slides.


10 slides
Hierarchy Tree Structure Slide Presentation
Bring your ideas to life with a dynamic visual flow that connects every stage of your business strategy. Perfect for mapping growth, processes, or team structures, this clean and modern layout keeps your data clear and engaging. Fully compatible with PowerPoint, Keynote, and Google Slides for effortless customization.


4 slides
Social and Professional Networking
Visualize global connections and collaborative ecosystems with this Social and Professional Networking presentation. Ideal for HR teams, marketers, or networking strategists, it showcases relationship-building and engagement across key hubs. Fully customizable in PowerPoint, Keynote, and Google Slides for maximum flexibility in any professional setting.


20 slides
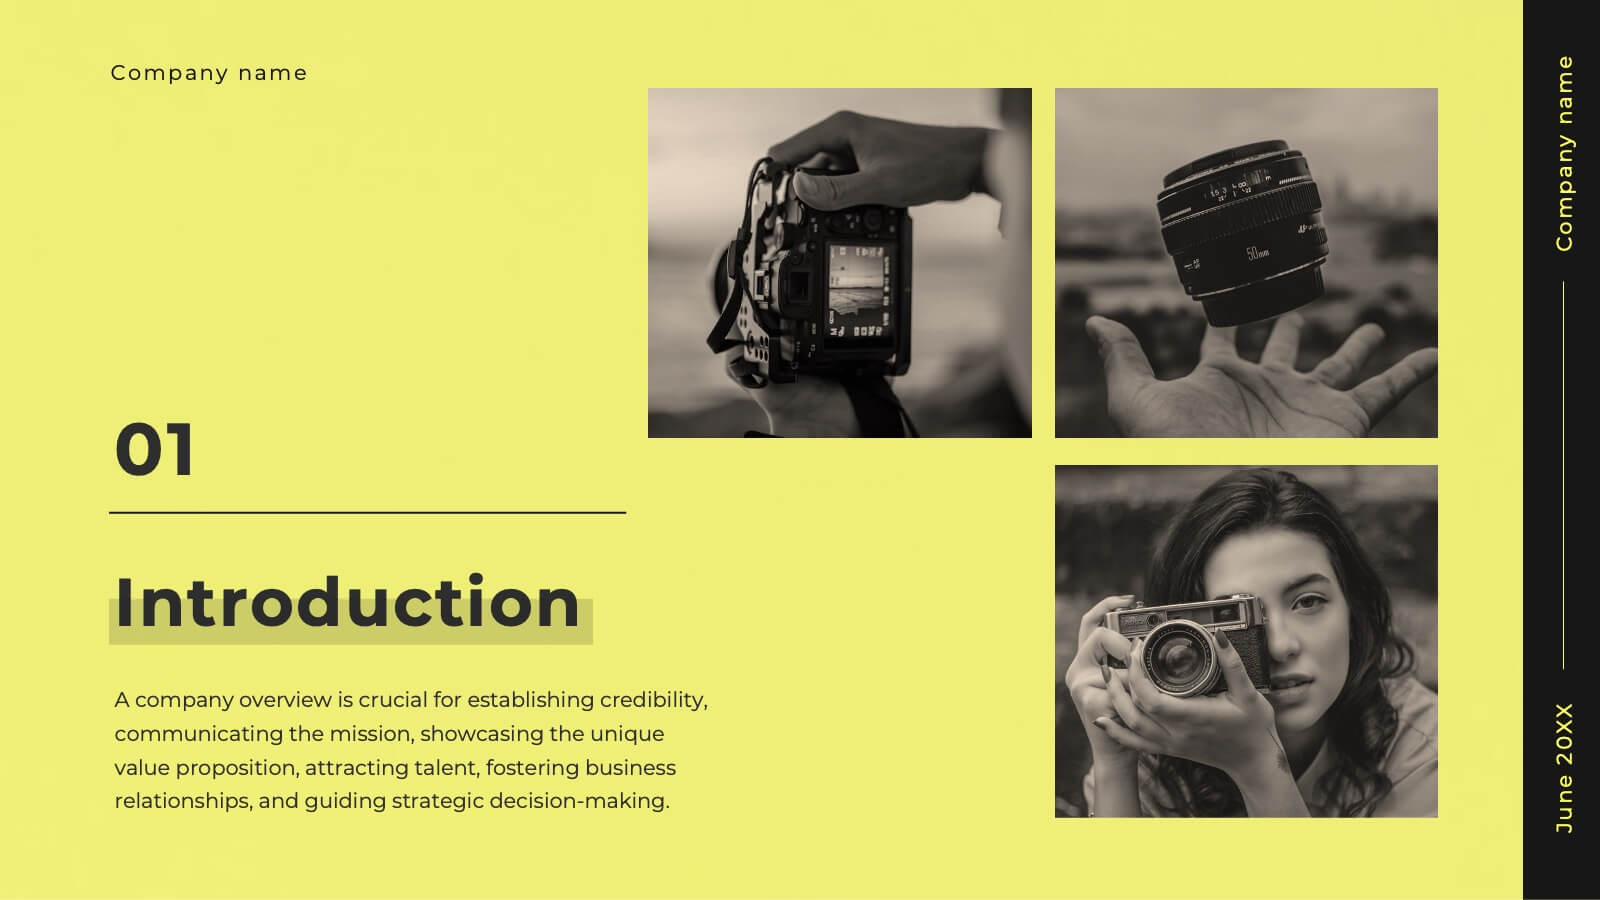
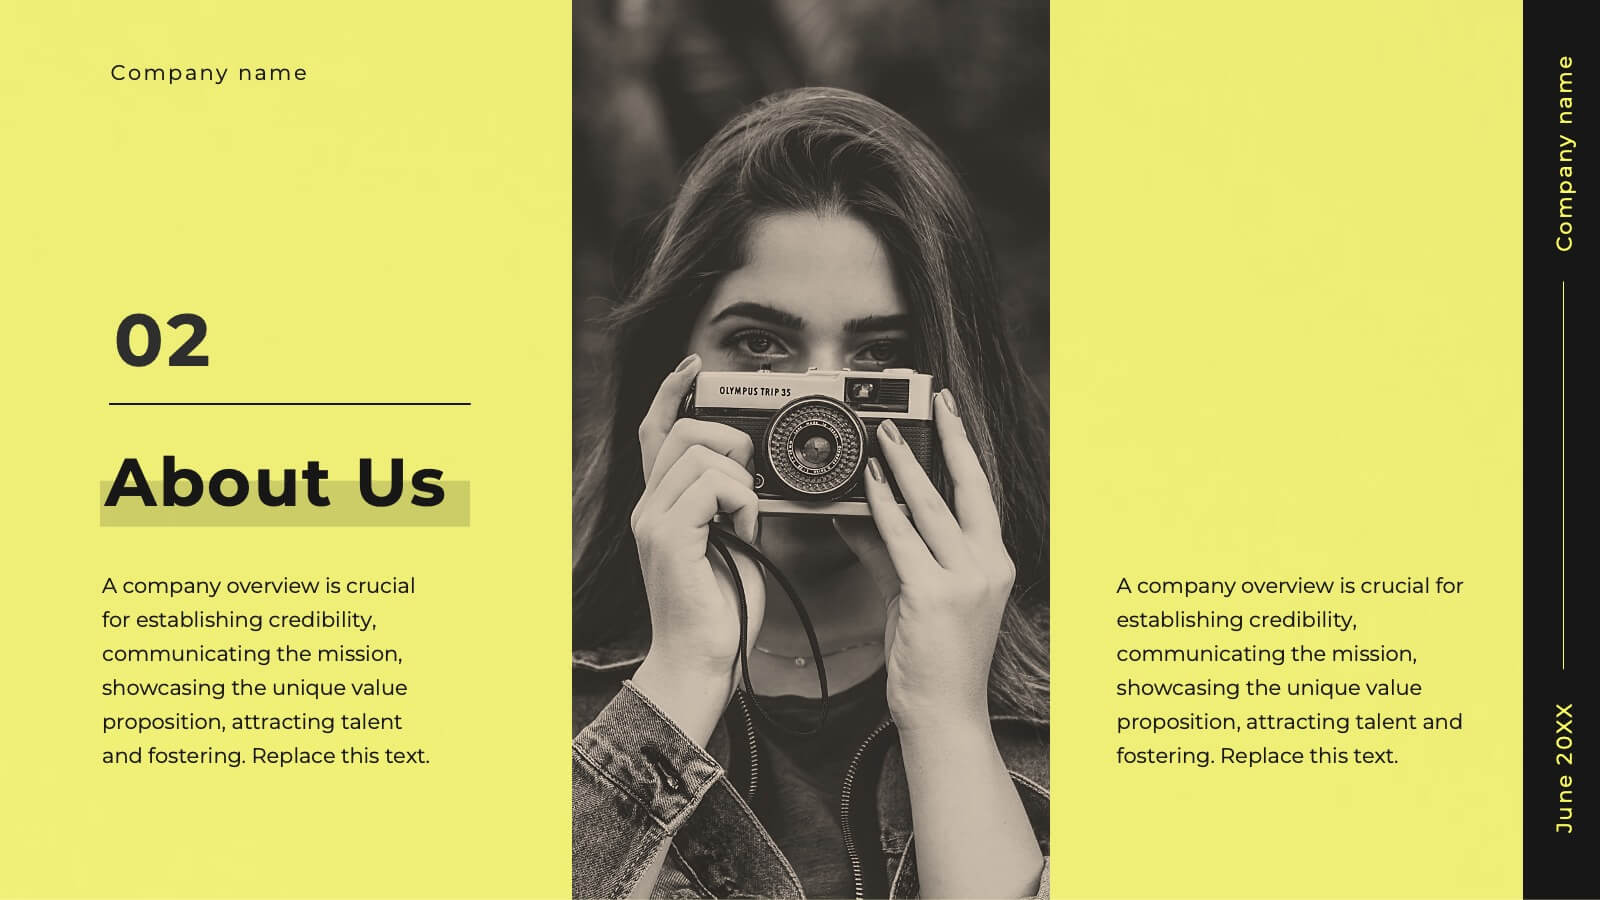
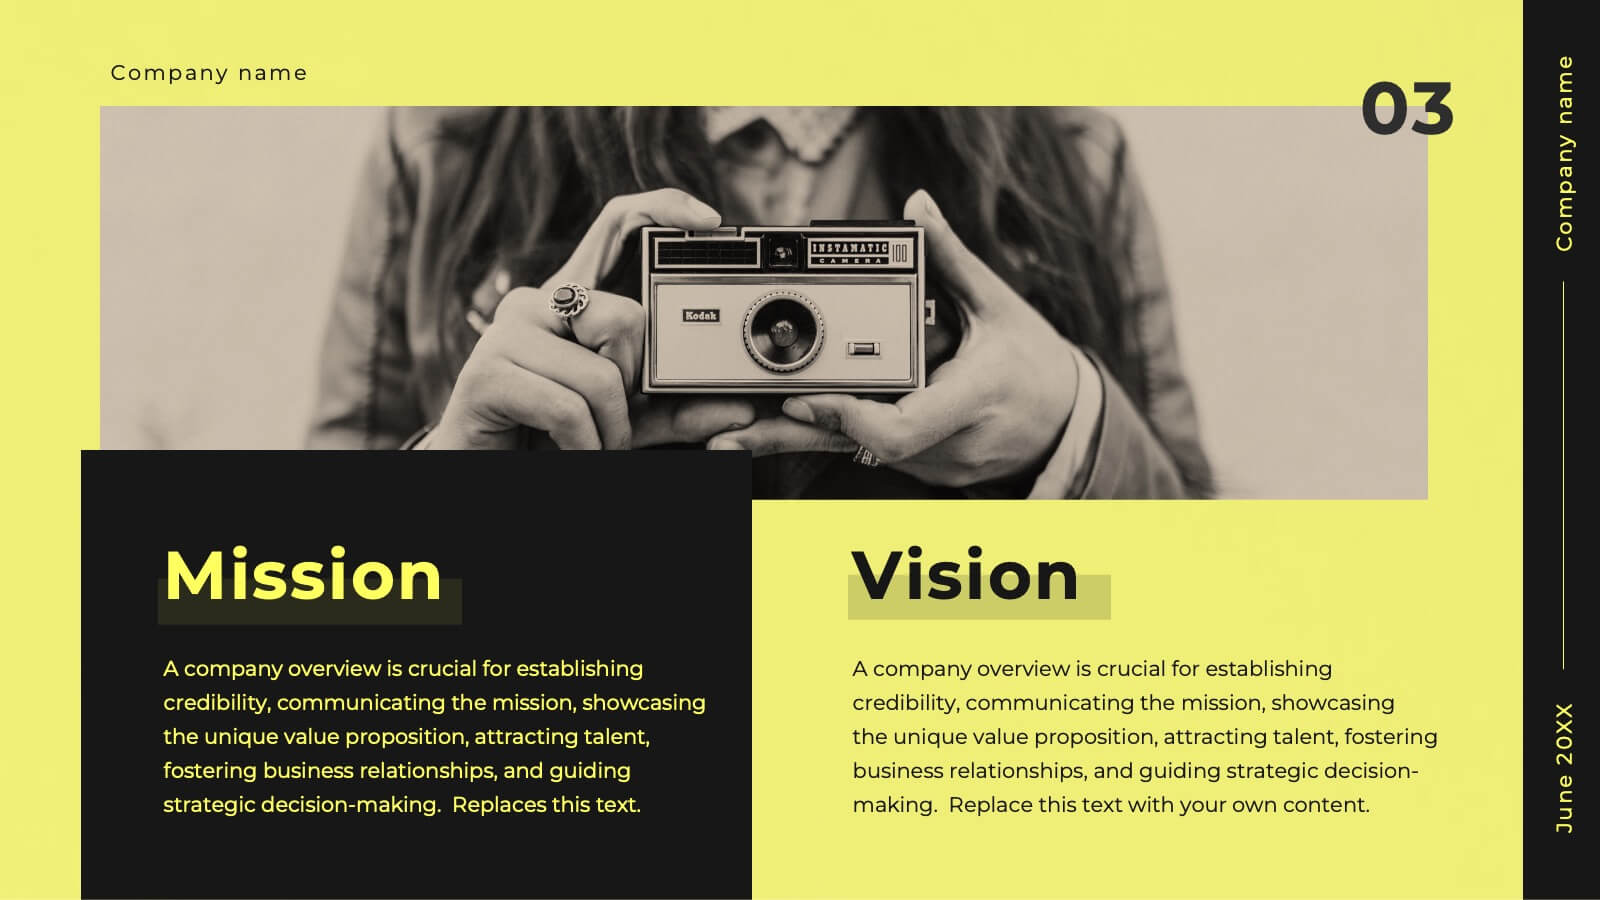
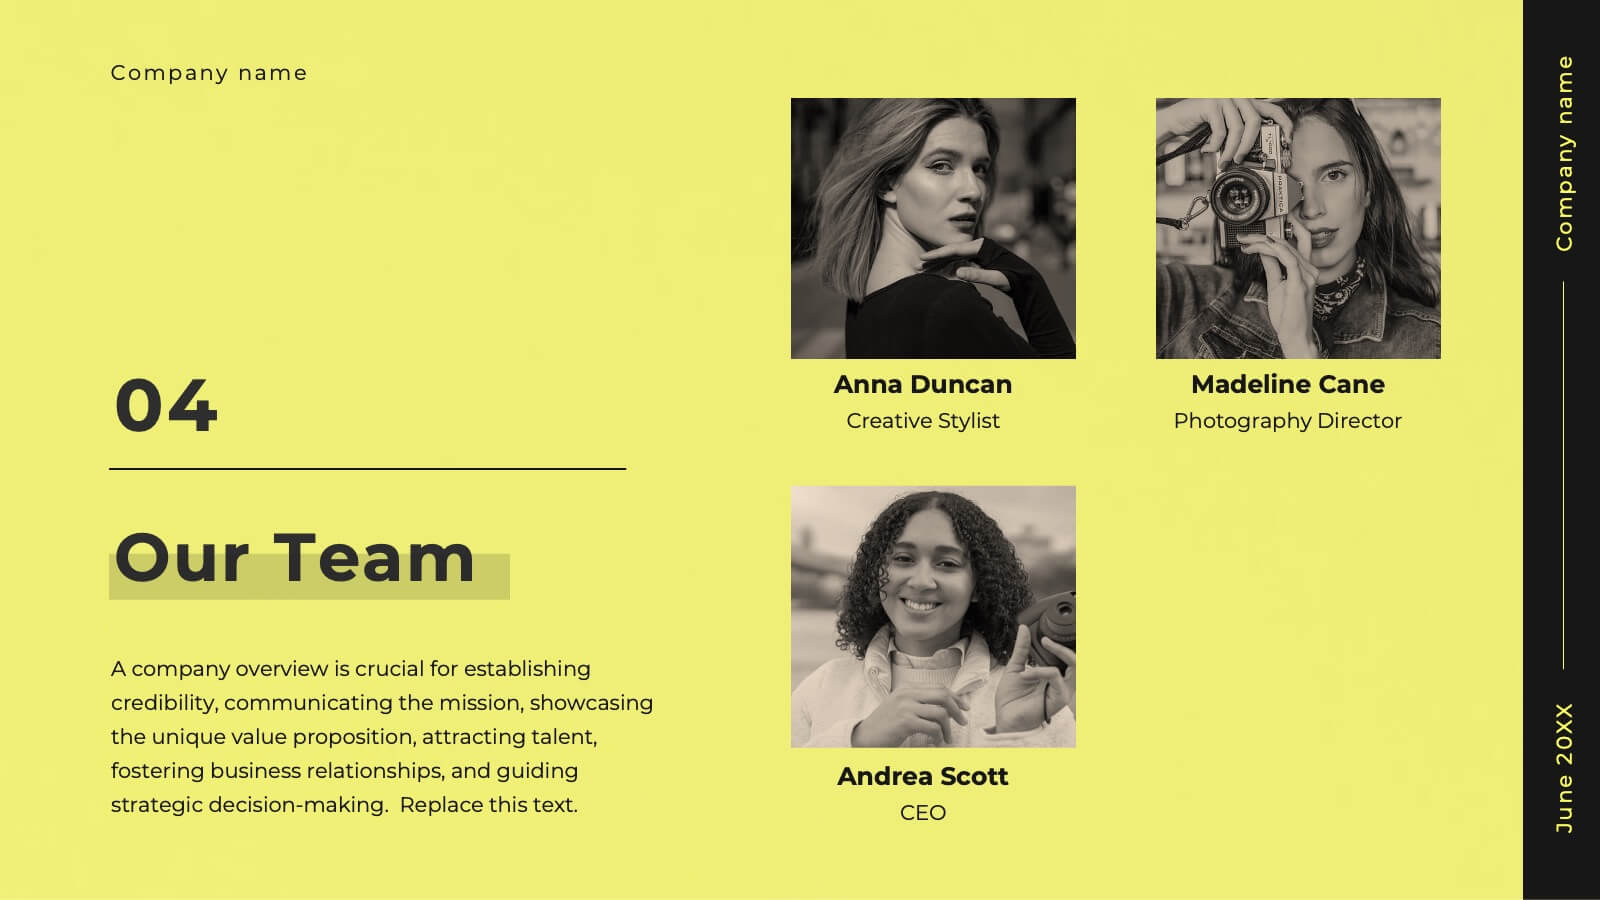
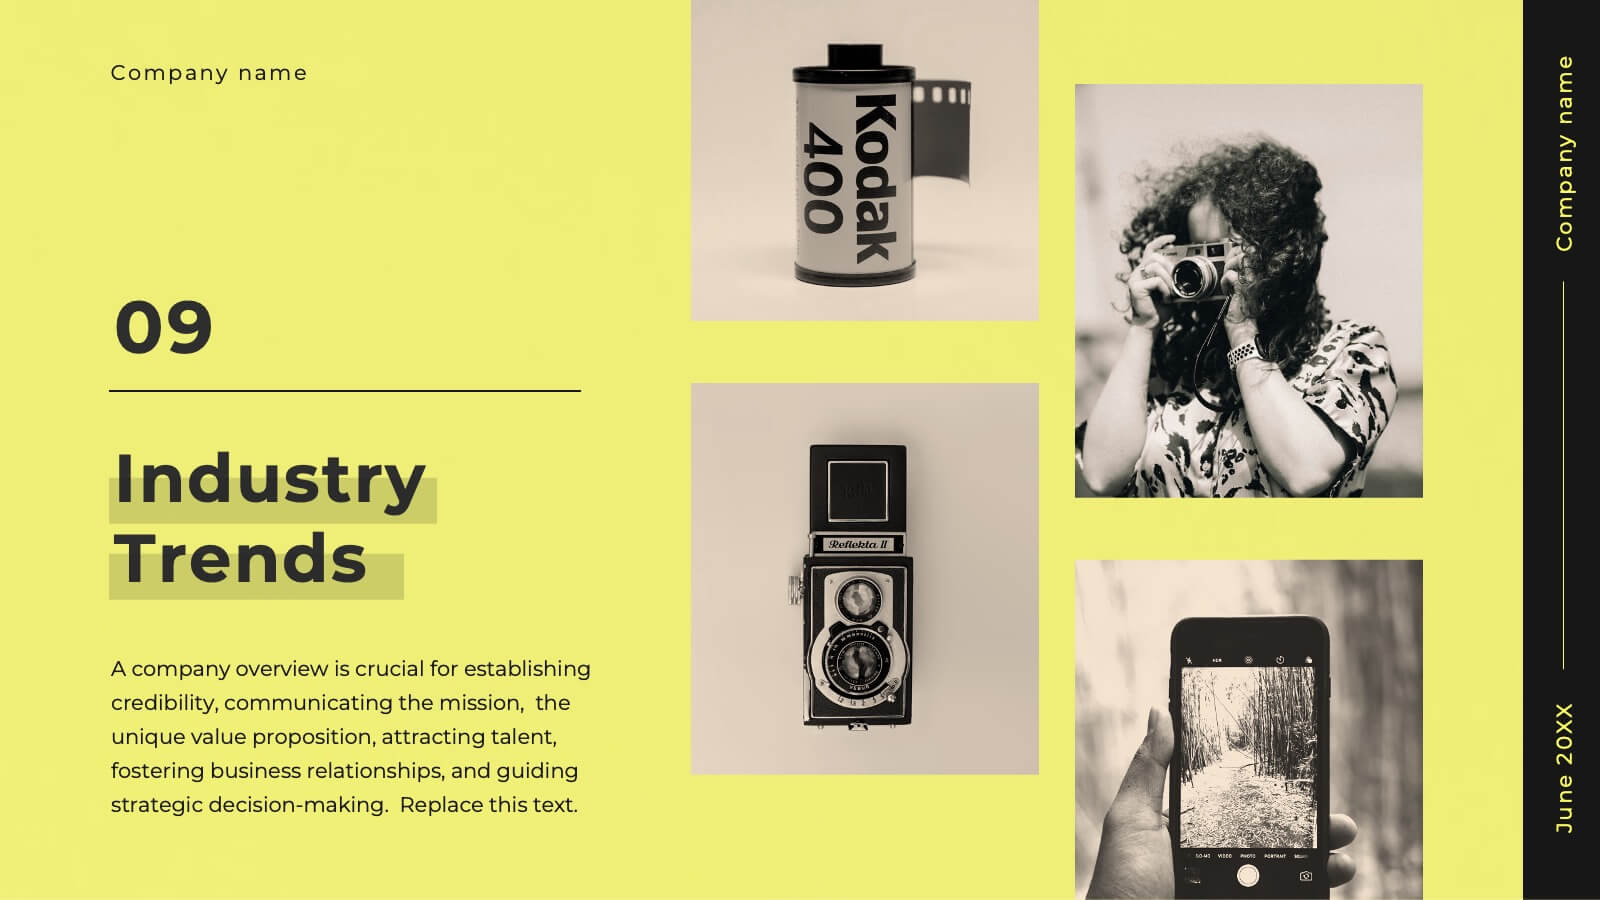
Celestique Photography Portfolio Template Presentation
This Photography Portfolio Presentation offers a sleek and modern design to showcase your work professionally. Featuring sections for project highlights, creative process, client testimonials, and pricing, it's fully customizable and easy to edit in PowerPoint, Keynote, and Google Slides. Perfect for photographers looking to impress potential clients.


5 slides
Rival Strategy Review Presentation
Bring competitive insights to life with a modern, circular layout that highlights rival strategies, key strengths, and market positioning. Perfect for analyzing competitors and identifying growth opportunities, this presentation combines clarity with style. Fully compatible with PowerPoint, Keynote, and Google Slides for effortless customization and professional delivery.


12 slides
Personal Portfolio Presentation
Our Personal Portfolio Presentation template is designed for professionals looking to make a strong impression with a sleek and engaging portfolio. This comprehensive template provides an excellent framework to showcase your personal brand, professional journey, and achievements. The opening slide, with your name boldly presented, acts as your introduction. It's followed by a 'Get to know me' section that offers a glimpse into your personality and work ethic. The 'Skills' slide is a visually impactful way to present your competencies, while the 'Experience' slide chronologically outlines your professional milestones. Featuring sections for detailed case studies, showcased projects, and educational background, this template helps you tell your story in a cohesive and captivating manner. The 'Recognitions' slide allows you to highlight awards and honors, adding credibility to your profile. Ending with a compelling 'Let's work together!' call-to-action, this template is adaptable to PowerPoint, Keynote, and Google Slides, perfect for anyone looking to stand out in their field.


6 slides
Creative Hexagon Process Flow Presentation
Bring order and creativity together with a sleek, geometric layout that turns complex processes into clear visual stories. This presentation helps you map workflows, stages, or milestones with a modern, connected hexagon flow. Fully editable and compatible with PowerPoint, Keynote, and Google Slides for effortless customization and presentation.


20 slides
Uplift Content Marketing Pitch Deck Presentation
This content marketing presentation is designed to elevate your strategies to the next level! It covers everything from industry insights to the latest consumer behavior trends and SEO strategies. It helps streamline influencer marketing, data-driven approaches, and even includes sustainability in marketing. Perfect for PowerPoint, Keynote, and Google Slides presentations!


4 slides
Project Timeline & Milestone Presentation
Stay on track and visualize your progress with this Project Timeline & Milestone Presentation. Perfect for project managers and team leads, this template features a clean Gantt-style layout that spans multiple months, allowing you to clearly map out tasks, timelines, and key milestones. Use it to enhance stakeholder reporting or internal planning sessions. Fully editable in PowerPoint, Keynote, and Google Slides.