


Features
- 6 Unique slides
- Fully editable and easy to edit in Microsoft Powerpoint, Keynote and Google Slides
- 16:9 widescreen layout
- Clean and professional designs
- Export to JPG, PDF or send by email


Do you have any questions?
Recommend


6 slides
Peak Flow Chart Infographic
A flowchart is a visual representation of a process or workflow using various symbols, arrows, and connectors to show the sequence of steps and decisions involved in that process. This infographic template is a powerful tool for illustrating complex processes in a clear and easy-to-understand manner. Compatible with Powerpoint, Keynote, and Google Slides. The flowcharts featured consist of various shapes or symbols that represent different process steps or activities. The infographic depicts the sequential order of steps in a process, showing the logical progression from one step to another. Each step is connected to the next step using arrows.


7 slides
Pillar Distribution Infographic
Discover a striking visual representation of data with the pillar distribution Infographic. Bathed in shades of blue, white, and green, this template masterfully showcases the core foundations of any topic in a 'pillar' format. Specifically tailored for business analysts, educators, and marketers, the infographic aids in simplifying dense information. With its crisp graphics, bespoke icons, and dedicated image placeholders, conveying your insights becomes an engaging narrative experience. Its versatility ensures smooth integration with PowerPoint, Keynote, and Google Slides, transforming any presentation into a captivating visual story.


4 slides
Employee Performance Feedback Presentation
Enhance your performance review process with the Employee Performance Feedback infographic. This structured and visually engaging template presents key evaluation criteria, employee achievements, and areas for improvement in a clear format. Fully customizable and compatible with PowerPoint, Keynote, and Google Slides.


3 slides
Clear Navigation Table of Content Presentation
Streamline your presentation flow with this Clear Navigation Table of Content layout. Featuring labeled sections, visual cues, and photo placeholders, this slide helps guide your audience through key topics. Perfect for reports, proposals, or training decks. Fully customizable in PowerPoint, Keynote, and Google Slides for seamless integration and personalization.


7 slides
Medical Care Infographic Presentation
A medical infographic is a visual representation of information related to medicine, health and healthcare. This infographic design can help people understand complex topics and communicate more effectively about science. This medical infographic template features a dynamic background image, along with a visual representation of information related to healthcare. It is a great way to promote your health-related content. This infographic is a great tool to provide patients with a breakdown of information. This template is compatible with Powerpoint, Keynote and Google Slides.


4 slides
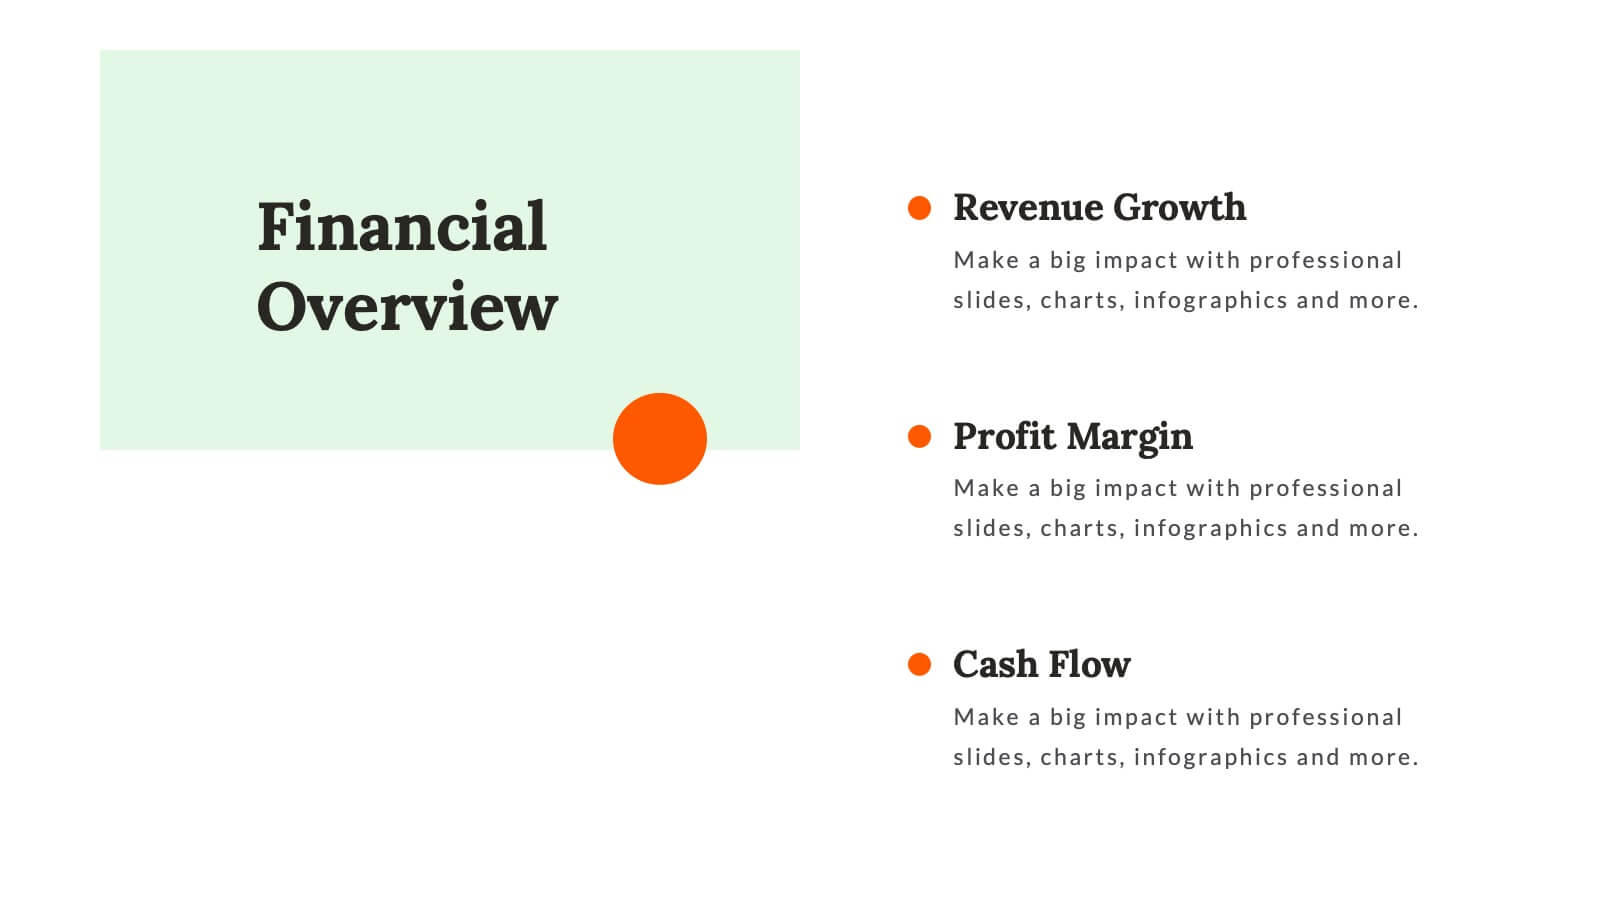
Financial Report Presentation
Enhance your financial presentations with our "Financial Report Presentation" template. Designed for clarity and visual impact, this infographic features a stylized financial bag icon segmented into color-coded sections, each representing a different financial metric such as revenue, expenses, profits, and investments. This creative visual structure allows for a clear and segmented display of your company's financial health, making complex data easily understandable. Ideal for financial analysts, corporate presentations, and investor meetings, this template ensures key financial insights are communicated effectively and efficiently. Compatible with PowerPoint, Keynote, and Google Slides, it's an essential tool for delivering detailed and precise financial reports.
5 slides
Goal-Oriented Arrow Diagram Strategy
Visualize alignment, focus, and convergence toward business objectives with this dynamic arrow-to-target diagram. Perfect for strategy teams, consultants, and marketing leads to communicate multi-stream initiatives driving toward one central goal. Fully editable in PowerPoint, Keynote, and Google Slides to suit your content and branding needs.


21 slides
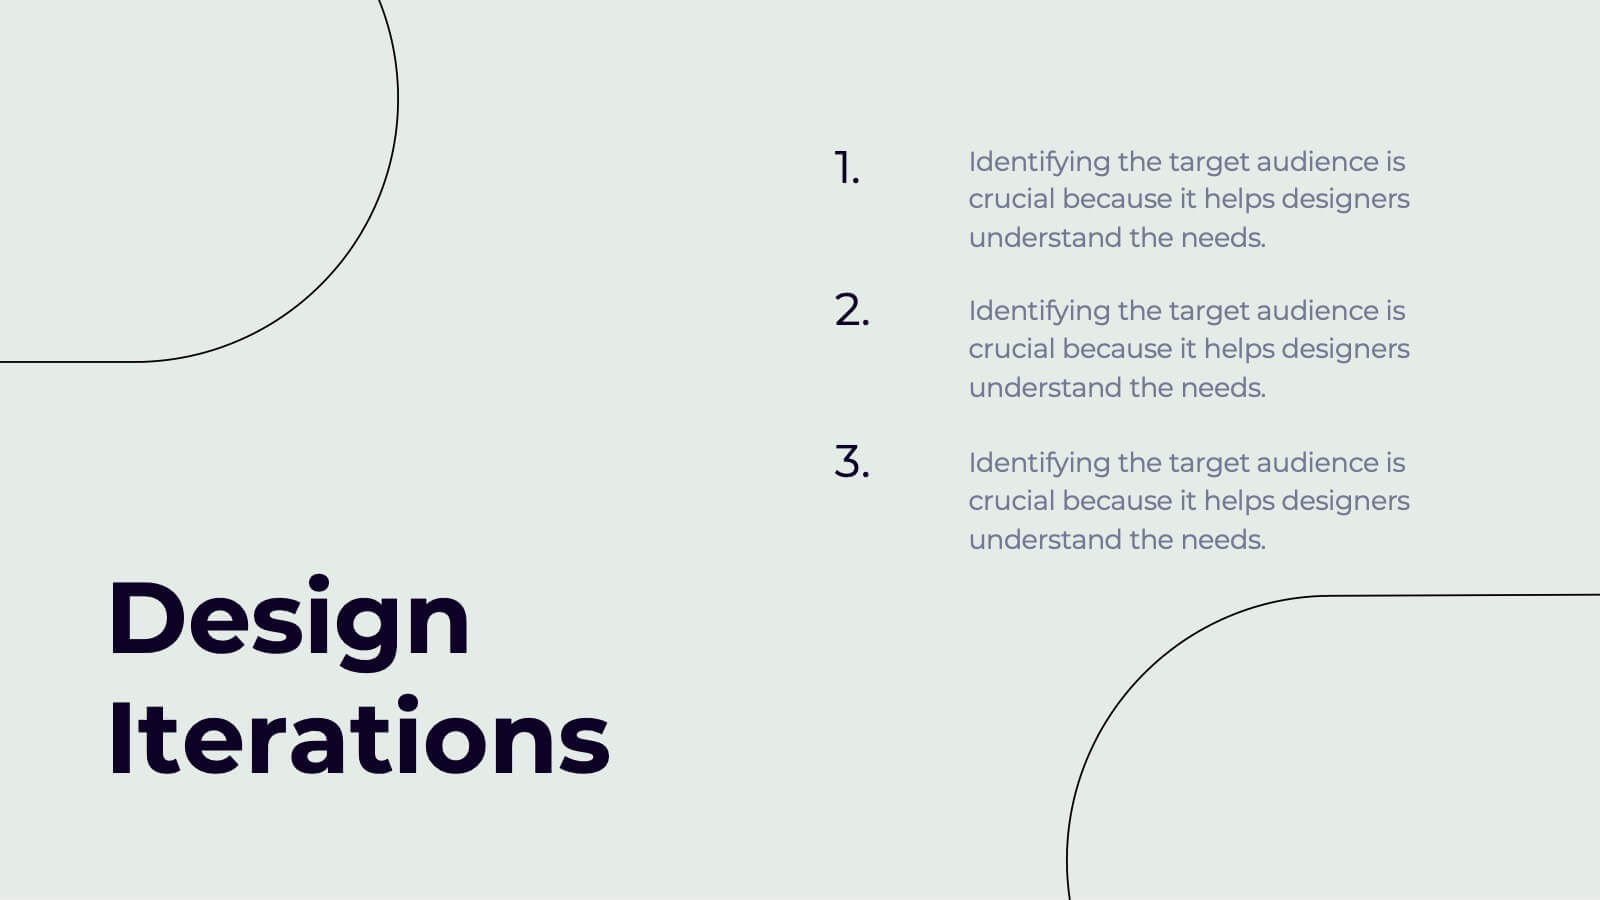
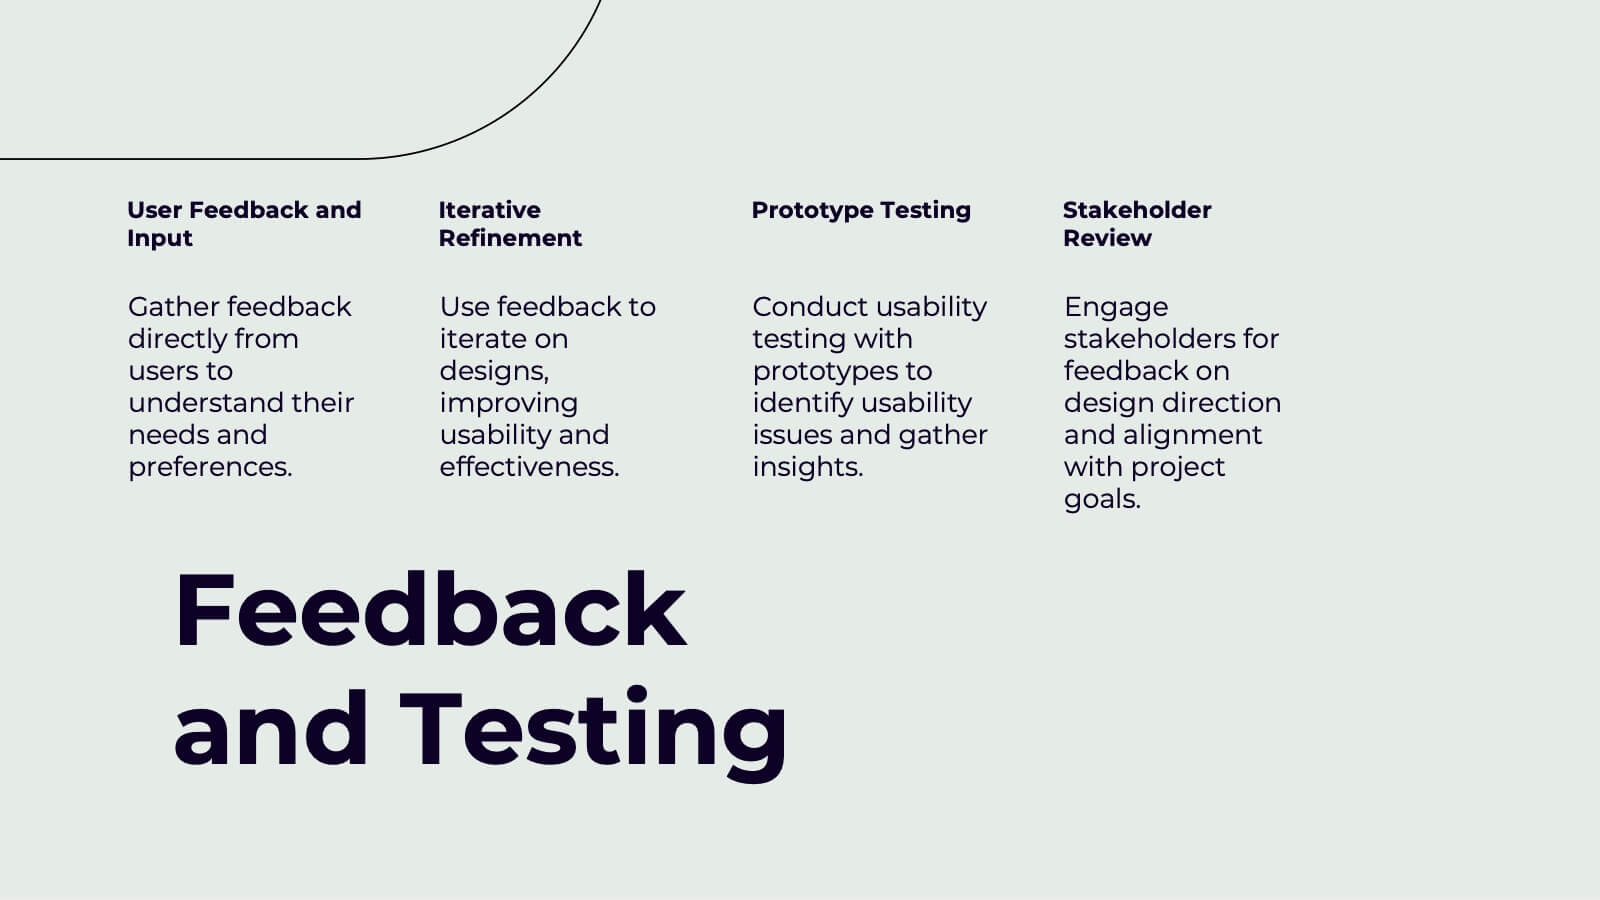
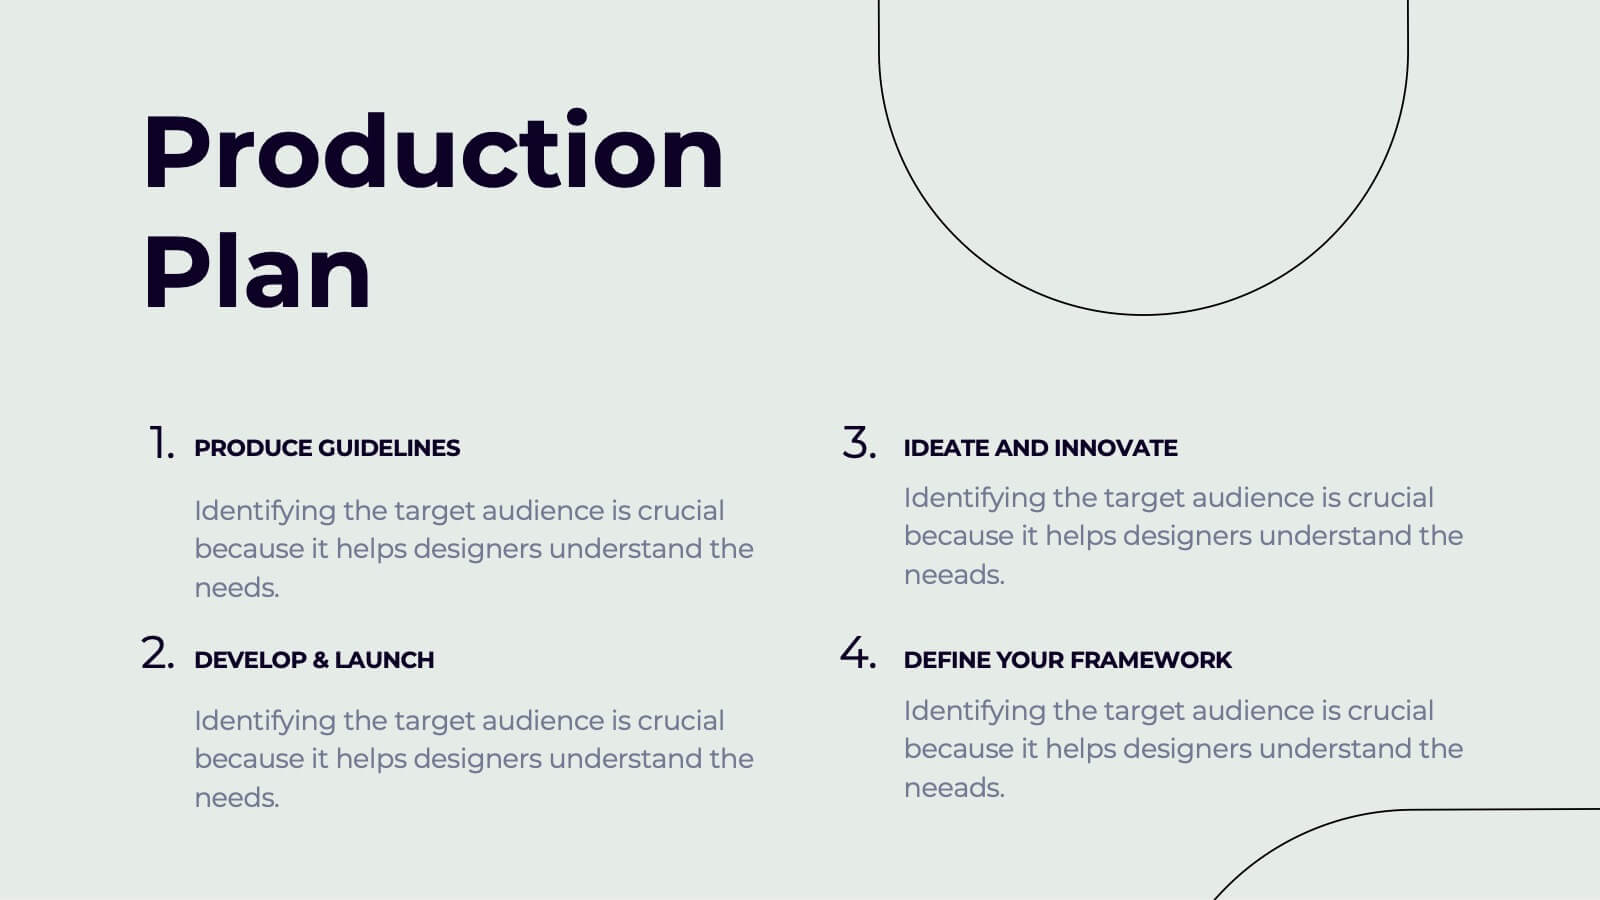
Yeti Creative Design Report Presentation
This modern design report template covers everything from concept development to design iterations and feedback testing. It’s visually striking, with sections for color schemes, typography, textures, and production plans. Ideal for showcasing creative projects and delivering professional presentations. Compatible with PowerPoint, Keynote, and Google Slides for ease of use.


2 slides
Clean Cover Page Presentation
Start your presentation with a bold first impression using this sleek and minimalistic cover design. Perfect for business proposals, reports, or client pitches, this layout draws attention with clean typography and a strong visual hierarchy. Fully editable and easy to personalize in PowerPoint, Keynote, and Google Slides for smooth customization.


5 slides
Business Figures and Key Numbers Overview Presentation
Present your data with clarity using this key-themed slide layout. Ideal for outlining five important metrics, business highlights, or strategic figures. The bold numerical format and clean design make your content easy to follow. Fully customizable in Canva, perfect for professional reports, pitches, and data-driven presentations.


20 slides
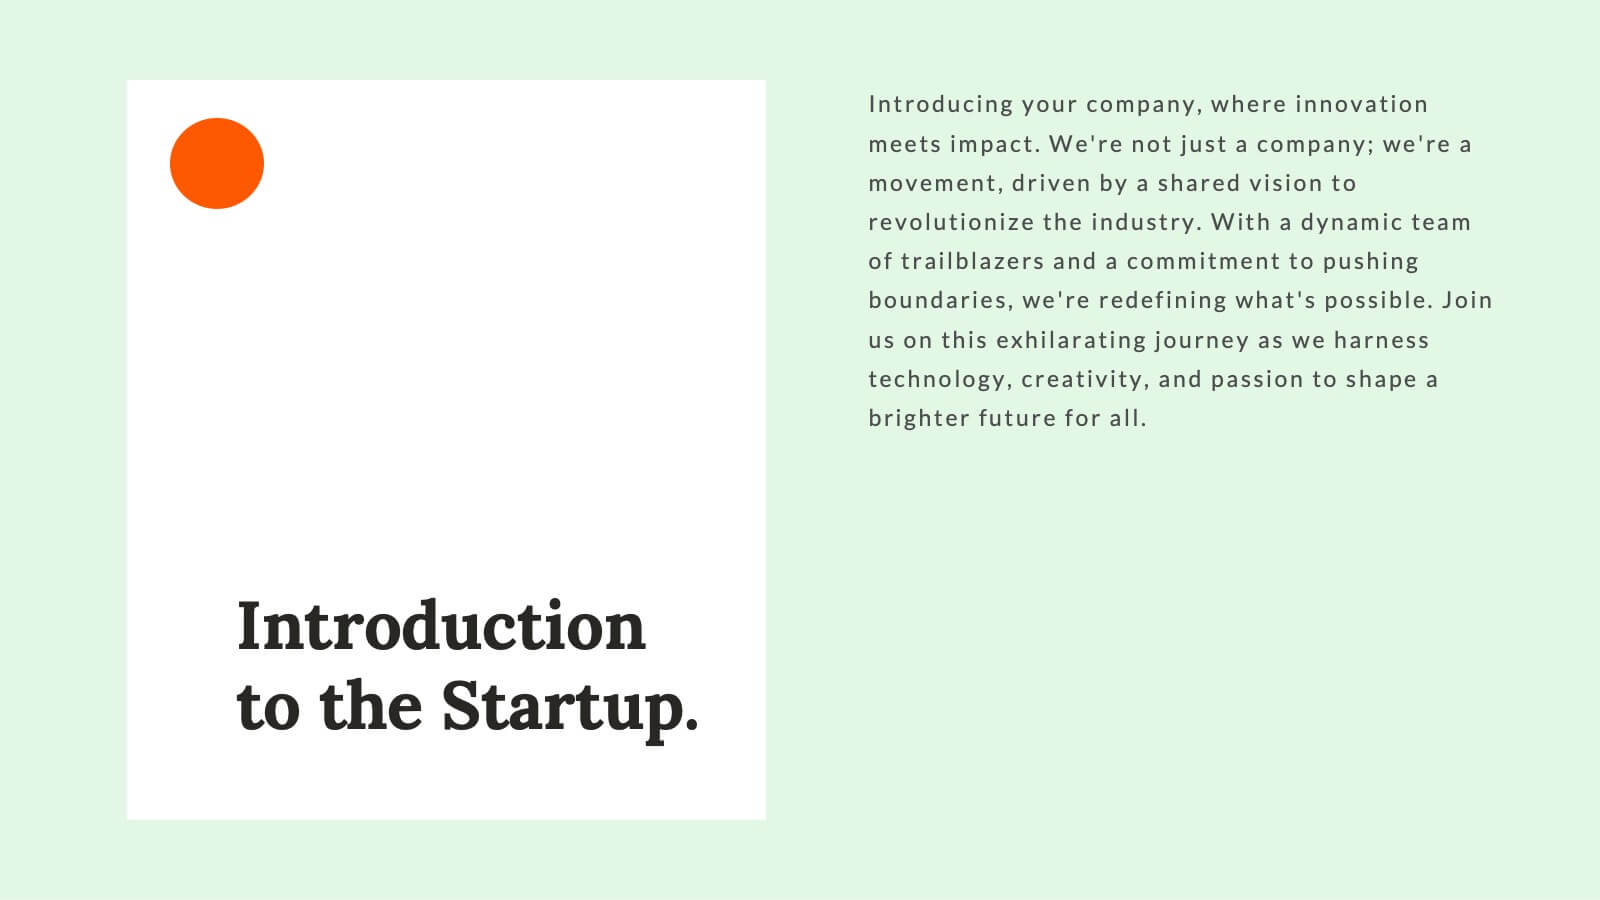
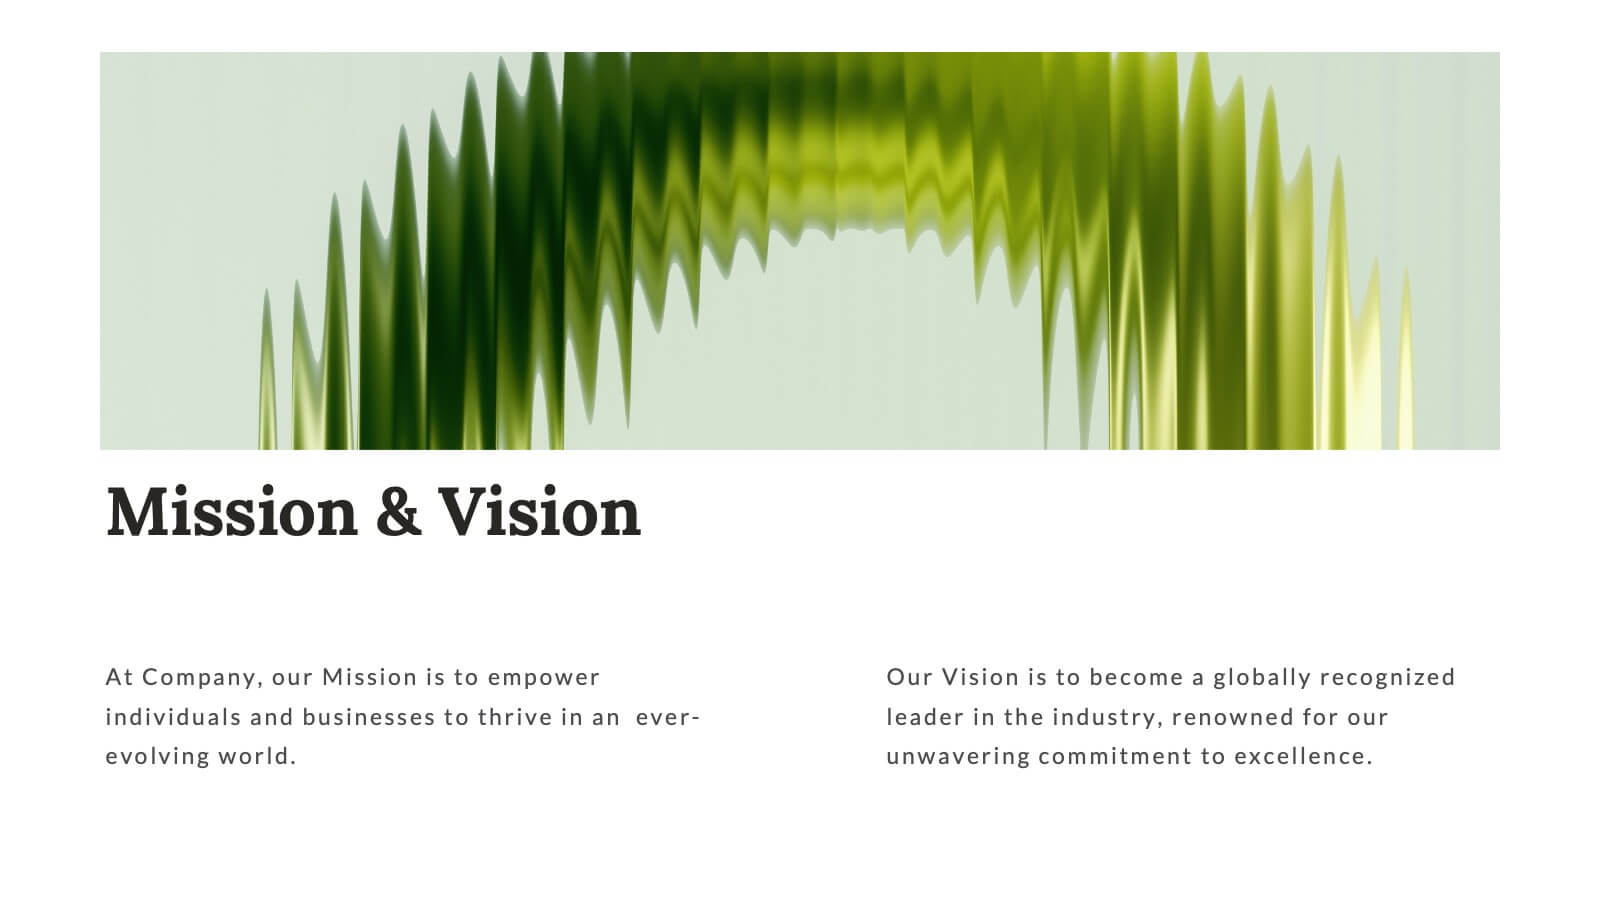
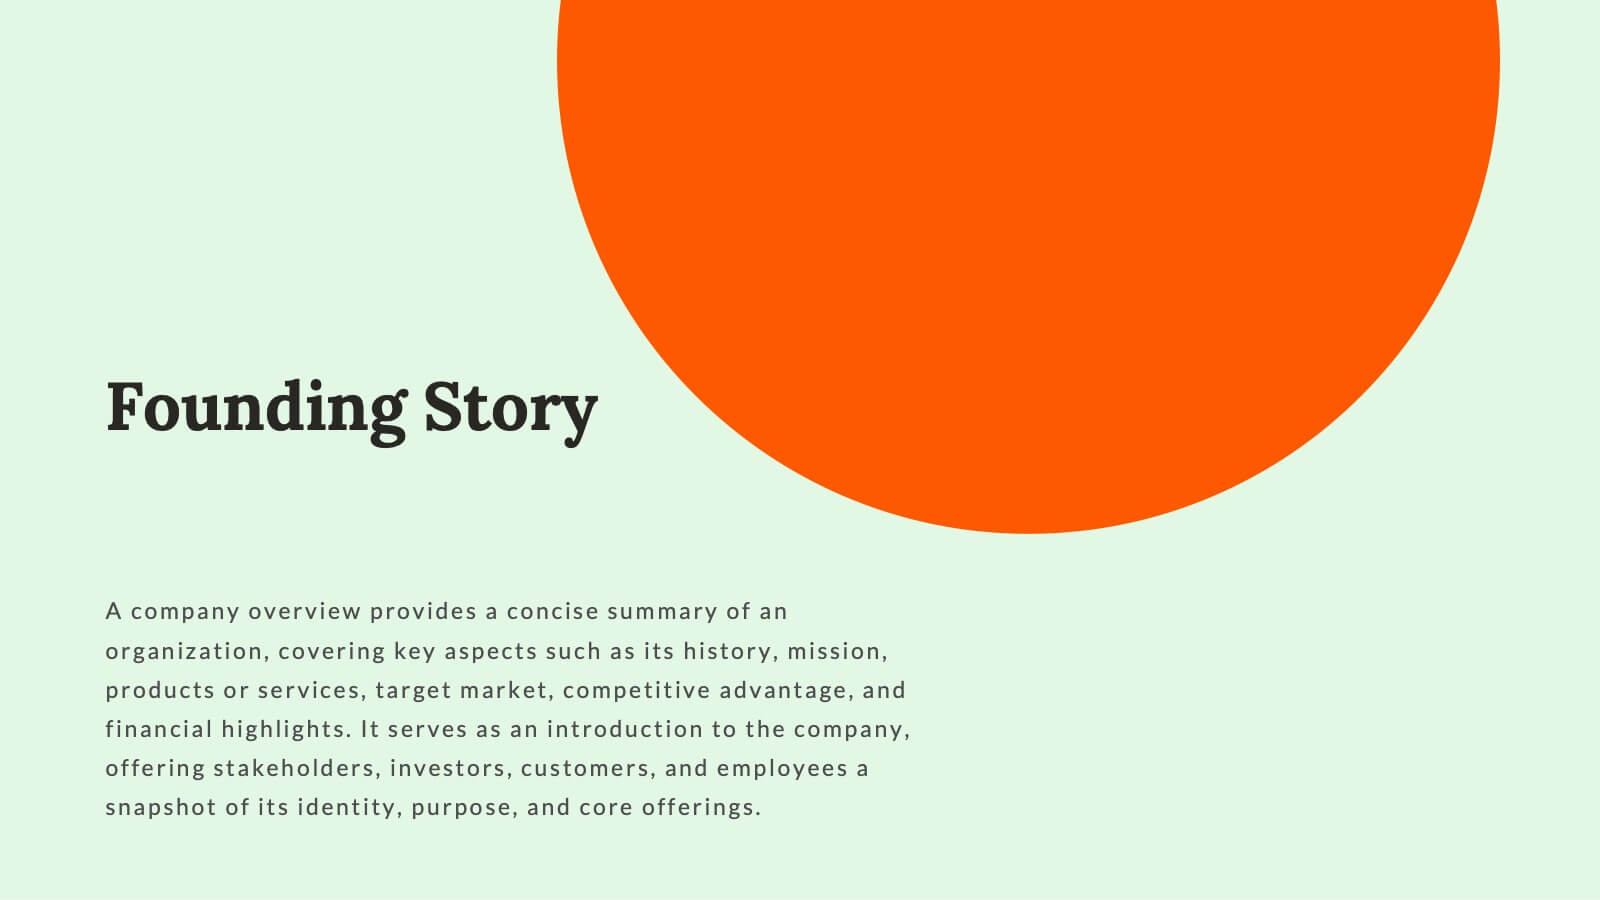
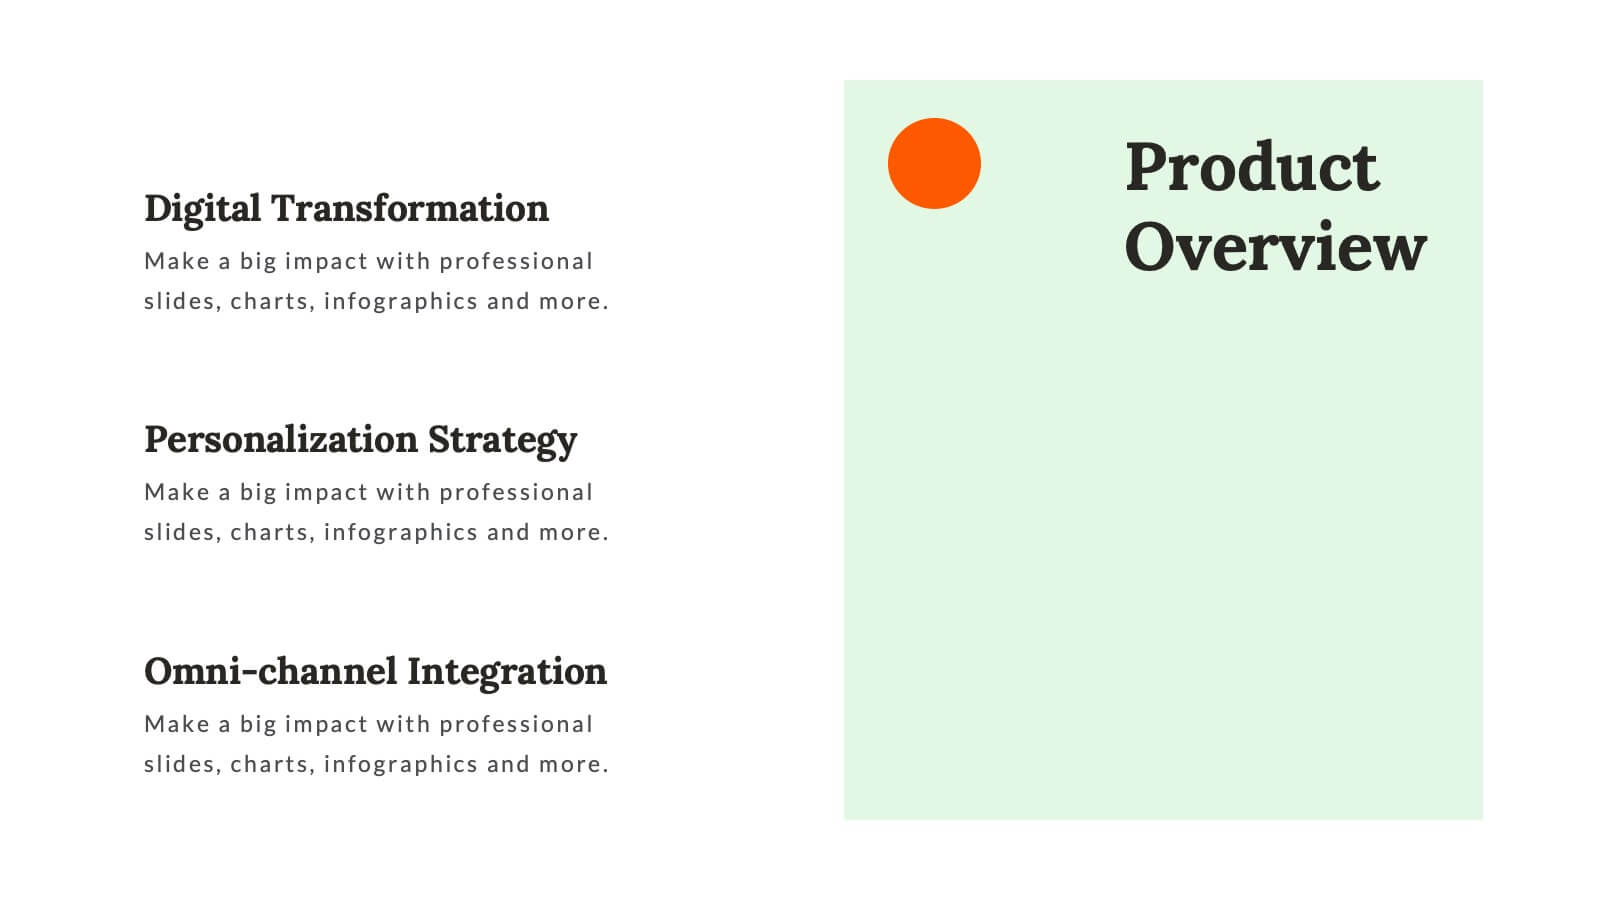
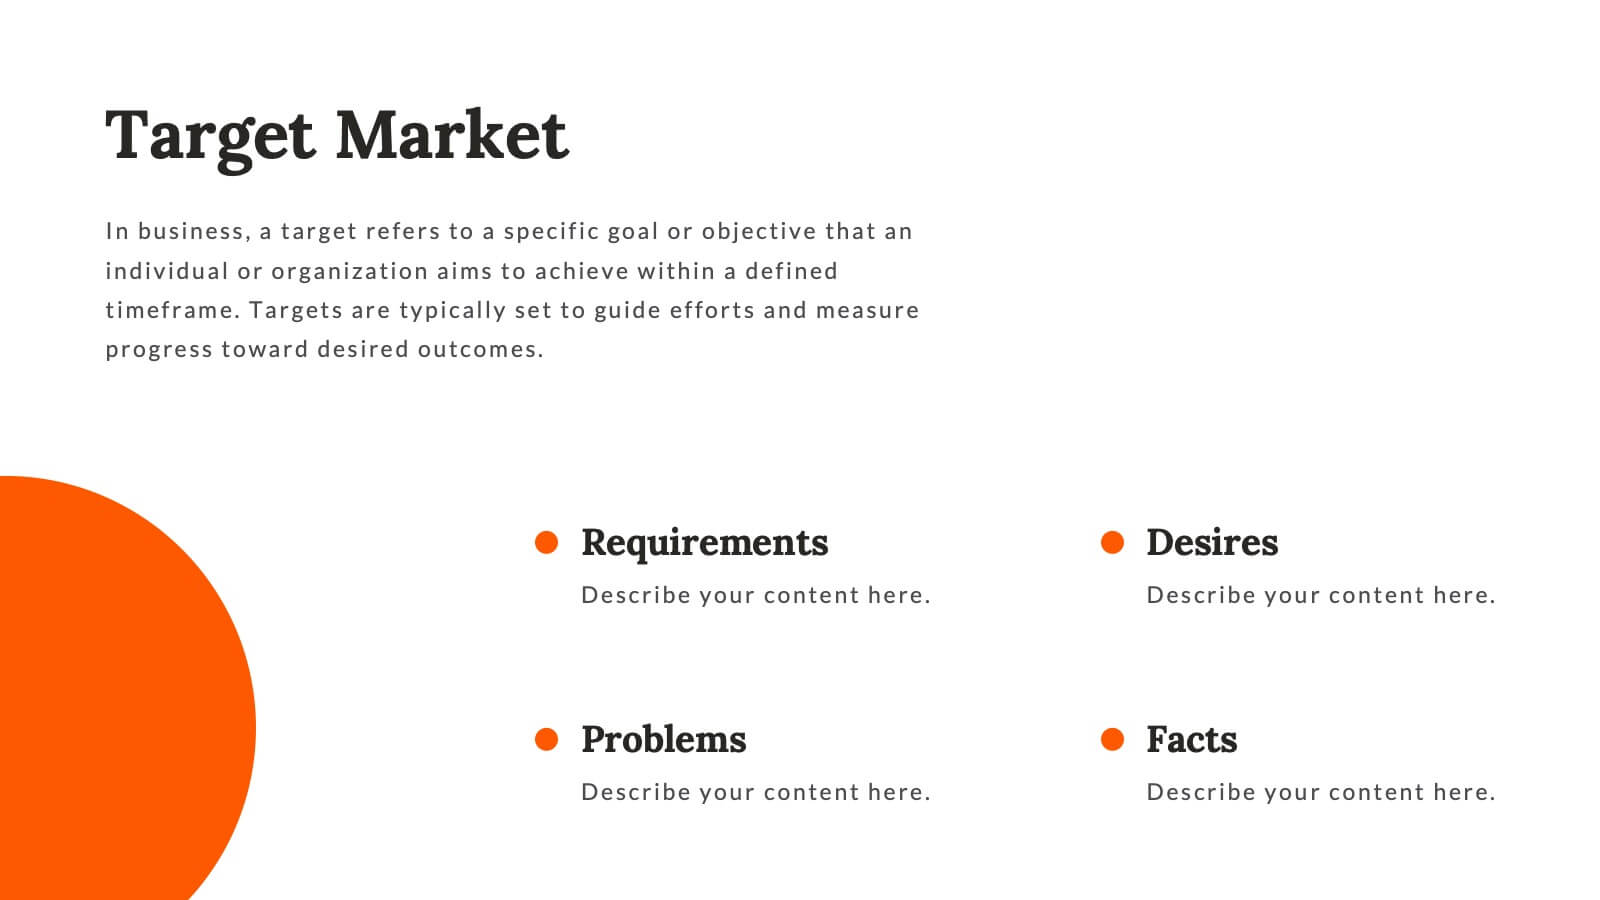
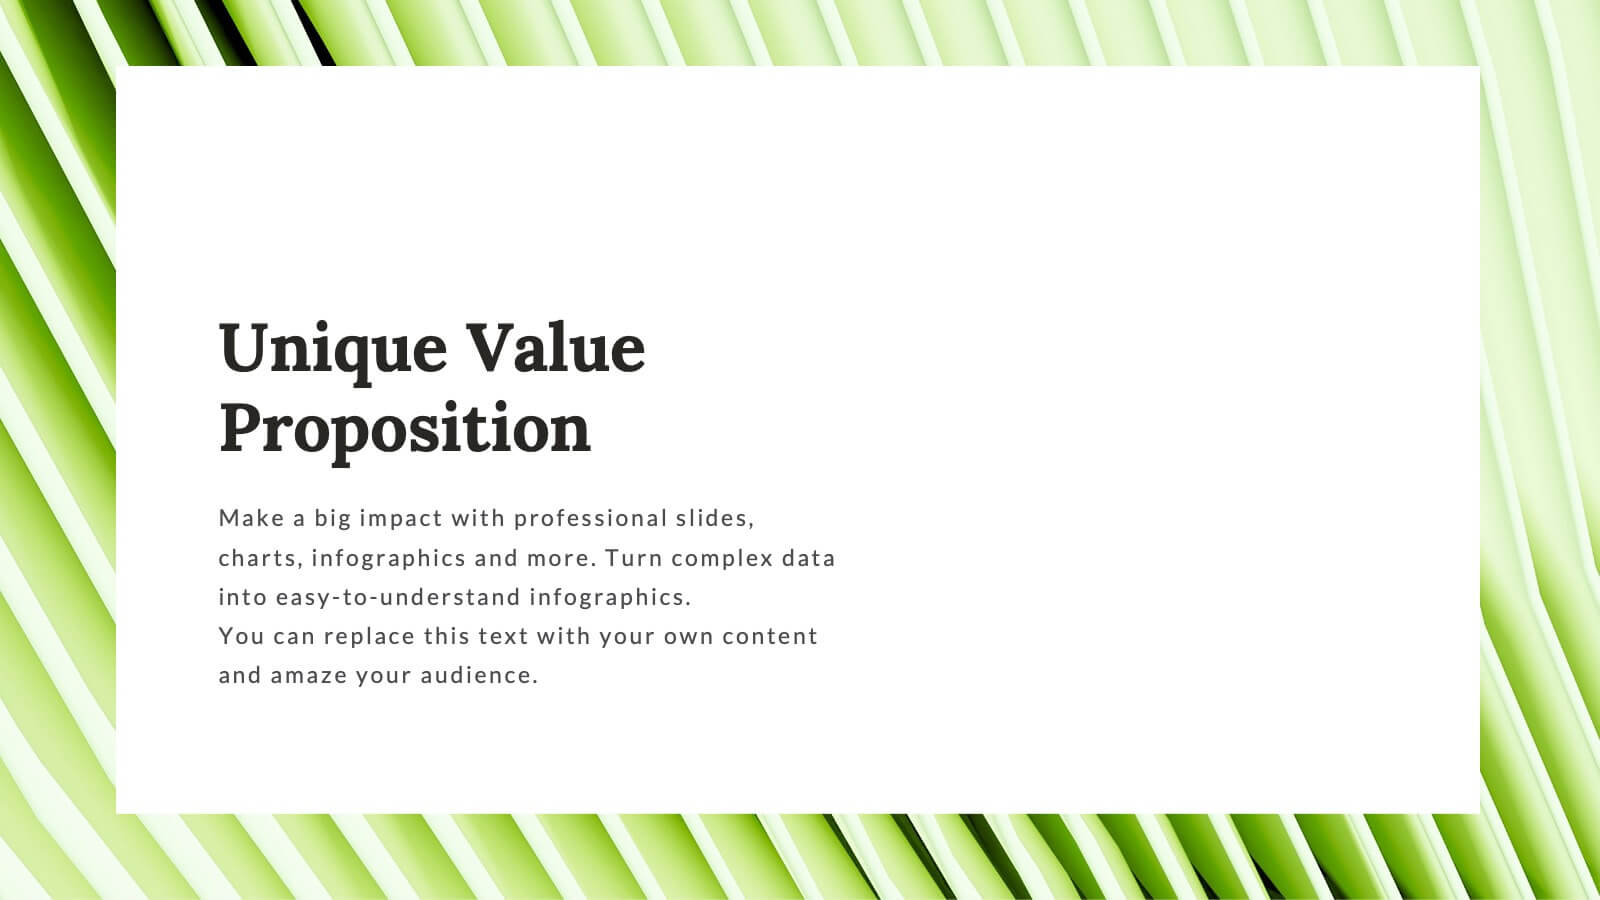
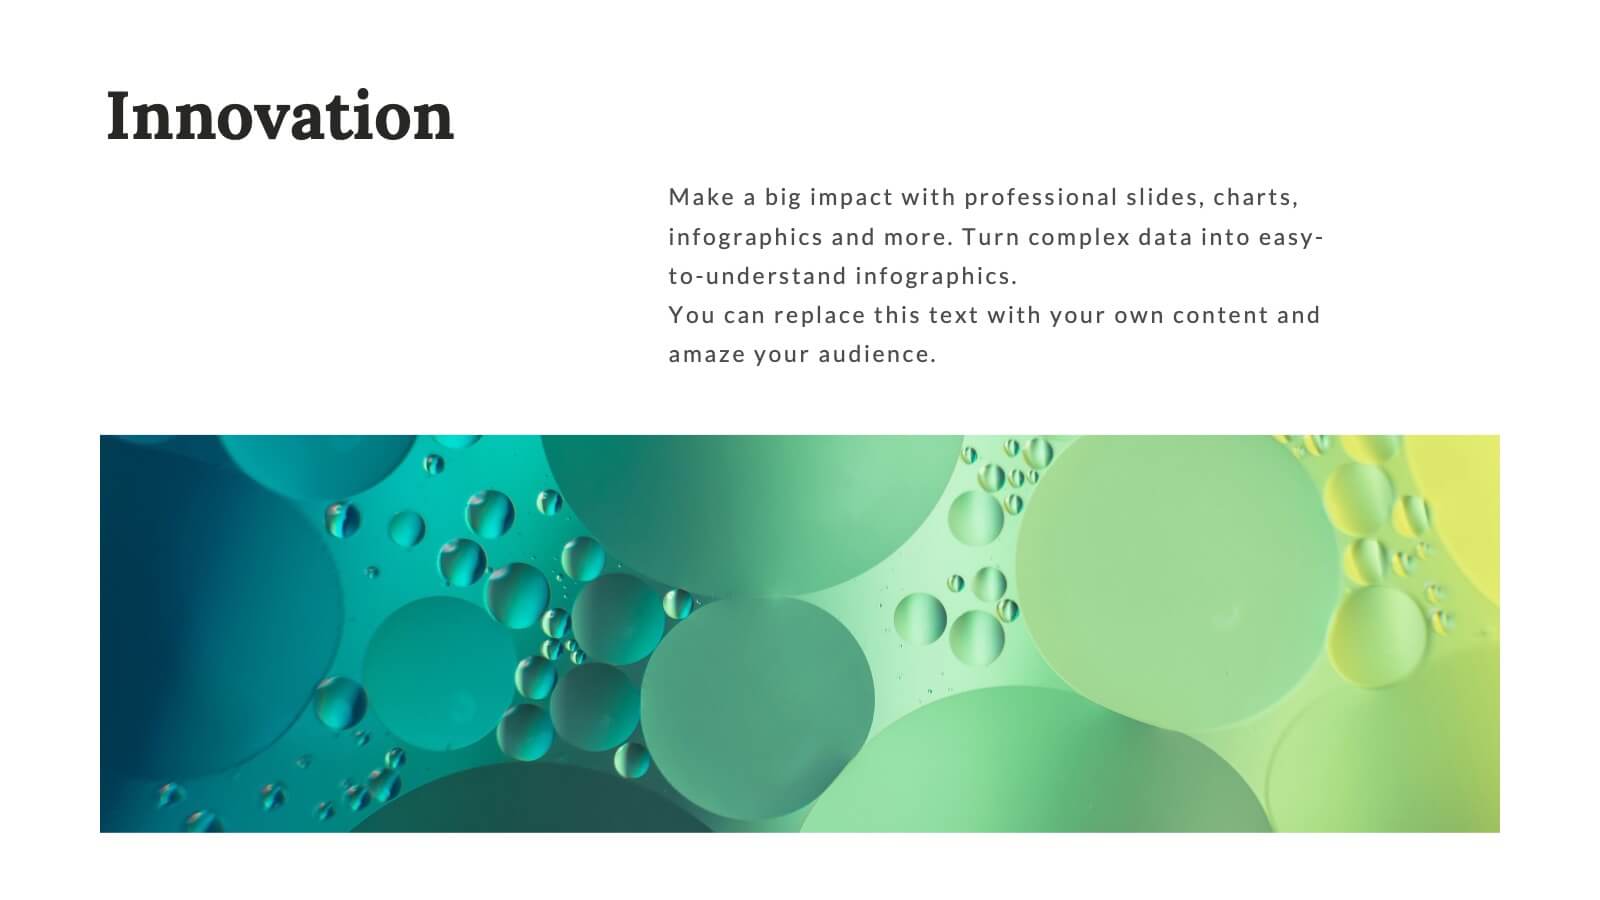
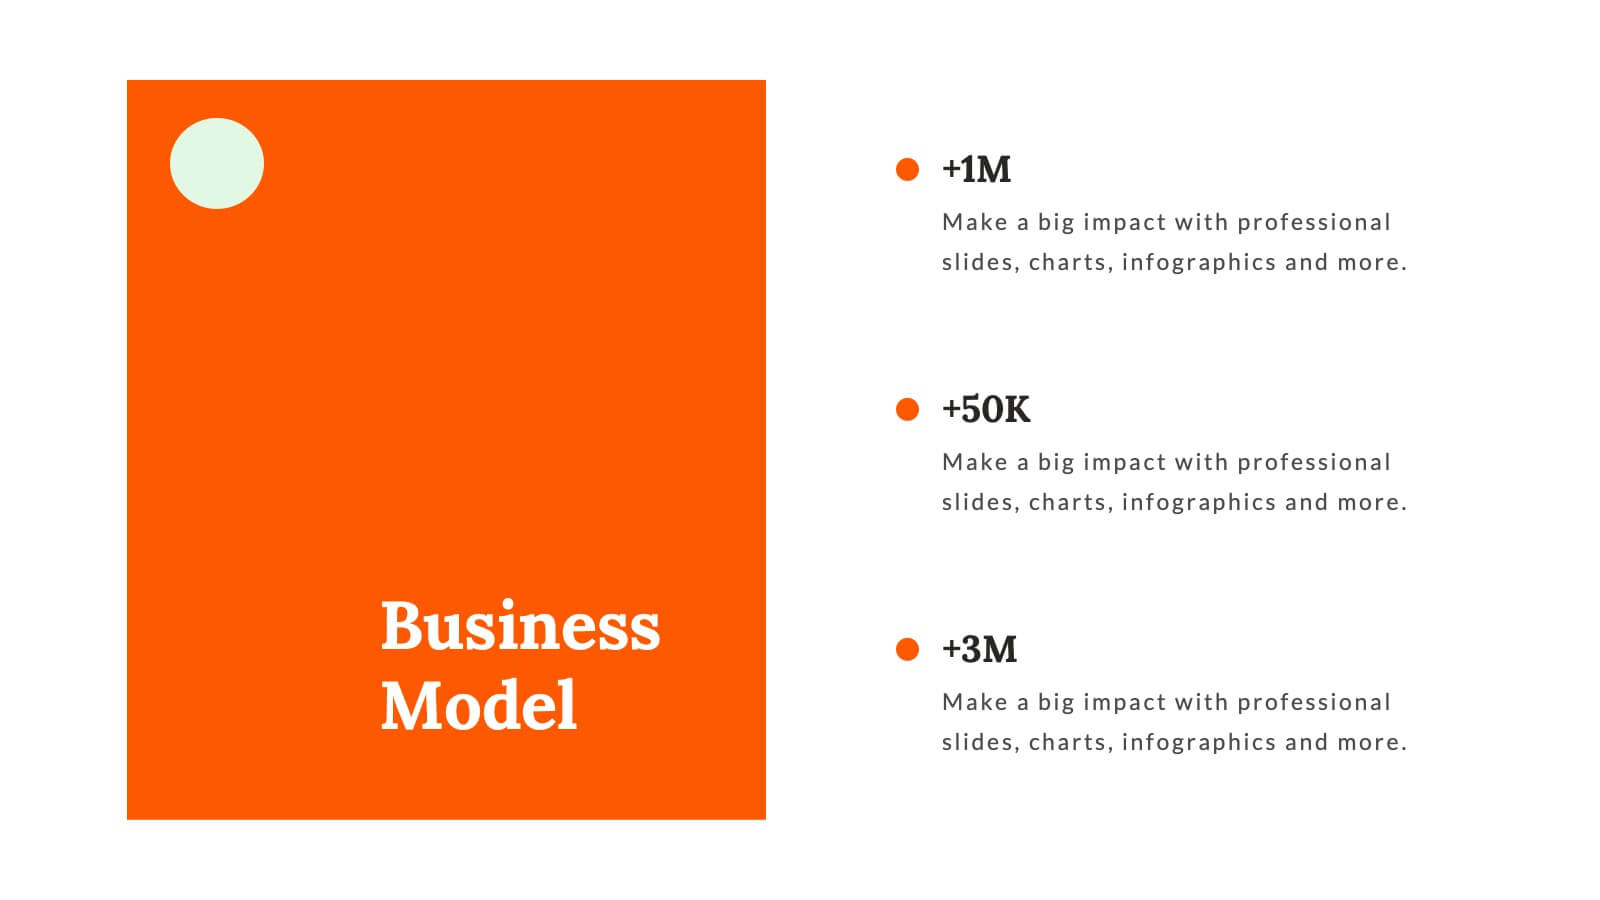
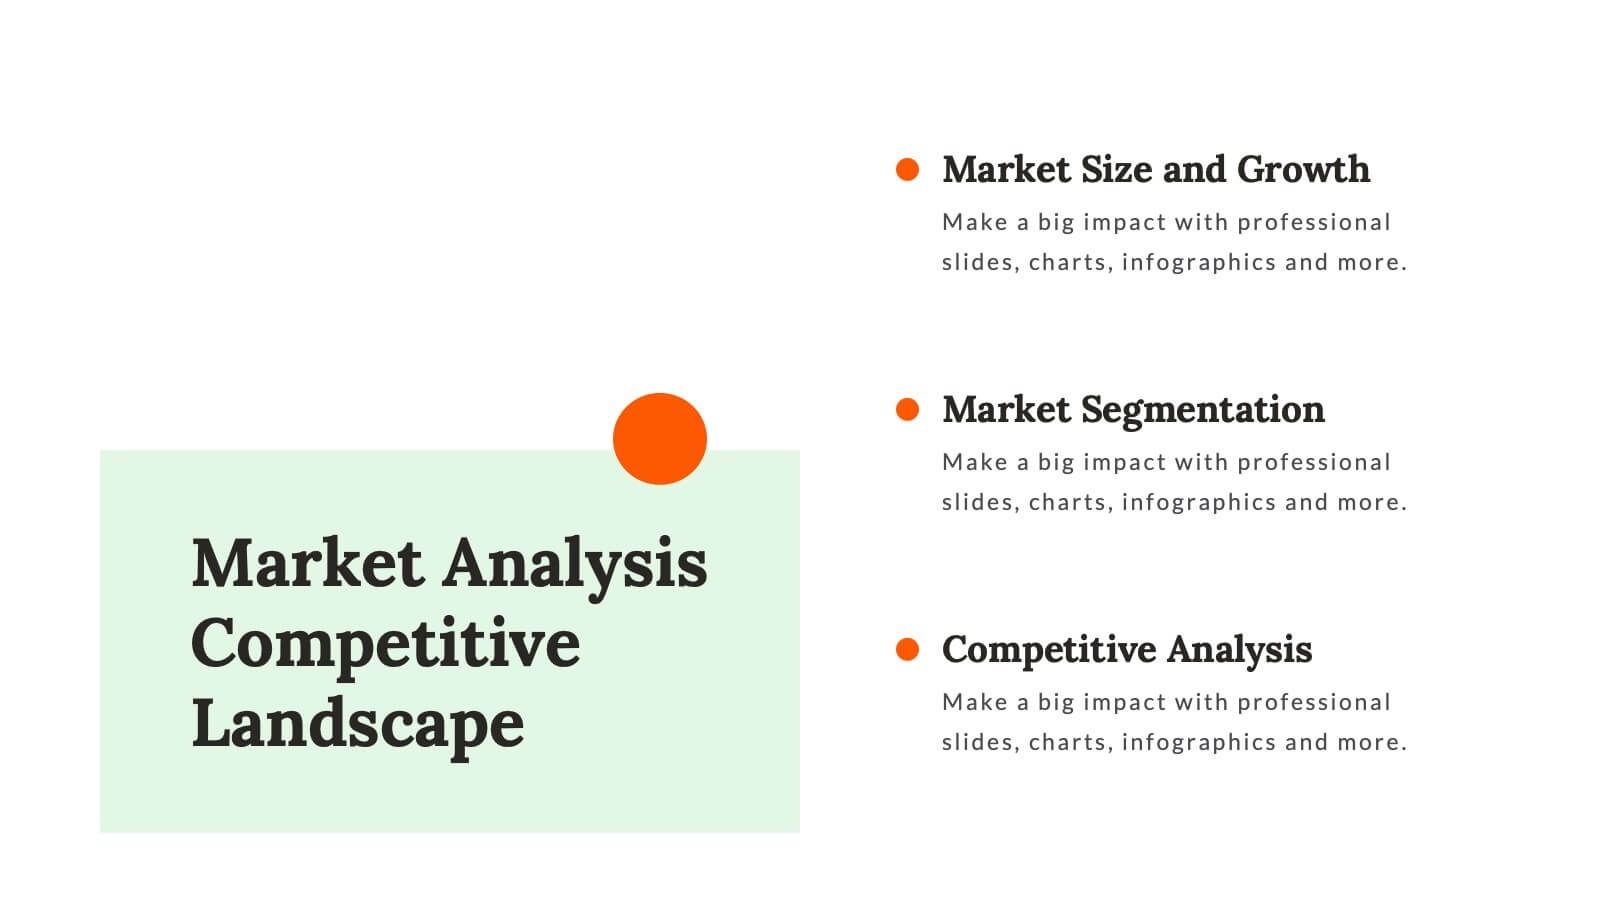
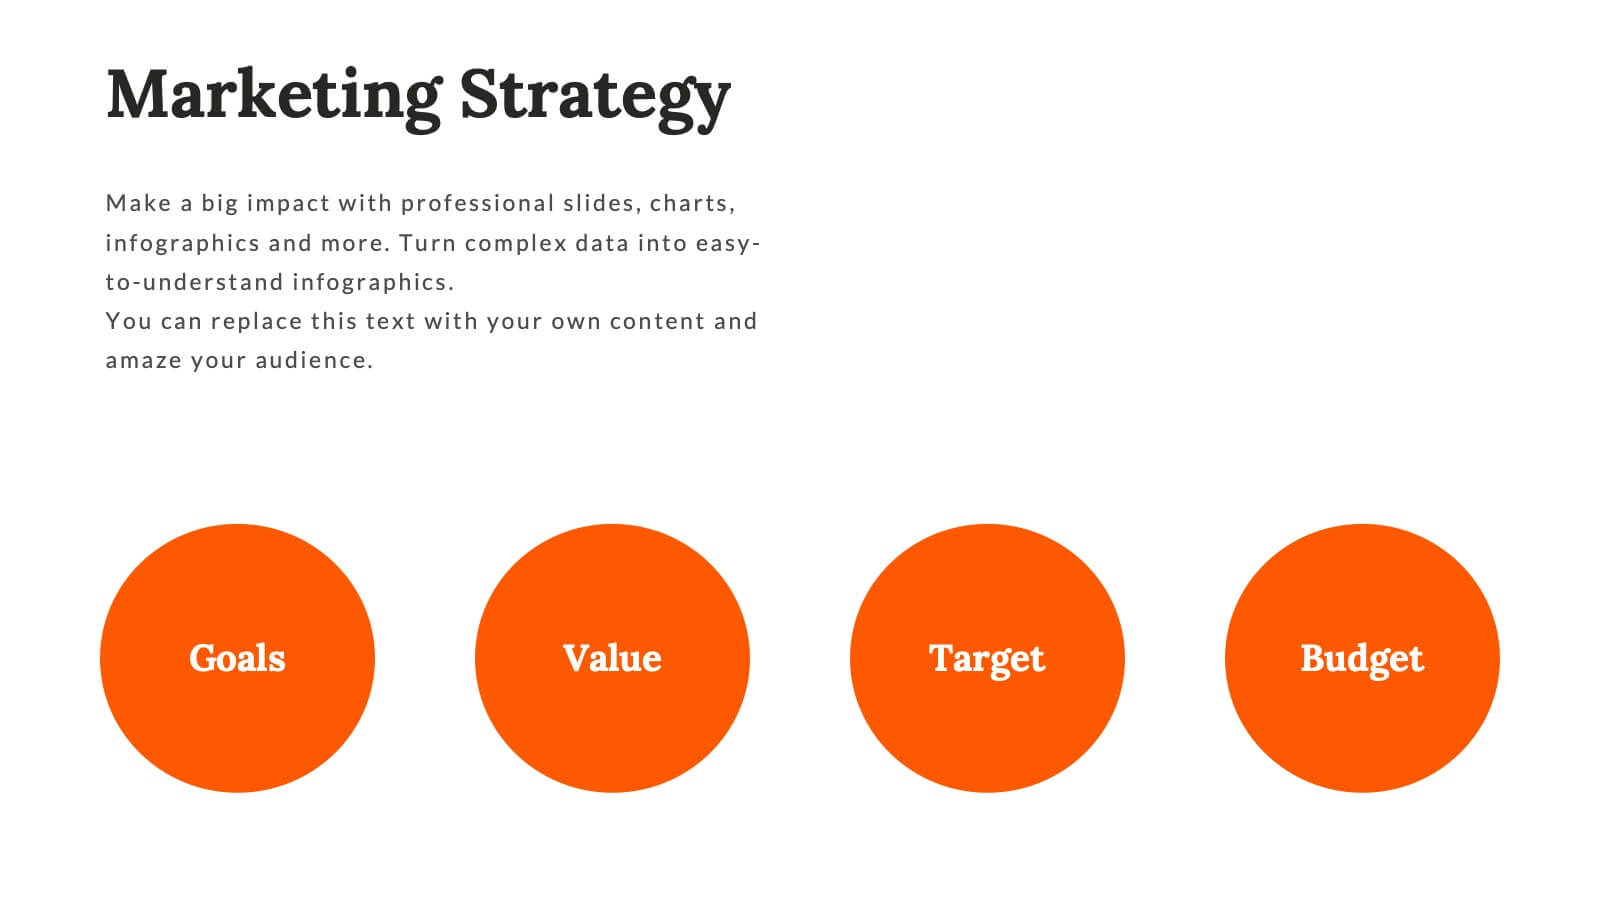
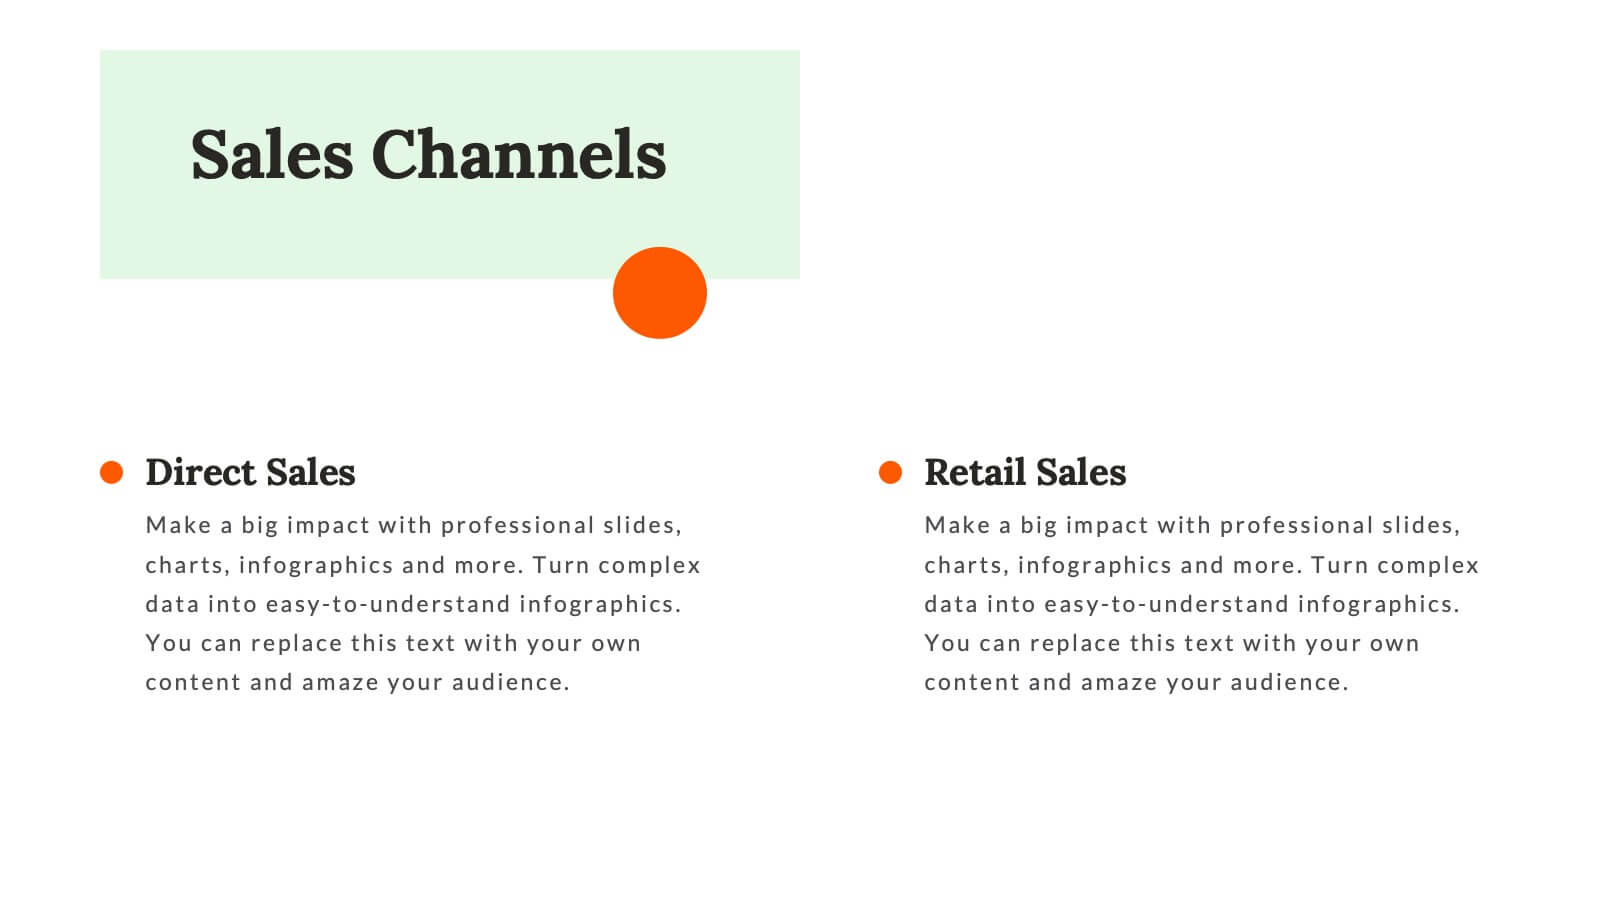
Whirlwind Startup Funding Proposal Presentation
Transform your startup funding proposals with this vibrant and professional template. Designed to impress potential investors, it features sections for mission & vision, founding story, market analysis, and financial overview. Highlight your unique value proposition and business model with clarity and style. This template is compatible with PowerPoint, Keynote, and Google Slides, ensuring seamless presentations on any platform. Perfect for conveying your innovative ideas and growth plans effectively.


6 slides
Europe Regions Infographic
Europe is a diverse continent with various regions that have their own unique characteristics and cultural identities. This infographic provides an overview of the different regions in Europe. It is designed to help viewers understand the diverse geography, culture, and characteristics of each region within Europe. The template features a map of Europe that highlights the various regions. Viewers can easily identify and explore each region on the map. The template includes slides dedicated to providing key information such as capital cities and major landmarks. The template incorporates statistical data to showcase key facts and figures about each region.


21 slides
Flamelore Agile Project Plan Presentation
Organize and deliver your Agile Project Plan seamlessly with this dynamic presentation template. Designed to align with Agile principles, it features a comprehensive structure covering objectives, scope of work, and key deliverables. The template helps you outline a detailed project timeline and budget breakdown to keep stakeholders informed. Illustrate complex information with visual aids such as pyramids, charts, and process diagrams, making data interpretation effortless. Highlight team members, their roles, and responsibilities to foster transparency and accountability. With slides dedicated to risk assessment and evaluation criteria, you can confidently navigate potential challenges. This fully editable template works across PowerPoint, Google Slides, and Keynote, providing flexibility and a polished design for project managers, teams, and business professionals. Whether you're pitching to stakeholders or aligning your team, this Agile framework ensures clear communication and actionable steps.


4 slides
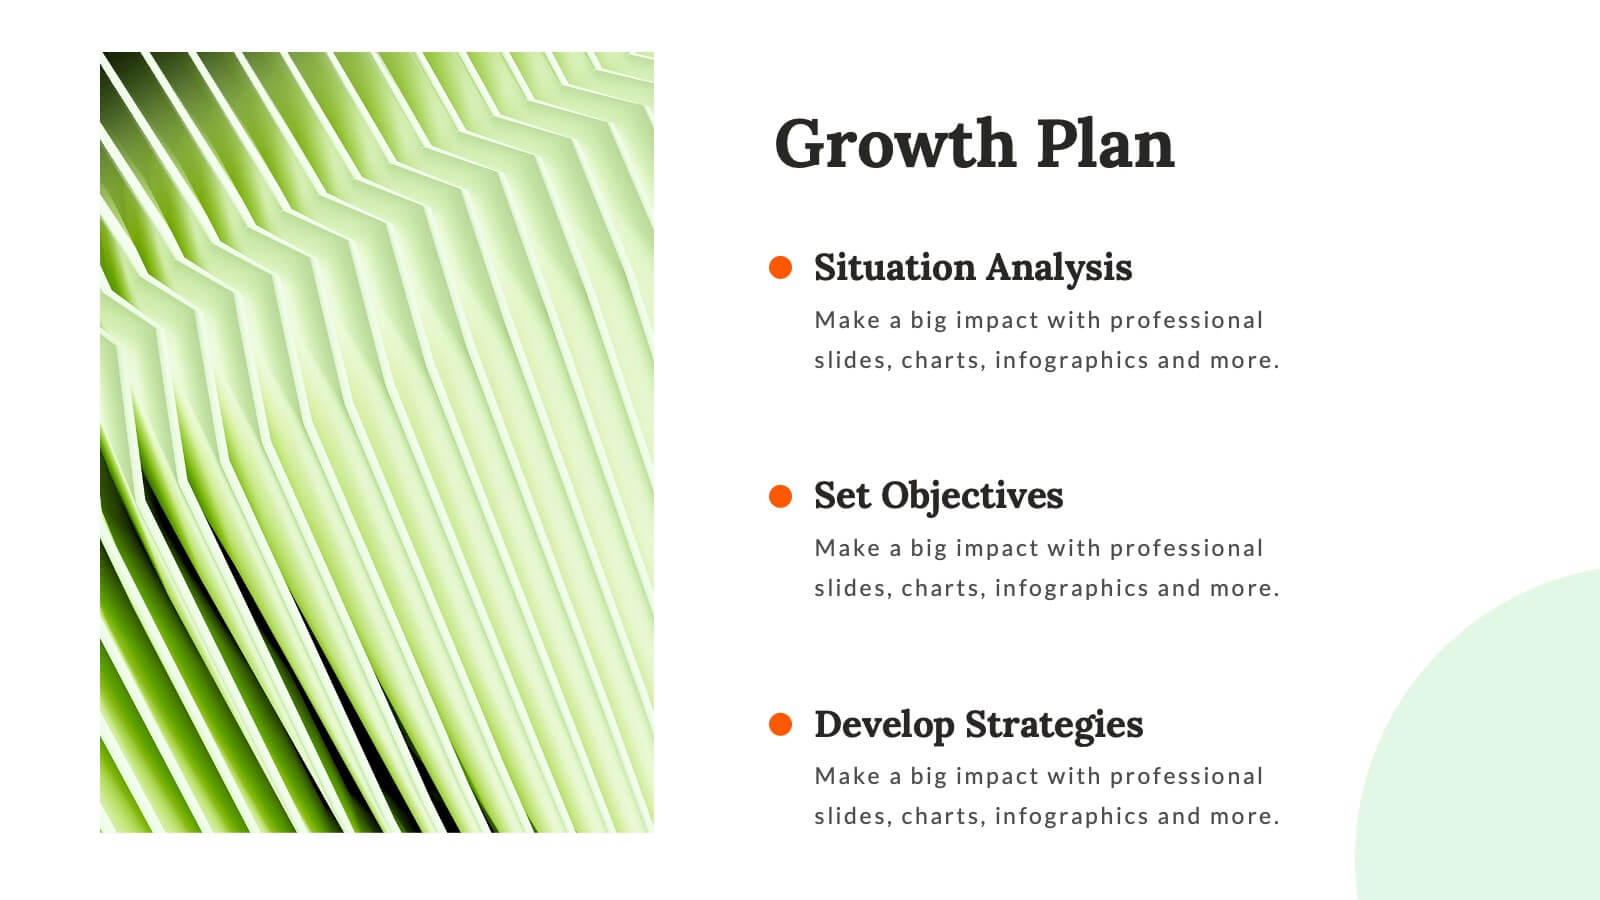
Strategic Business Plan Presentation
Bring your long-term vision to life with a clean, modern presentation that turns complex planning into an easy-to-follow growth path. This layout helps you explain goals, strategies, and key steps with clarity and confidence. Fully editable and compatible with PowerPoint, Keynote, and Google Slides.


8 slides
Employee Training and Development Presentation
Optimize your team's growth with the 'Employee Training and Development' presentation template. This layout strategically organizes training modules, showcasing clear pathways for skills enhancement and career progression. Compatible with PowerPoint, Keynote, and Google Slides, it's ideal for delivering engaging and instructional corporate training sessions.


5 slides
Minimal Watercolor Aesthetic Presentation
Bring a soft artistic touch to your ideas with this clean, watercolor-inspired layout designed for simple, modern storytelling. The slide helps you highlight key points with gentle color accents that feel elegant yet professional, making complex insights easier to follow. Fully compatible with PowerPoint, Keynote, and Google Slides.


26 slides
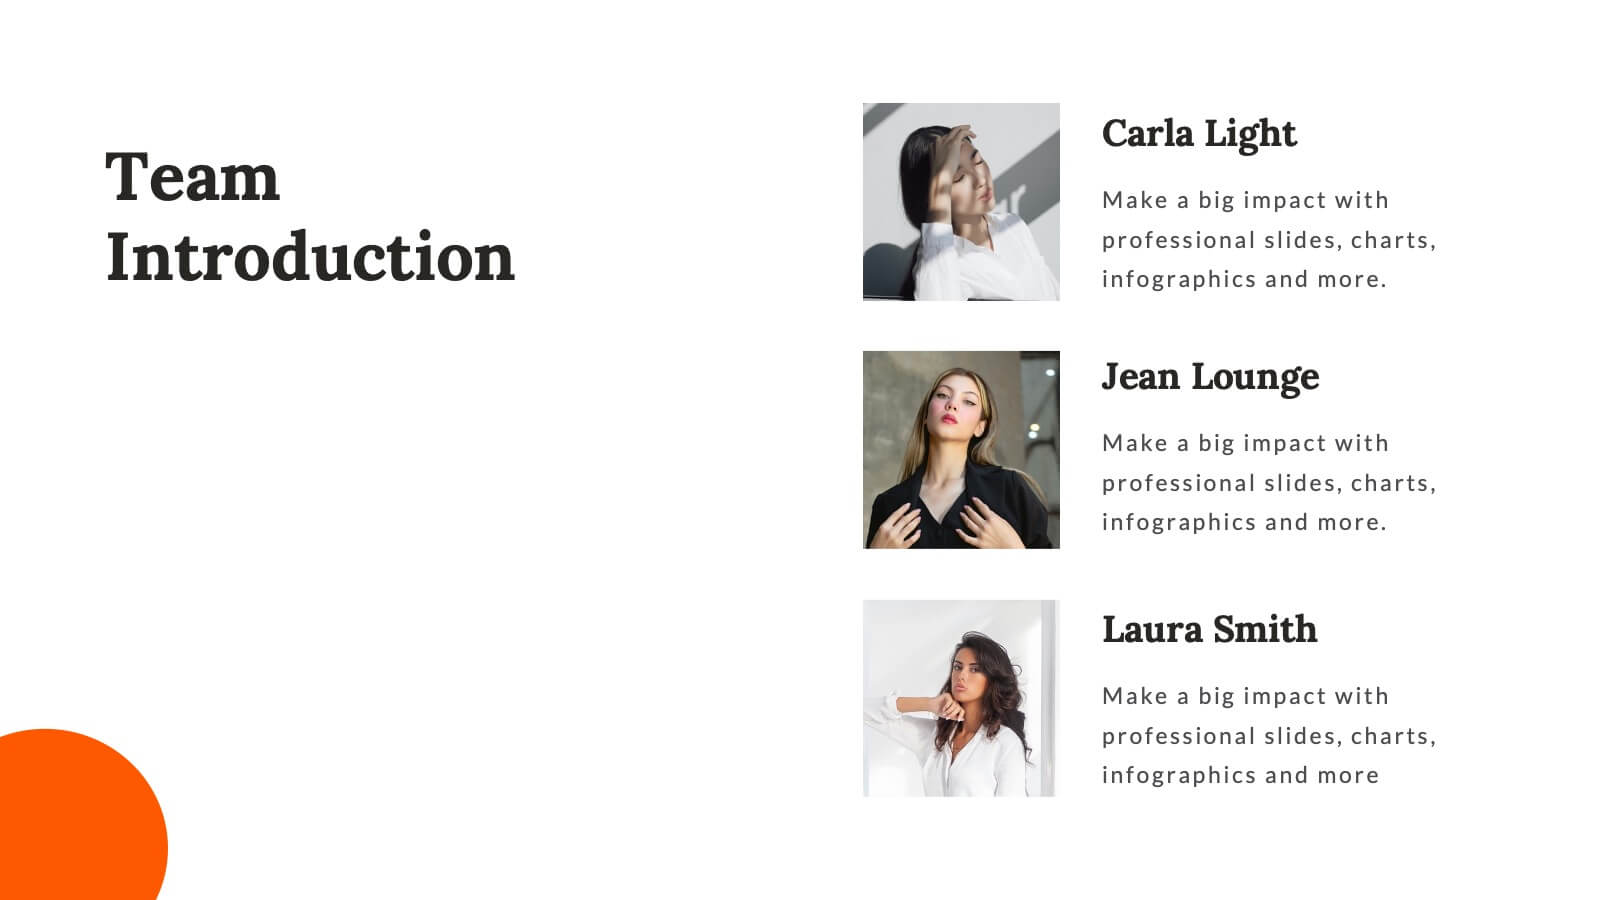
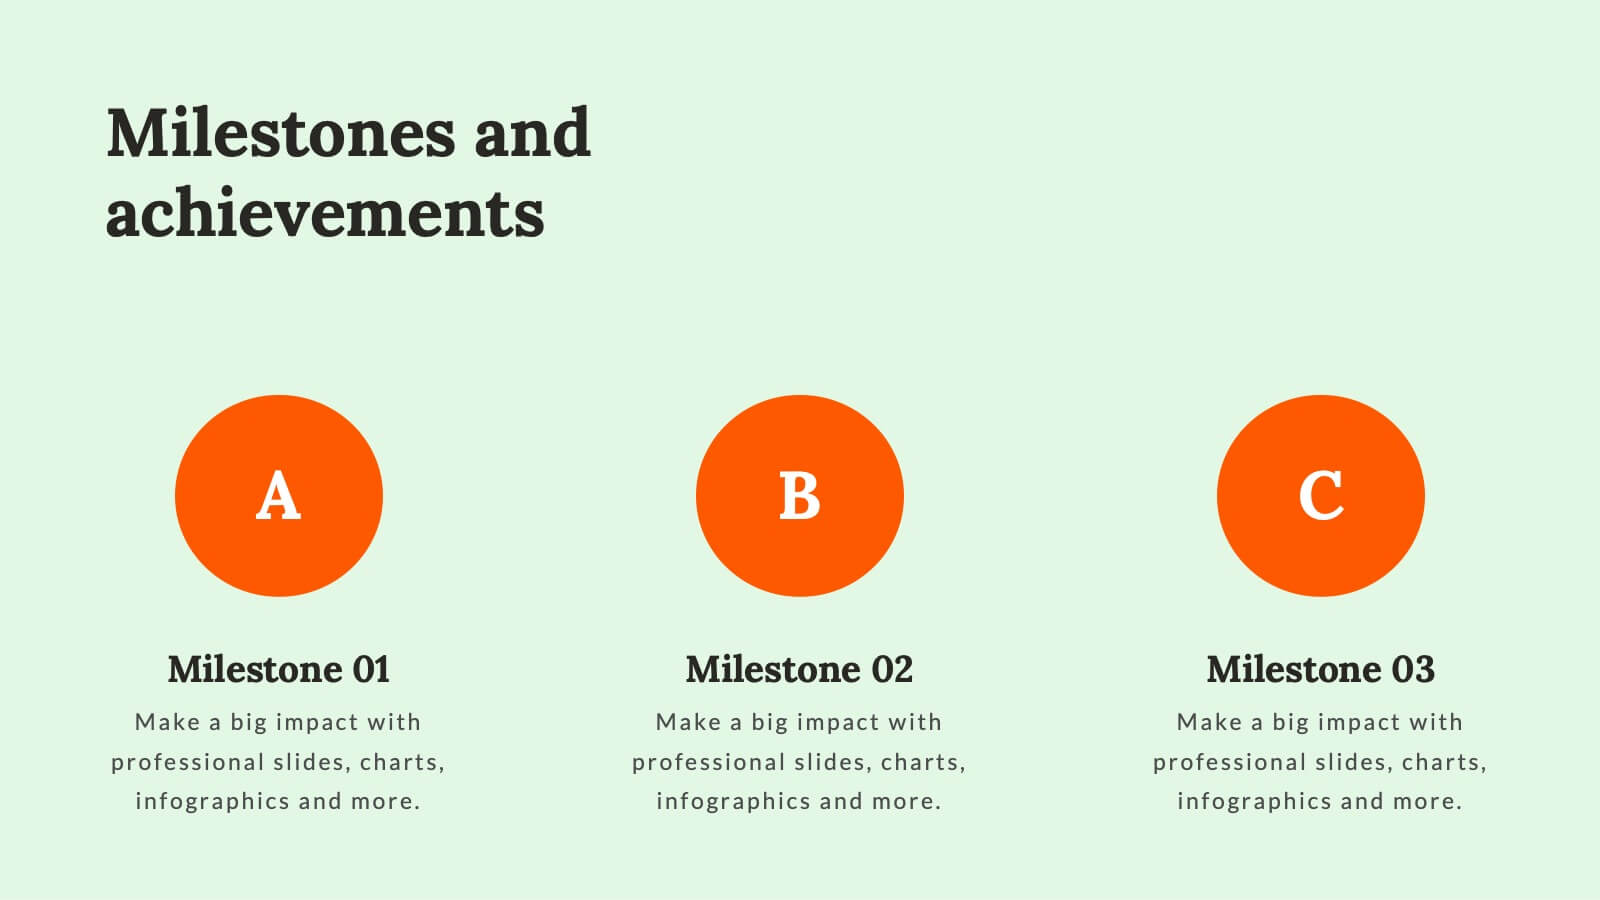
Company Profile and Accomplishments Presentation
A company profile is a document that provides an overview of a business entity. This template serves as a company introduction, presenting essential information about company history, products or services, achievements, goals, and other relevant details. This template showcases the milestones and capabilities of a company. This presentation is perfect for businesses, startups, or organizations looking to highlight their success, growth, and overall expertise in their industry. The clean layout, engaging visuals, and comprehensive information, will help your presentation leave a lasting impression on your audience and enhance your company's reputation.