


Features
- 7 Unique slides
- Fully editable and easy to edit in Microsoft Powerpoint, Keynote and Google Slides
- 16:9 widescreen layout
- Clean and professional designs
- Export to JPG, PDF or send by email


Do you have any questions?
Recommend


6 slides
Competitive Research and Strategy Review Presentation
Present your market insights with clarity using the Competitive Research and Strategy Review Presentation. This puzzle-style layout is ideal for showing strategic steps or comparing research points in sequence. Fully editable in Canva, PowerPoint, Keynote, and Google Slides, it’s perfect for marketing teams, business analysts, and strategy consultants.


26 slides
Creative Programming Presentation
The process of Developing Software involves the development of everything from a simple application or web page to complex enterprise systems. Software development is a collaborative effort between developers, designers, and other stakeholders. This Creative Template is perfect for delivering presentations about the latest projects, apps and ideas. The simple layout allows you to focus on what matters most, your idea. Make your most important presentation spectacular with this template. With high-powered visual content and a smooth flow, you’ll keep your audience engaged from beginning to end!


5 slides
Customer Conversion with AIDA Framework
Present your sales strategy effectively with the Customer Conversion with AIDA Framework Presentation. This template breaks down the four key stages—Attention, Interest, Desire, and Action—into a clear and visually engaging funnel design. Perfect for marketing professionals, sales teams, and business strategists. Fully editable in PowerPoint, Keynote, and Google Slides.


21 slides
Minoan Project Timeline Presentation
Step back in time with this beautifully crafted Minoan-inspired presentation, perfect for outlining your project timeline! With an elegant design and clear structure, this template helps you showcase key milestones, deadlines, and deliverables in a visually stunning way. Keep your project on track. Compatible with PowerPoint, Keynote, and Google Slides.


2 slides
Elegant Title Slide Design Presentation
Dress your presentation in sophistication with the "Elegant Title Slide," where simplicity meets style. This template elegantly frames your opening remarks in a polished and refined layout, highlighted by a chic, contemporary office backdrop. Perfect for any business aiming to impress, it's fully compatible with PowerPoint, Keynote, and Google Slides. Elevate your presentation game with this seamlessly designed slide.


6 slides
Risk Evaluation and Mitigation Plan Presentation
Take control of uncertainty with a clean, visual layout that helps you assess potential challenges and map out clear solutions. Ideal for project planning, operations, or corporate risk management, this presentation simplifies complex data into actionable insights. Compatible with PowerPoint, Keynote, and Google Slides for easy customization.


4 slides
Meeting Agenda Slide Presentation
Start your presentation with structure and clarity using this sleek, professional layout designed to outline key discussion points with style. Perfect for business meetings, workshops, or team updates, it keeps information clear and visually balanced. Fully compatible with PowerPoint, Keynote, and Google Slides for effortless editing and customization.
5 slides
Team Achievements and Output Tracking Presentation
Celebrate success and monitor progress with the Team Achievements and Output Tracking presentation template. Designed with visual medal icons and color-coded team figures, this layout is perfect for highlighting milestones, recognizing contributors, and tracking output performance. Fully editable and compatible with PowerPoint, Keynote, and Google Slides.


3 slides
Process Mapping with Tree Diagram Presentation
Optimize Your Workflow! The Process Mapping with Tree Diagram Presentation simplifies complex processes, illustrating decision paths and workflows in a clear, structured format. Perfect for business strategy, operations, and project planning, this fully editable template enhances understanding and efficiency. Compatible with PowerPoint, Keynote, and Google Slides, ensuring seamless customization.


5 slides
The Problem of Food Waste Infographics
Food Waste refers to any food that is discarded or lost along the food supply chain, from production to consumption. These vertical infographics are designed to cover the problem of food waste and can be designed to highlight statistics and facts about the issue. This infographic can be used to show how much food is wasted annually and the negative impact that this waste has on the environment. In the text boxes provide tips for reducing food waste, such as buying only what you need, storing food properly, and using leftovers creatively. Included are engaging visuals, such as icons and illustrations, and a clear layout.


8 slides
Data-Driven Market Segmentation
Visualize customer insights with clarity using the Data-Driven Market Segmentation Presentation. This dynamic circular infographic displays four key segments, each with percentage labels and curved connectors pointing to detailed descriptions. Ideal for marketing analysts, product strategists, or data-driven teams aiming to present behavioral, demographic, or purchasing trends. The sleek, radial layout makes comparisons intuitive and engaging. Fully editable in PowerPoint, Keynote, and Google Slides—customize colors, icons, and data points to match your brand and message.


20 slides
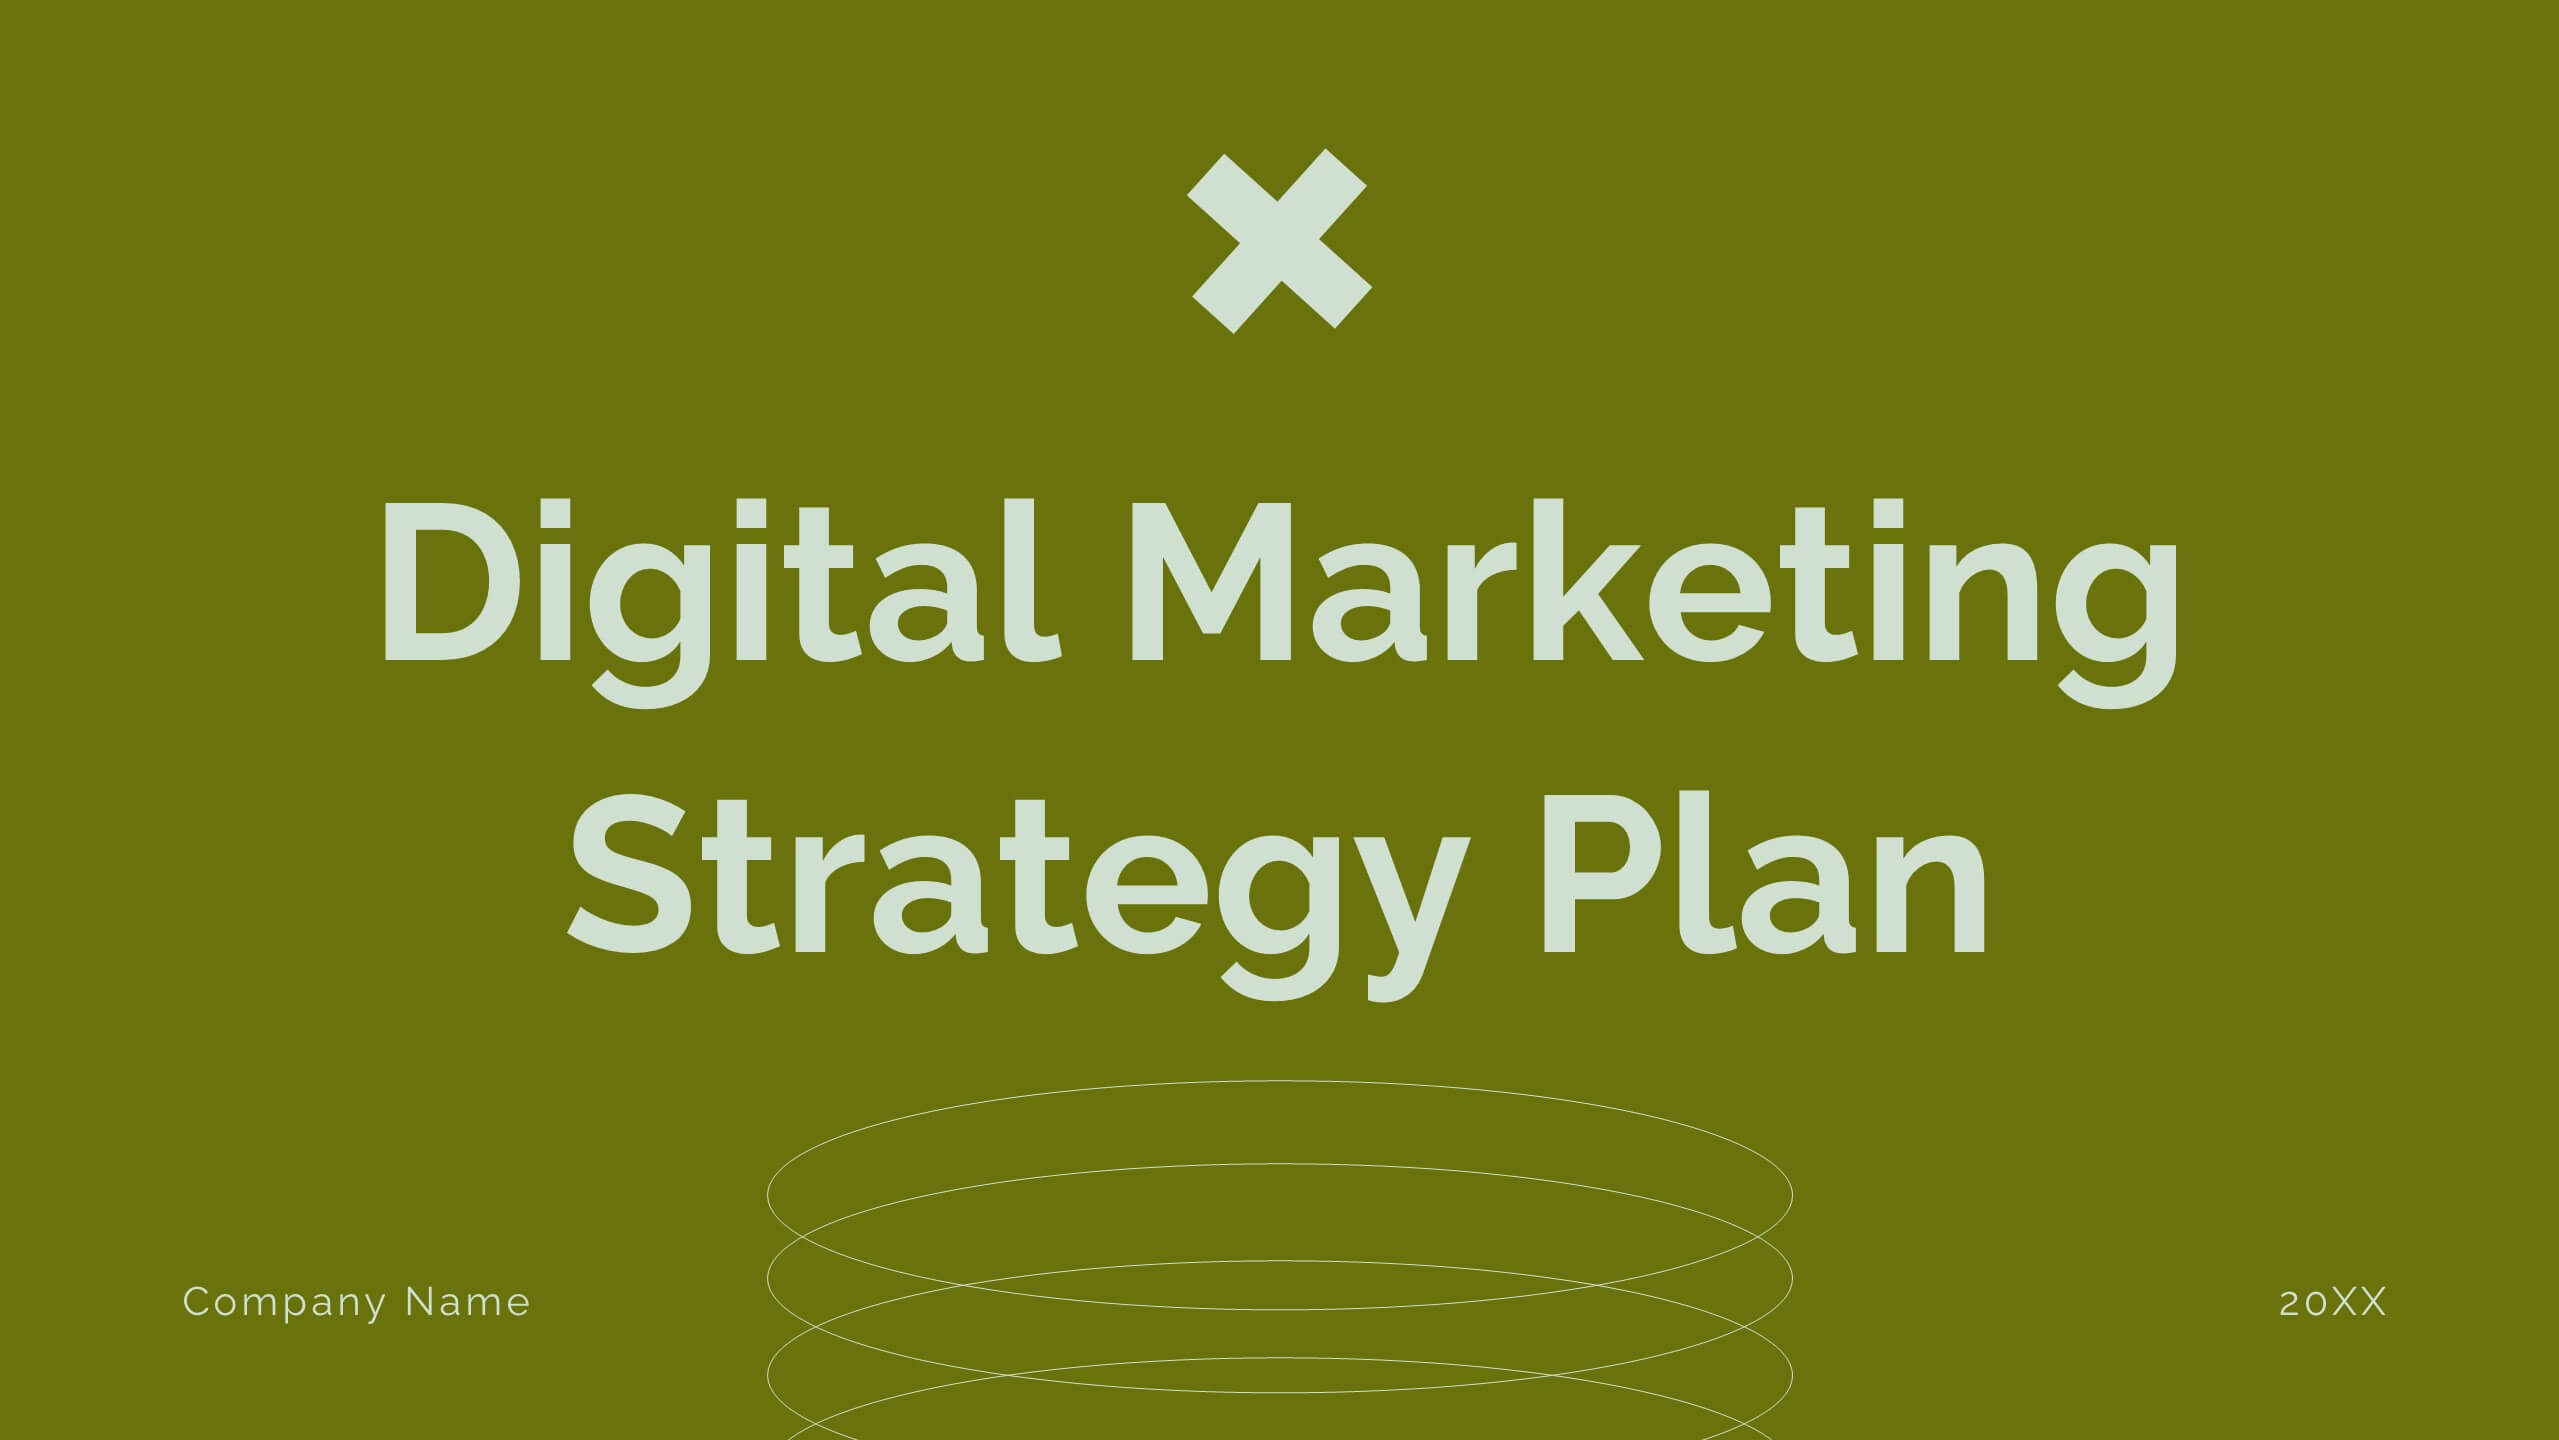
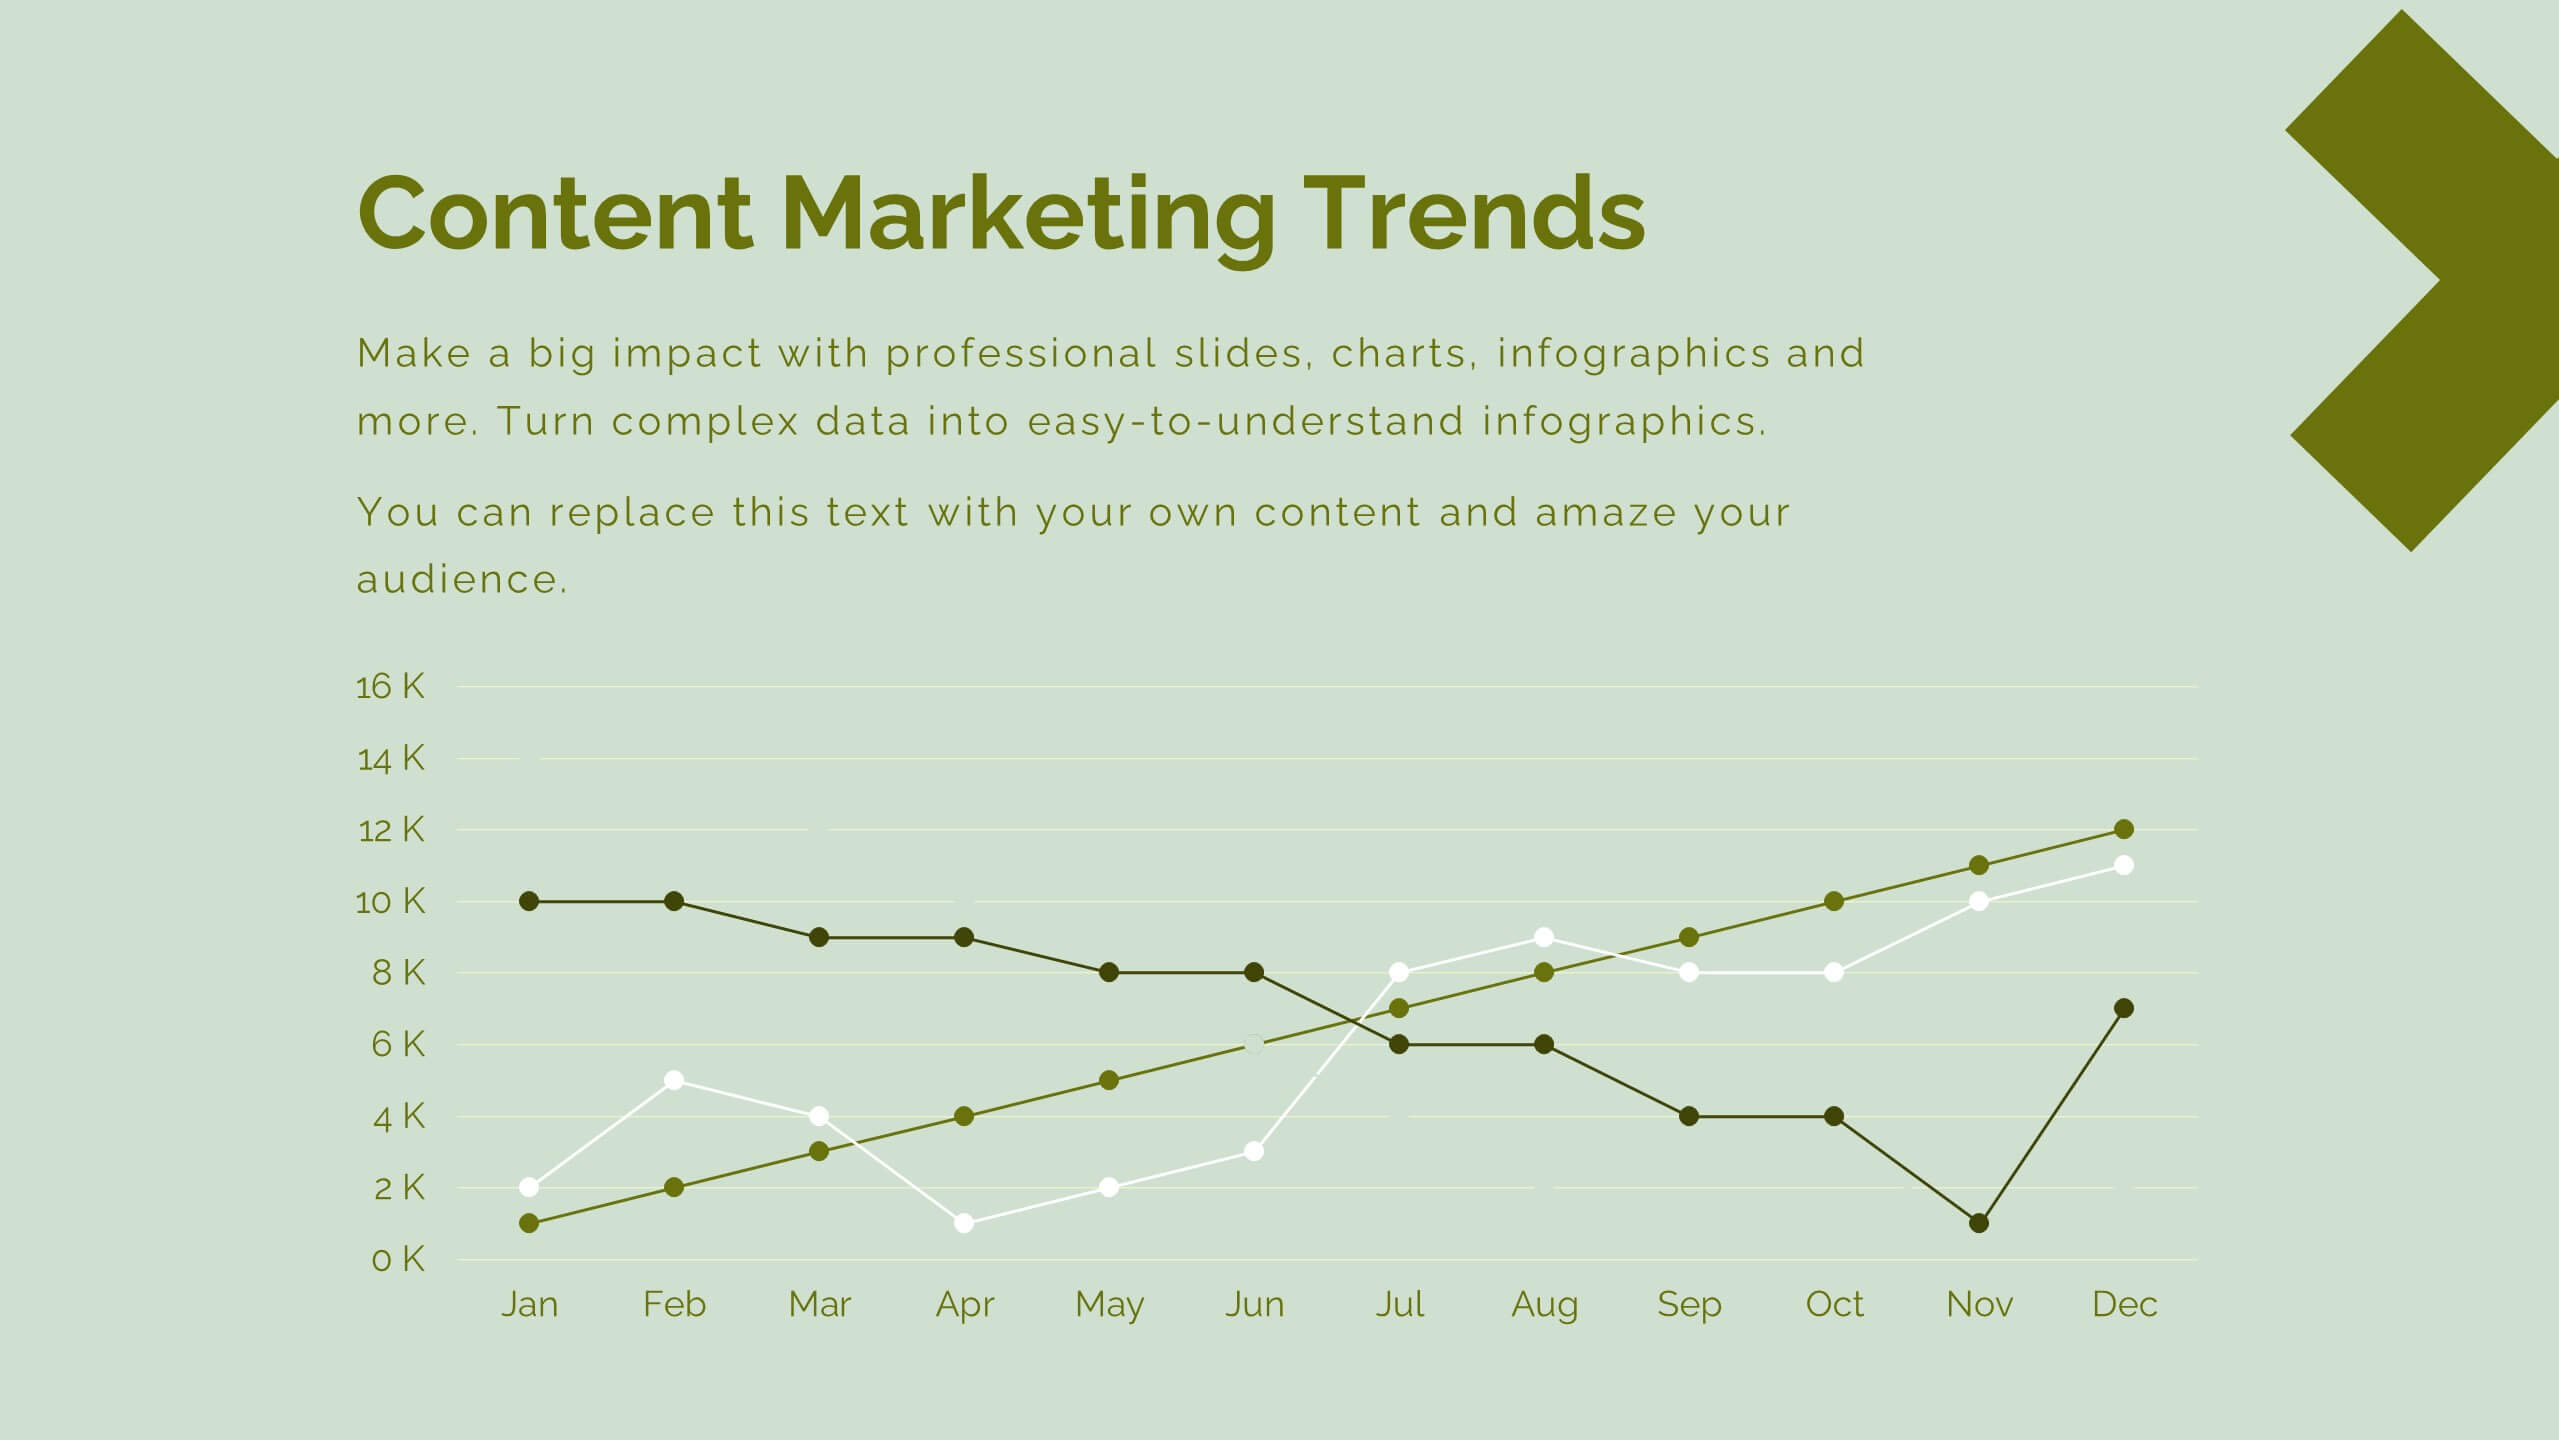
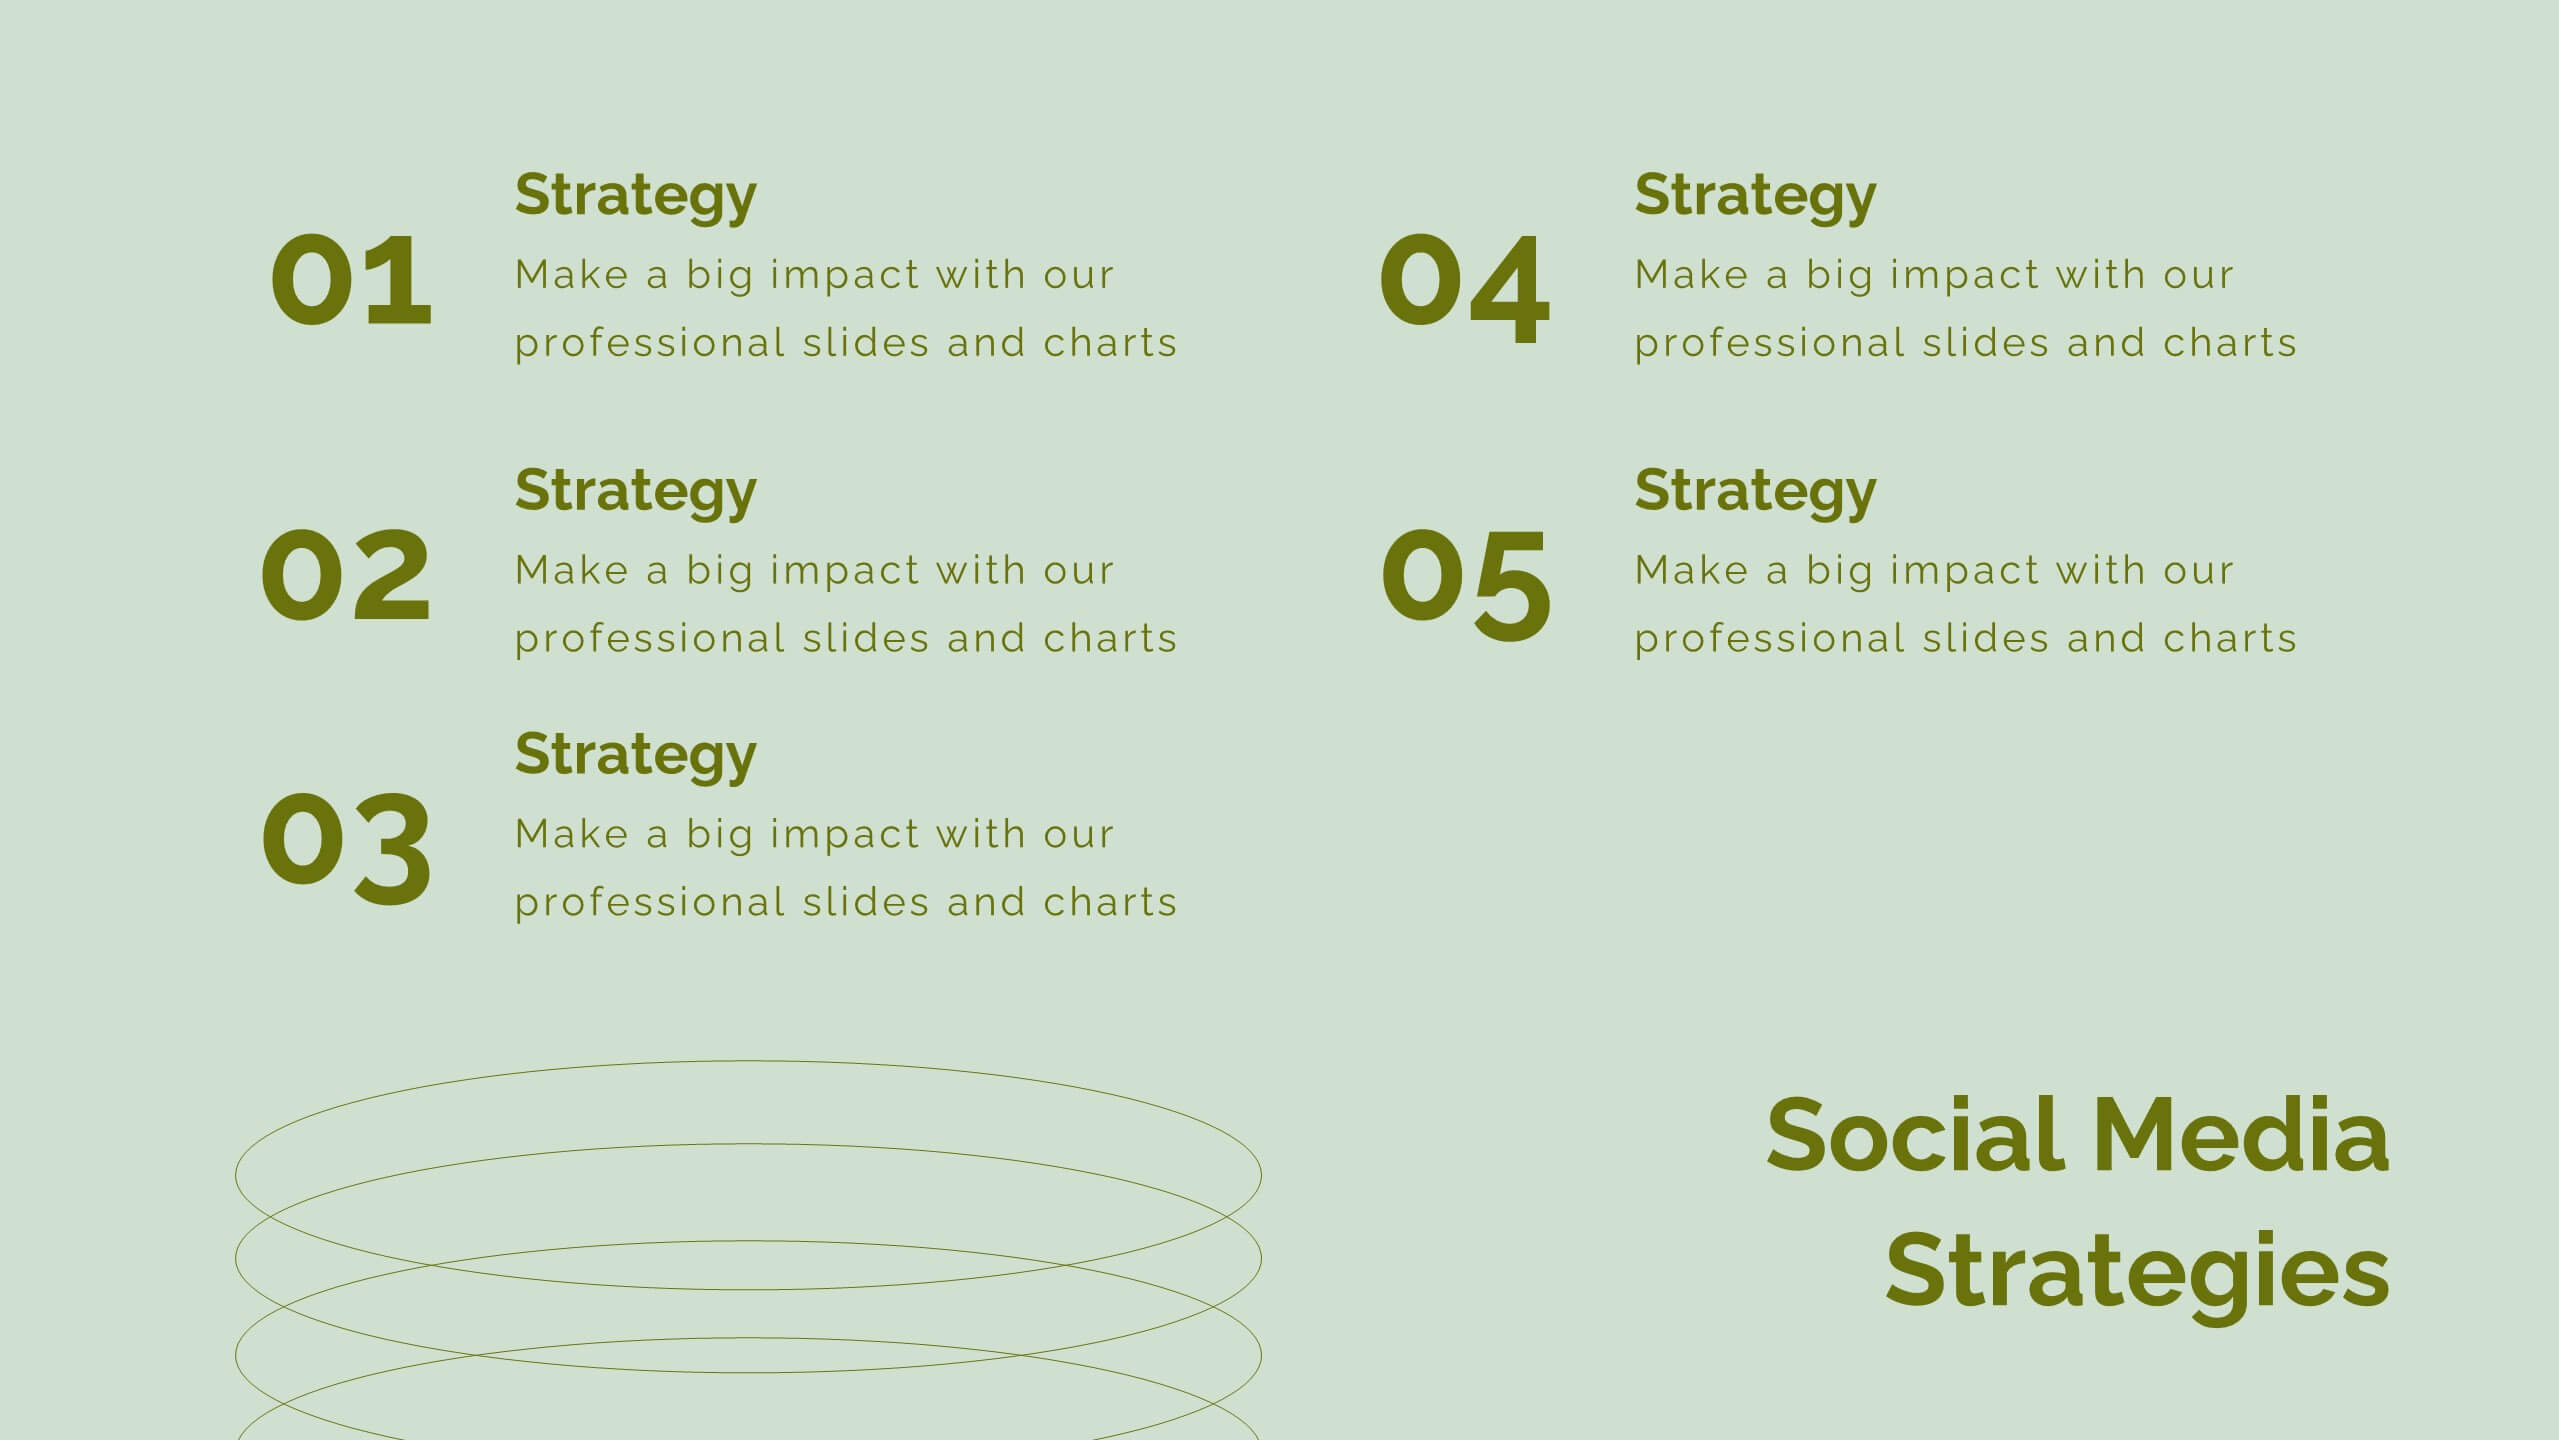
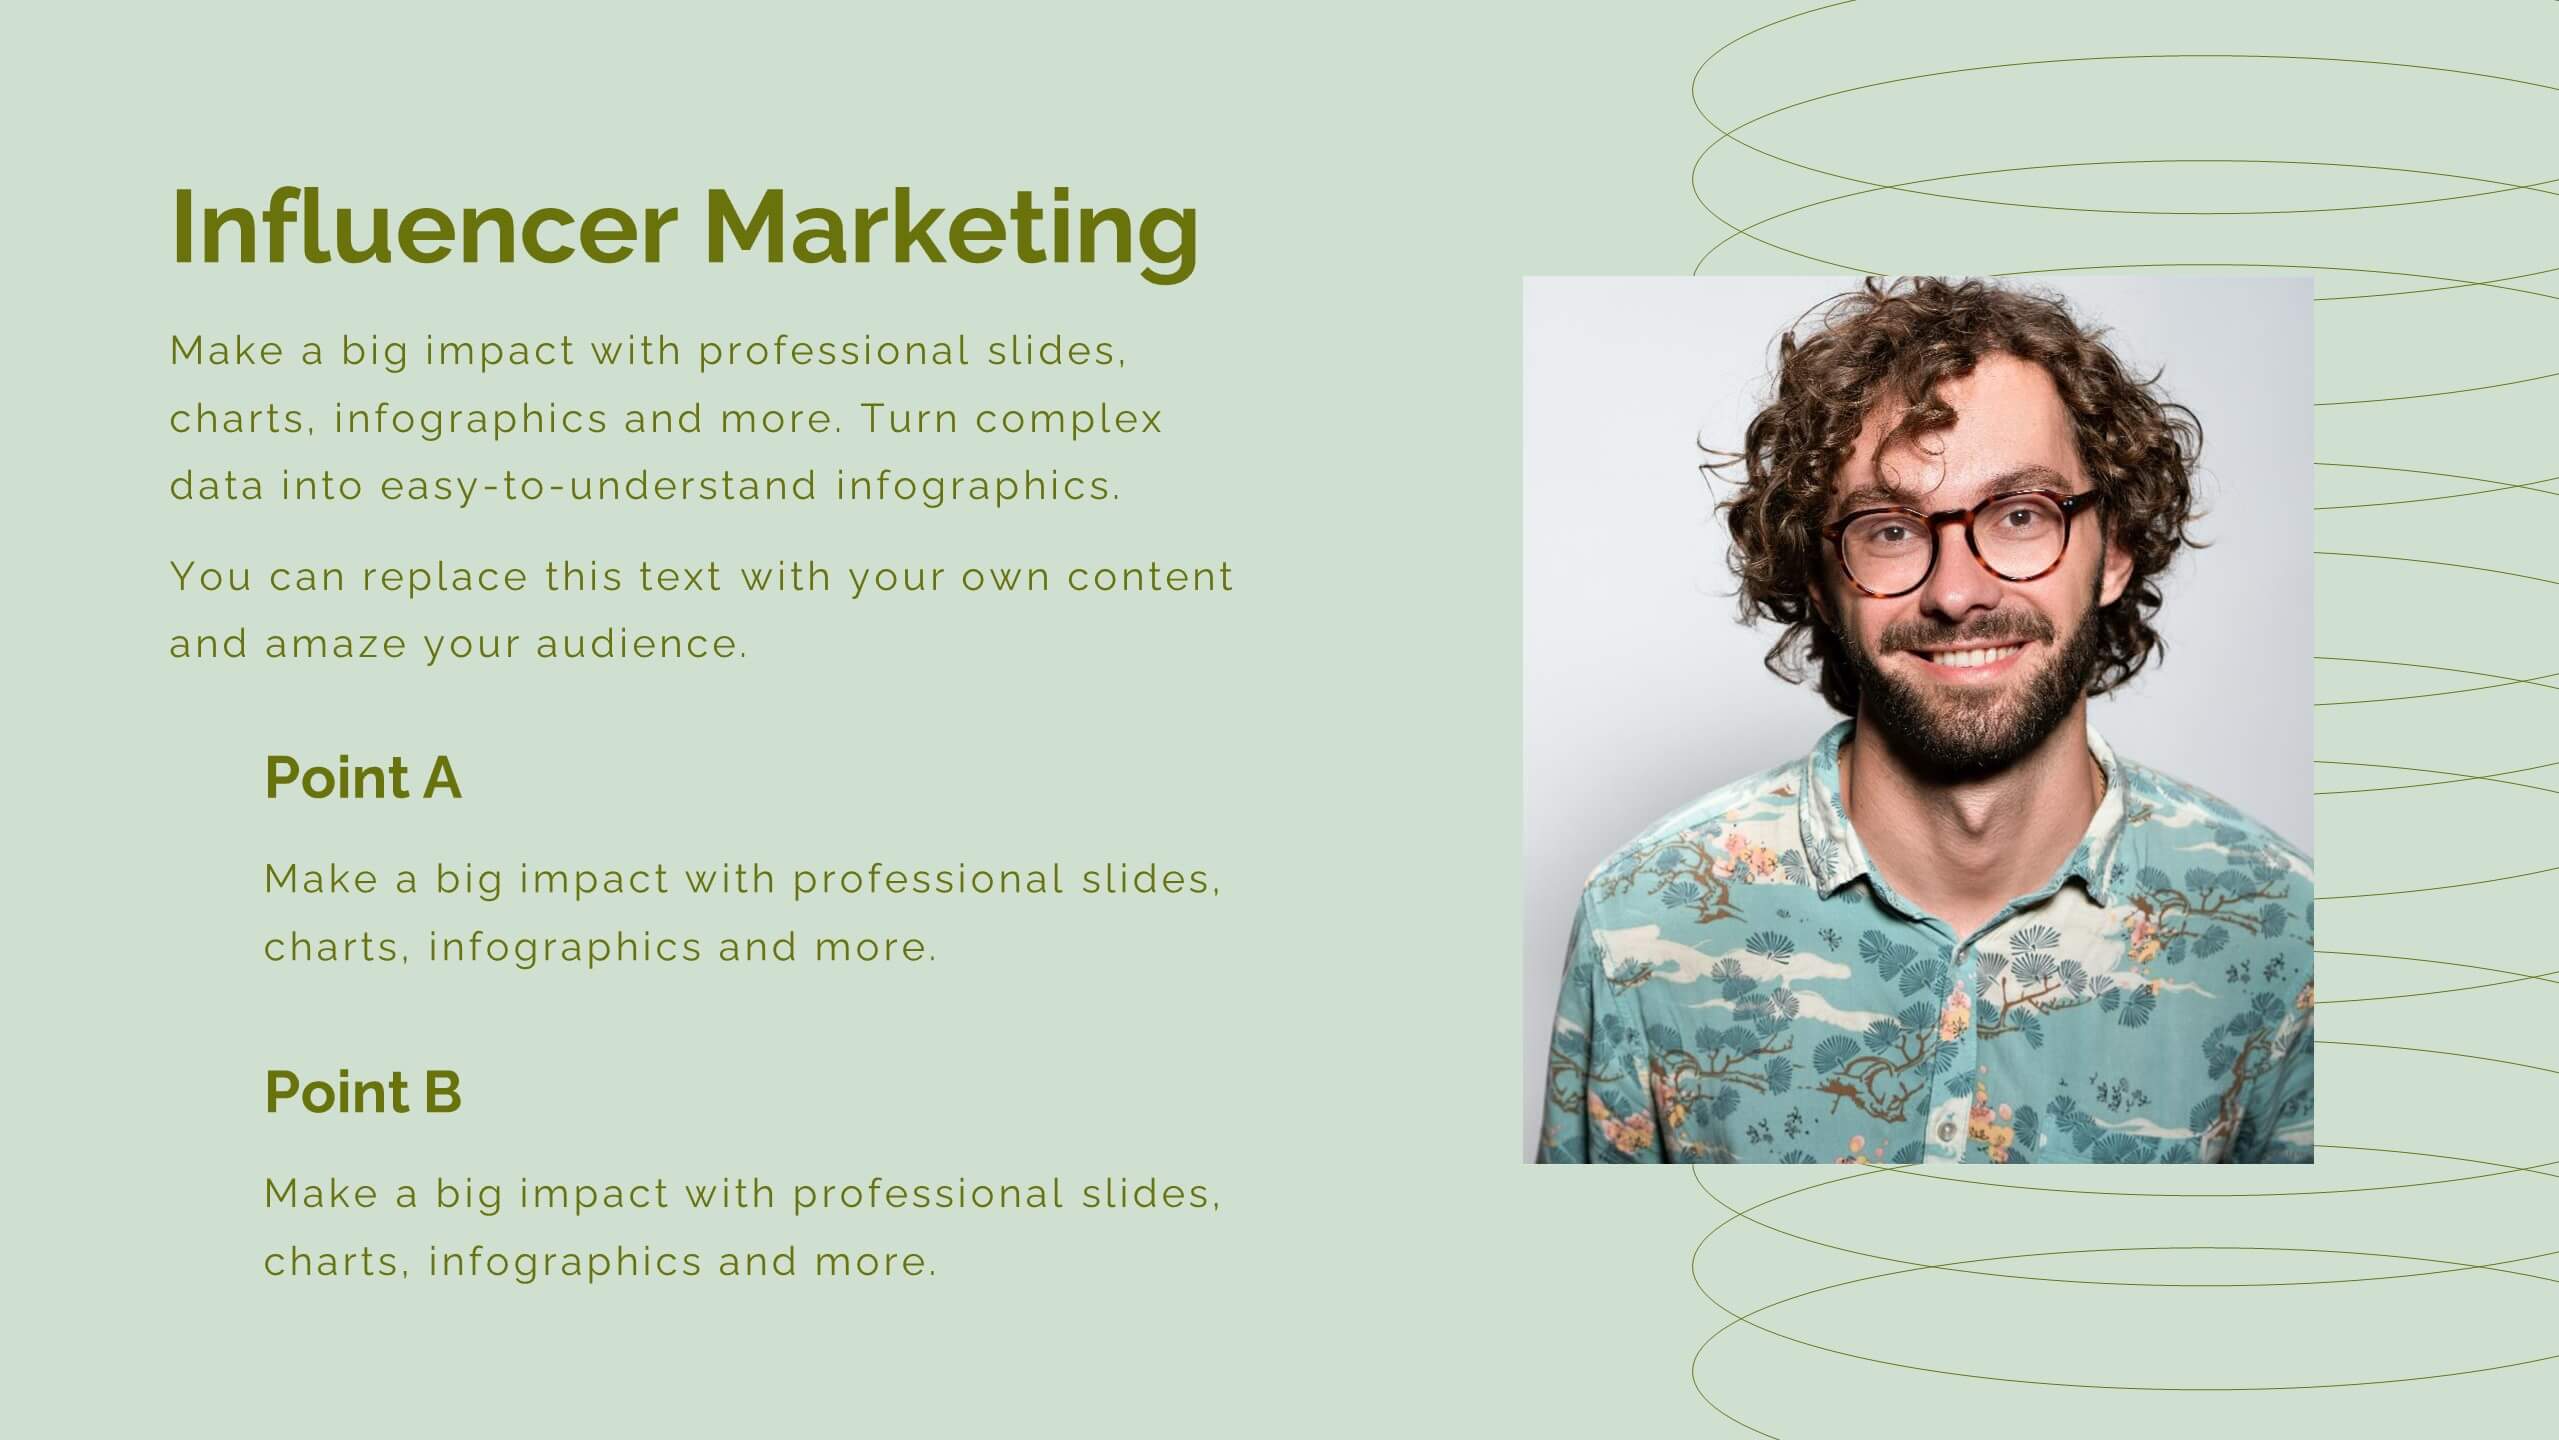
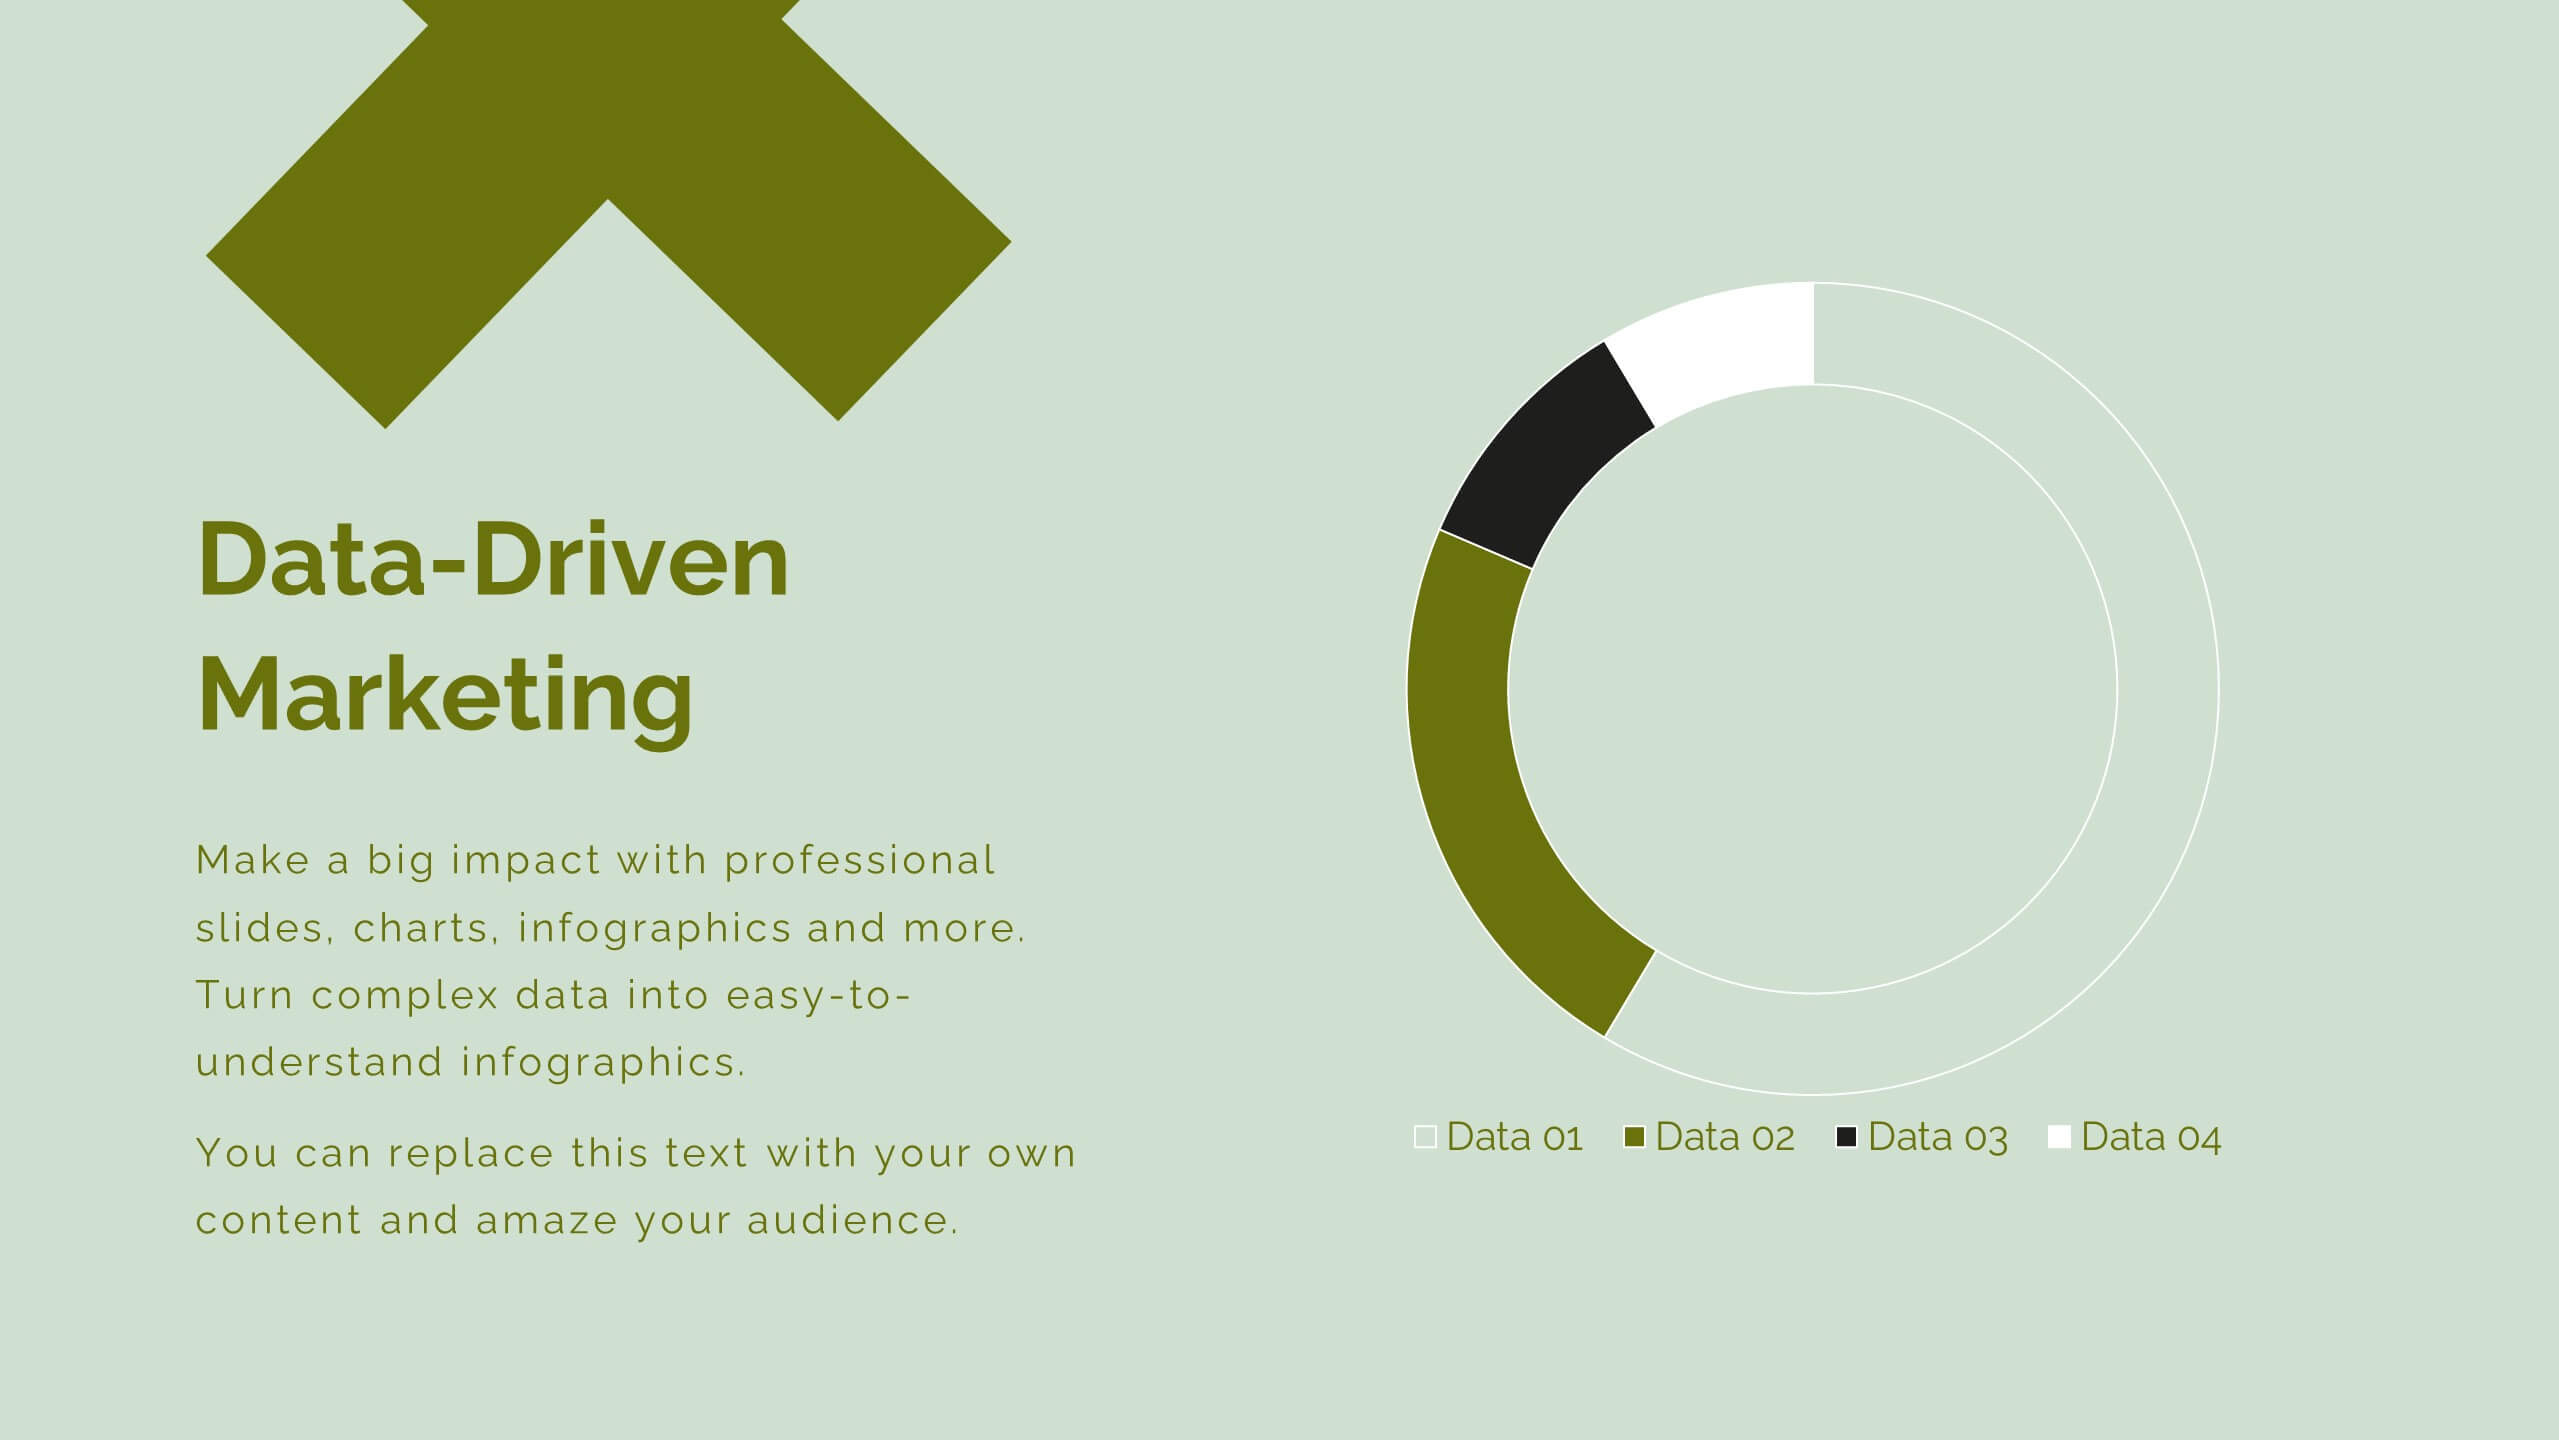
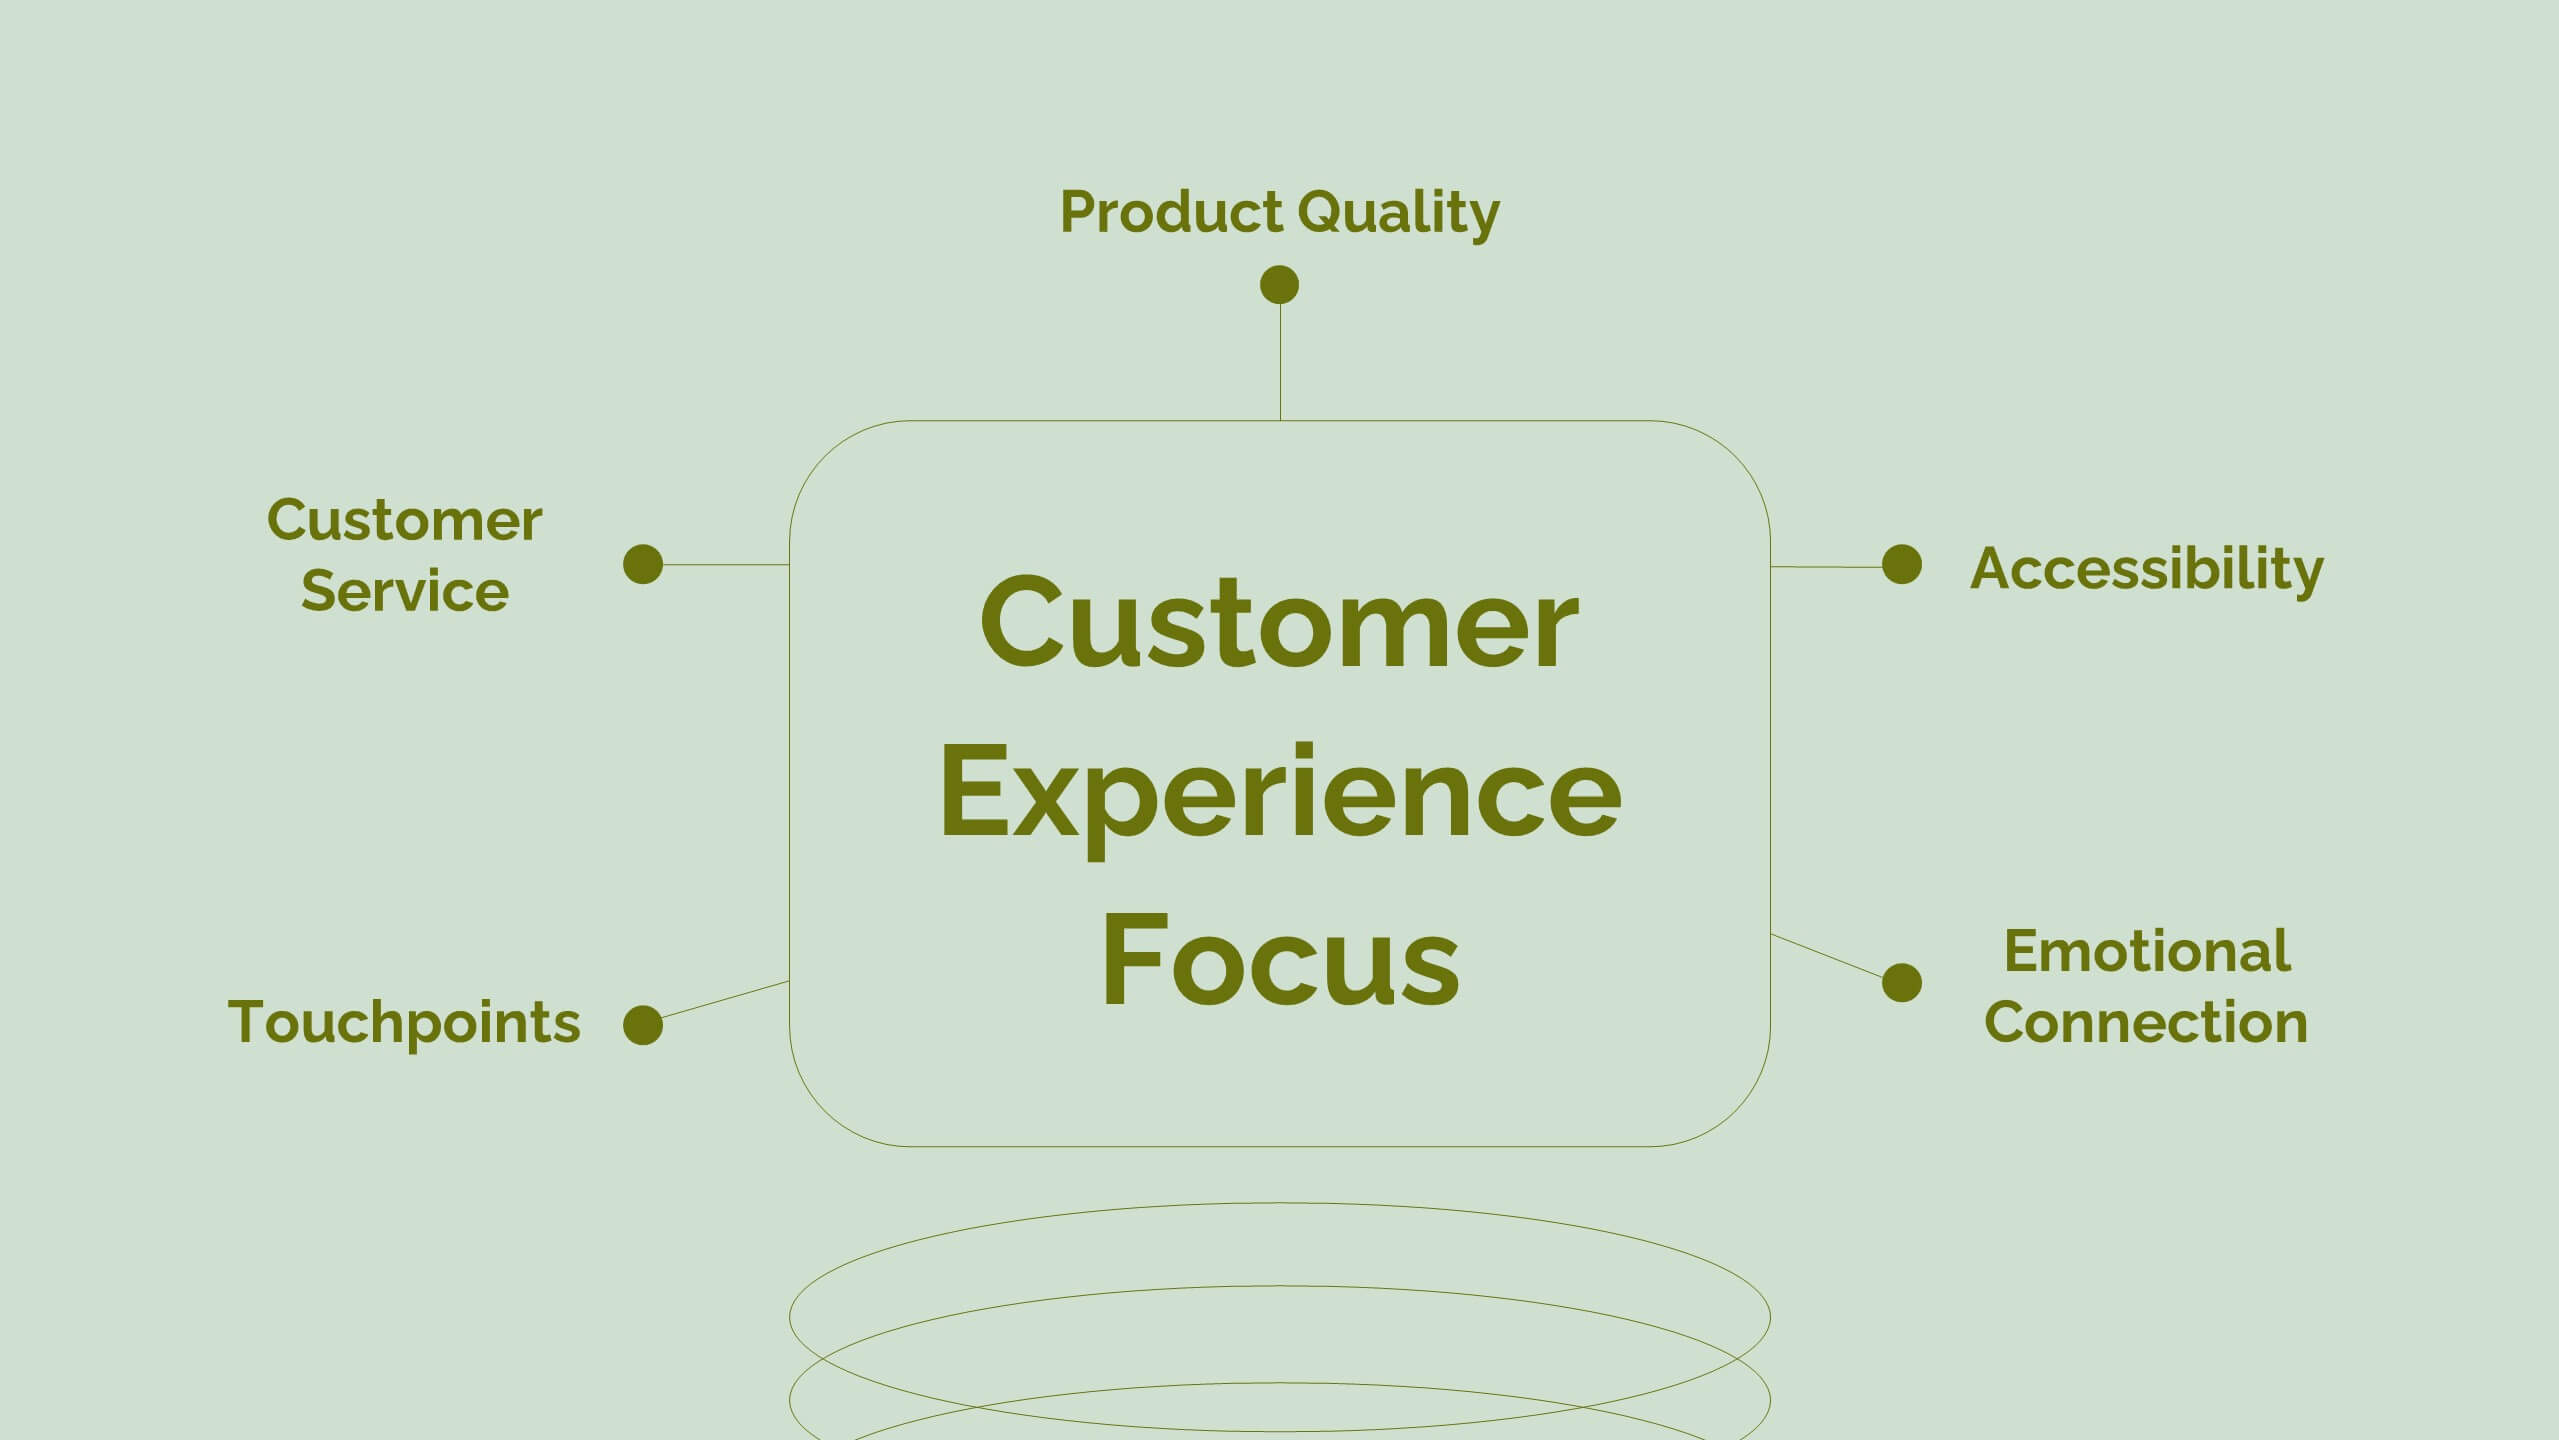
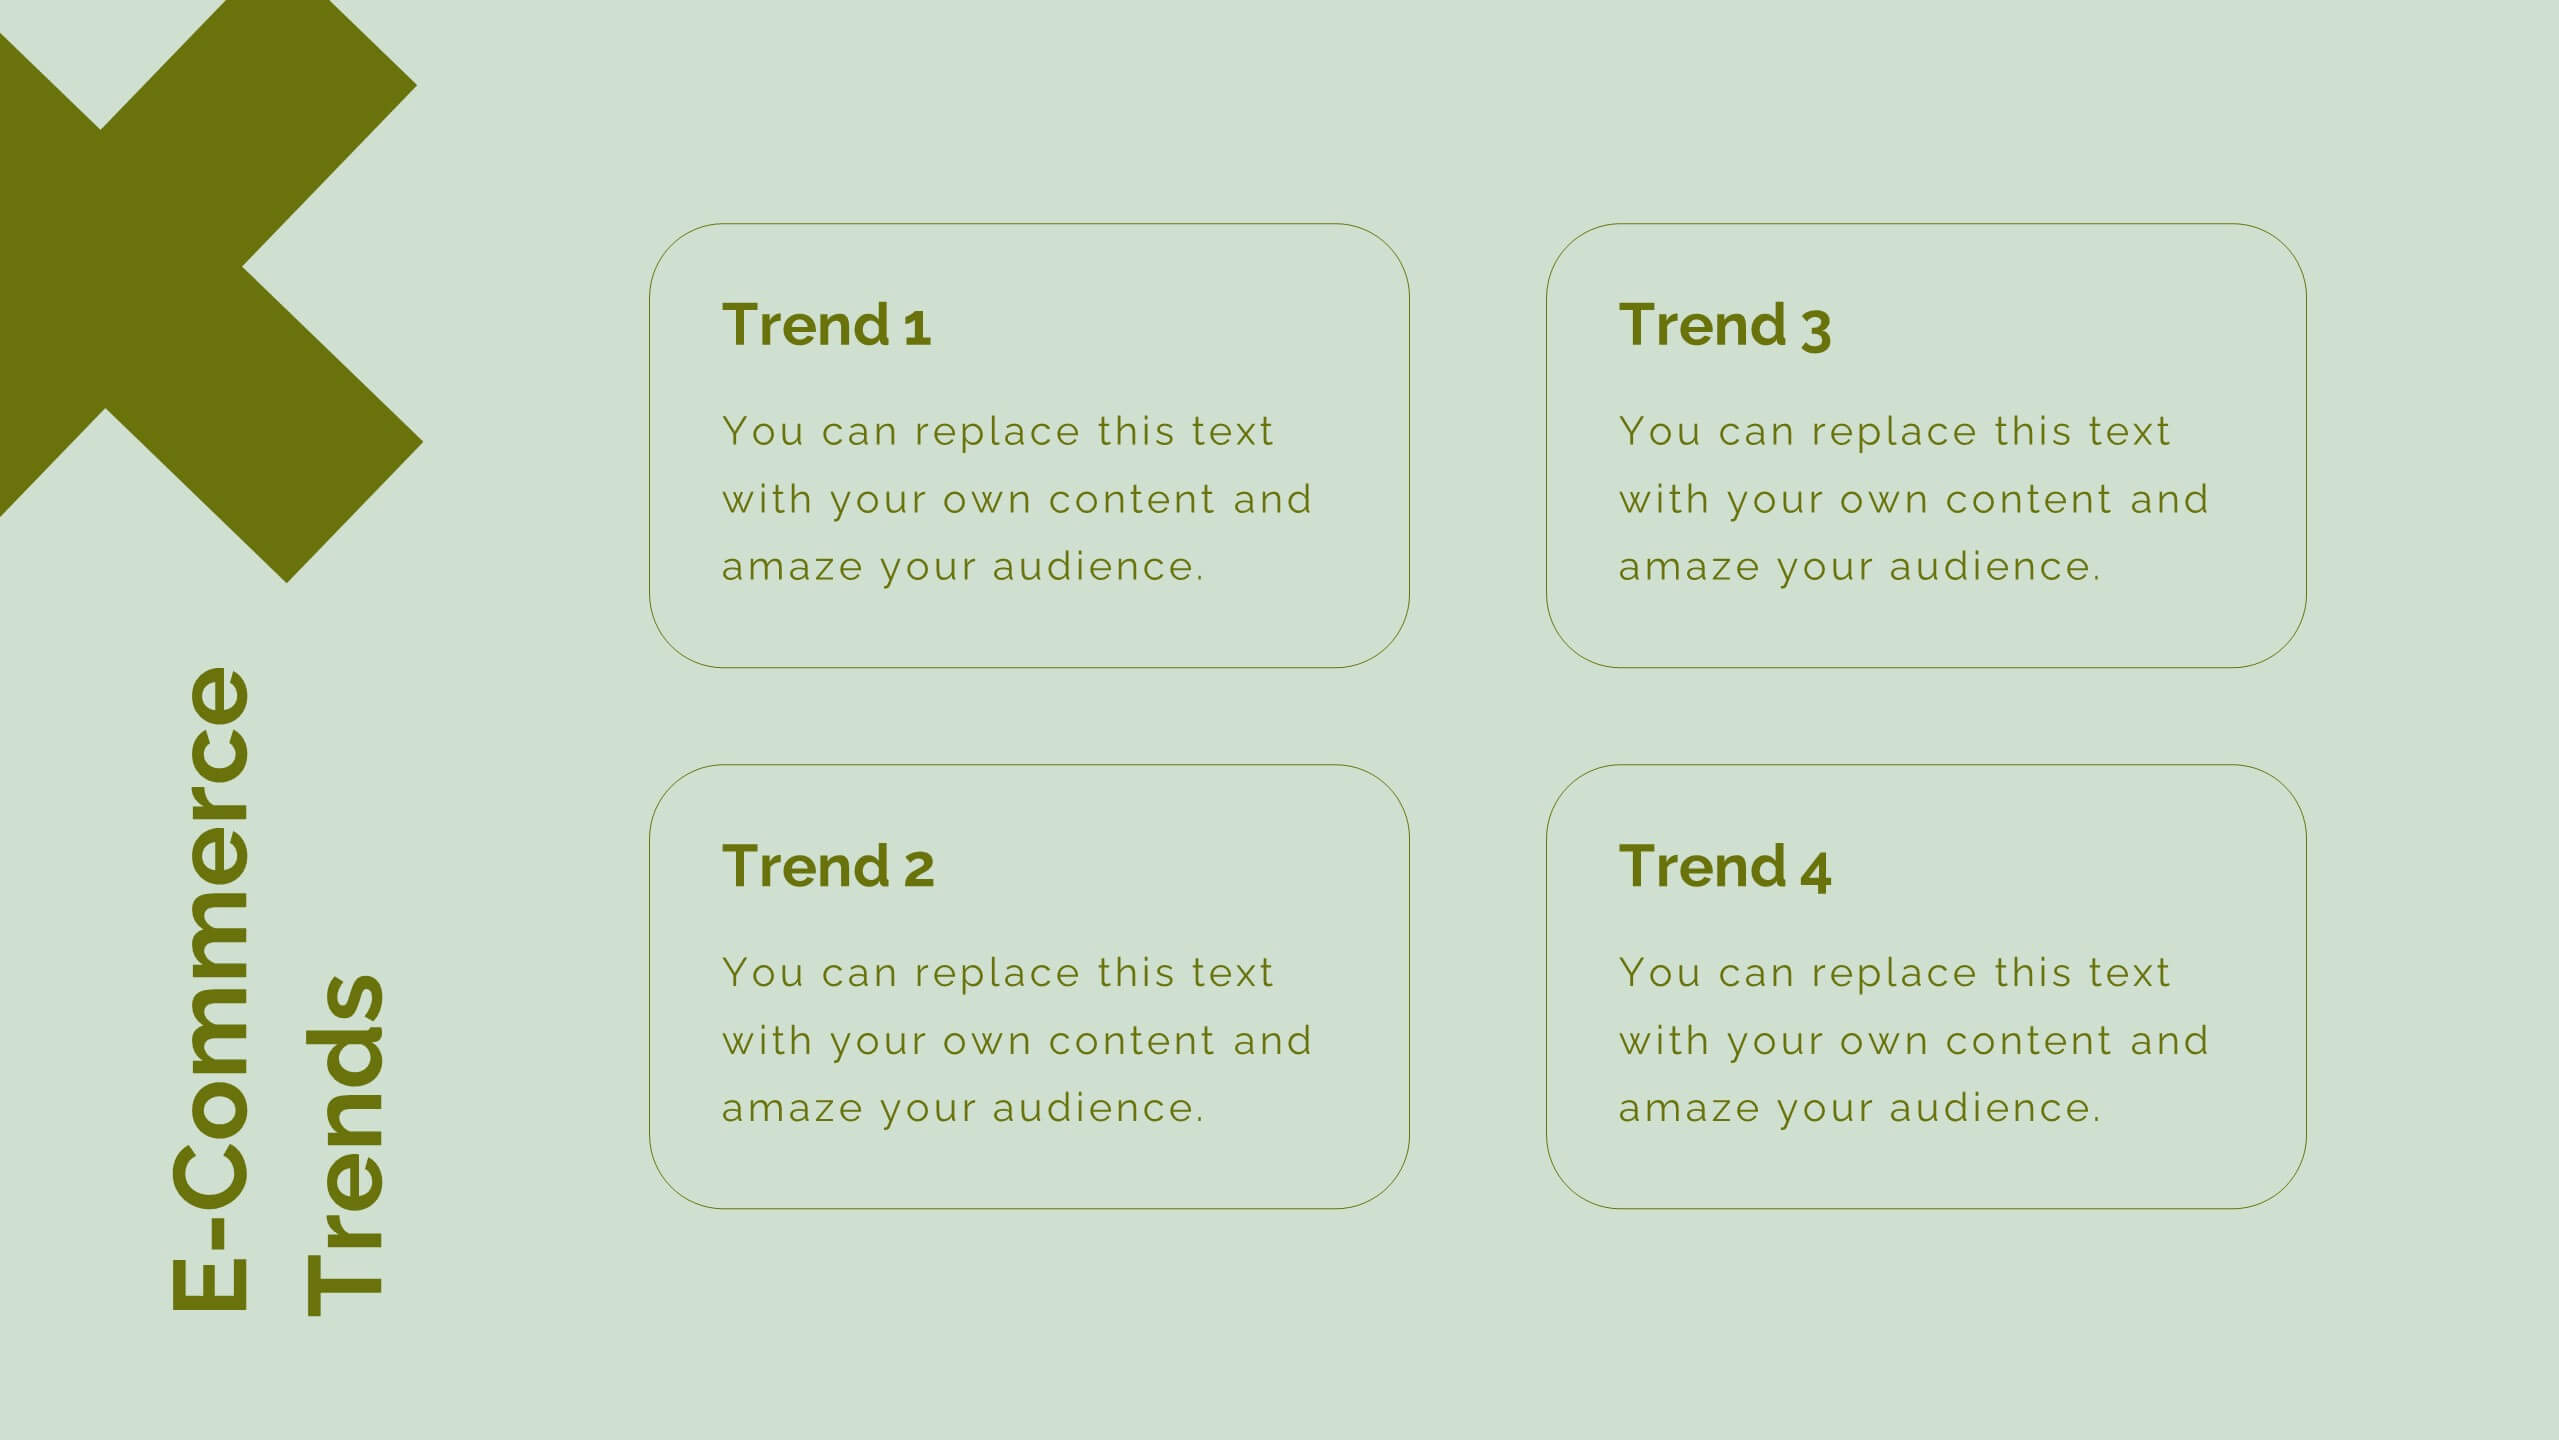
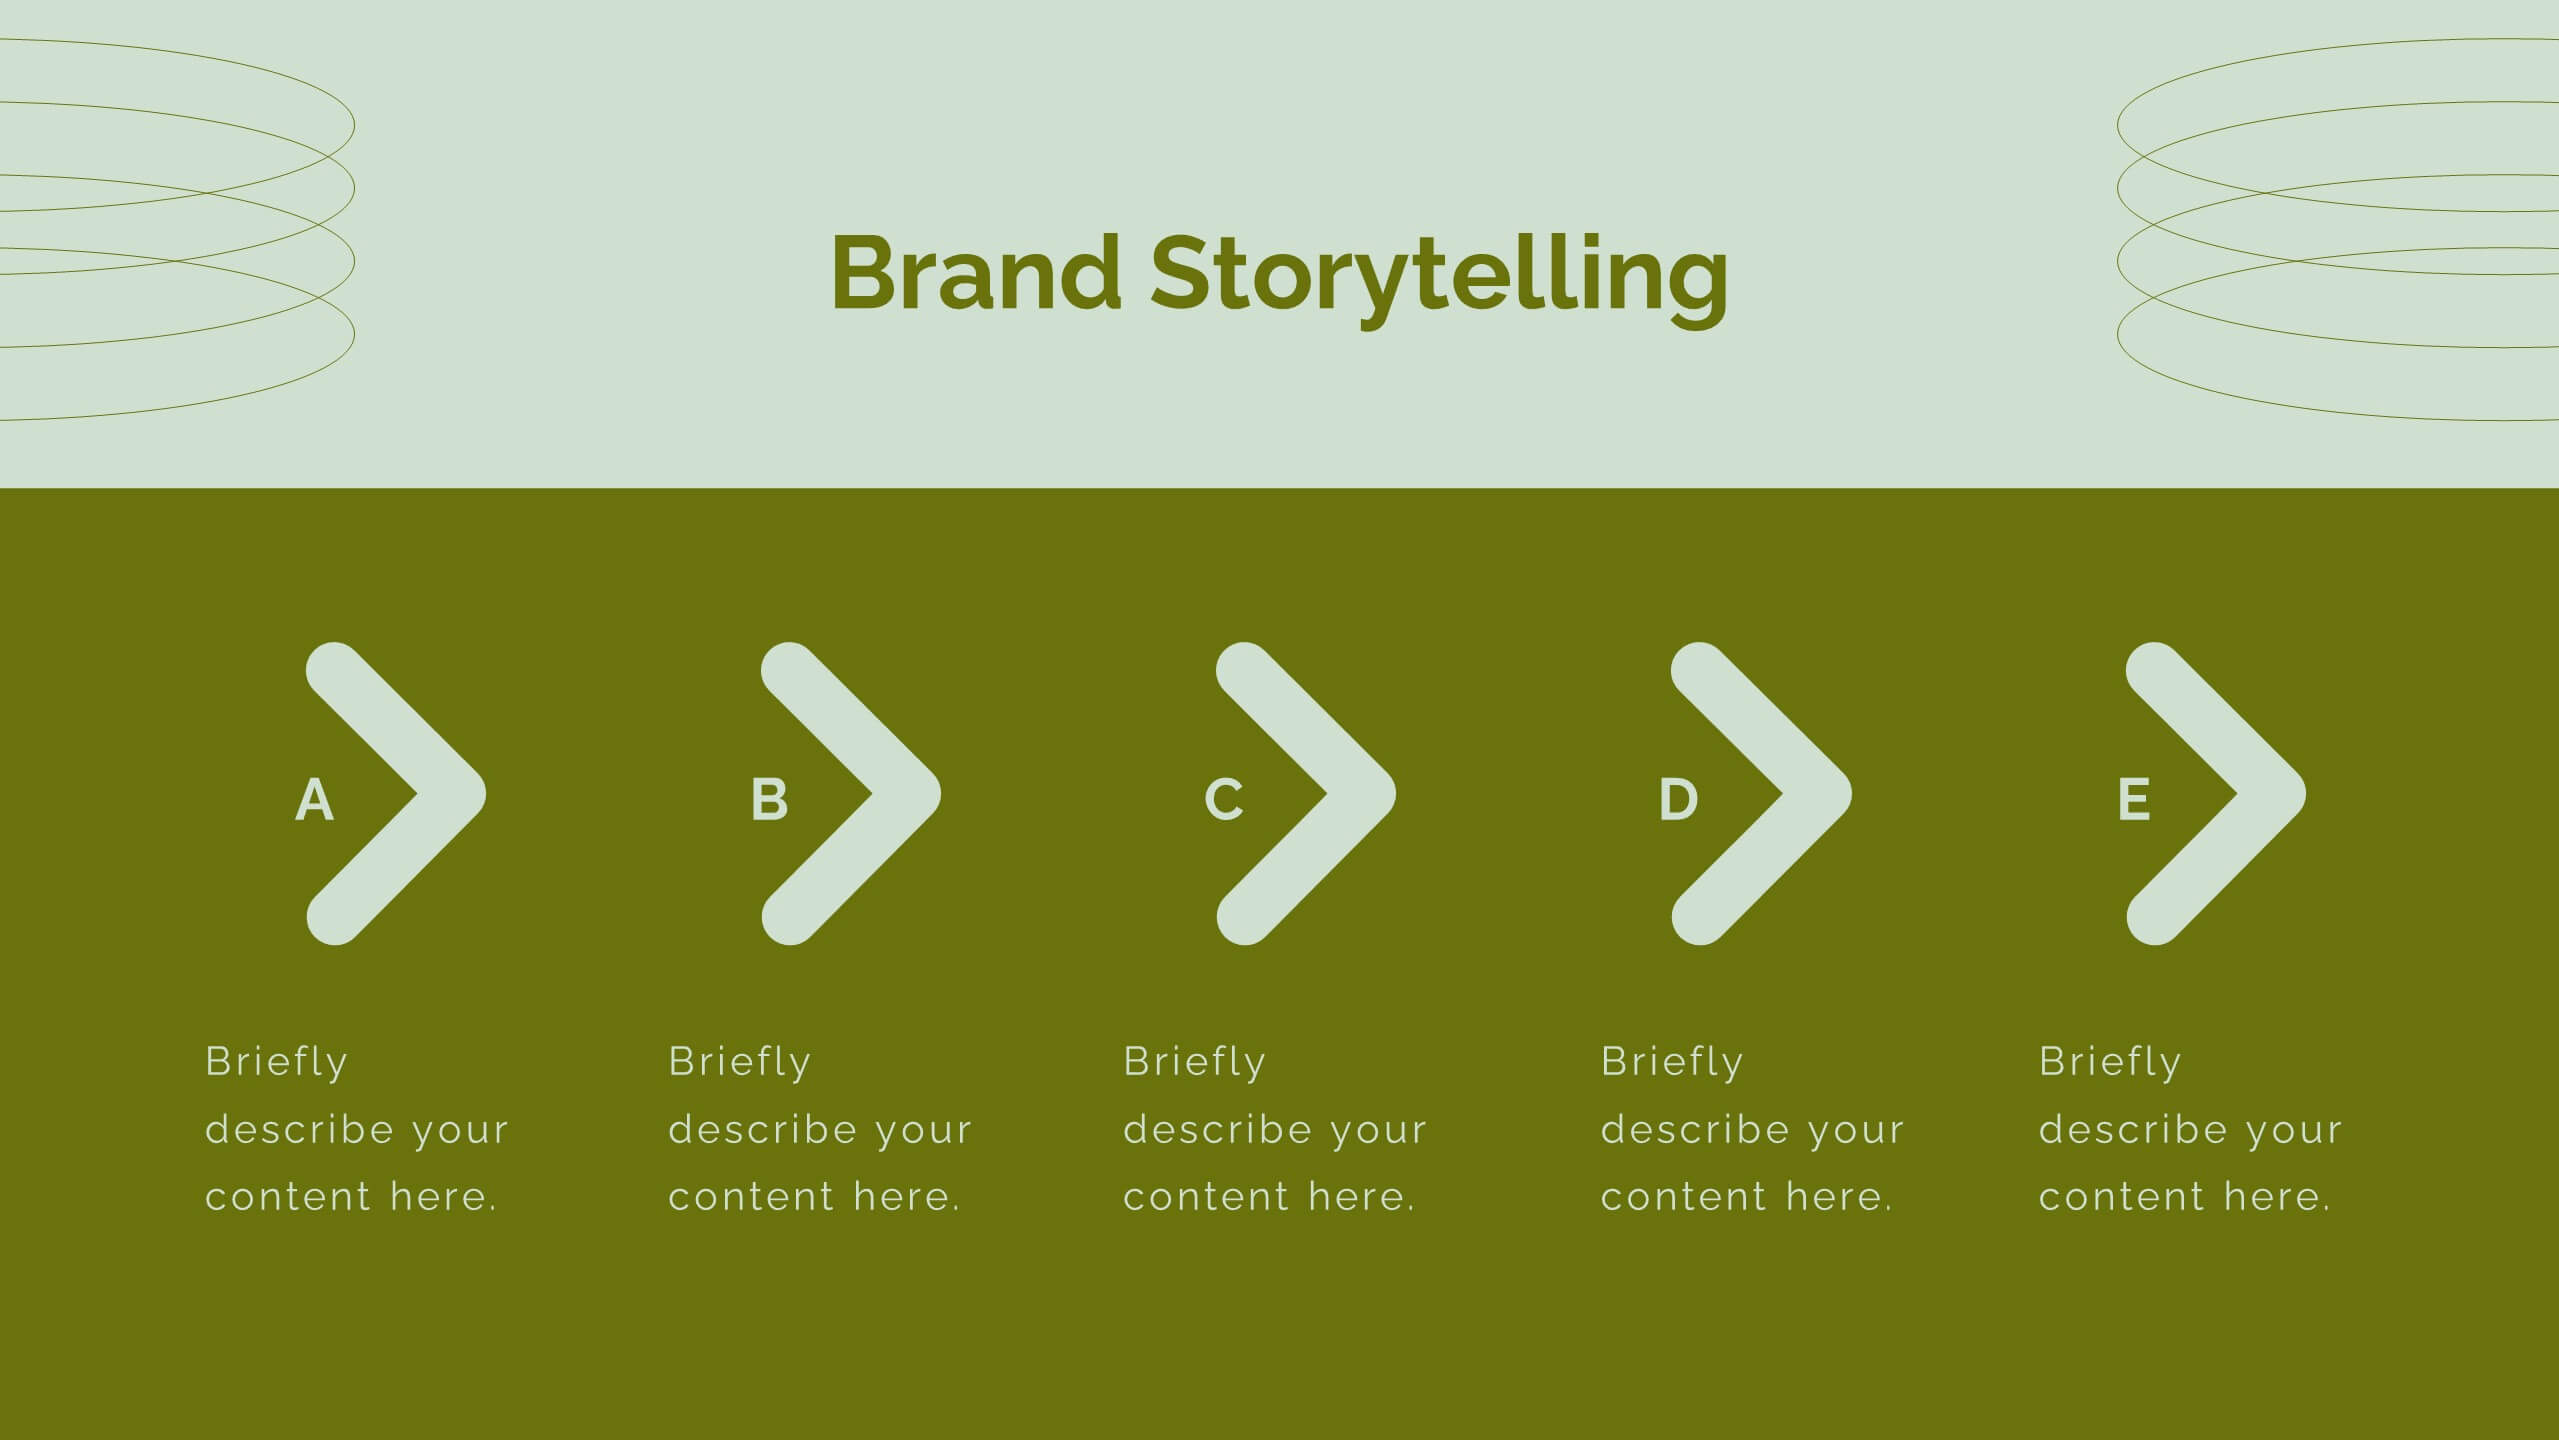
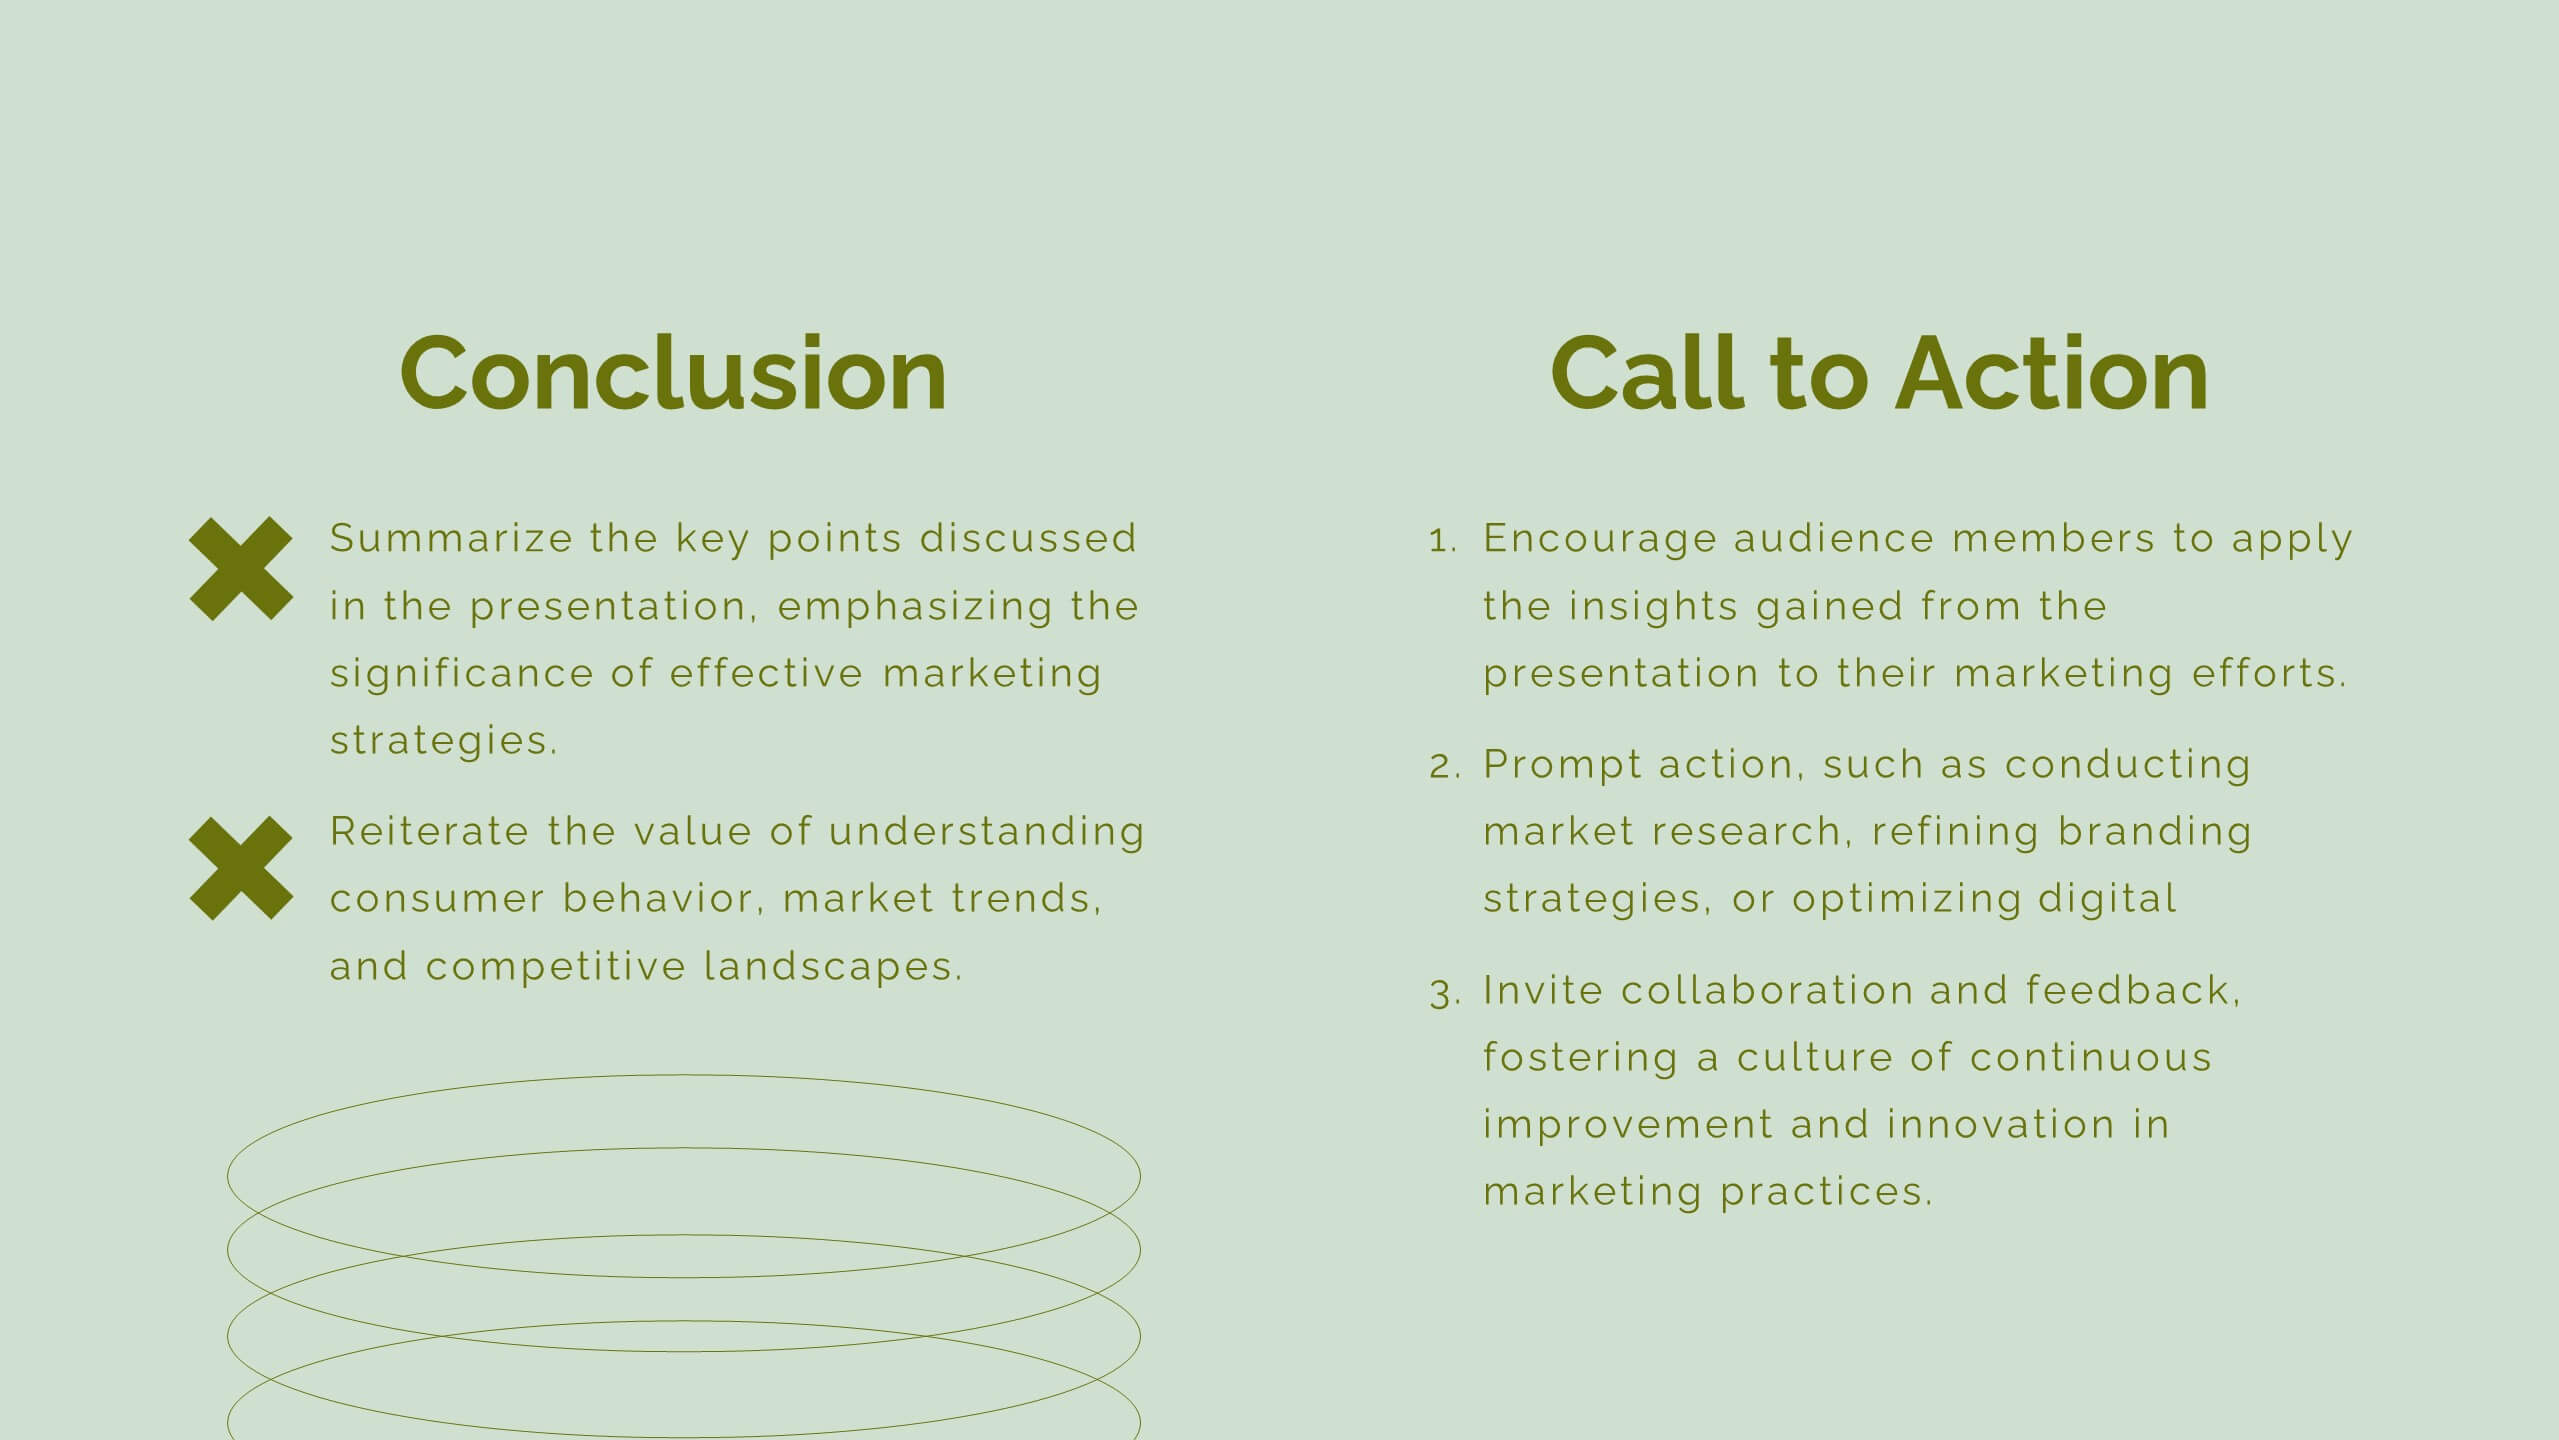
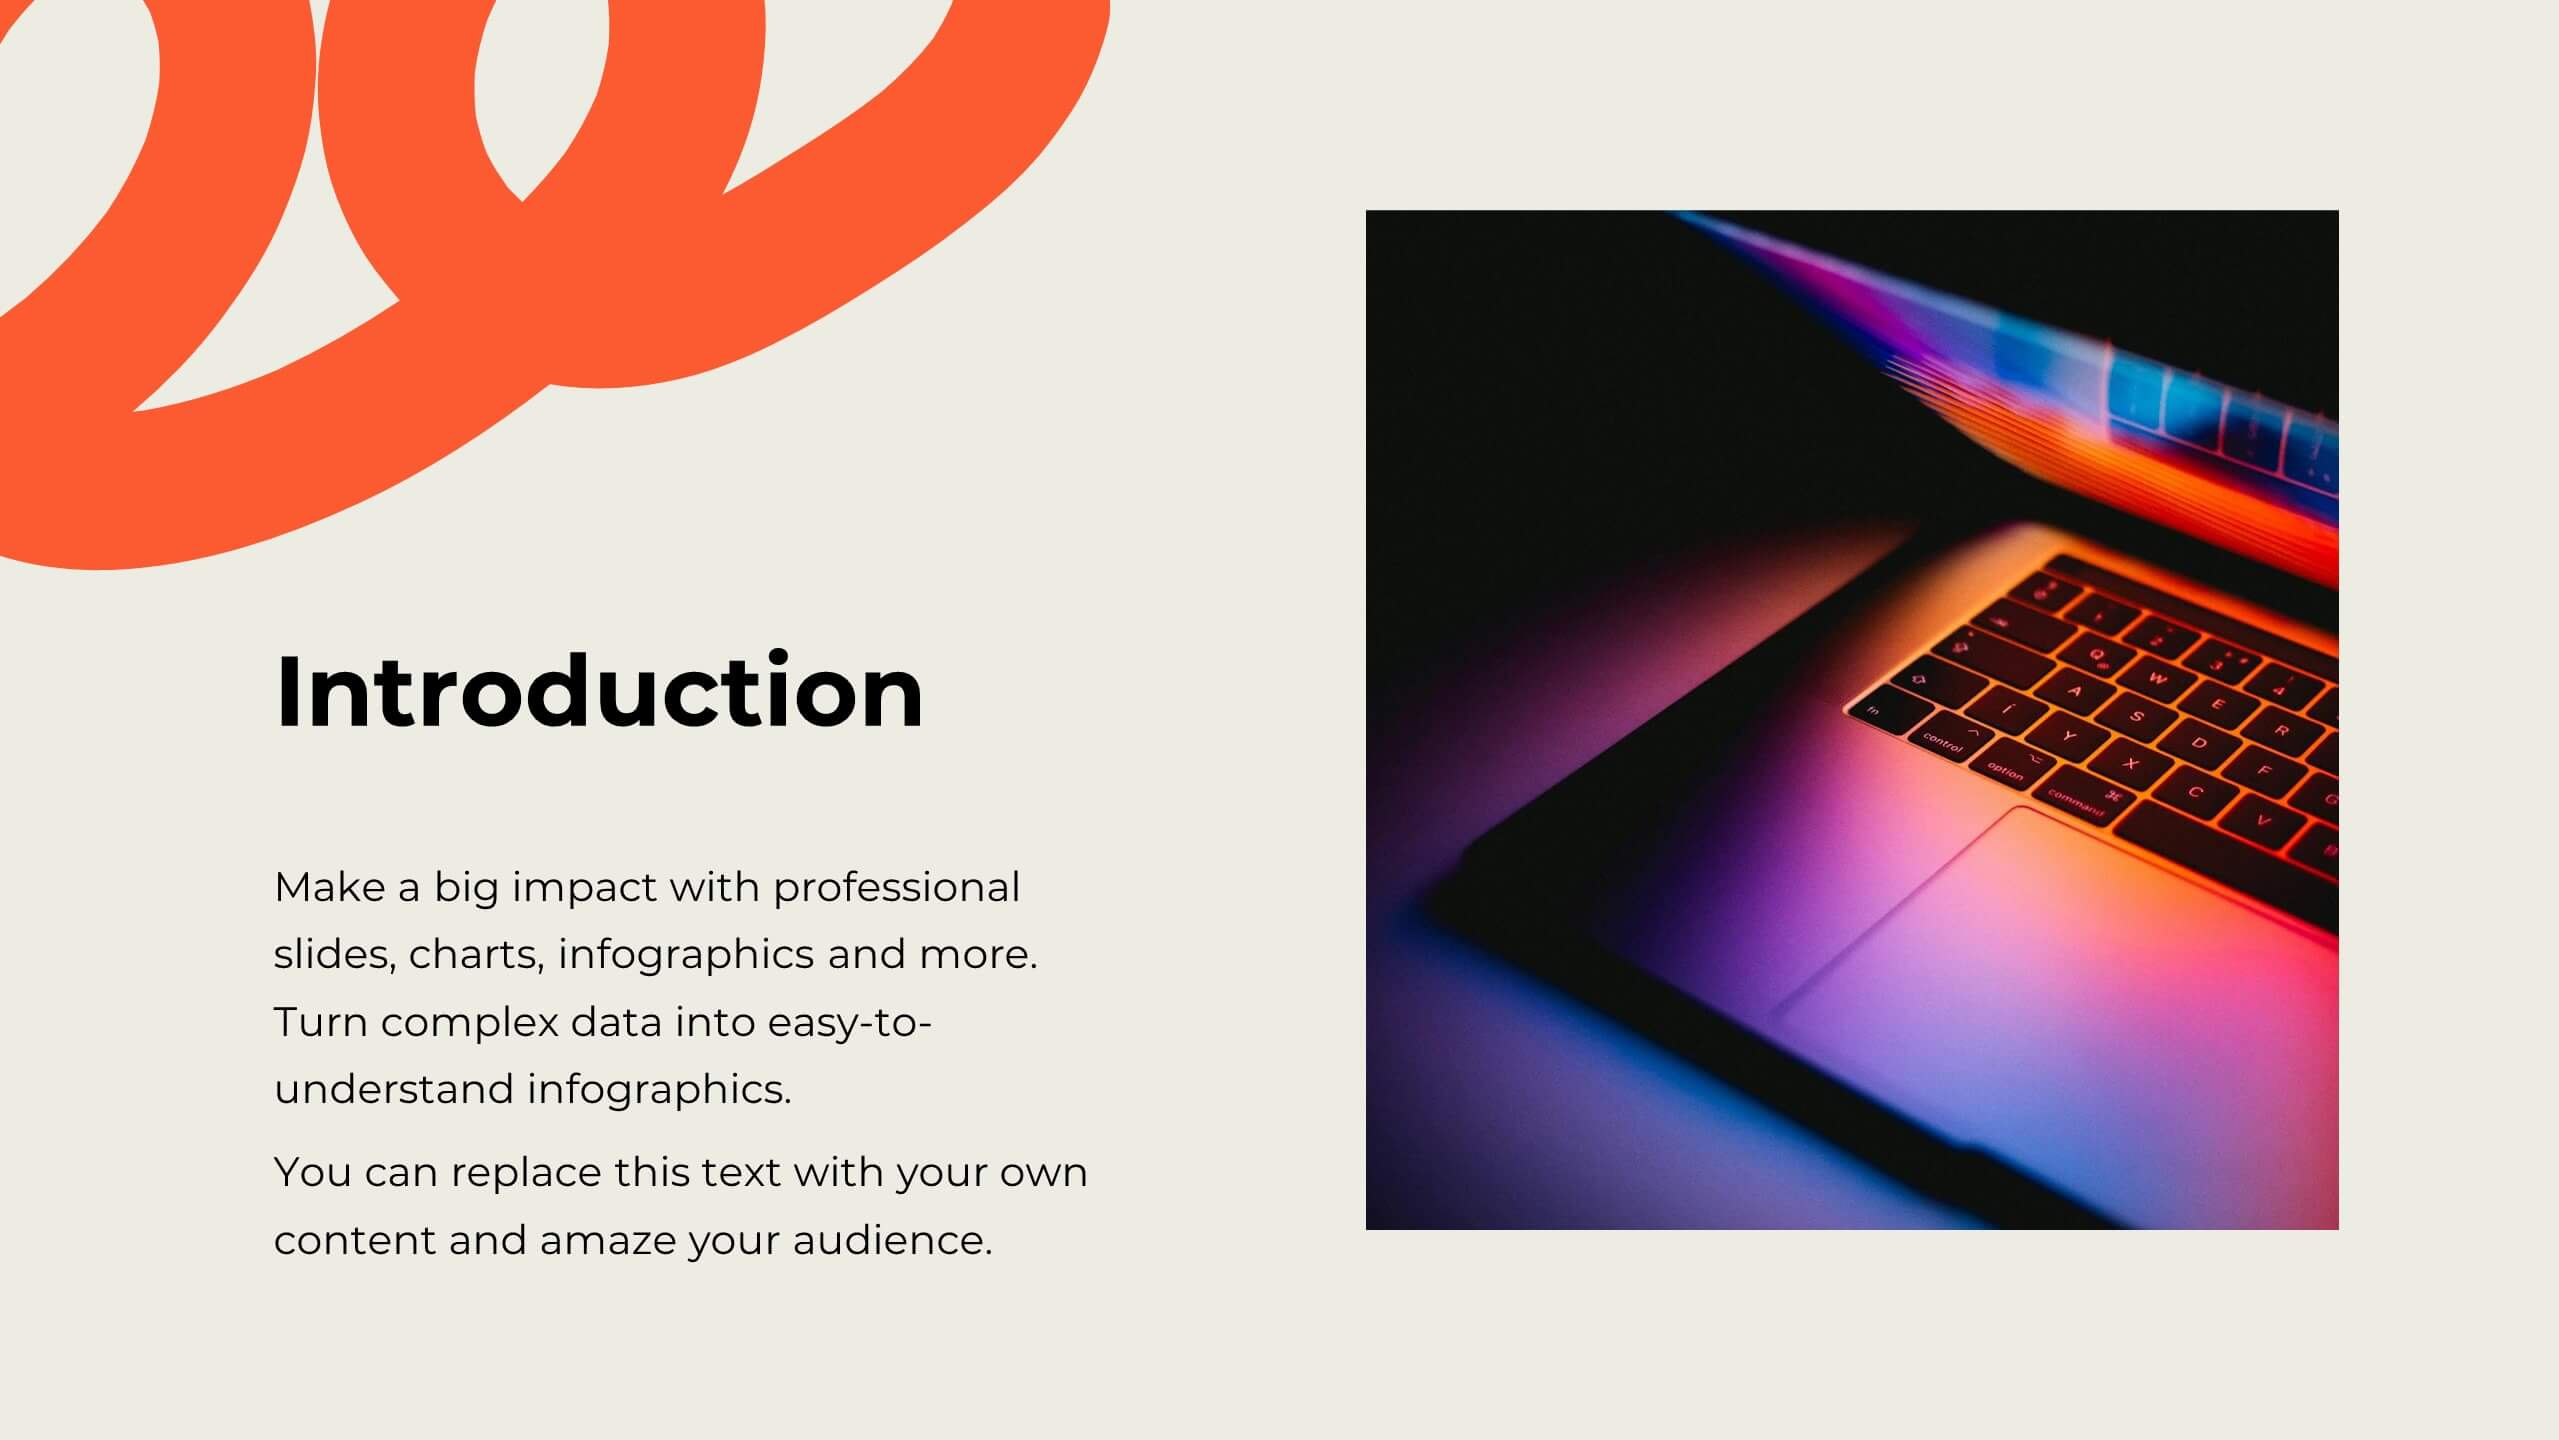
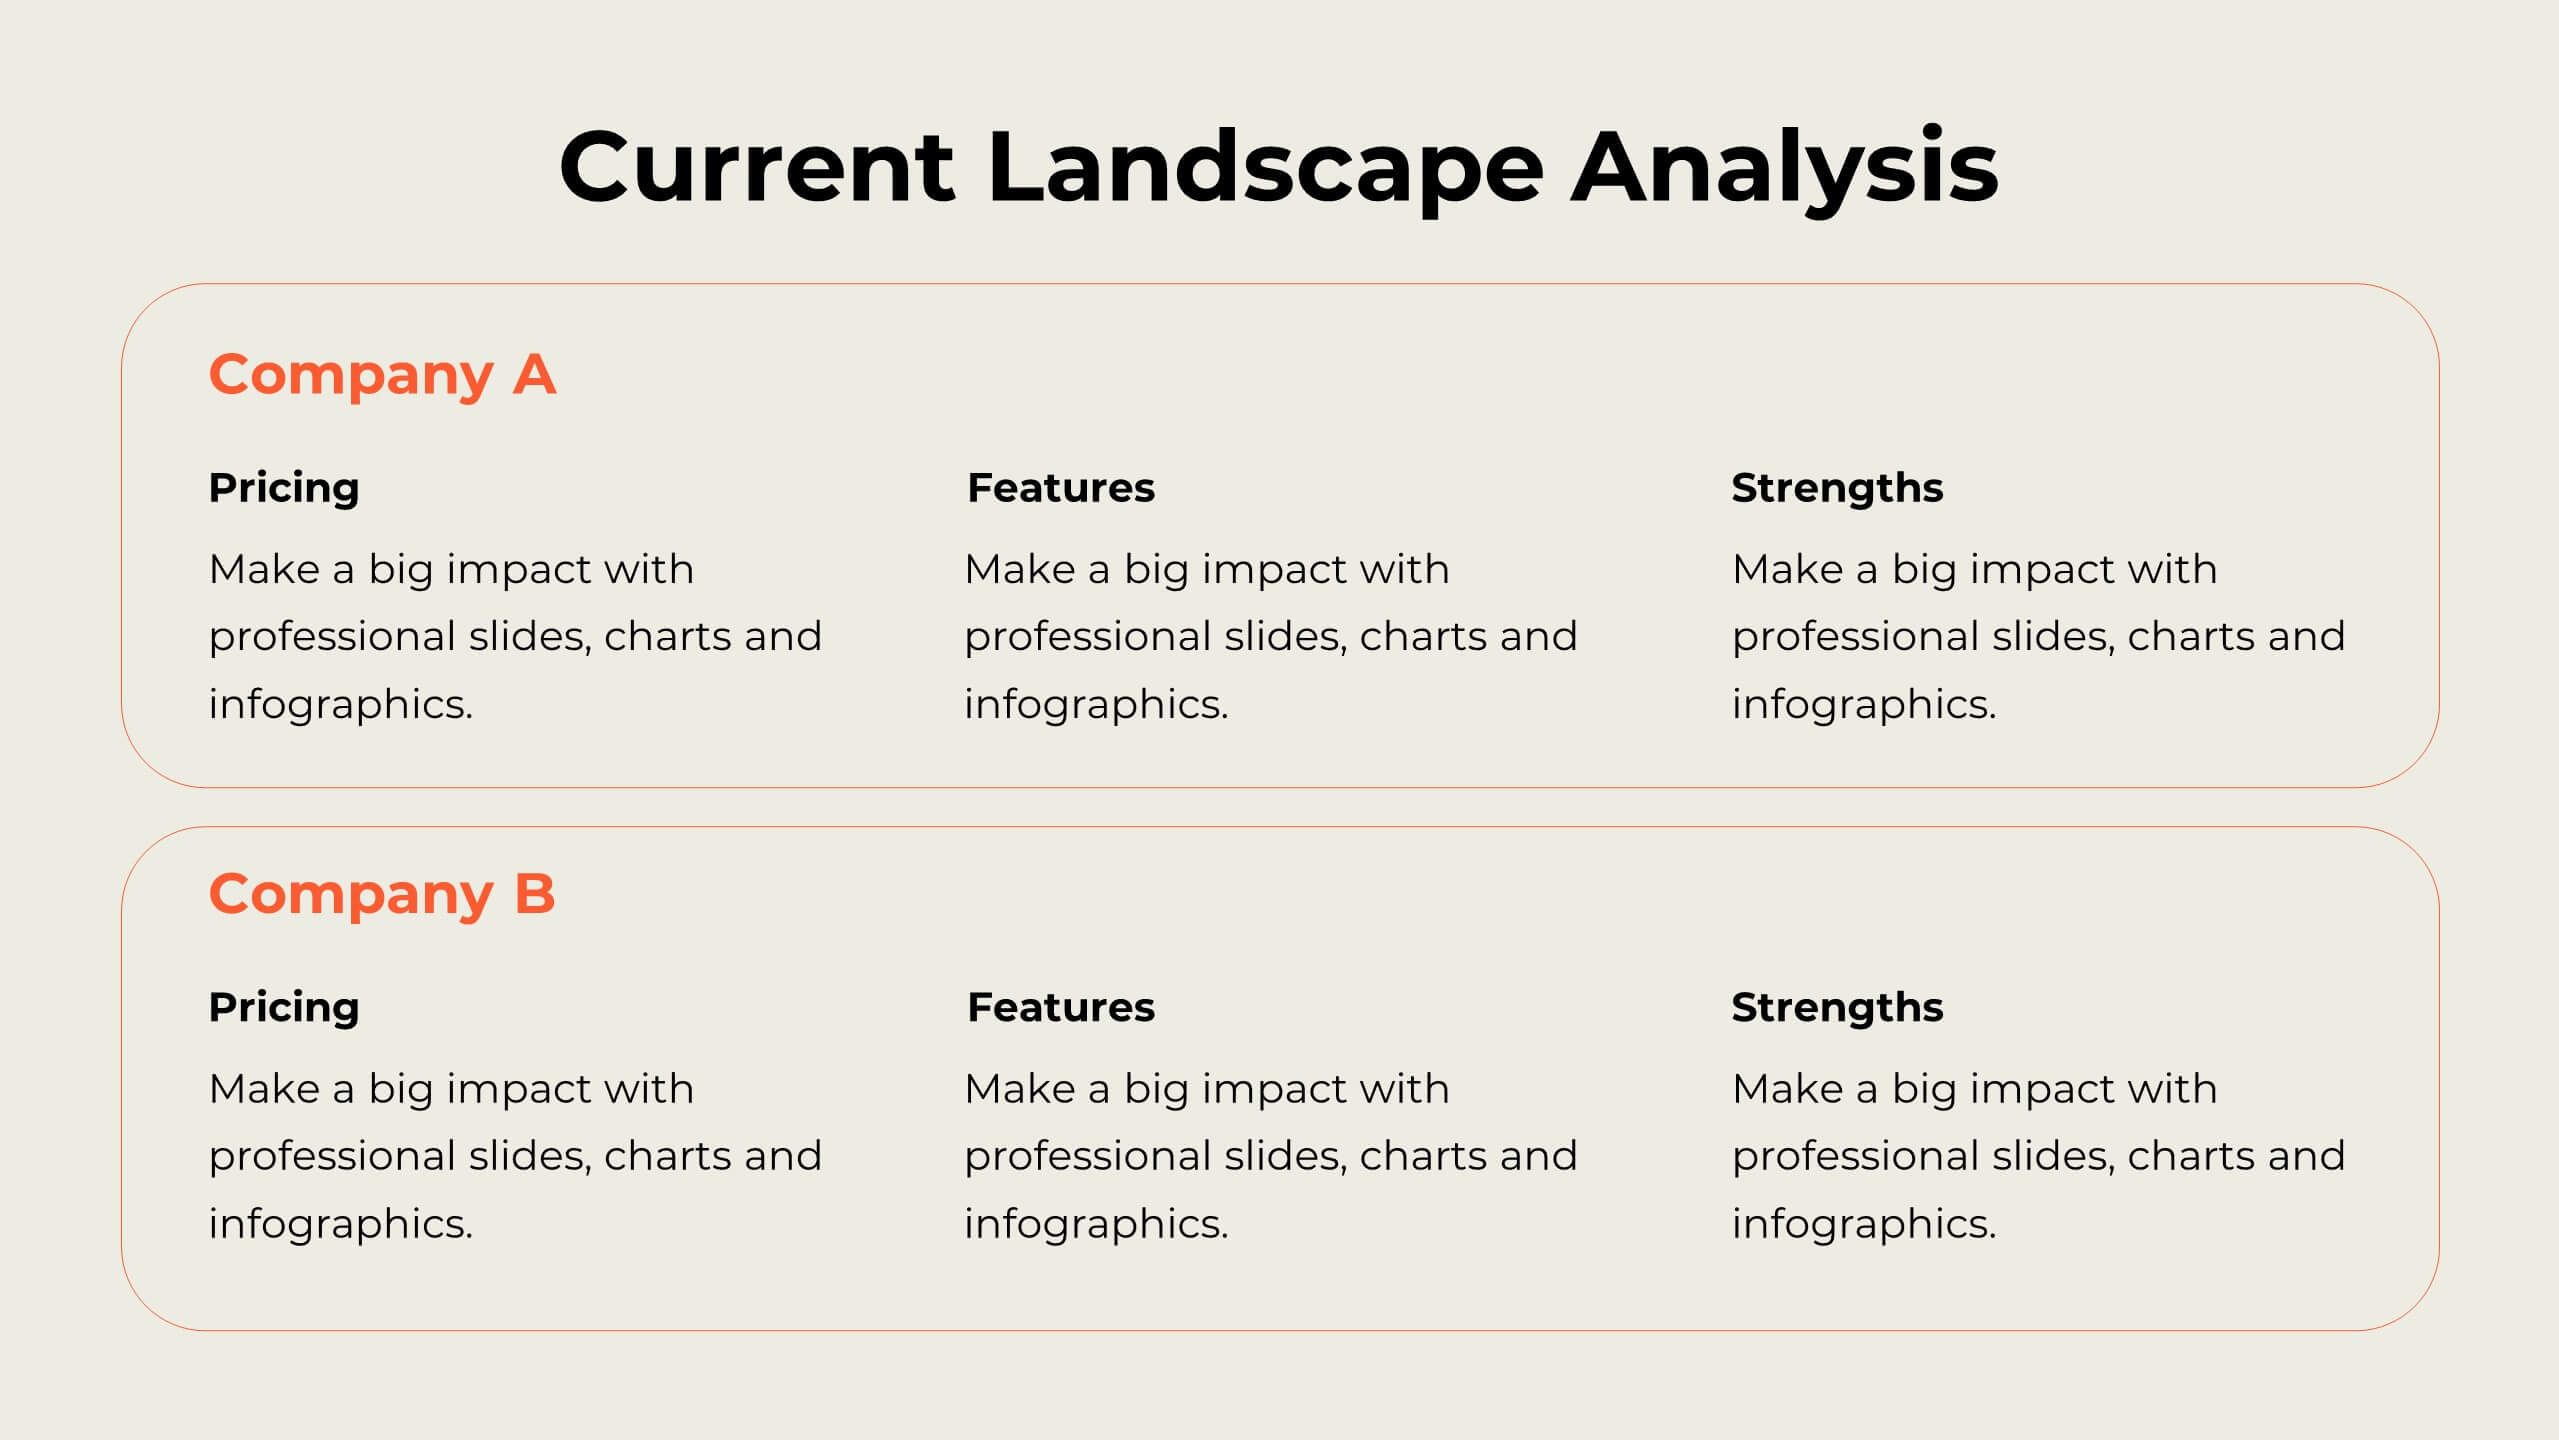
Aura Digital Marketing Strategy Plan Presentation
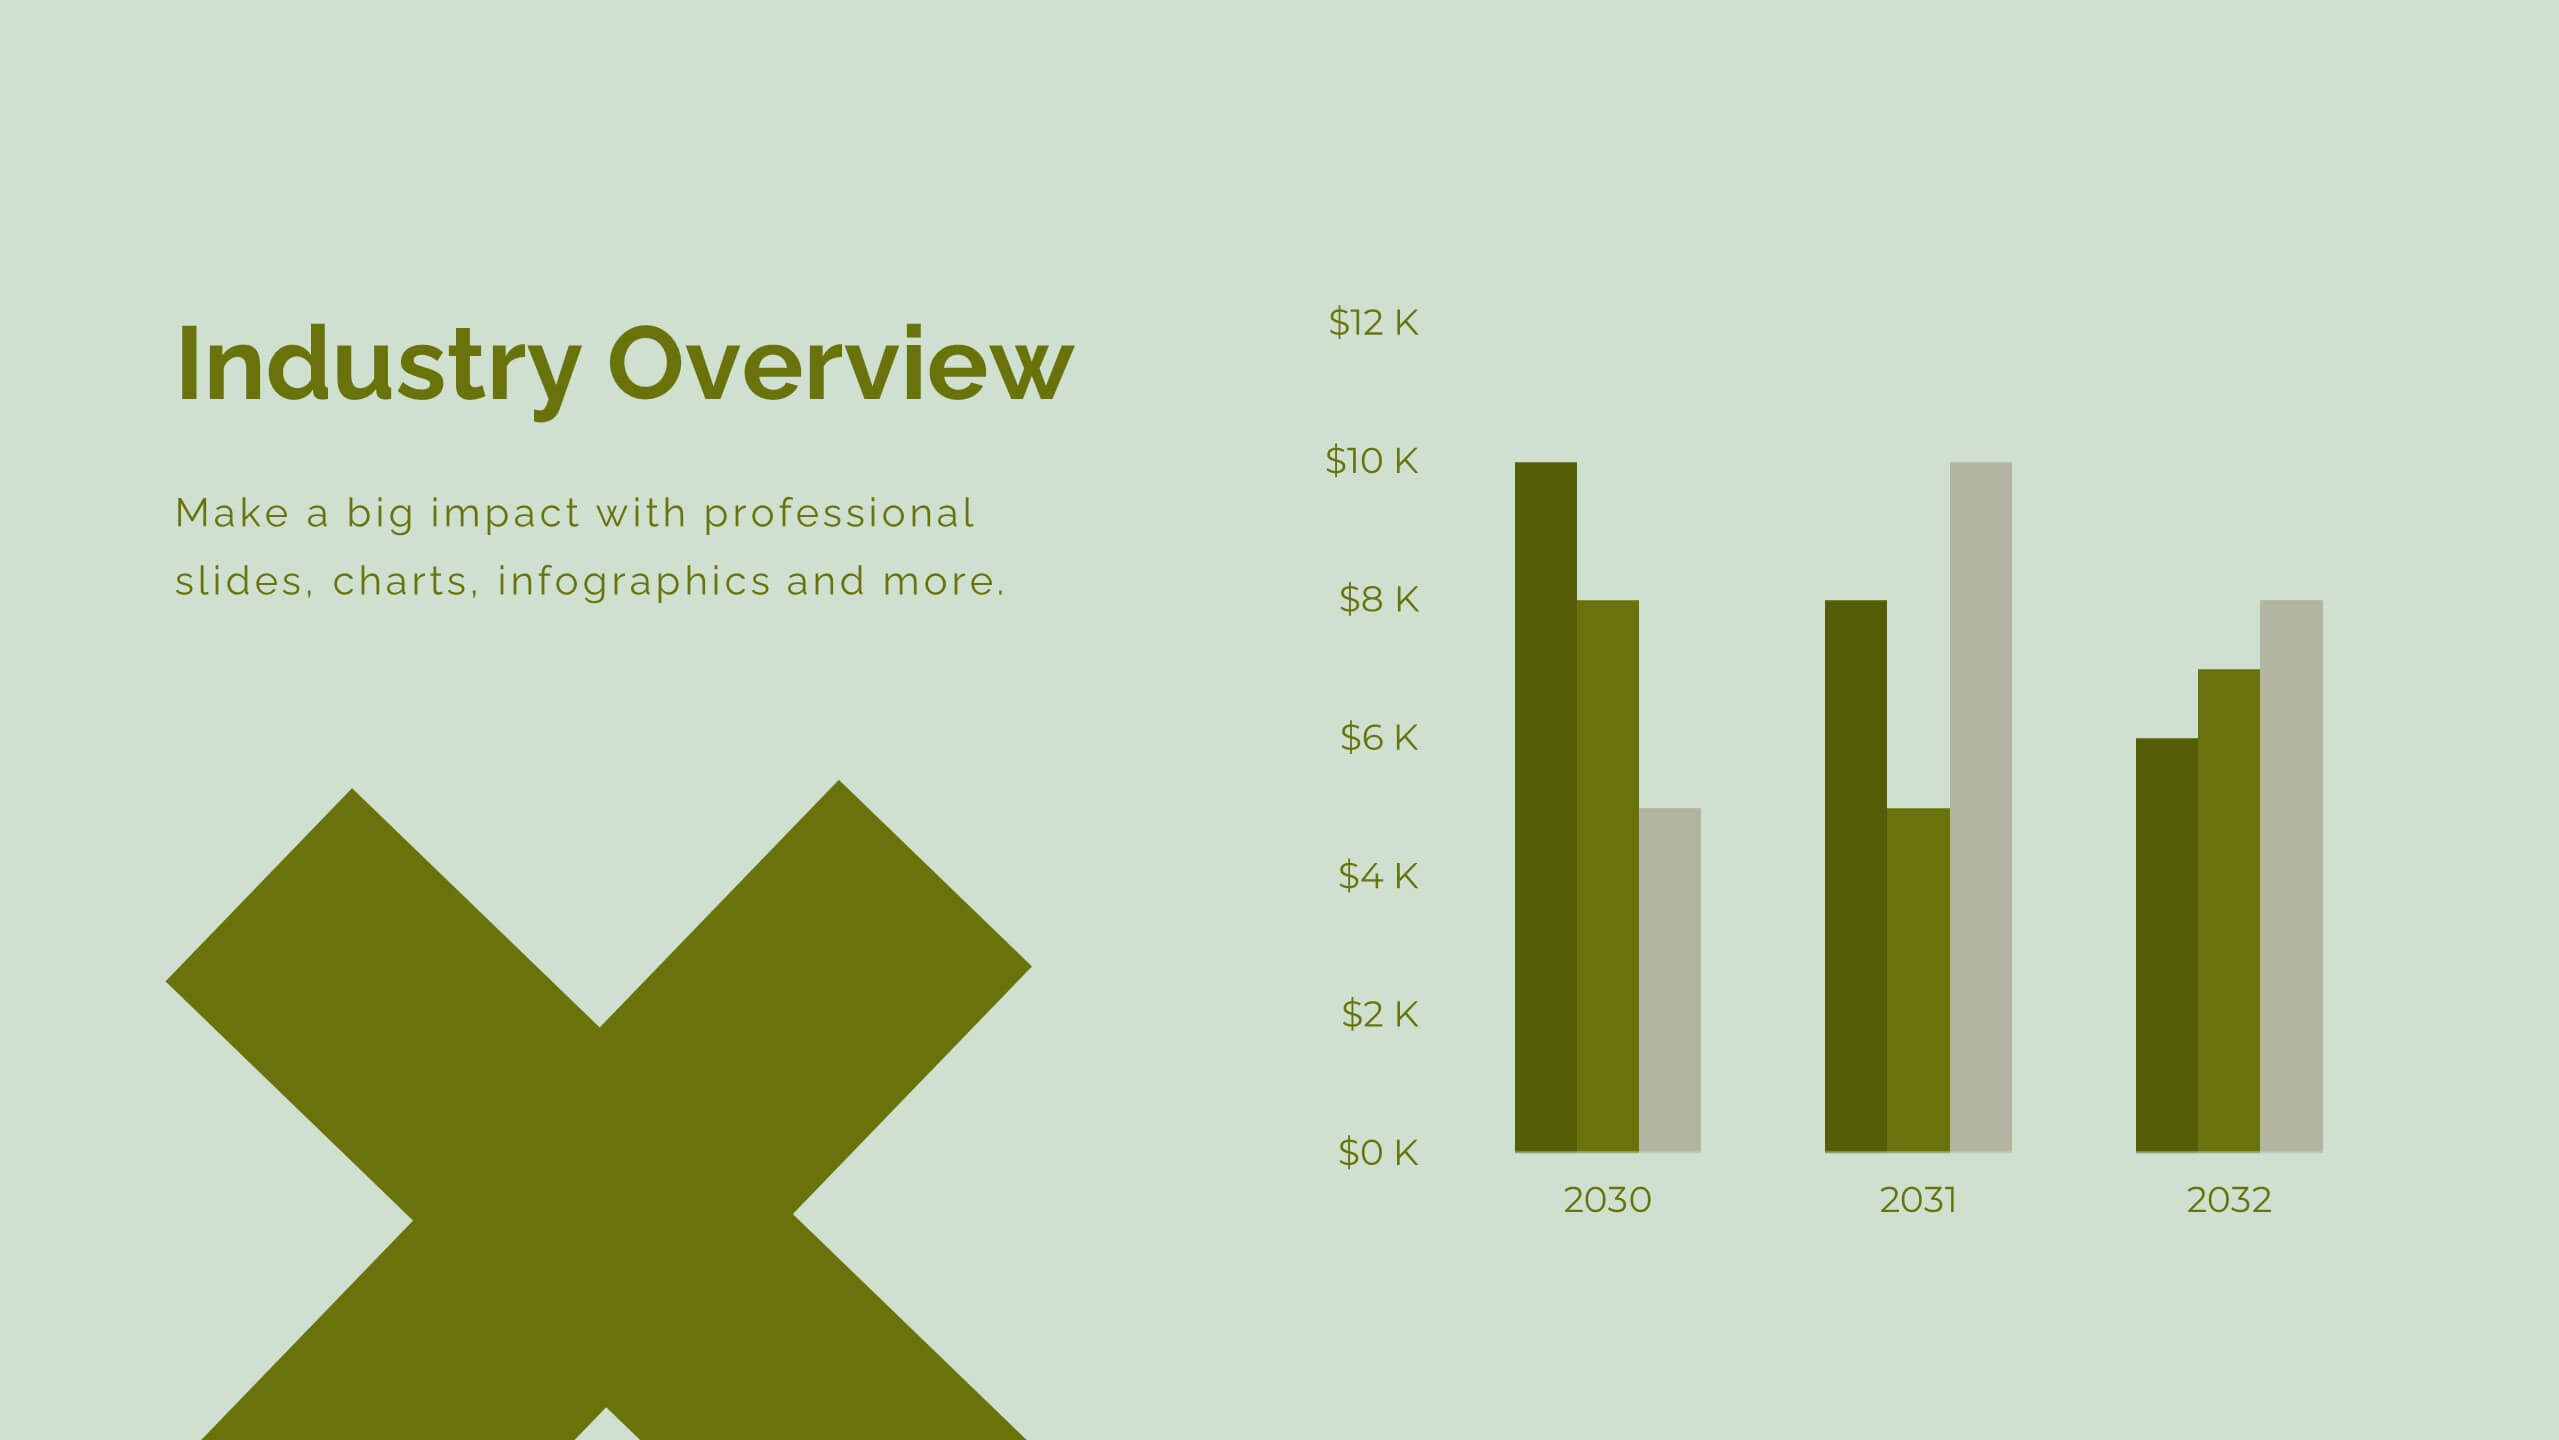
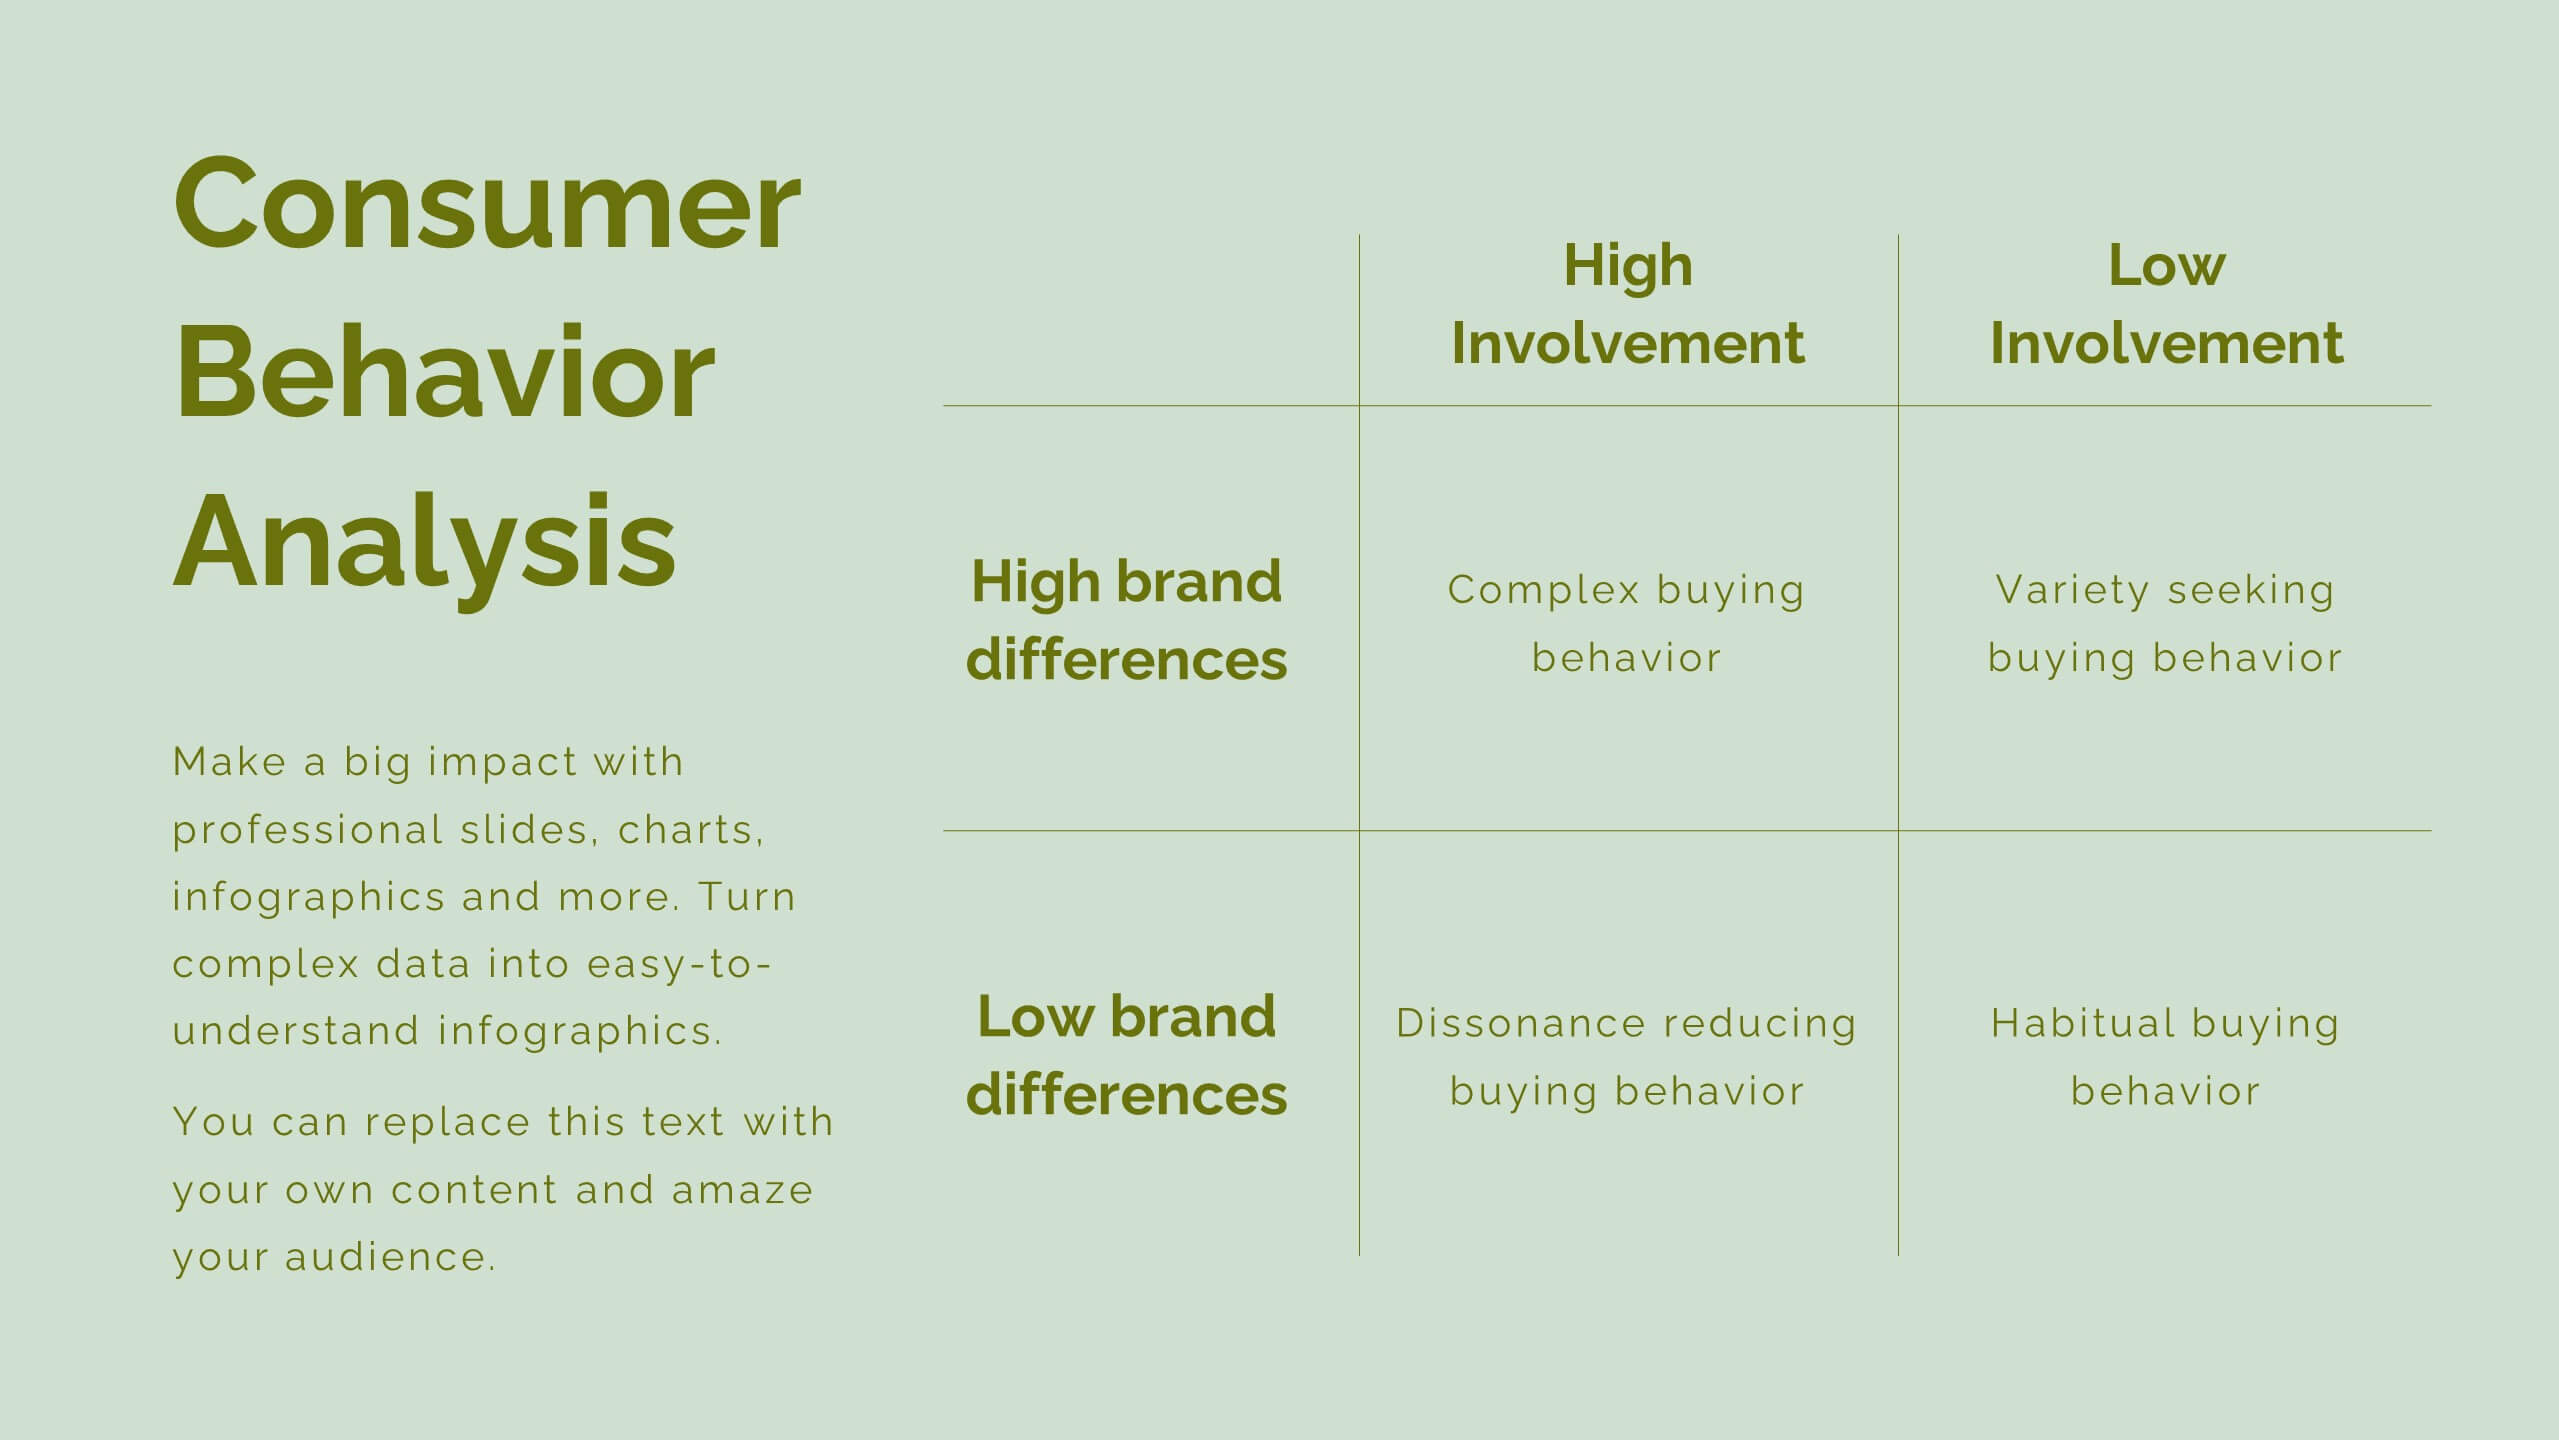
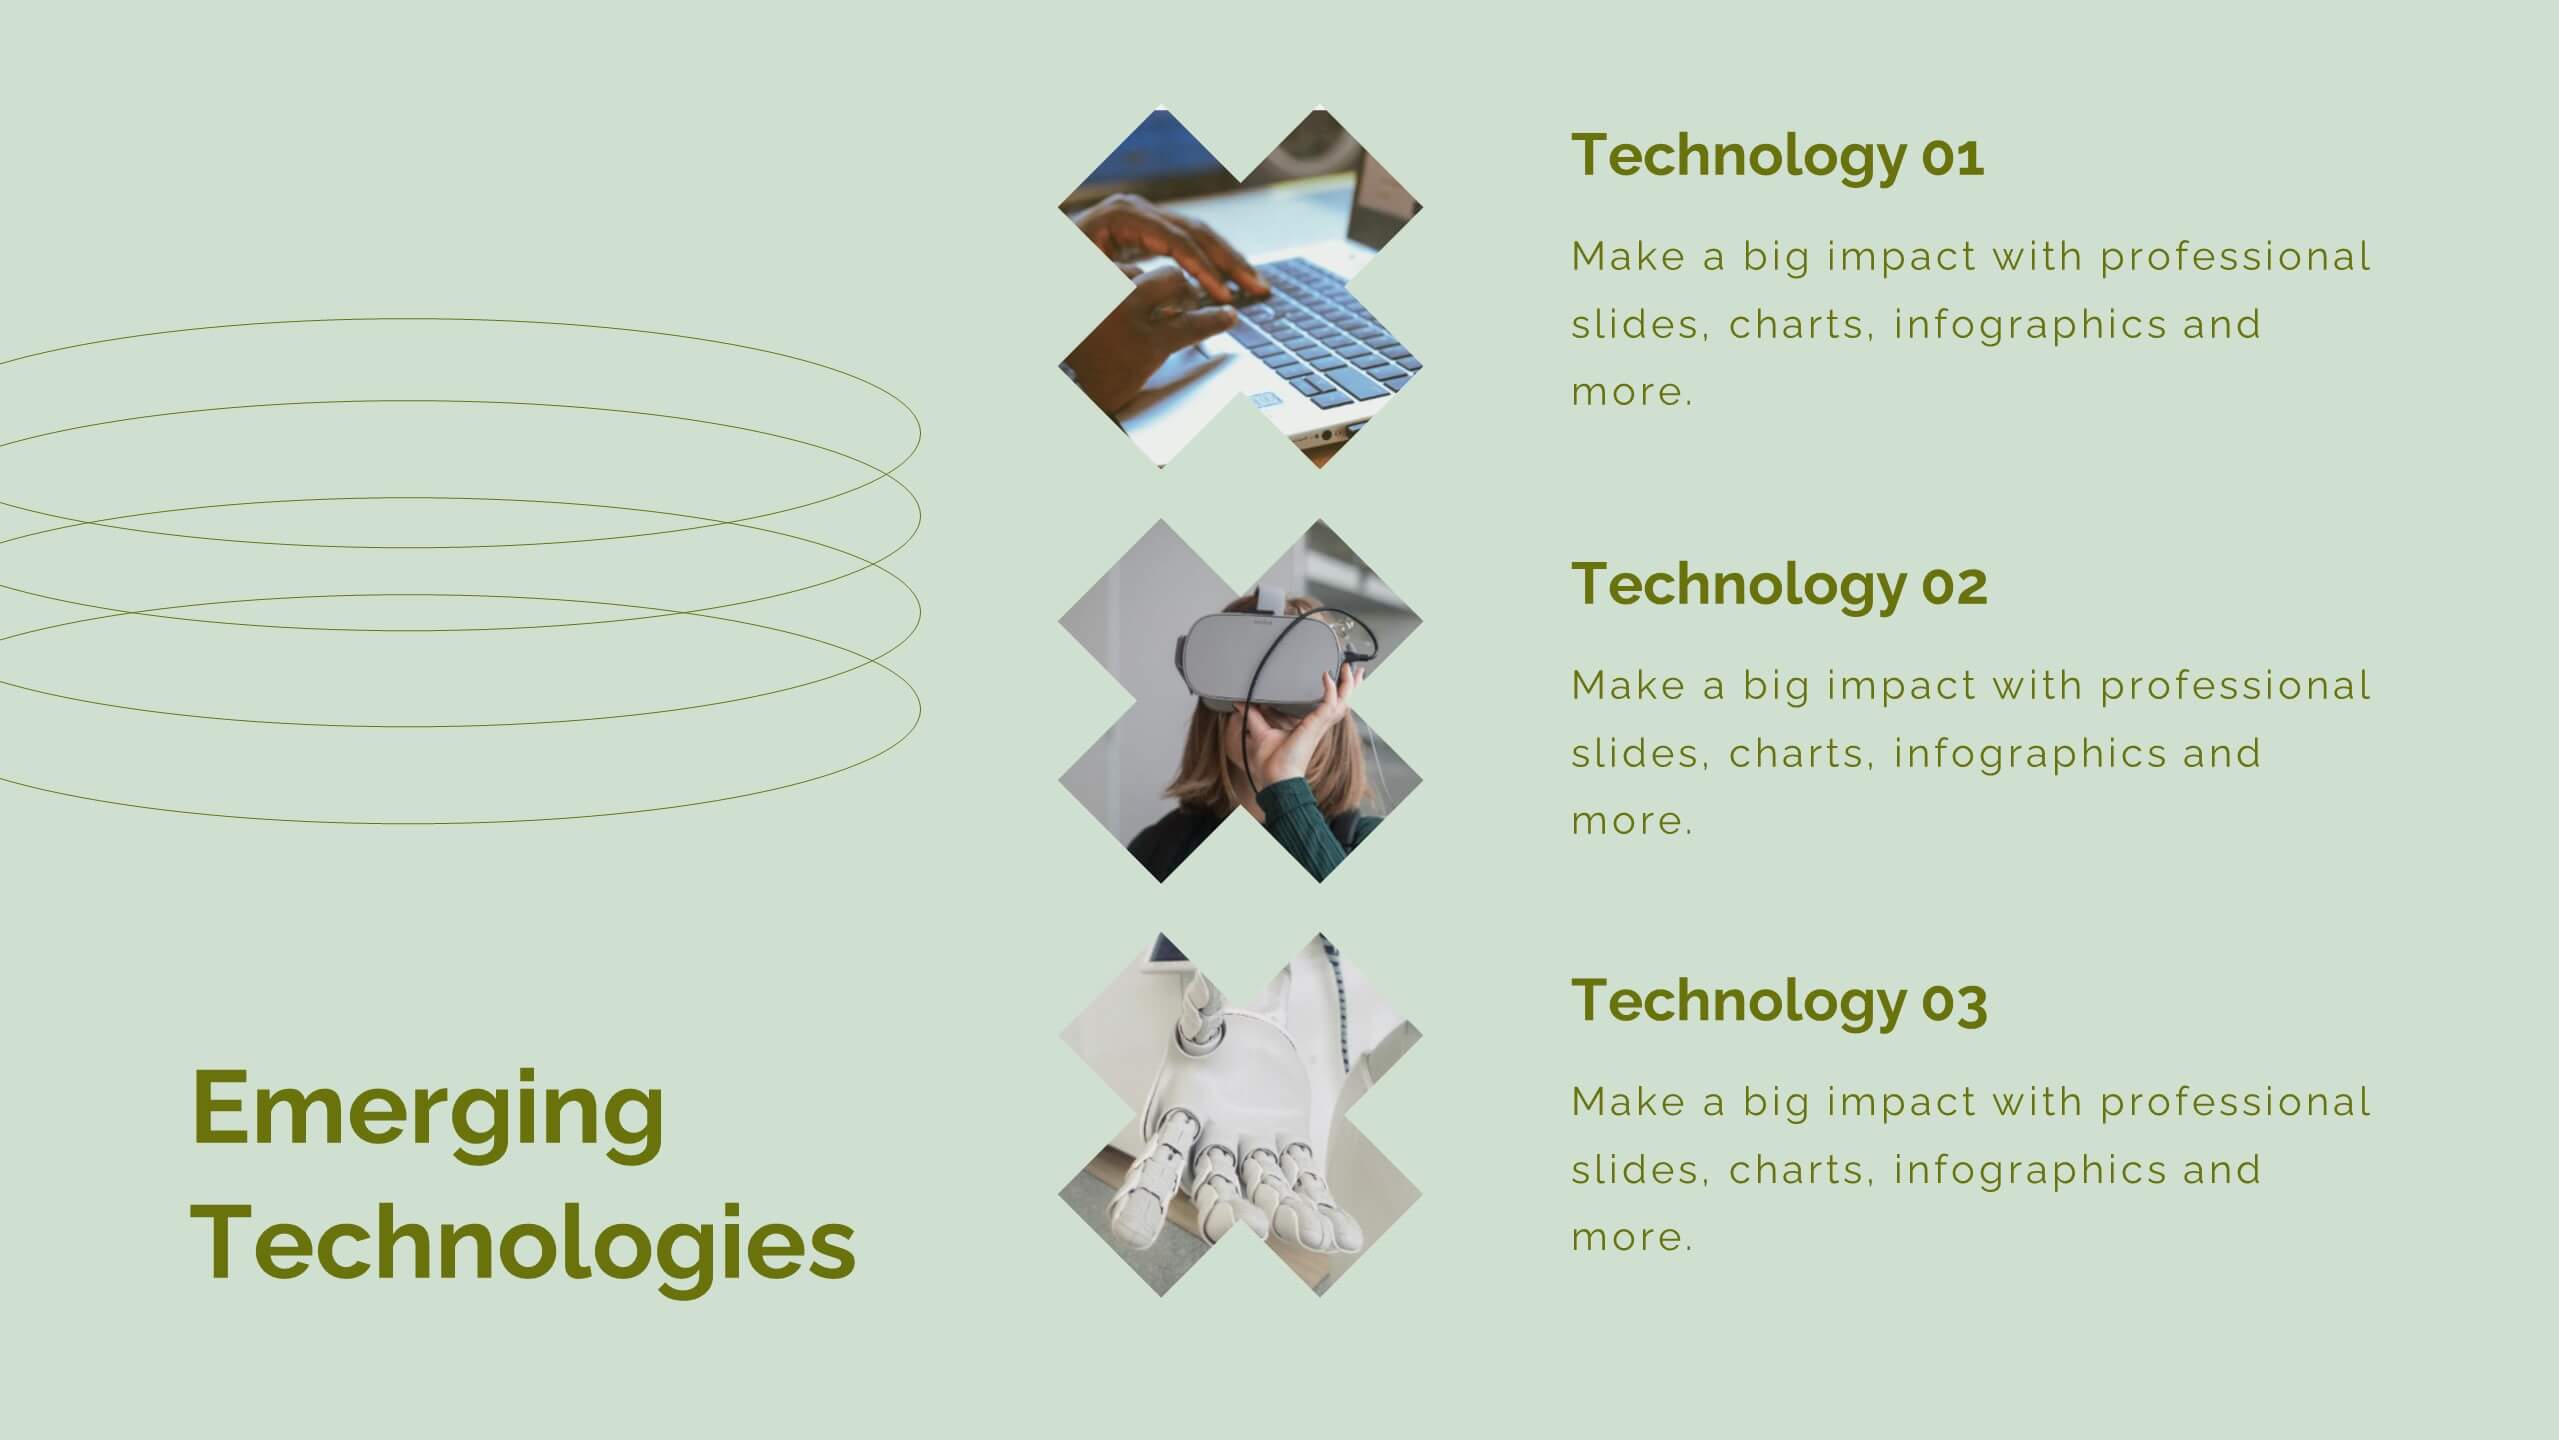
Revamp your digital marketing strategies with this dynamic template! Covering everything from industry overviews and consumer behavior analysis to emerging technologies and social media strategies, this template has it all. Perfect for creating compelling presentations that highlight data-driven marketing and brand storytelling. Compatible with PowerPoint, Keynote, and Google Slides.


20 slides
Astrolight Startup Growth Plan Presentation
A modern and vibrant presentation template tailored for startups. It includes slides for business models, growth plans, competitive analysis, and financial overviews. The visually appealing layout ensures clarity and impact for stakeholders. Fully customizable and compatible with PowerPoint, Keynote, and Google Slides for seamless adaptability.


26 slides
Business Ethics and Compliance Presentation
Navigate the crucial topics of business ethics and compliance with this professionally designed presentation template. The clean, corporate aesthetic, dominated by a palette of cool blues and grays, underscores the importance of transparency and integrity in the business world. Ideal for corporate trainers, compliance officers, or business consultants, the template offers a structured approach to discussing ethical practices and regulatory standards. With a mix of charts, diagrams, and bullet points, it allows for detailed explanations of policies, case studies of ethical dilemmas, and the benefits of compliance. Each slide is a step towards building a culture of trust and accountability within an organization, making it a key resource for any business-focused presentation. Adapted for use across PowerPoint, Keynote, and Google Slides, it's crafted to facilitate a clear and impactful delivery of essential business principles.


6 slides
Root Cause Analysis of Key Problems Presentation
Get to the heart of business issues with this Root Cause Analysis of Key Problems presentation. This template helps you break down complex challenges into actionable components: Who, What, When, Where, Why, and How. Clean, color-coded arrows ensure clarity. Ideal for strategic reviews and process optimization. Fully editable in Canva, PowerPoint, and Google Slides.


5 slides
Business Opportunity in Europe Map Presentation
Identify key growth areas across Europe with this clean, data-driven presentation. Highlight business potential using country-based color coding and progress indicators. Perfect for market analysis, investment pitches, or strategic expansion reports. Fully editable and compatible with PowerPoint, Keynote, and Google Slides for effortless customization and professional presentation delivery.

23 slides
Mirage Digital Strategy Presentation
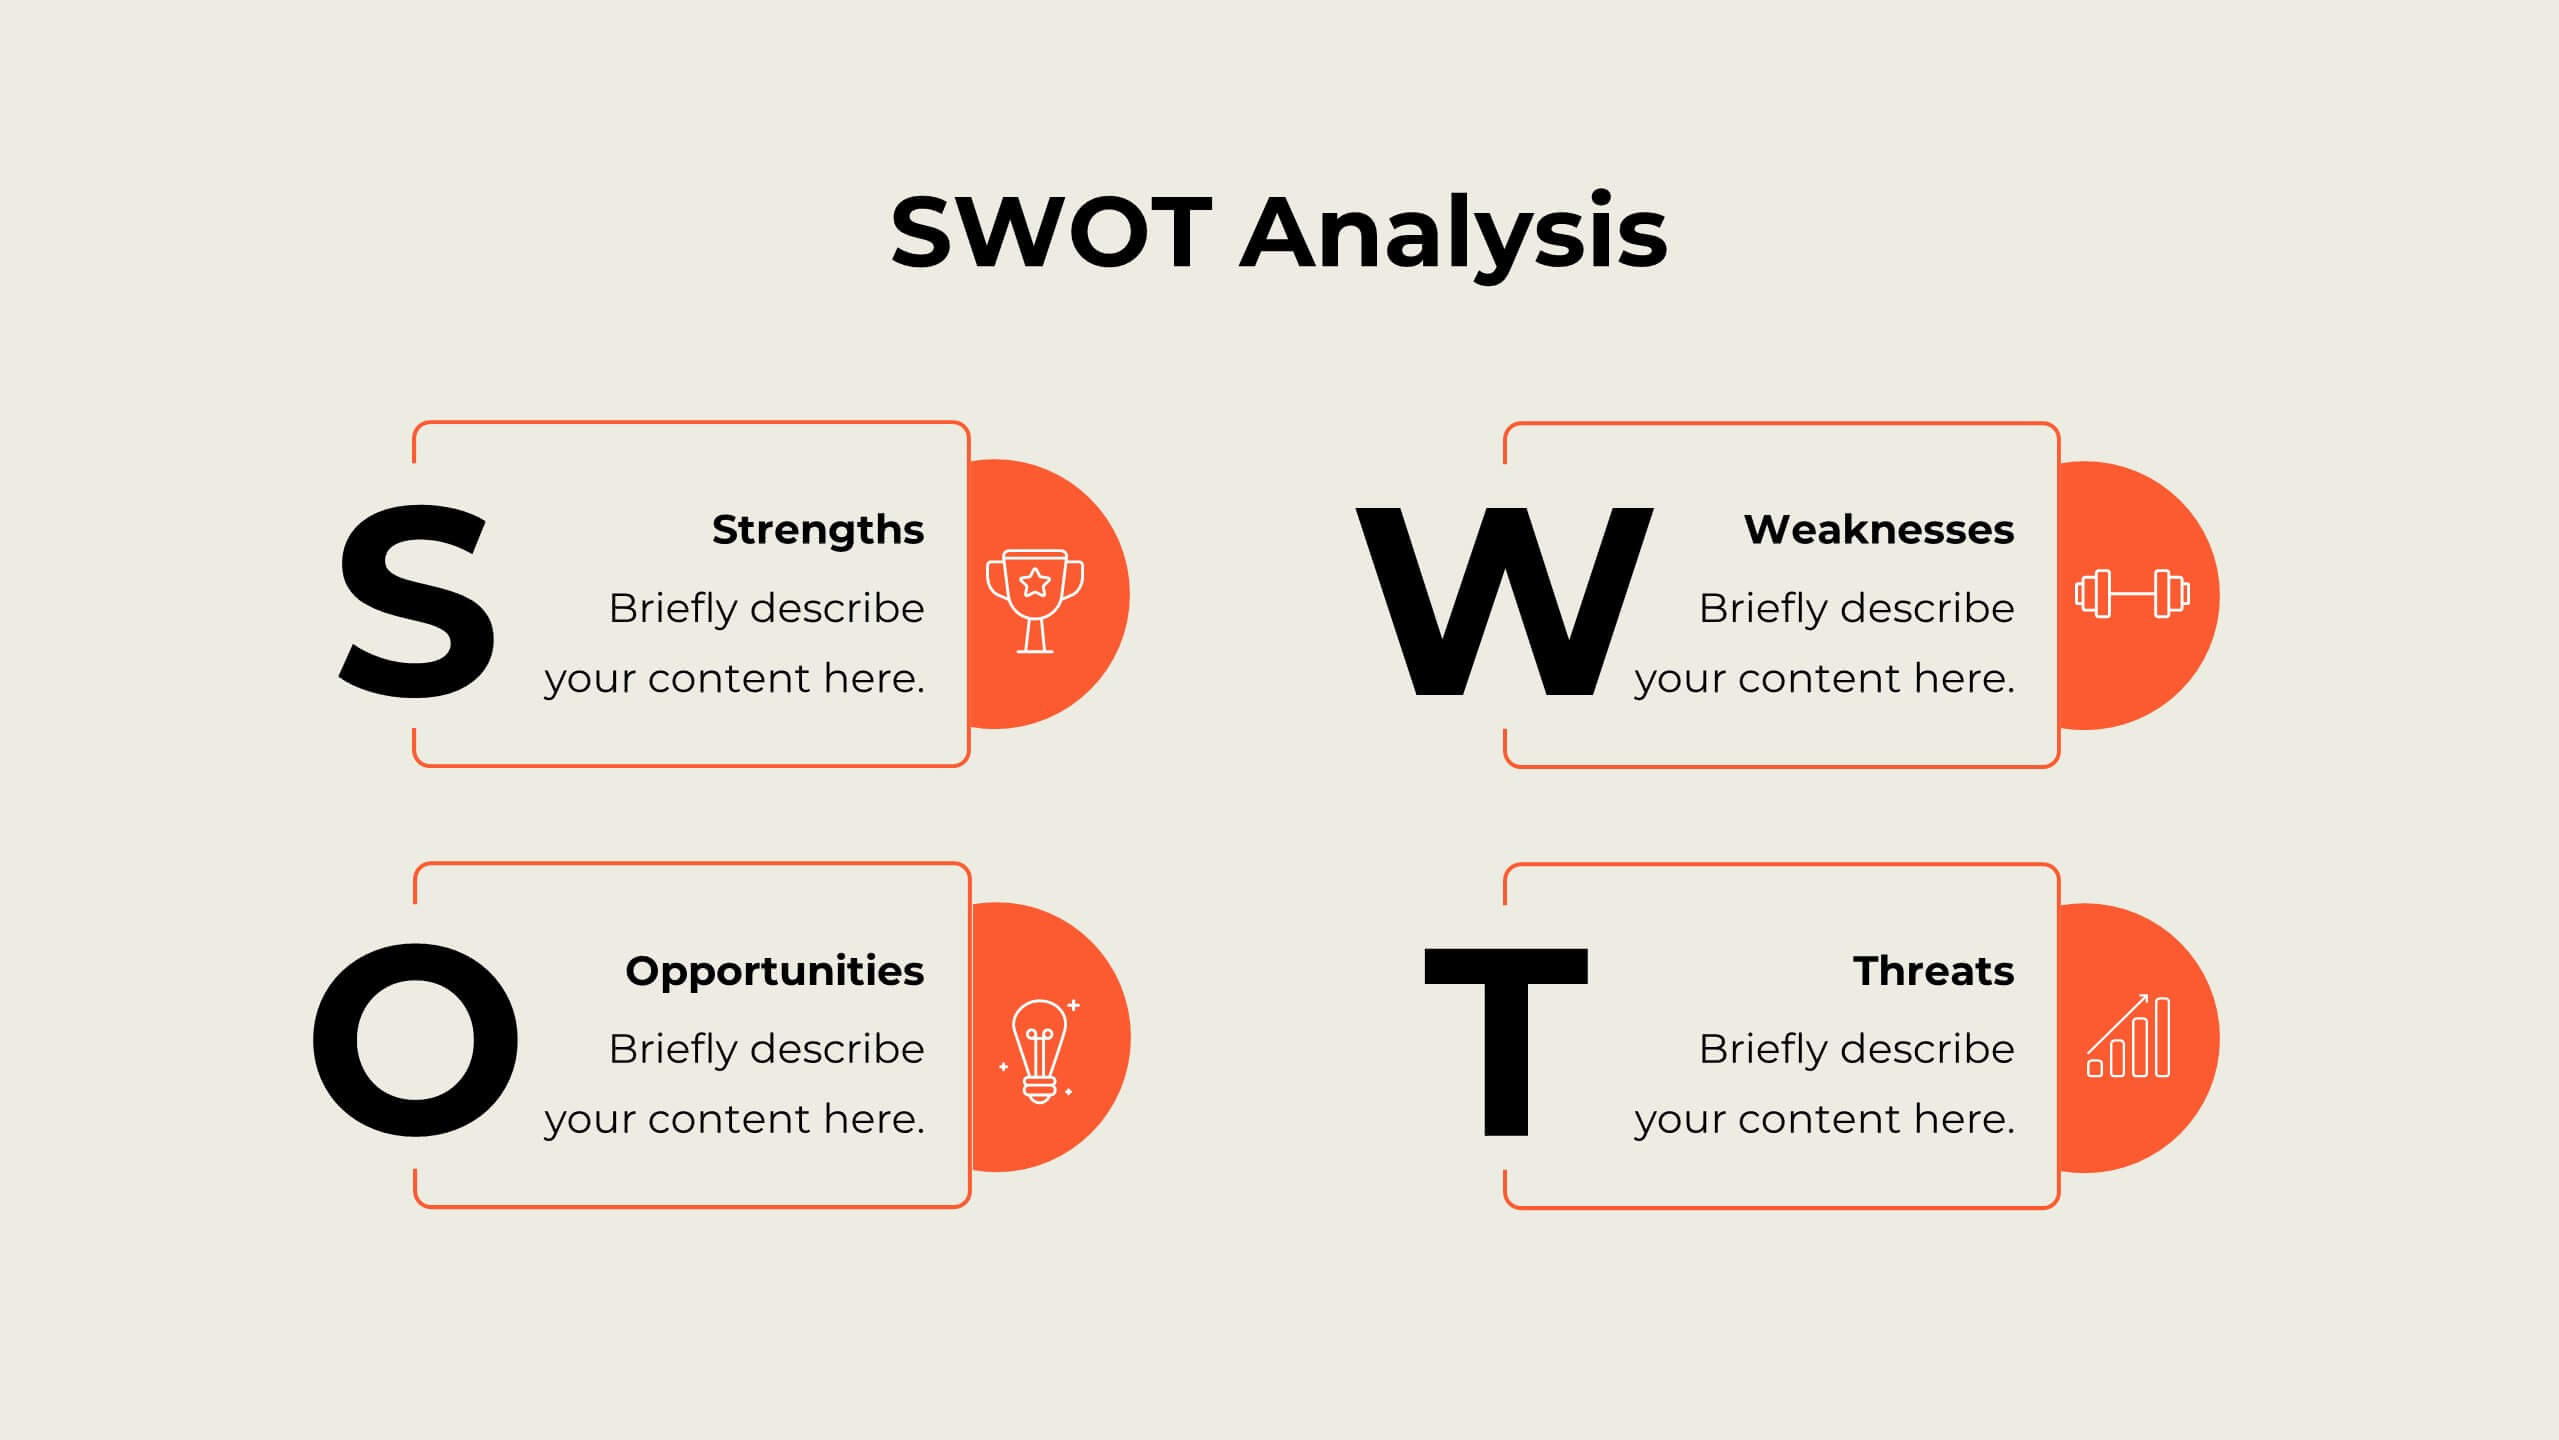
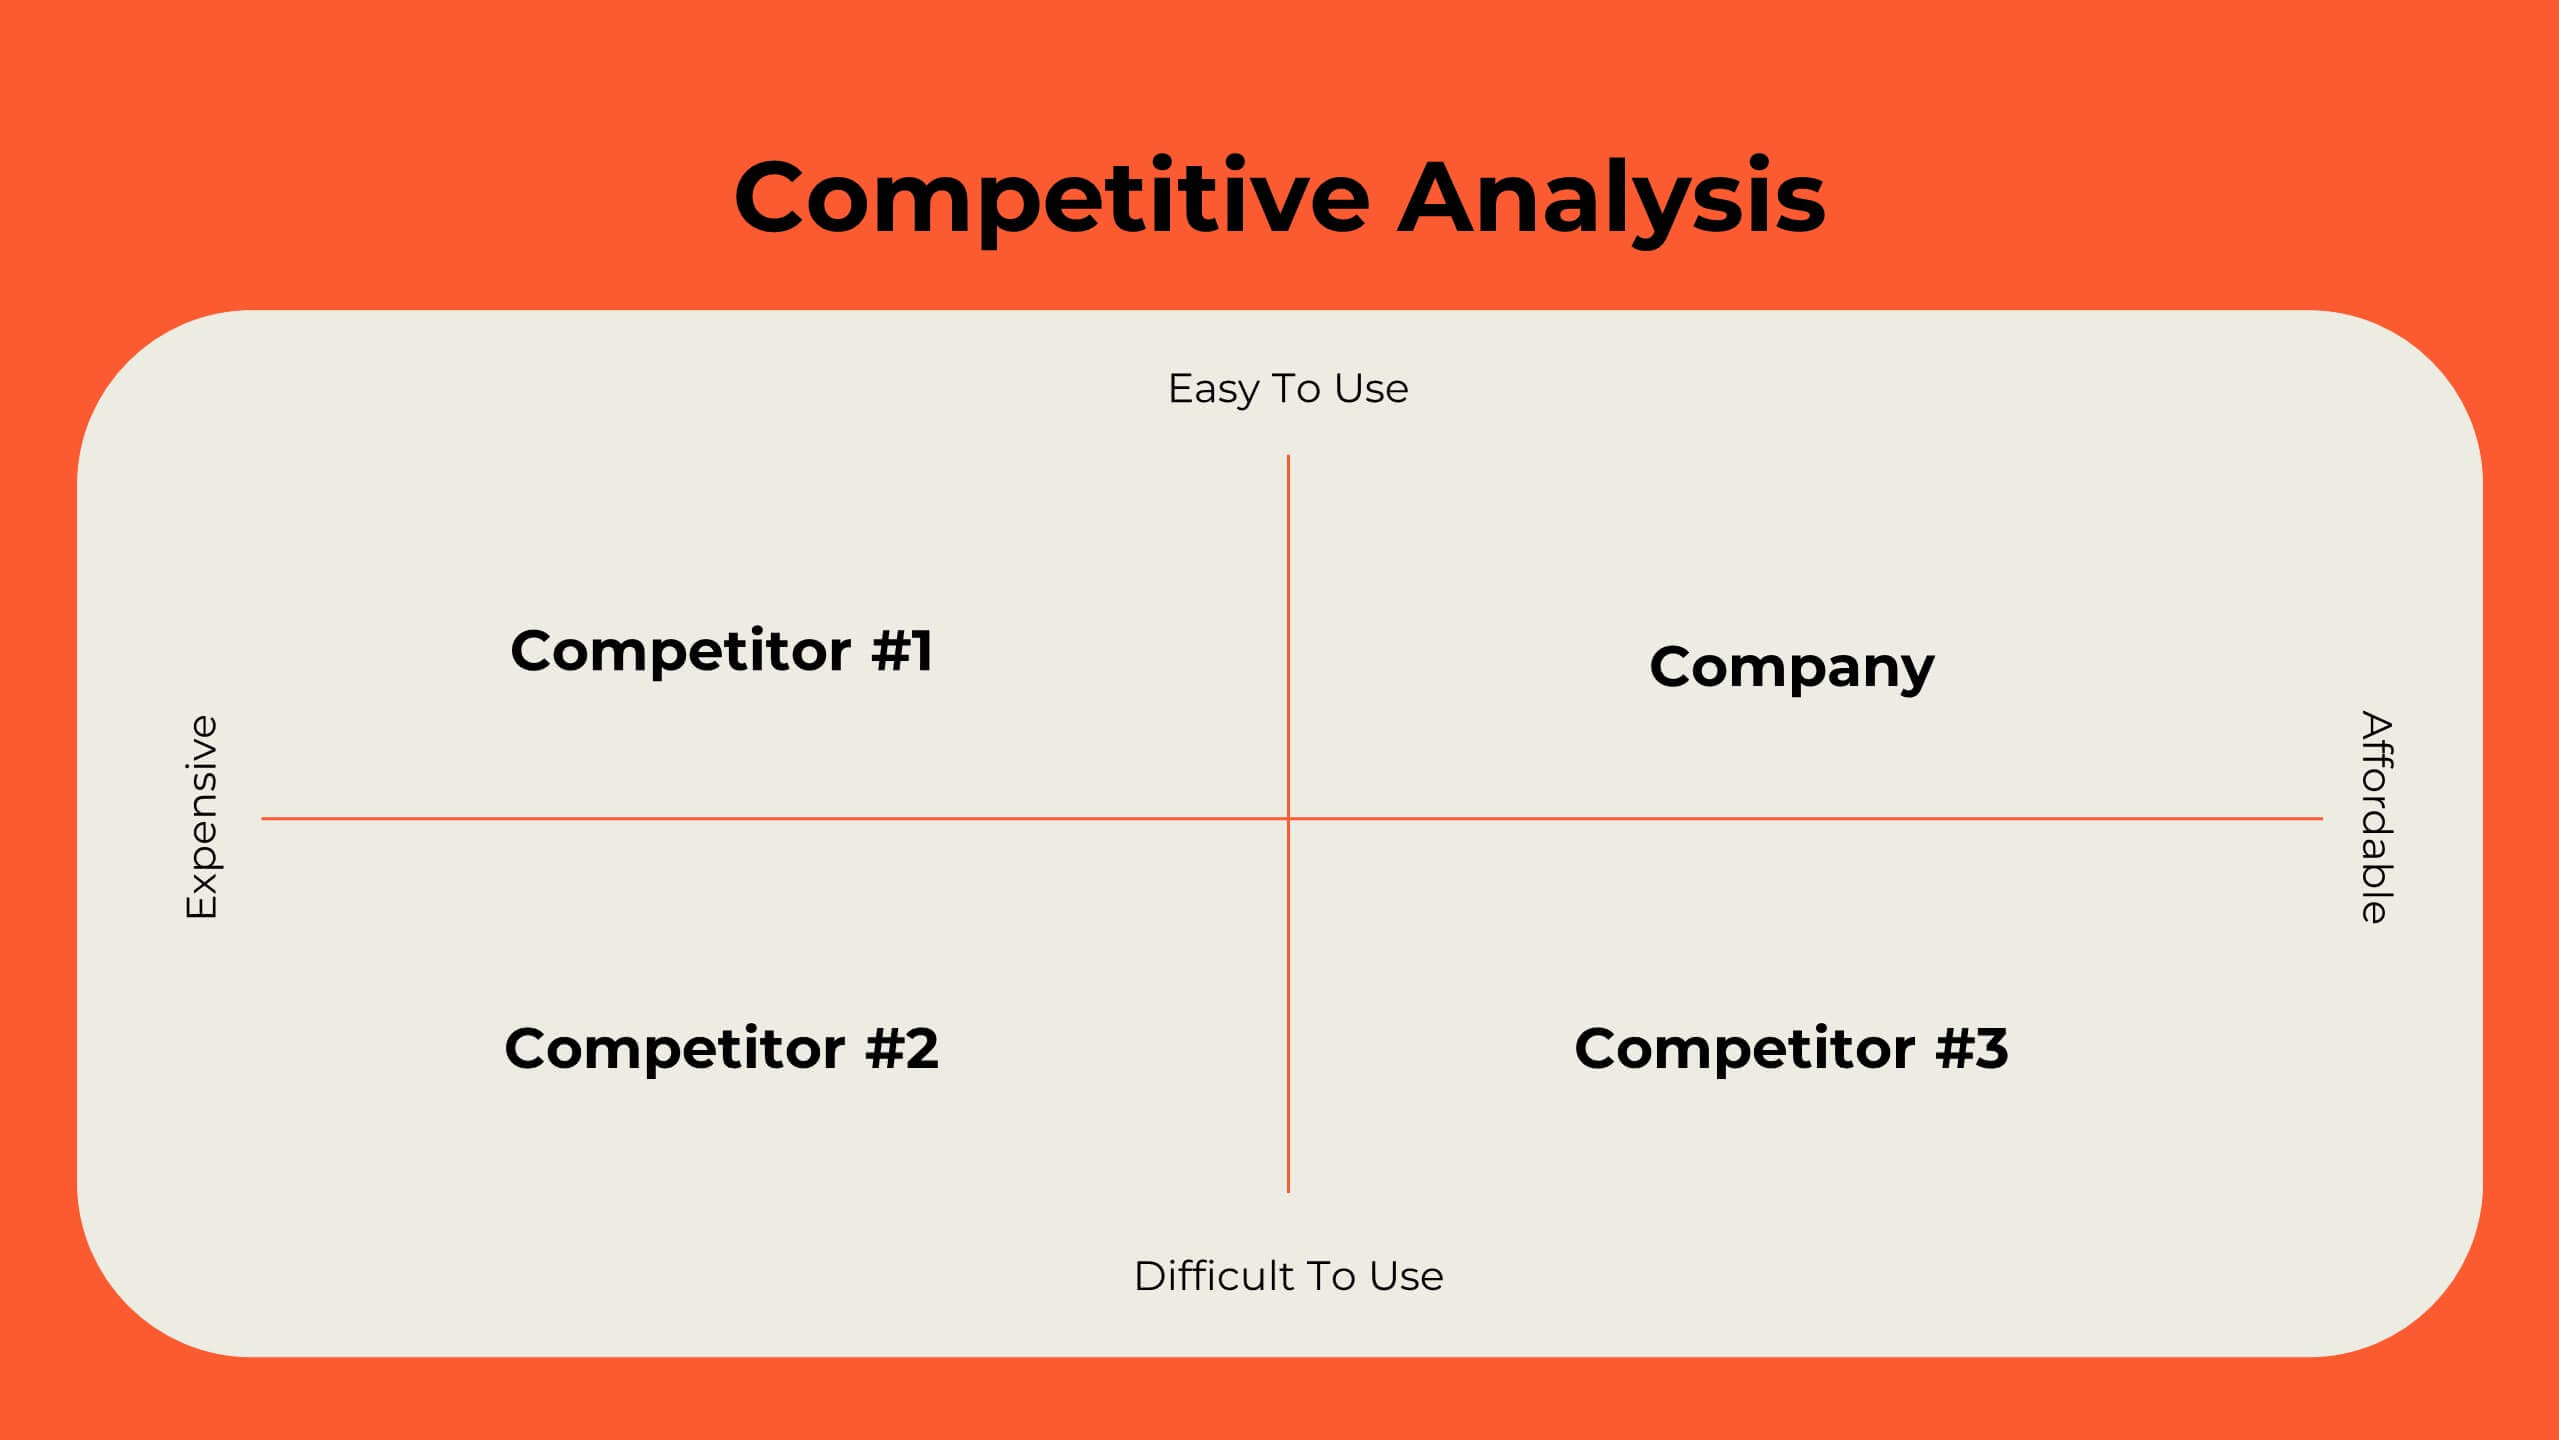
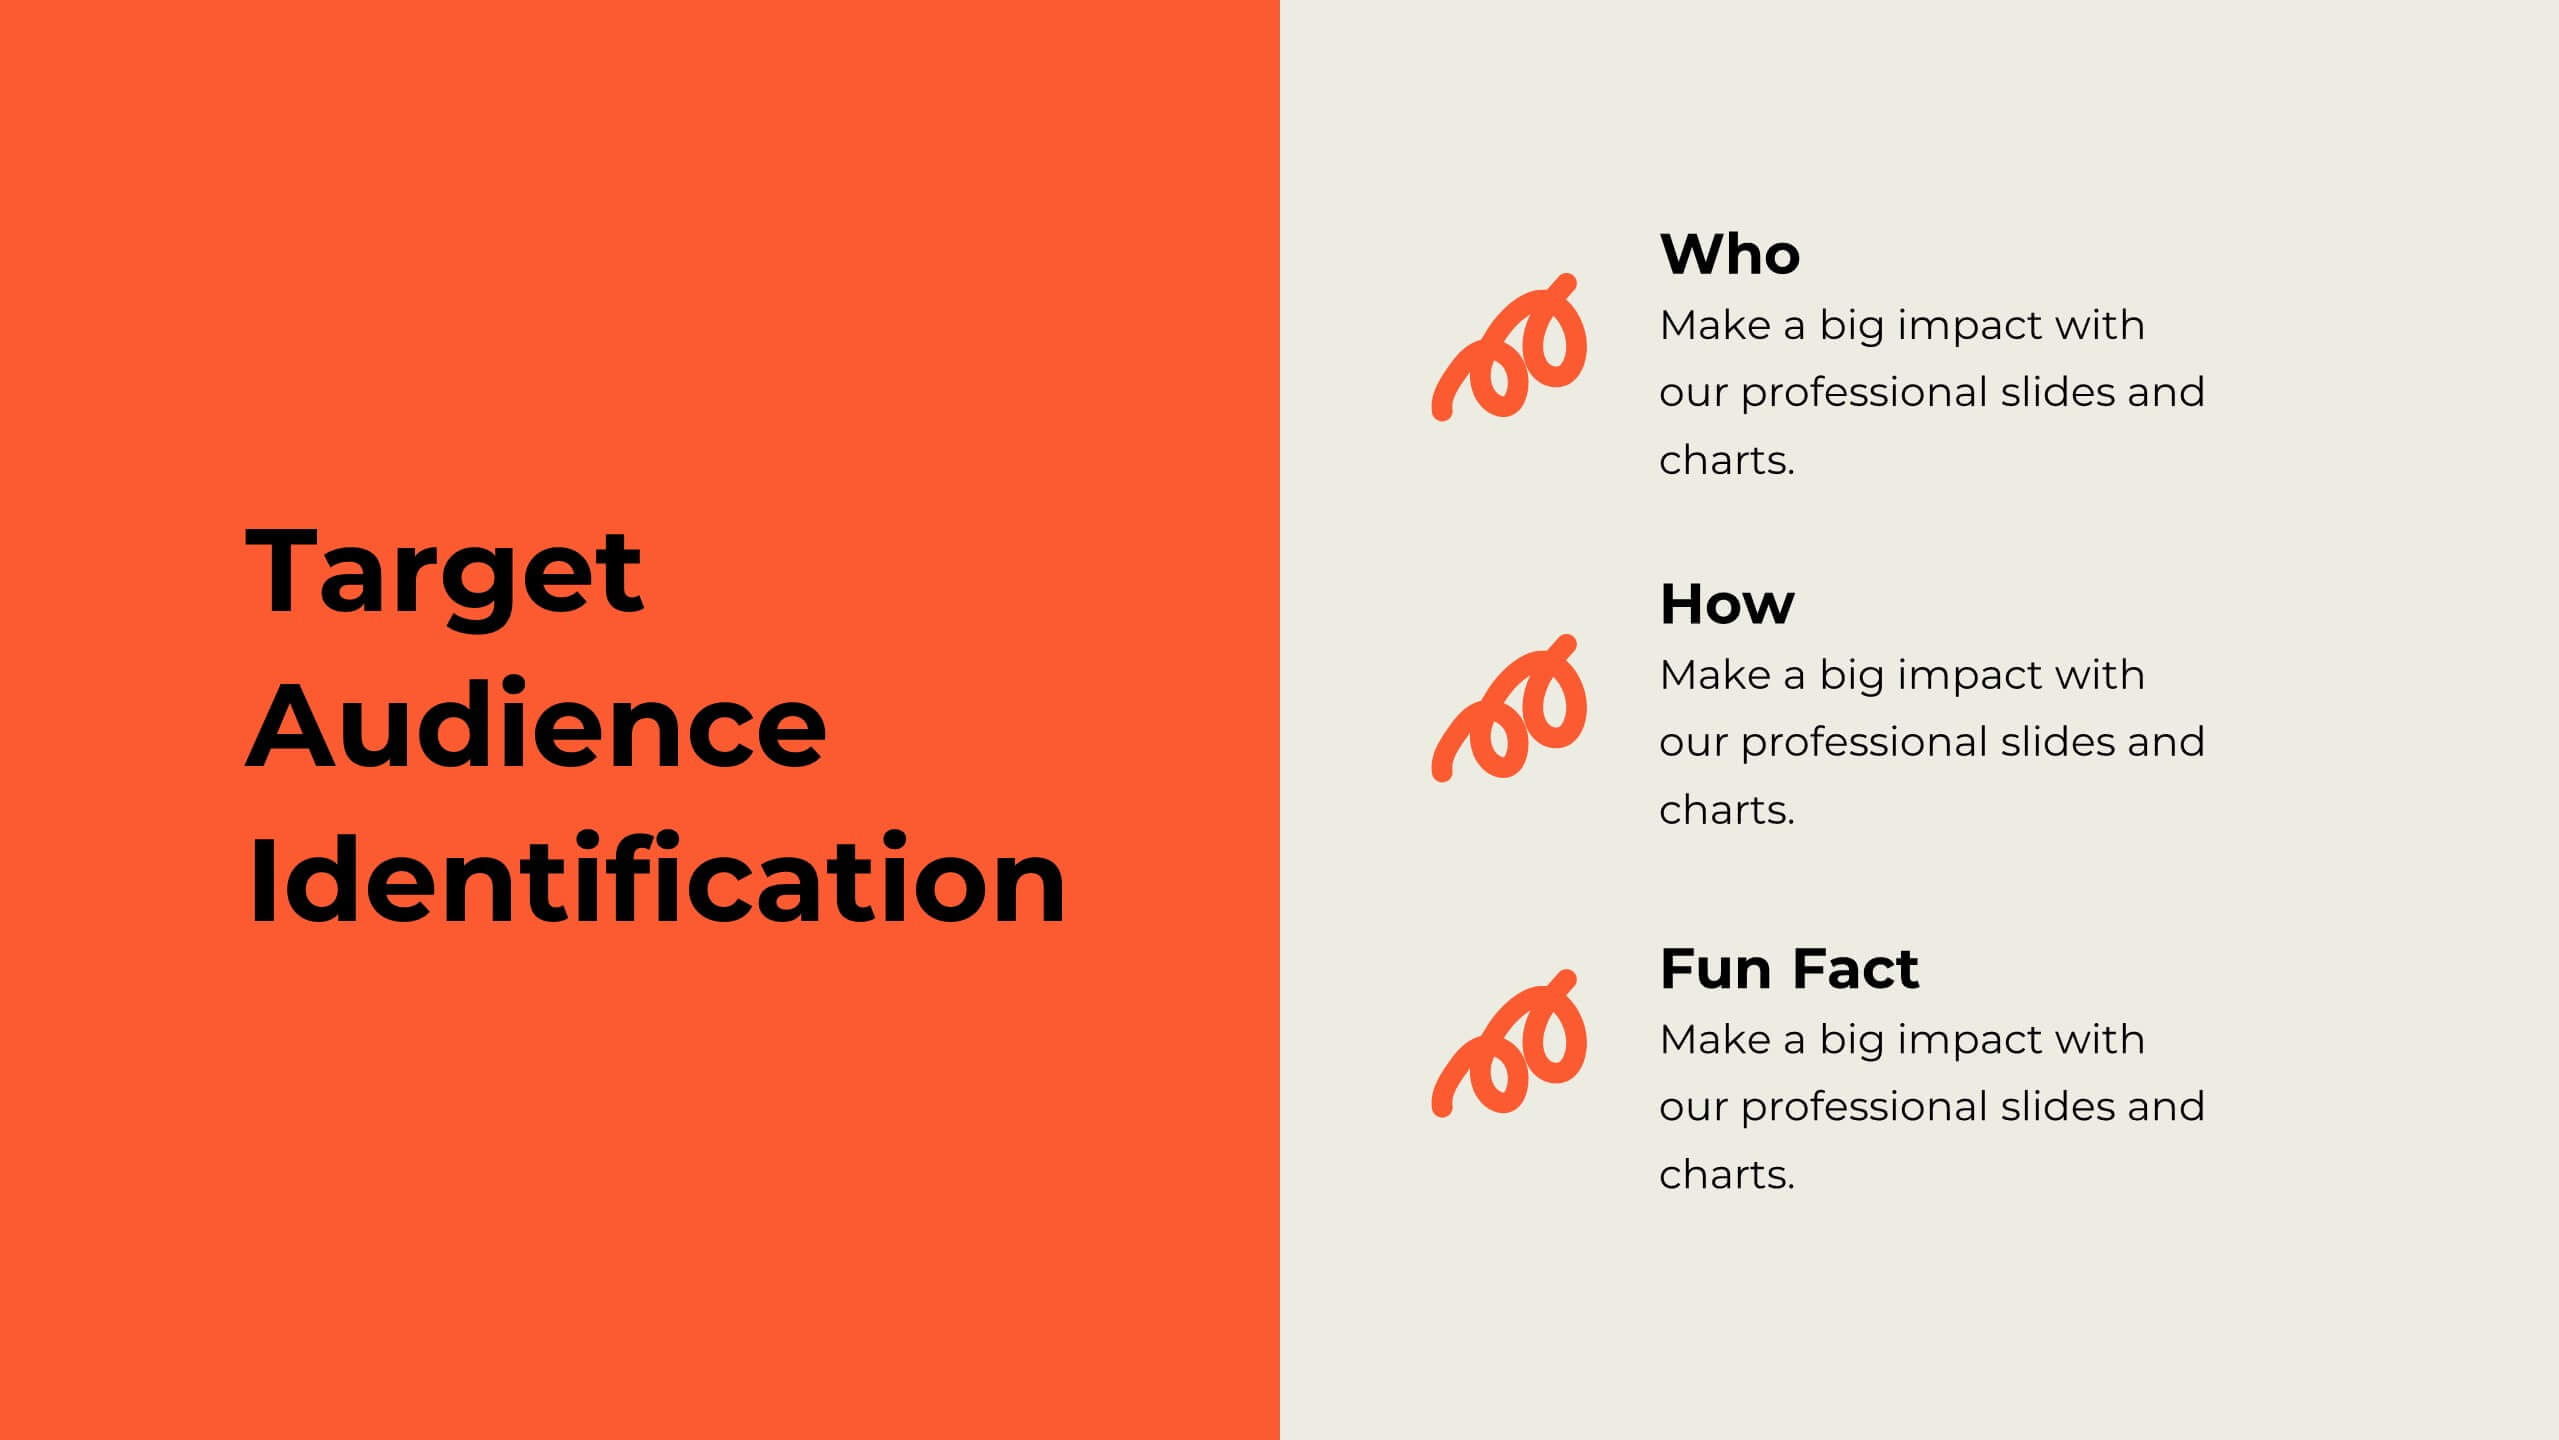
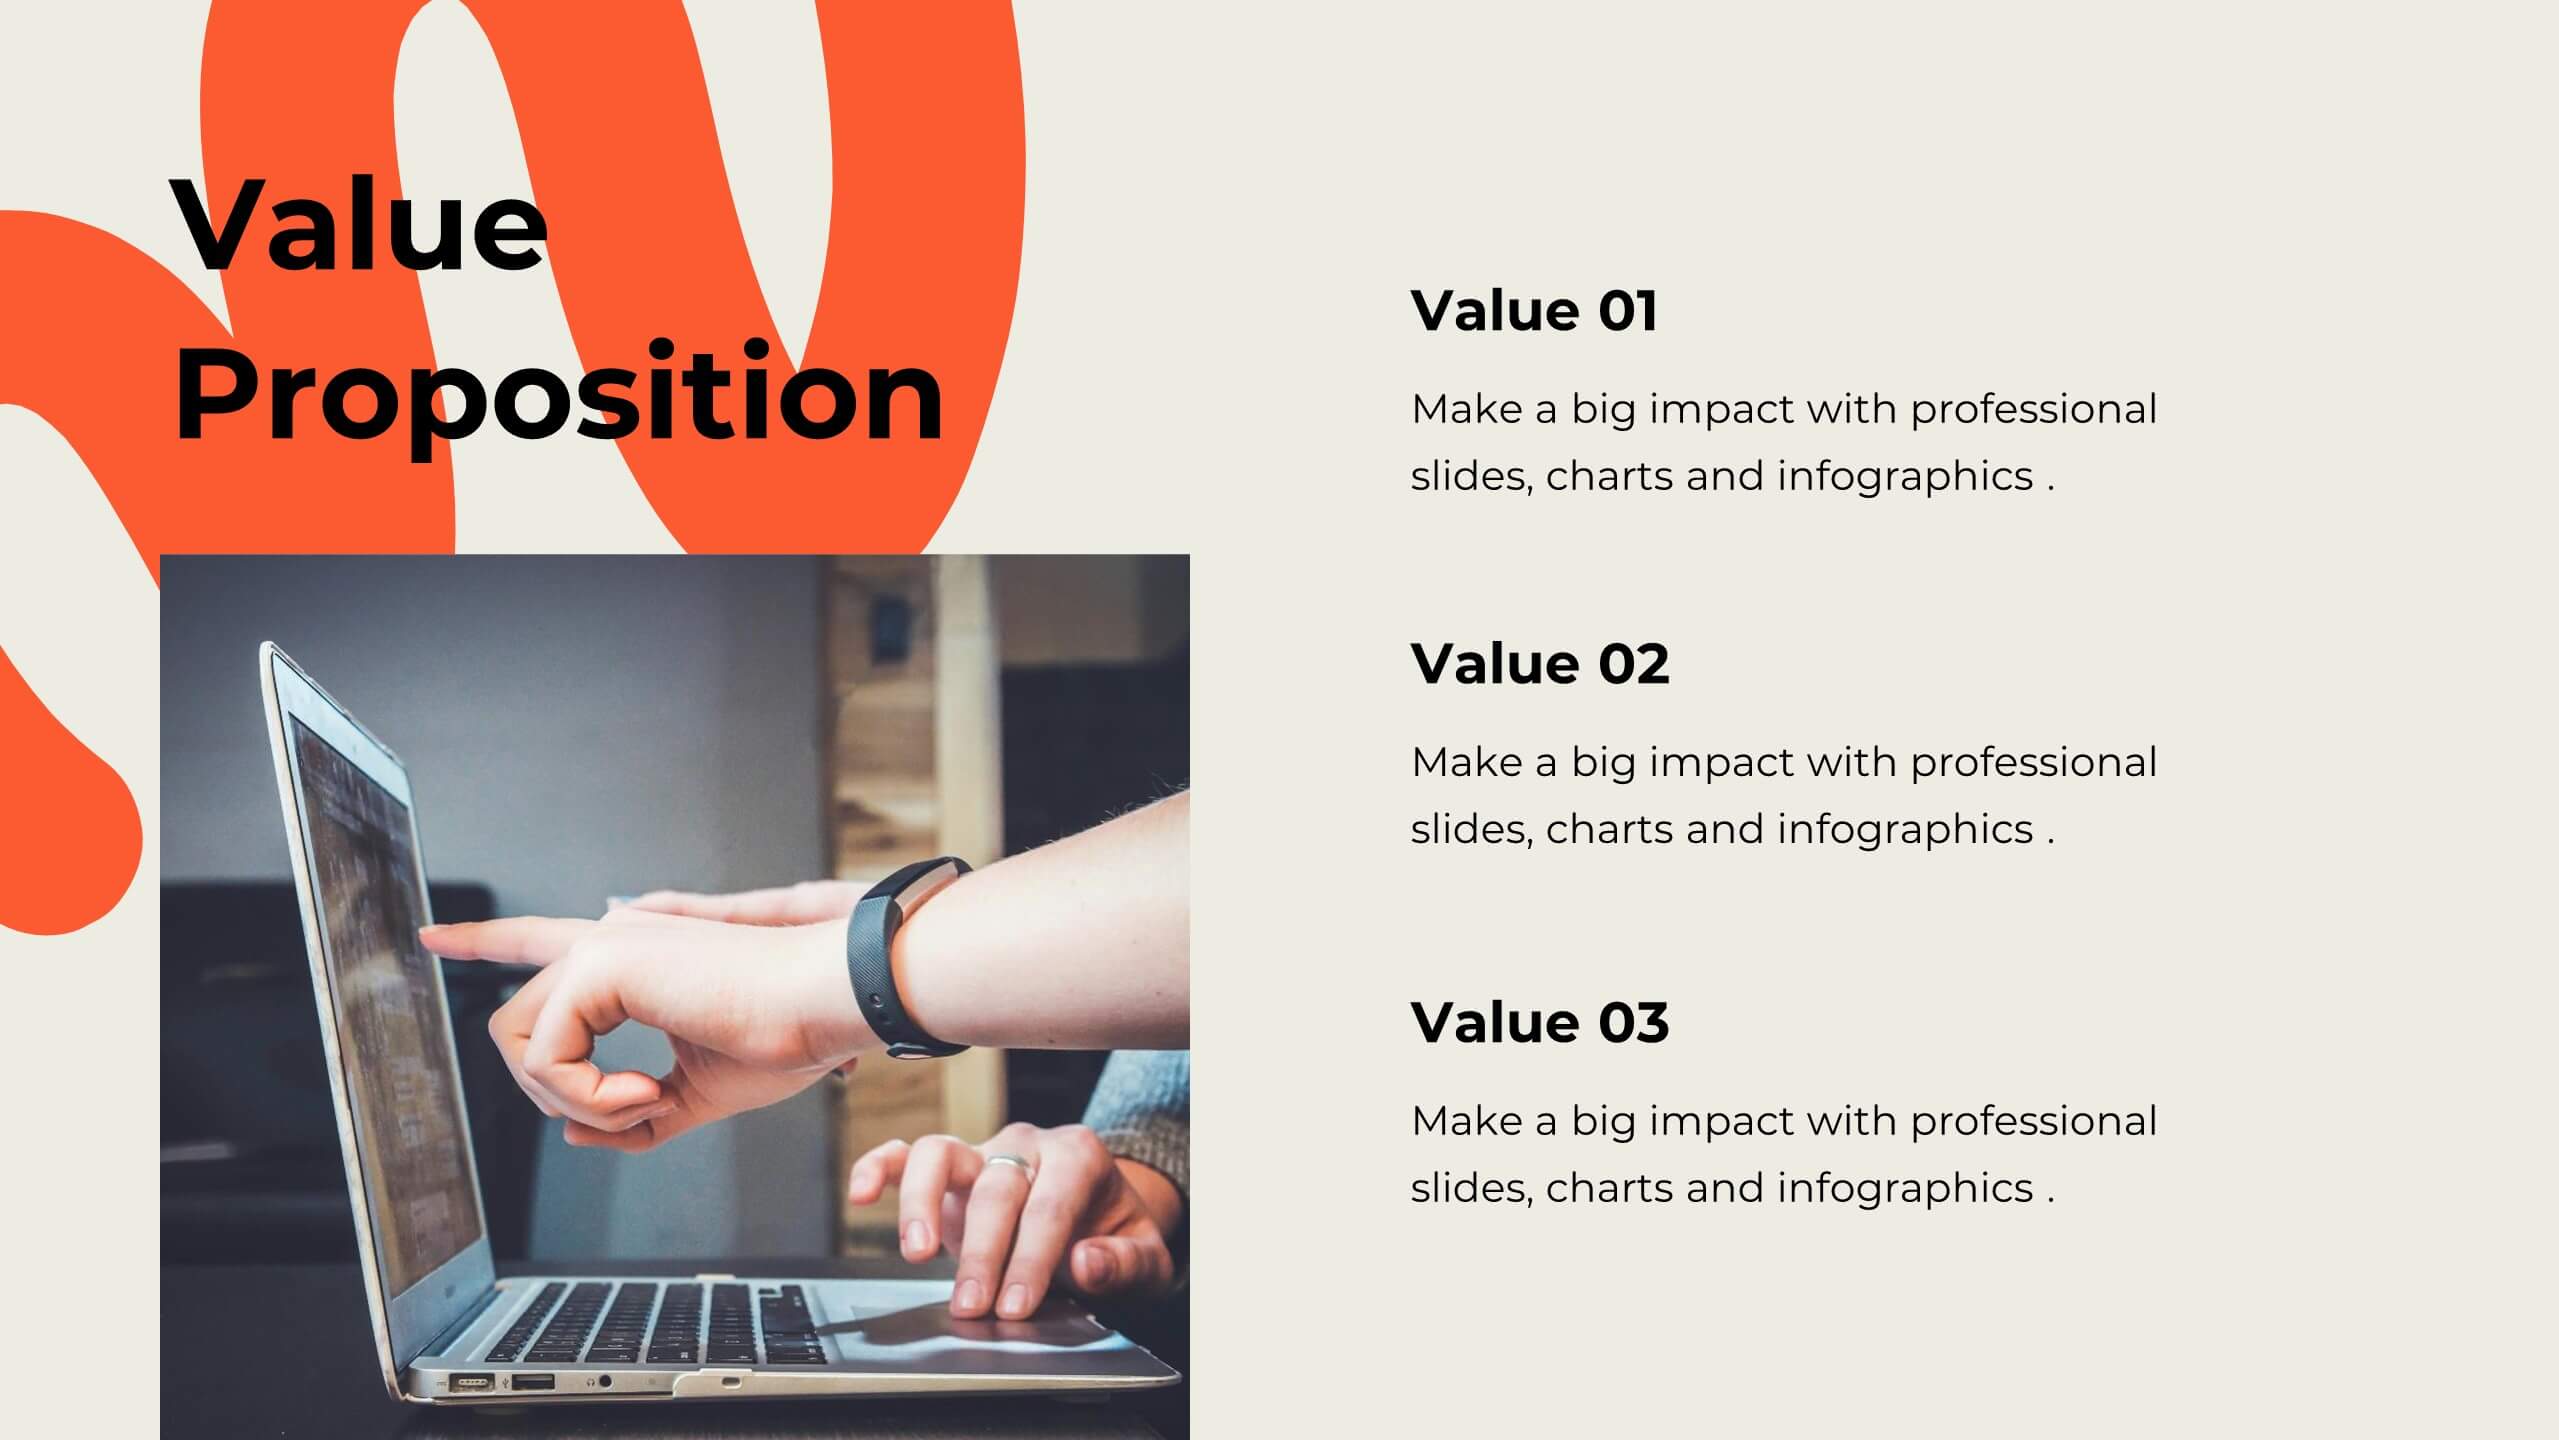
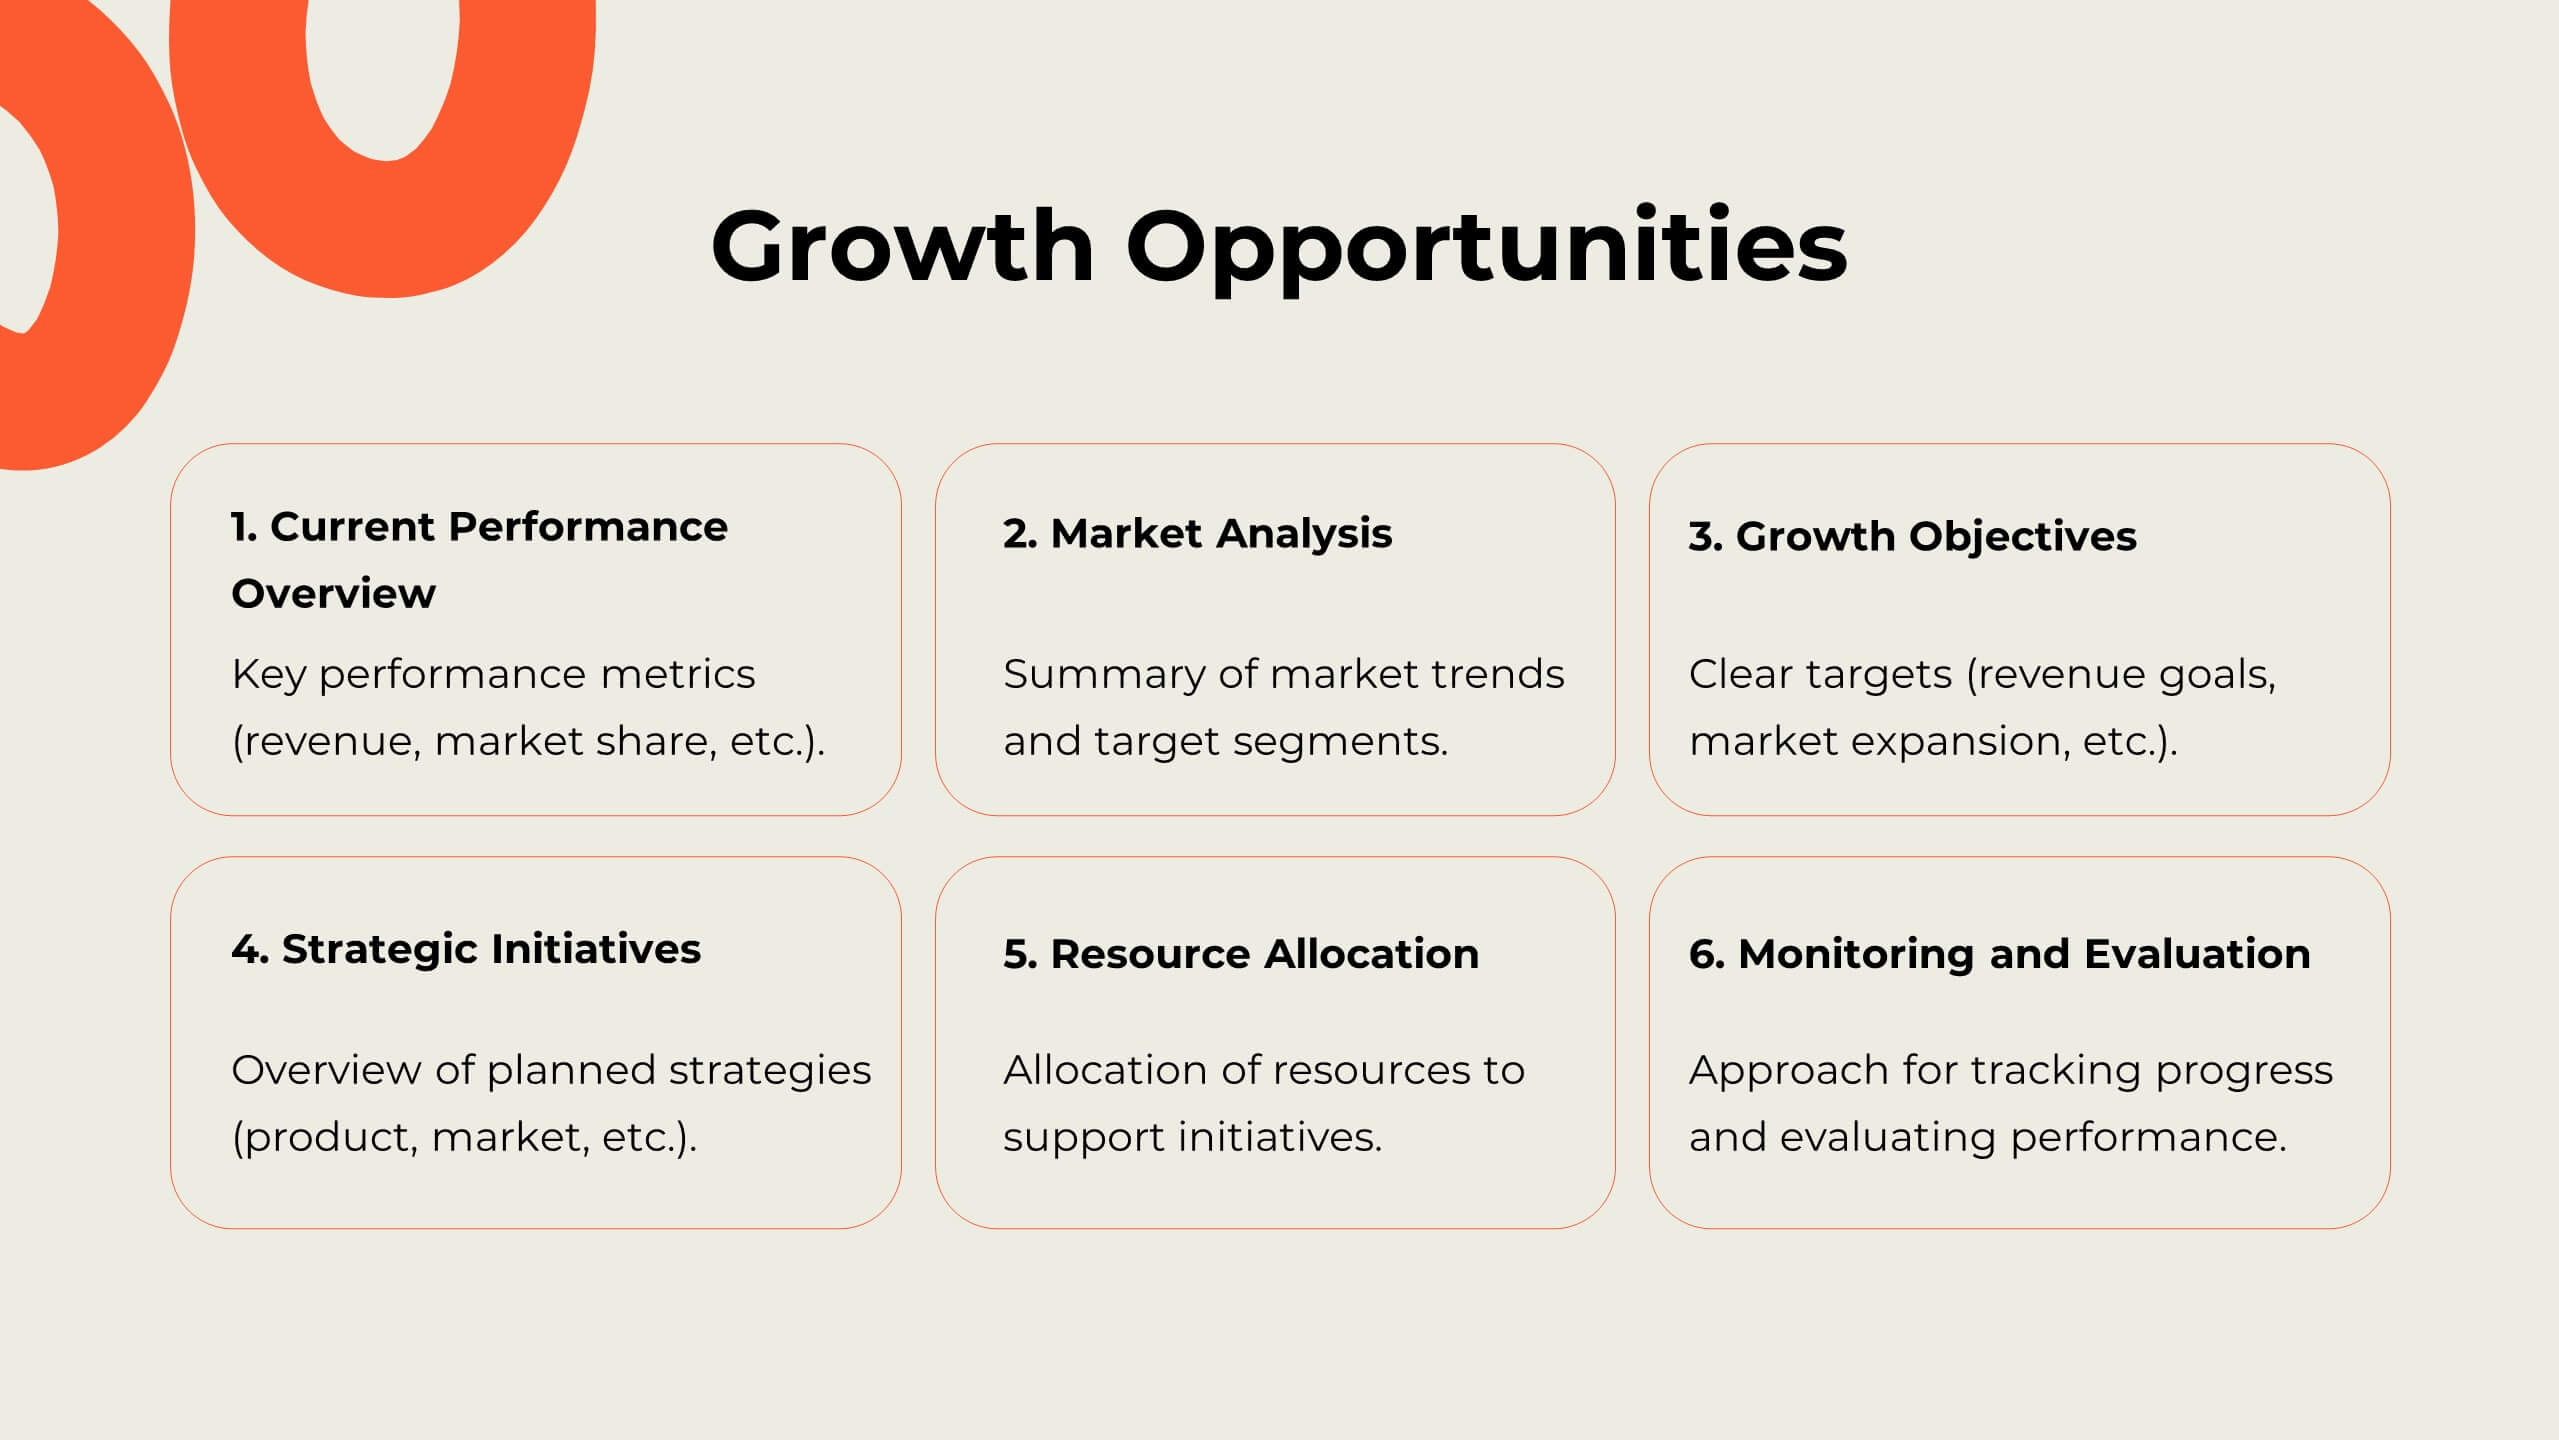
Revitalize your marketing efforts with this dynamic strategy plan template! Perfect for outlining objectives, competitive analysis, and target audience identification, it includes slides for SWOT analysis, resource allocation, and implementation plans. Engage stakeholders with vibrant visuals and comprehensive content. Compatible with PowerPoint, Keynote, and Google Slides for seamless presentations on any platform.