


Features
- 8 Unique Slides
- Fully editable and easy to edit in Microsoft Powerpoint, Keynote and Google Slides
- 16:9 widescreen layout
- Clean and professional designs
- Export to JPG, PDF or send by email


Do you have any questions?
Recommend


6 slides
Market Challenges and Resilience Strategy Presentation
Tackle volatility with clarity using the Market Challenges and Resilience Strategy presentation. This slide features a modern smartphone graphic surrounded by six key strategy zones, each with its own icon and text area—ideal for outlining market pressures, competitive moves, or adaptive responses. Use it to communicate resilience frameworks, digital transformation steps, or scenario planning. Fully customizable in PowerPoint, Keynote, and Google Slides.


7 slides
Mind-Brain Concept Diagram Presentation
Visualize cognitive processes with the Mind-Brain Concept Diagram. This engaging infographic presents six key elements surrounding a central brain illustration, making it ideal for psychology, neuroscience, or decision-making presentations. Fully editable with customizable text, colors, and icons. Compatible with PowerPoint, Keynote, and Google Slides for seamless integration.


2 slides
Modern Business Cover Slide Presentation
Stand out with this bold and contemporary cover slide. The layout features dynamic geometric shapes and an integrated photo section, perfect for making a memorable first impression. Whether you're presenting to clients or stakeholders, this slide combines style and structure to deliver your brand message clearly. Fully customizable and easy to edit in PowerPoint, Keynote, and Google Slides.


6 slides
McKinsey 7S Model Articles Infographics
Explore the seven critical elements that make up the McKinsey 7S Model, including Strategy, Structure, Systems, Shared Values, Skills, Style, and Staff. Each of these components plays a vital role in shaping your company's success. This infographic is compatible with popular presentation tools like PowerPoint, Keynote, and Google Slides, making it effortless to incorporate into your next business presentation. Unlock the secrets of organizational effectiveness with this concise and visually appealing resource. Enhance your understanding of the McKinsey 7S Model and supercharge your company's performance today. Get ready to transform your business strategy with this user-friendly infographic.


22 slides
Arcflare Digital Agency Strategy Plan Presentation
Create a powerful strategy with this digital agency plan presentation! It features key sections like market analysis, industry trends, campaign execution, and client testimonials, helping you communicate your approach clearly. Perfect for strategy meetings or client pitches, this template is fully compatible with PowerPoint, Keynote, and Google Slides.


6 slides
Project Goals and Deliverables Presentation
Clearly define and present your project objectives with the Project Goals and Deliverables Presentation. This template offers a structured layout to highlight key goals, milestones, and deliverables, making it perfect for project managers, teams, and stakeholders. Fully customizable and compatible with PowerPoint, Keynote, and Google Slides.


4 slides
Editable Table Chart Presentation
Simplify side-by-side evaluations with the Editable Table Chart Presentation. Designed for clear comparisons, this layout uses checkmarks, icons, and a clean structure to display features or data across multiple categories. It's perfect for showcasing product options, service tiers, or strategic alternatives. Fully customizable and compatible with PowerPoint, Keynote, and Google Slides.


6 slides
Unique Intersection Comparison Diagram
Illustrate complex relationships with clarity using the Unique Intersection Comparison Diagram Presentation. This visually engaging 5-circle diagram highlights overlaps and distinct points, ideal for showcasing cross-functional collaboration, multi-variable strategies, or layered comparisons. Each segment supports titles and brief text, making it perfect for business planning, product features, or audience segmentation. Fully editable in PowerPoint, Keynote, and Google Slides.


5 slides
Predictive Analytics with Big Data
Break down complex predictive data processes with this layered diagram designed for big data professionals, analysts, and AI teams. Clearly illustrate multi-level data pipelines and machine learning systems in an engaging, structured format. Fully customizable in PowerPoint, Keynote, and Google Slides.


5 slides
Veterinary Medicine Advances Presentation
Discover the latest in Veterinary Medicine Advances with our engaging presentation template. Designed to highlight key innovations and treatment methods, this template offers a clear visual format for presenting complex information effectively to colleagues and stakeholders in the veterinary field.


7 slides
Asia Map Infographic Presentation Template
Asia is the largest, most populous, and most culturally diverse continent. Asia constitutes of nearly one-third of Earth's landmass and is lying entirely north of the equator. The continent is home to a variety of cultures, ethnic groups, and religions. This Asian map template includes the different labeled countries, and graphs with statistics. This can be used to show your audience the geographical layout of Asia, or as an example of what a modern, professional presentation should look like. This template is a great resource for students, teachers and people who want to learn more about Asia.


5 slides
Healthcare and Wellness Infographics
Healthcare and wellness are interrelated concepts that focus on promoting and maintaining the physical, mental, and emotional well-being of individuals and communities. These vertical infographics are designed to showcase essential healthcare and wellness information. This infographic provides a comprehensive overview of various topics related to healthcare, promoting a better understanding of key concepts and practices that contribute to overall well-being. These infographics offers a series of health tips and guidelines covering different aspects of wellness, such as nutrition, physical activity, mental health, and stress management.


26 slides
E-commerce Presentation
Venture into the digital marketplace with a presentation template that embodies the innovative spirit of e-commerce. This template, with its vibrant colors and modern design elements, is tailored to highlight the fast-paced world of online retail. The slides offer a digital storefront for your ideas, from introducing the creative minds behind the operation to showcasing the latest trends in online shopping. Utilize engaging layouts to compare products, outline sales strategies, or highlight consumer behavior with clear, concise infographics. With promotional slide options to announce special deals and a design that captures the convenience and excitement of shopping with a click, this collection is an essential tool for marketers, online retailers, and startups. It’s optimized for conveying complex data in a user-friendly format, ensuring your audience stays engaged and informed. Compatible with PowerPoint, Keynote, and Google Slides, it’s the perfect cart to carry your message in the bustling online marketplace.


20 slides
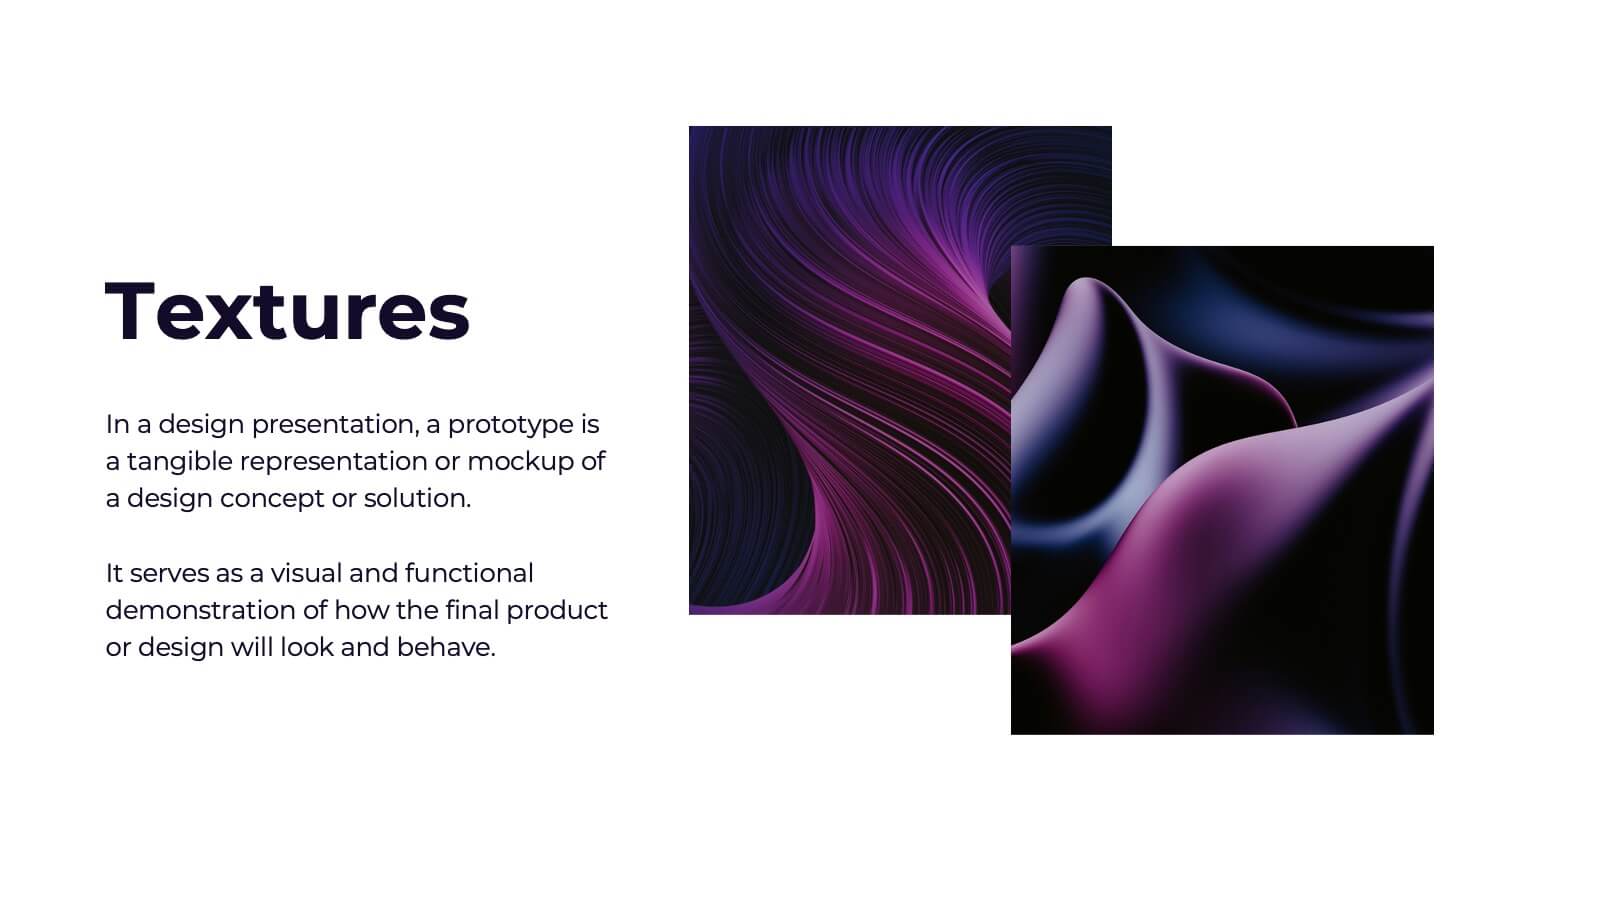
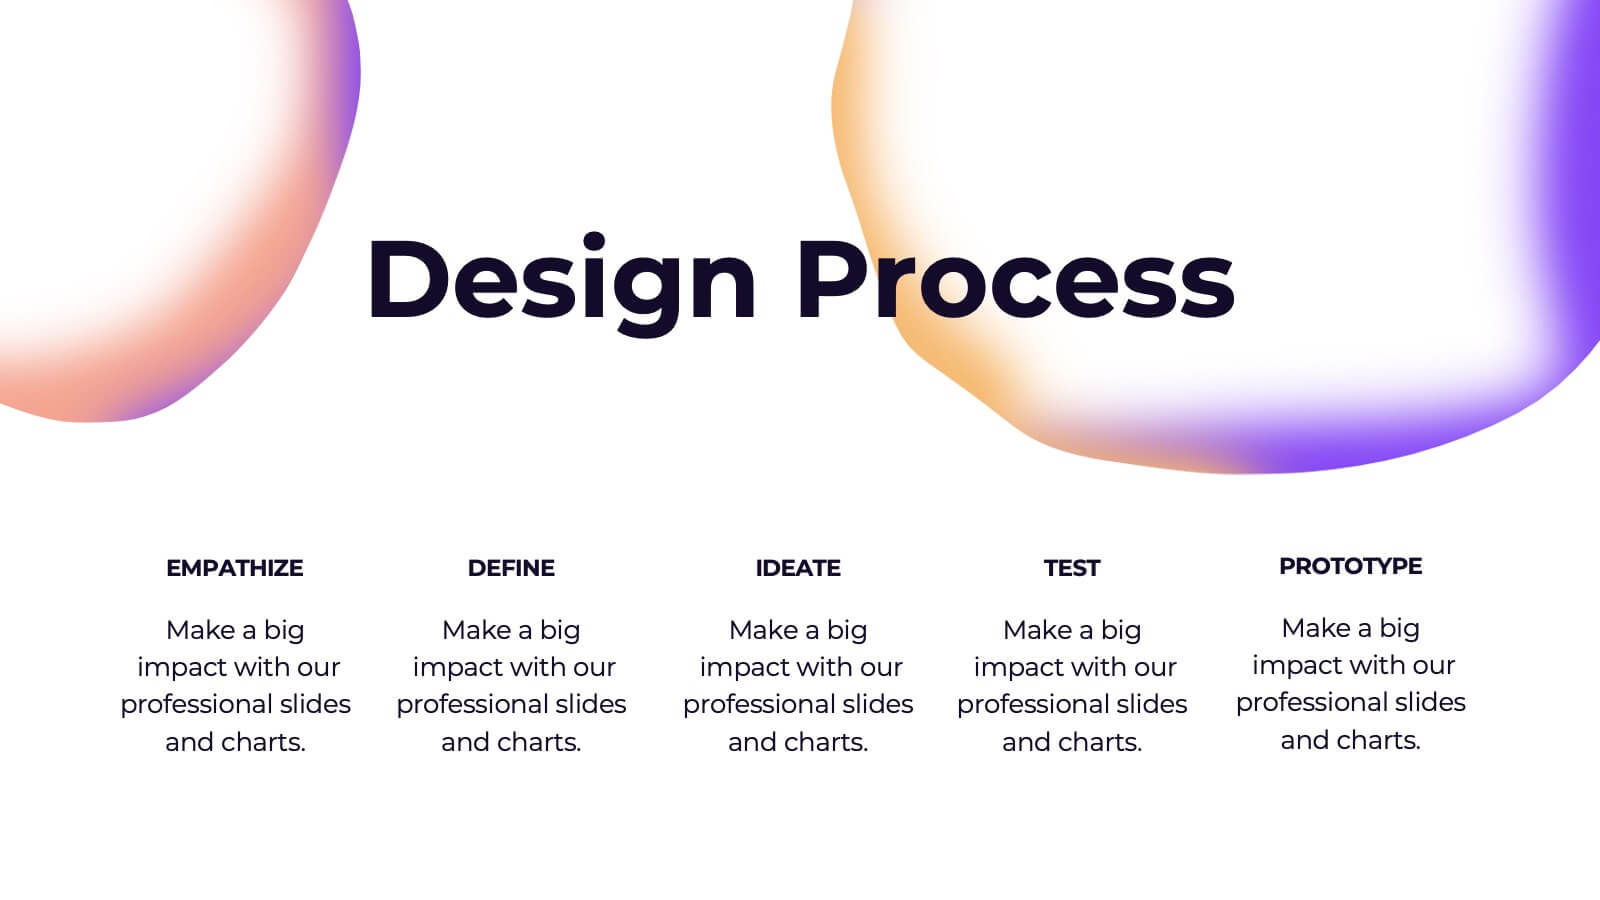
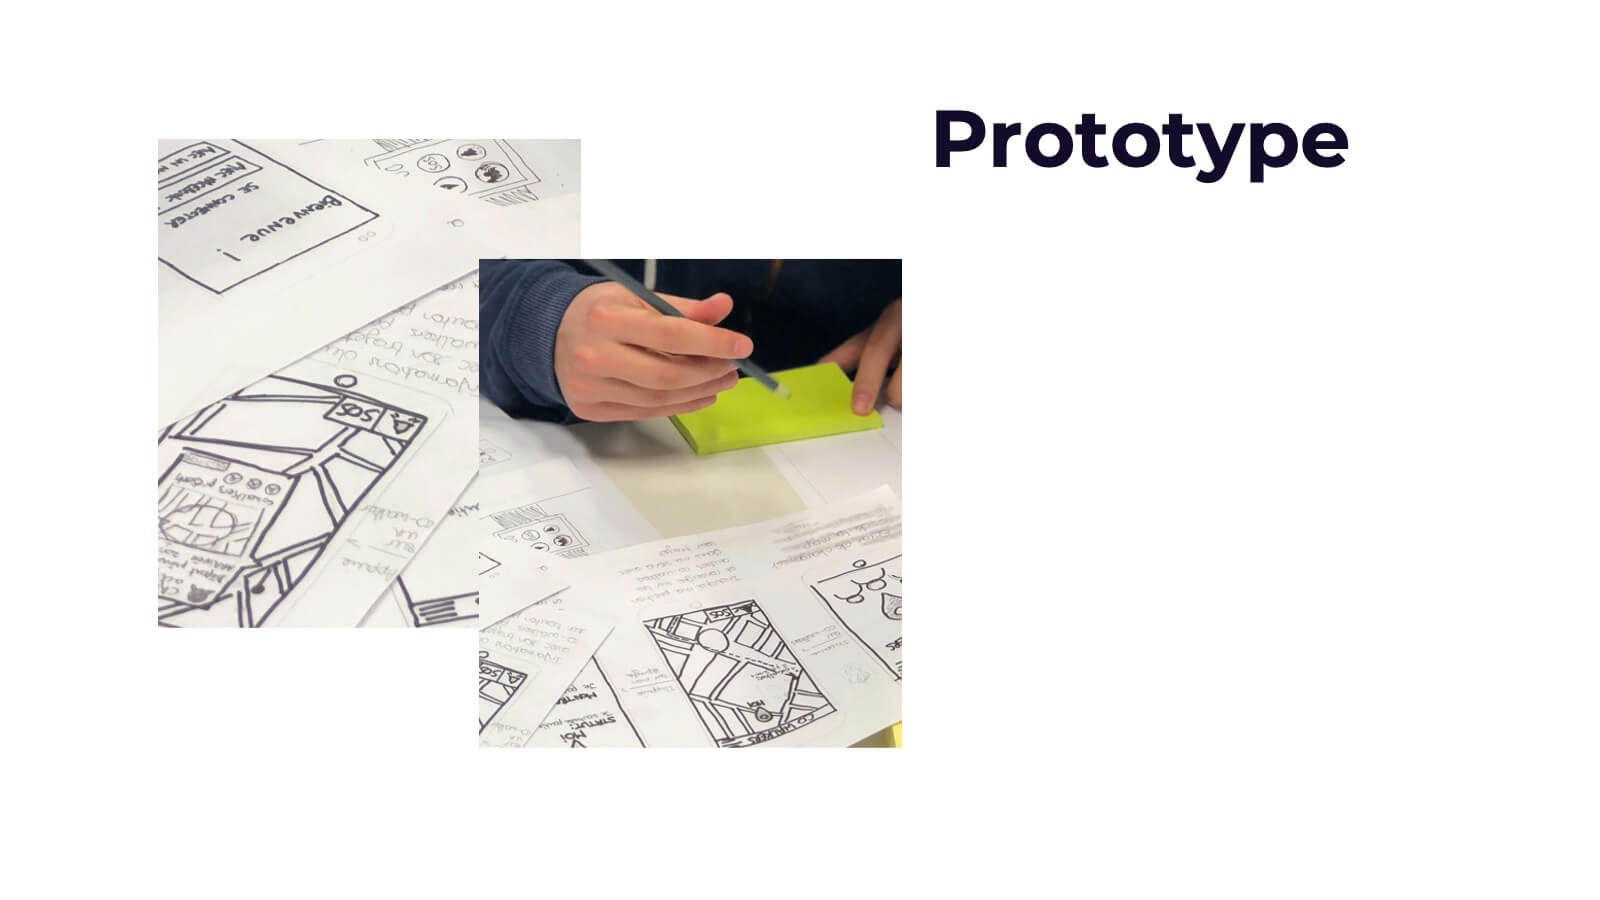
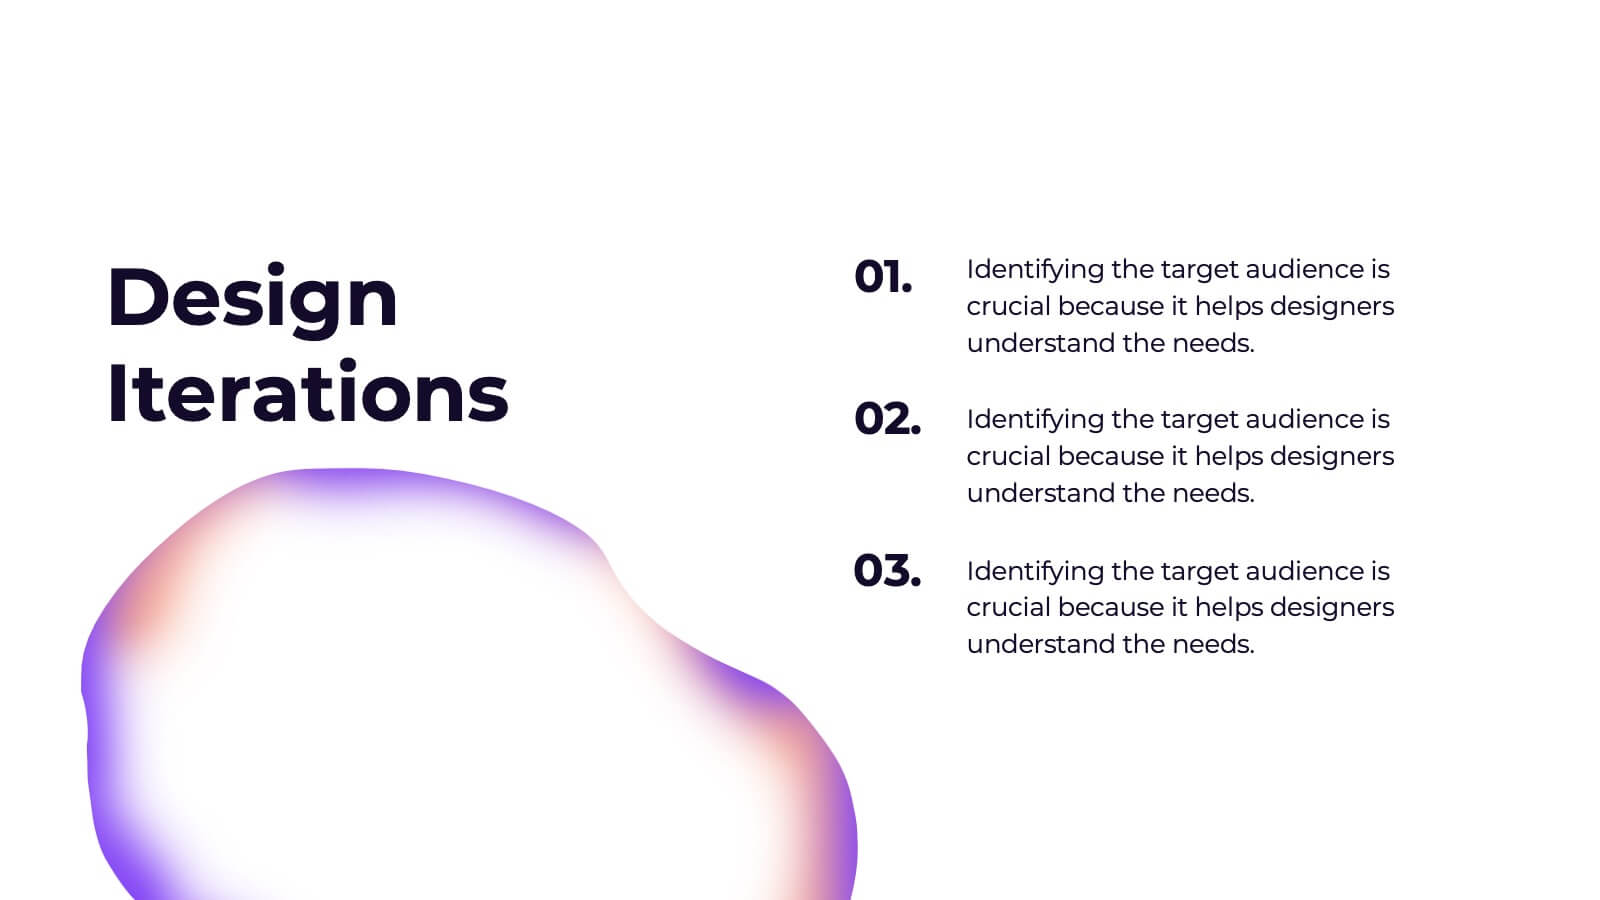
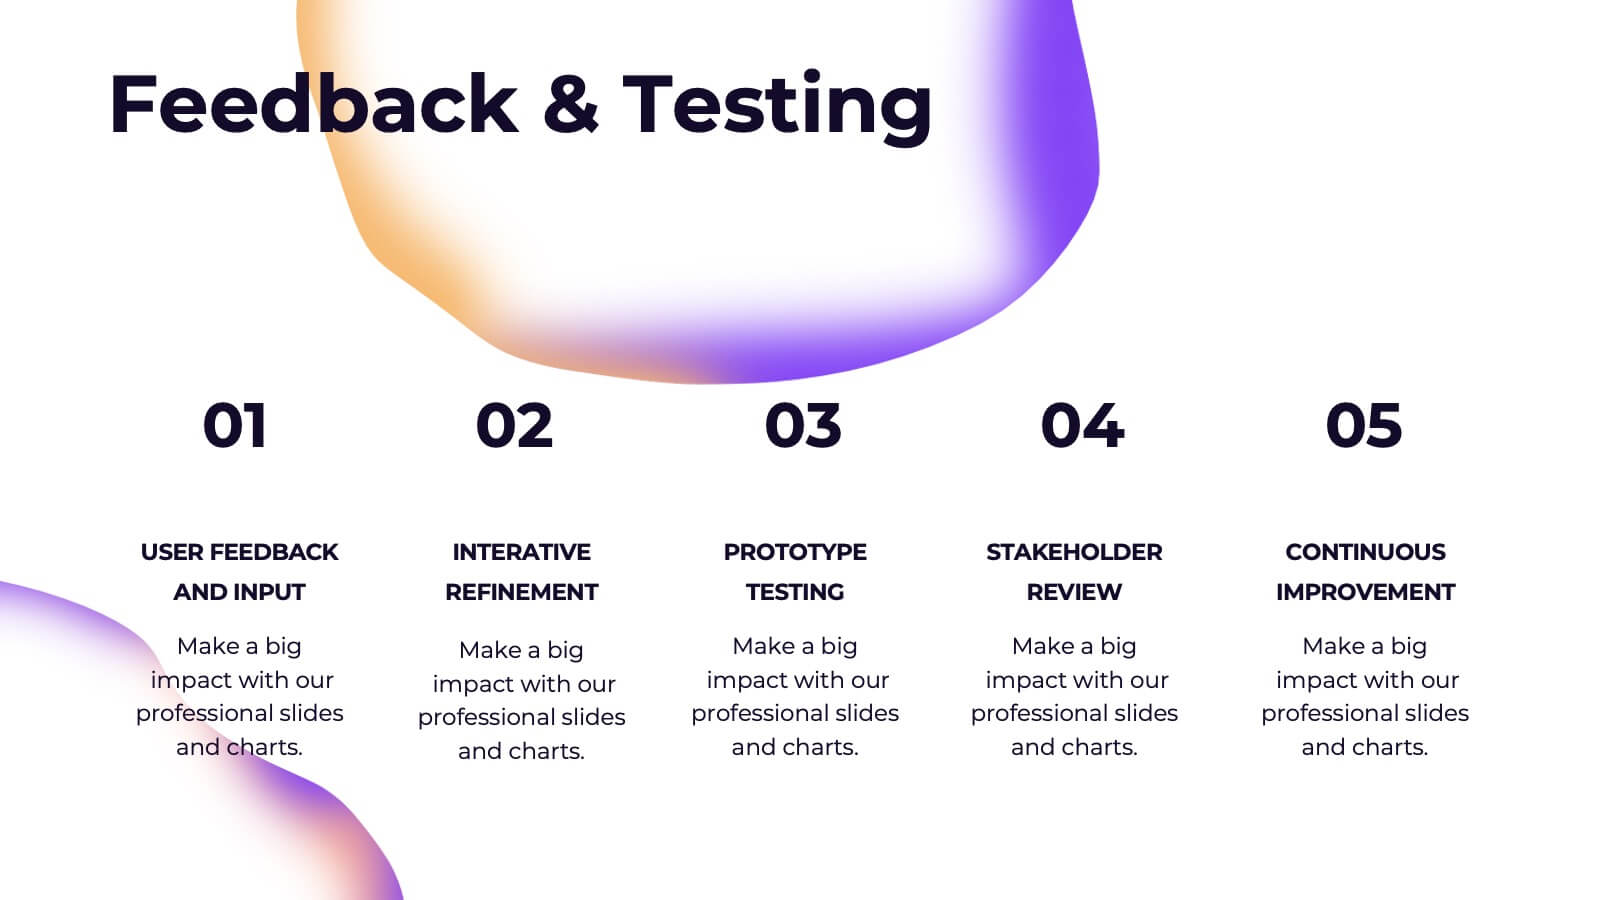
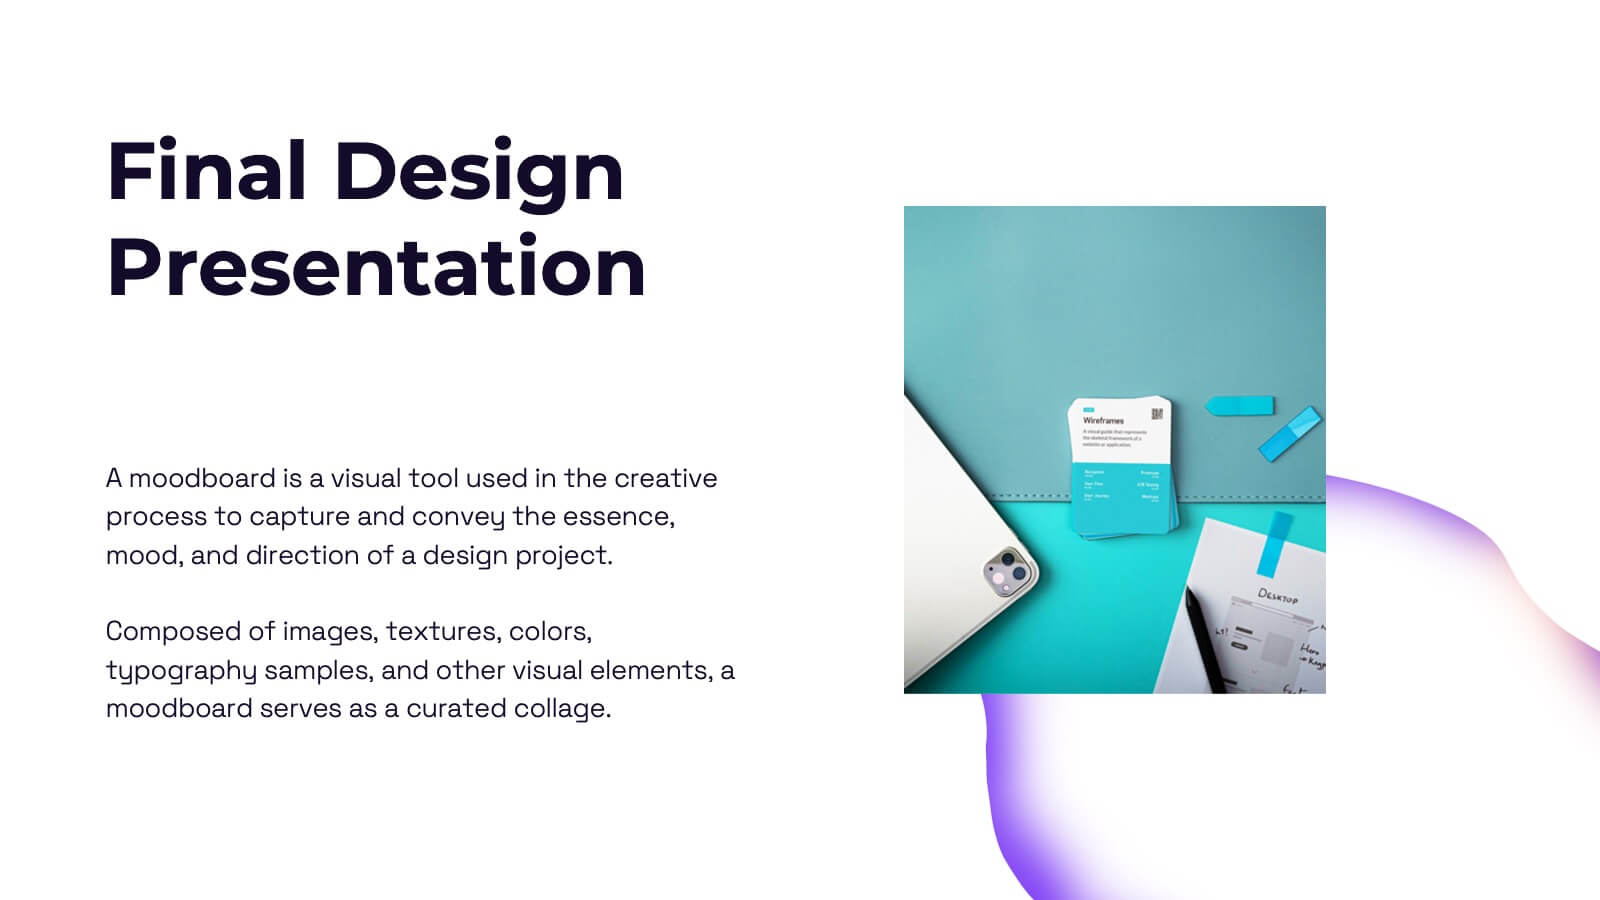
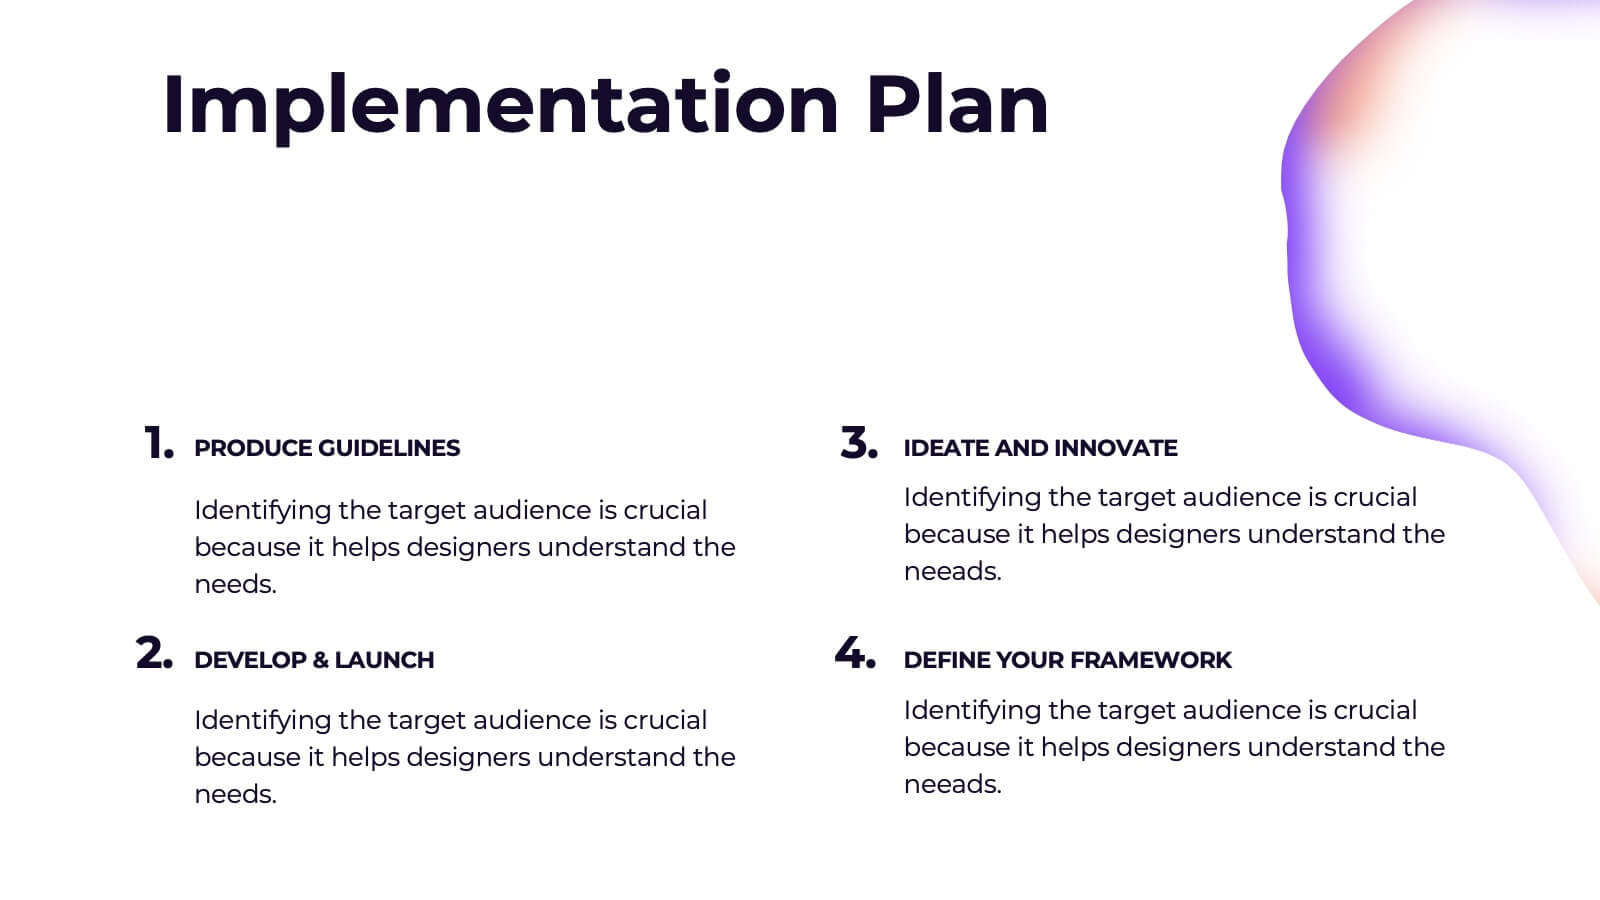
Valkyrie Design Strategy Proposal Presentation
Elevate your design strategy presentations with this visually captivating and modern template! It covers every step of the design process, from concept development and mood boards to prototype iterations and feedback. Ideal for showcasing design elements, textures, and assets, this template is perfect for creative professionals. Compatible with PowerPoint, Keynote, and Google Slides for easy, polished presentations.


5 slides
Employee Training Needs Skills Gap Presentation
Optimize Workforce Training with a Skills Gap Analysis! The Employee Training Needs Skills Gap template helps HR teams, trainers, and managers visualize skill gaps, assess employee competencies, and align training programs with business goals. Featuring an interactive dot matrix layout, this template enables clear comparisons across skill areas, ensuring targeted and efficient upskilling strategies. Fully customizable in PowerPoint, Keynote, and Google Slides, it streamlines workforce development planning for maximum impact and growth.


3 slides
Workflow Improvement and Progress Chart Presentation
Folders aren't just for files—they’re perfect for ideas too. This visual chart maps out streamlined processes, making it easier to track progress and improve internal workflow. Great for managers and teams, this infographic presentation template is fully compatible with PowerPoint, Keynote, and Google Slides for effortless editing and sharing.


26 slides
The Rise of Smart Cities Presentation
This presentation template is dedicated to urban developers, technology enthusiasts, and policy makers interested in the advancement of smart cities. The template serves as a deep dive into the integration of technology within urban settings to boost sustainability, efficiency, and quality of life. It is designed with a sleek, modern aesthetic, using a color palette that reflects innovation and modernity, which makes it visually appealing and easy to navigate. The content is structured to demystify complex concepts about smart cities, featuring sections on IoT implementations, eco-friendly urban development, and smart public services. It includes varied slide types such as diagrams, infographics, and statistical displays to showcase data and case studies from cities that are pioneers in this domain. The template is compatible with multiple presentation platforms like PowerPoint, Google Slides, and Keynote, ensuring it can be utilized across different devices and settings. This makes it a versatile tool for presentations in educational, professional, and conference contexts, aiming to inspire and educate on the transformative power of smart urban planning.