


Features
- 8 Unique slides
- Fully editable and easy to edit in Microsoft Powerpoint, Keynote and Google Slides
- 16:9 widescreen layout
- Clean and professional designs
- Export to JPG, PDF or send by email


Do you have any questions?
Recommend


21 slides
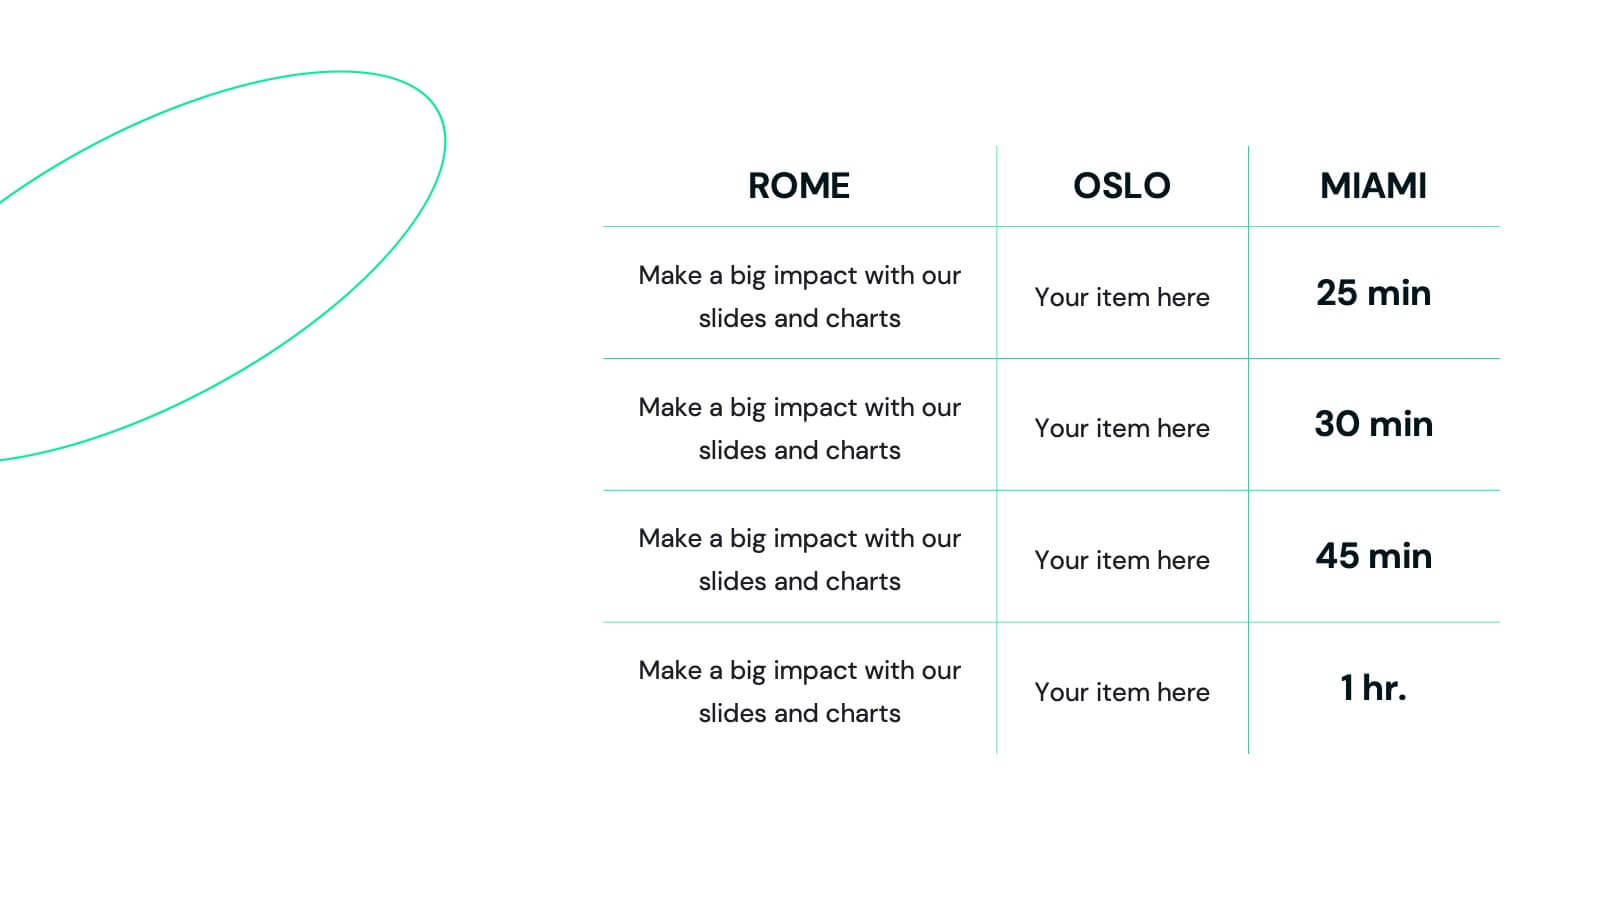
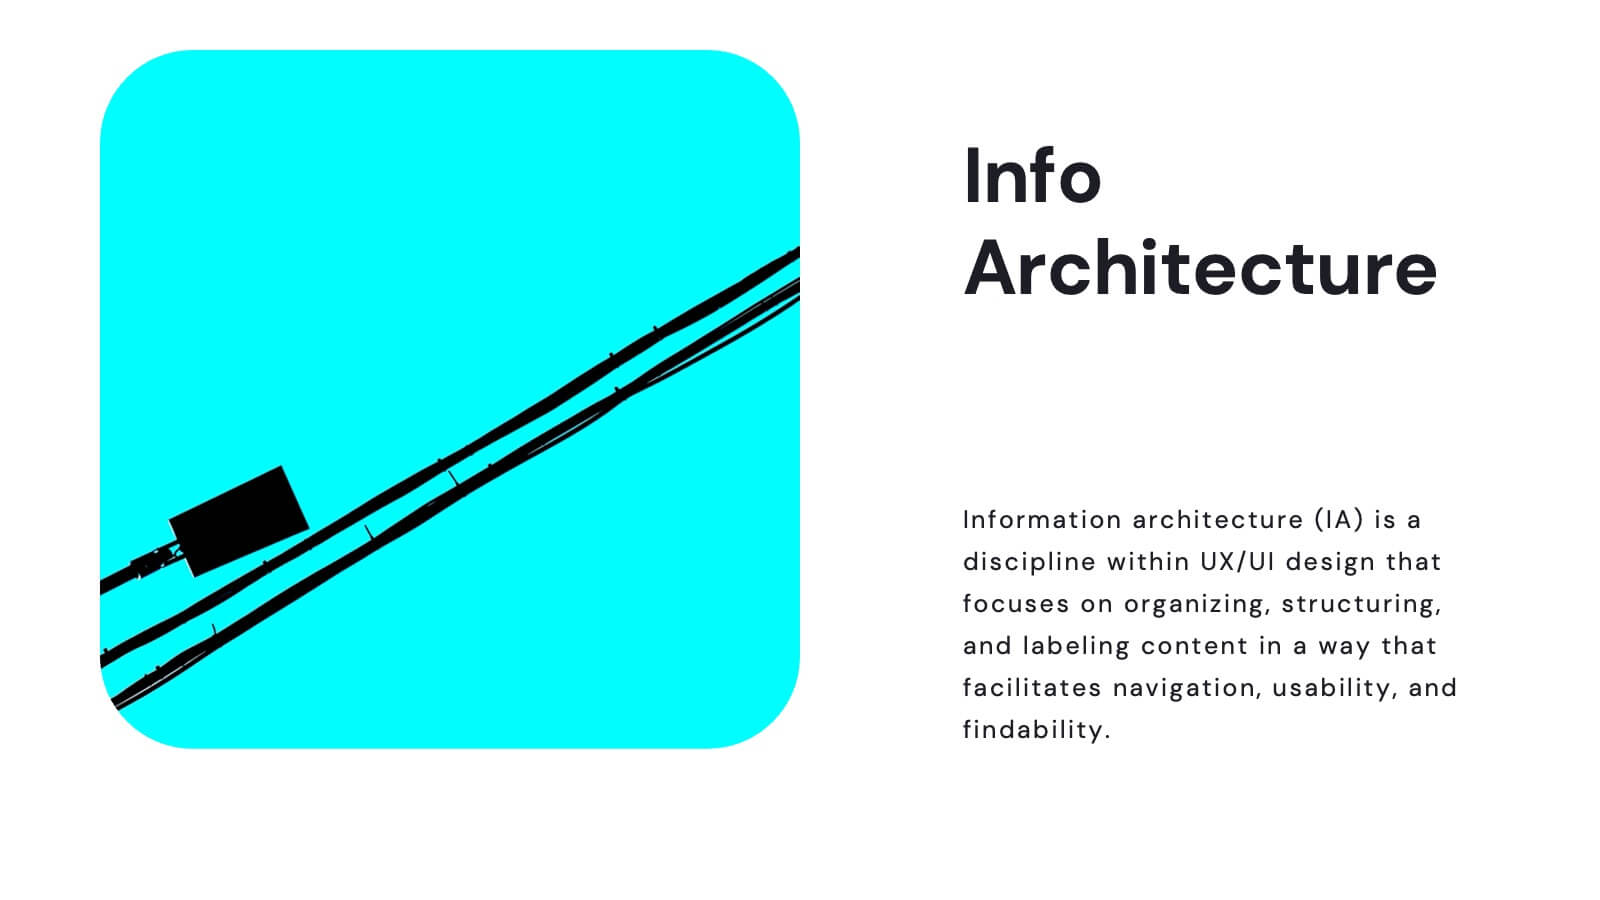
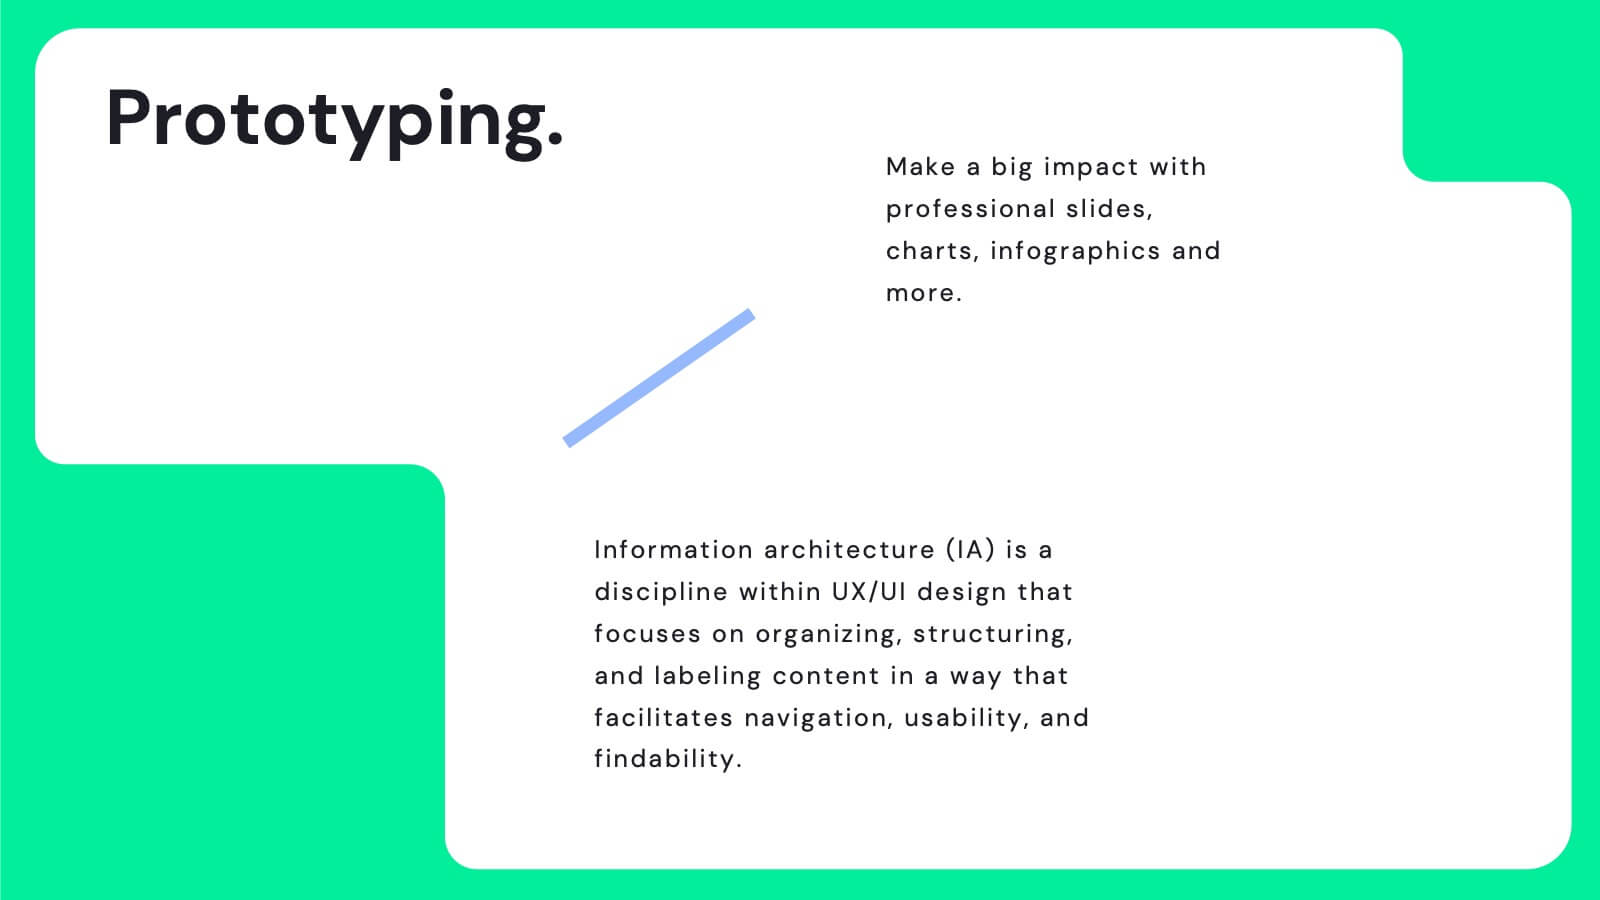
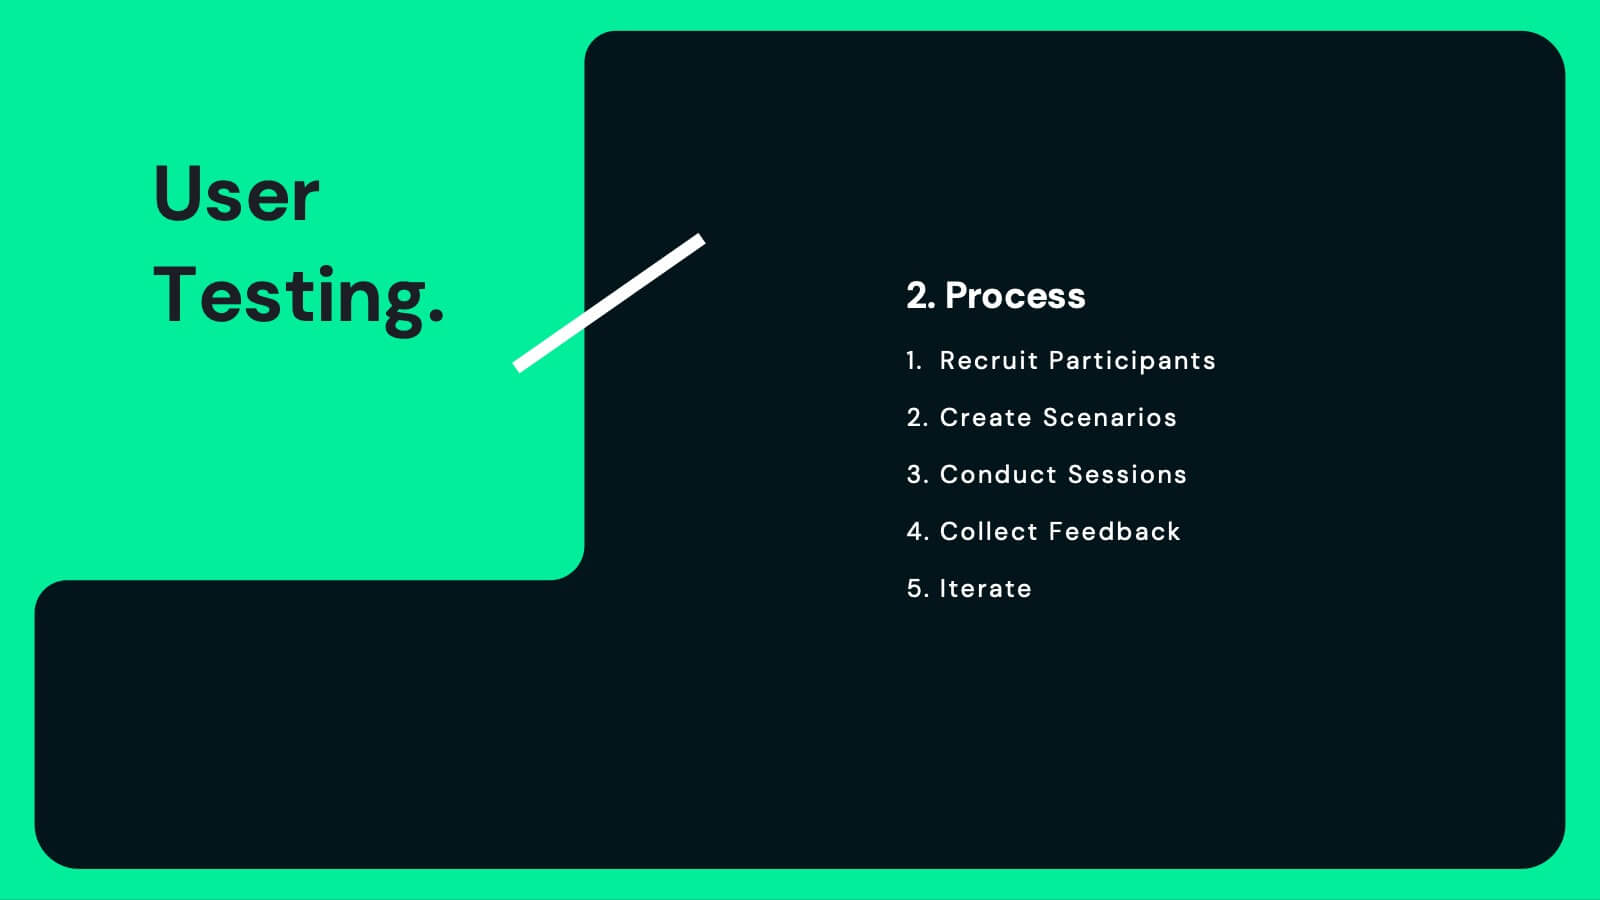
Juno UX Case Study Presentation
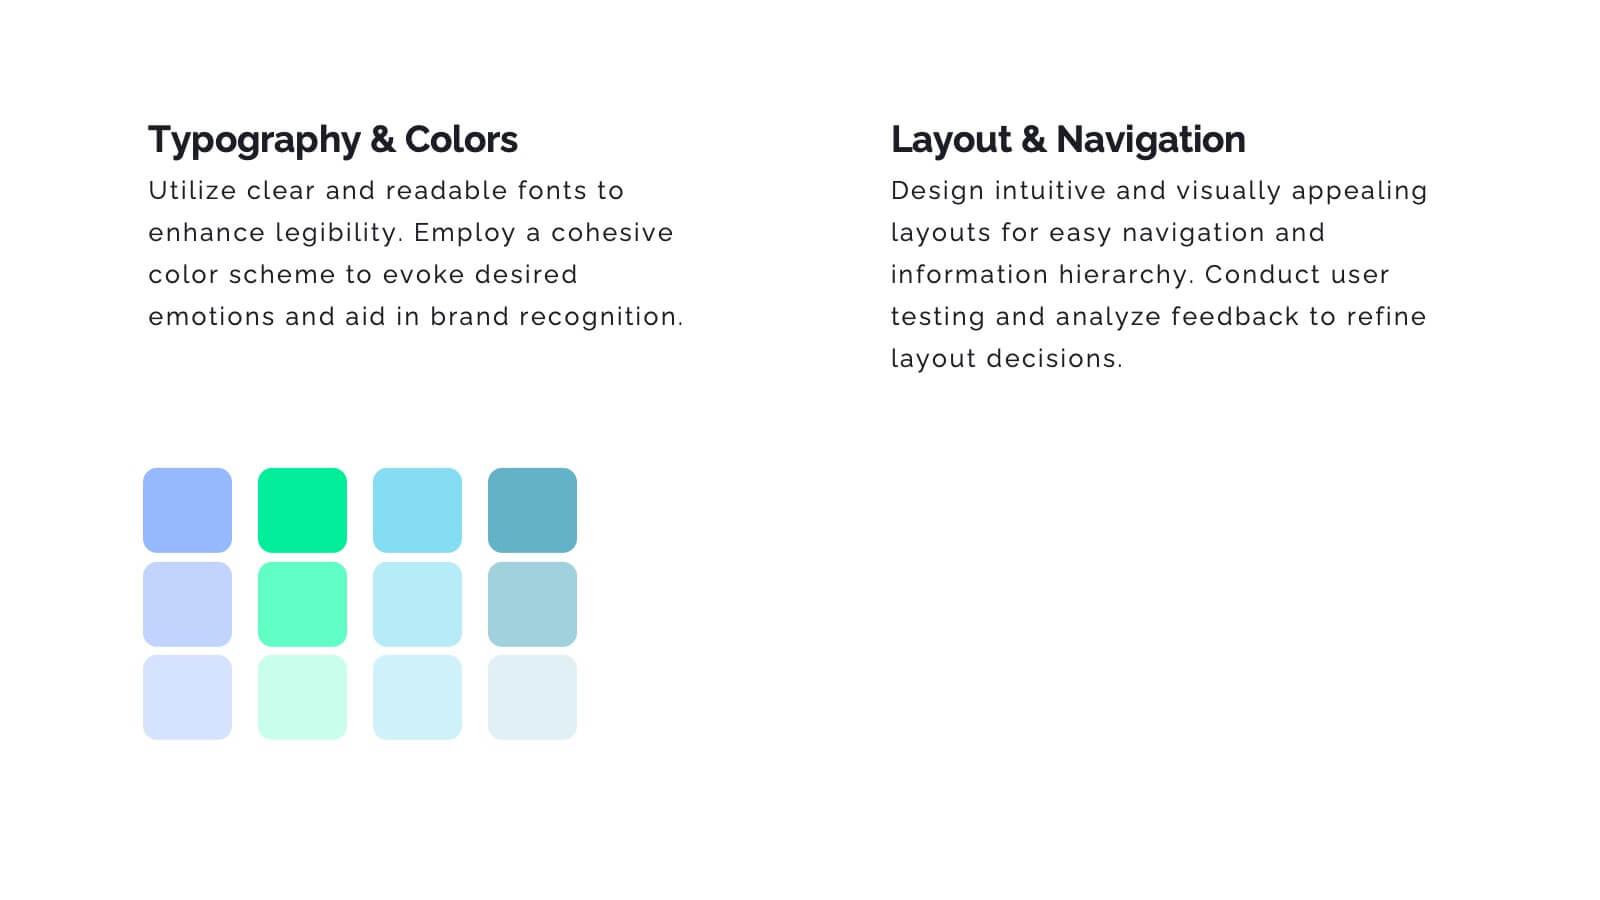
Enhance your UX presentations with this sleek, user-friendly template designed for showcasing detailed case studies and user research. With a modern layout and clear sections for user journey mapping, prototyping, and usability guidelines, this template ensures a professional and engaging presentation. Compatible with PowerPoint, Keynote, and Google Slides, it's perfect for any platform.


34 slides
Pitch Deck Startup
Introducing our Pitch Deck Startup! Whether you are pitching to investors, partners, or customers, this template will help you create a persuasive presentation that showcases your company, growth plans, and financial projections. Customize the template to suit your needs and deliver a successful pitch that highlights the unique value of your startup and attracts potential investors or customers. This template includes sections for introducing your startup, explaining your business idea and market opportunity, showcasing your products or services, highlighting your financial projections, and outlining your growth plans.


10 slides
Corporate Framework and Structure Presentation
Clearly define your corporate framework and structure with this professional infographic template. Ideal for executives, team leaders, and project managers, this slide visually organizes organizational hierarchy, roles, and key responsibilities in a clean and structured layout. Fully editable in PowerPoint, Keynote, and Google Slides, allowing seamless customization for your company's needs.


22 slides
Marketing Research Presentation
Streamline your data presentation with our Marketing Research template. It includes comprehensive slides on research objectives, methodology, data analysis, and key findings. Ideal for academic and professional settings, this template is compatible with PowerPoint, Keynote, and Google Slides, enhancing your research presentations with precision and professionalism.


7 slides
Kickoff Meeting Infographic
A meeting is a planned gathering of individuals, often from an organization or a group, who come together to discuss specific topics, share information, make decisions, or collaborate on projects. This infographic template is a visually engaging guide to launching your projects with a burst of energy and purpose. This template is your go-to tool for orchestrating that vital moment—the project kickoff—that sets the stage for success. Compatible with Powerpoint, Keynote, and Google Slides. This template is a structured way to communicate, coordinate actions, and ensure that everyone involved is aligned towards common goals.


7 slides
Project Proposal Structure Infographic
Optimize your project planning and presentation with this professional set of project proposal structure templates. Each slide is designed to systematically display project details, from the introduction and objectives to the detailed work plan and budget. These templates are essential tools for project managers, strategists, and business analysts aiming to convey comprehensive project proposals. Structured to support clear communication, the templates feature a logical flow that guides viewers through each critical component of the proposal. The use of a consistent blue color palette and clean typography helps maintain focus on the content, while graphical elements like charts and timelines visually break down complex information, making it easily digestible for stakeholders. Fully customizable, these templates allow for easy adaptations to specific project needs, enabling precise tailoring of text, color, and design elements. Whether for internal project approval or external client pitches, these slides will help you present a clear, structured, and persuasive project proposal.


5 slides
Wellness Program and Public Health Overview Presentation
Give your health data a clean, visual voice with this engaging infographic layout. Designed to showcase wellness programs, public health statistics, or fitness data, this slide maps key points alongside a human body silhouette to enhance clarity. Easy to edit and compatible with PowerPoint, Keynote, and Google Slides for seamless customization.


5 slides
RAPID Decision-Making Roles Overview Presentation
Clarify accountability and streamline decisions with the RAPID Decision-Making Roles Overview Presentation. This visual layout breaks down the five essential roles—Recommend, Agree, Perform, Input, and Decide—into a clear quadrant diagram. Ideal for project teams, leadership alignment, or decision-making workshops. Fully editable in PowerPoint, Google Slides, Keynote, and Canva.


5 slides
Customer Profile and Persona Insights Presentation
Showcase your target audience with style using this modern persona insights deck. Highlight demographics, traits, and behaviors through visual cards and editable text placeholders. Perfect for marketing strategy, user research, or campaign planning. Fully customizable in PowerPoint, Keynote, and Google Slides to align with your branding and presentation needs.


5 slides
Consequences of Fake News Infographics
Fake news refers to false or misleading information presented as factual news. These are informative infographic templates that highlights the significant impact of fake news on individuals, society, and democracy. They are designed with the aim to raise awareness about the dangers of misinformation and its far-reaching consequences. Use this to educate and inform your audience about the detrimental effects of fake news on individuals, society, and democracy. This increases awareness and promotes media literacy. Fully customizable and compatible with Powerpoint, Keynote, and Google Slides.


4 slides
Property Investment and Housing Report Presentation
Present your Property Investment and Housing Report with this structured real estate-themed presentation template. Featuring a house-shaped design with ascending financial metrics, this layout is perfect for illustrating market trends, investment growth, and housing analysis. Ideal for real estate agents, property developers, and financial analysts, this template makes data visually engaging and easy to understand. Fully customizable and compatible with PowerPoint, Keynote, and Google Slides.


6 slides
Competitive Market Forces Analysis Presentation
Elevate your insights with a dynamic circular layout that turns complex market pressures into a clear, structured story. This presentation helps you compare key forces, highlight competitive advantages, and communicate strategic recommendations with confidence and simplicity. Fully editable and compatible with PowerPoint, Keynote, and Google Slides.


26 slides
Operational Efficiency Tips Purple Presentation
Optimize your team's workflow and showcase your strategies for improved performance with this operational efficiency template. The vibrant purples and dynamic design invite viewers into a world where streamlined processes and clear objectives lead to success. Lay out the steps of your action plan, from the CEO's vision to the team's execution, with a variety of slides designed for clear communication. Charts and diagrams turn complex data into easy-to-follow visuals, while mockups provide a real-world view of your tools and platforms. Tailored for use in popular presentation software, this set of slides is an excellent aid for managers and consultants aiming to present plans that boost productivity and cut down waste. It’s all about making the complex simple and achieving more with less, helping your audience see the path to a leaner and more effective operation.


6 slides
Weekly Task Schedule Presentation
Stay on top of your week with this clean and efficient layout designed to organize daily priorities and action plans. Perfect for tracking goals, meetings, or team deliverables, it keeps productivity front and center. Fully customizable and compatible with PowerPoint, Keynote, and Google Slides for easy professional presentation use.


26 slides
Fashion Brand Shop Aesthetic Presentation
A fashion brand shop is a retail store that exclusively sells products from a particular fashion brand. This presentation template has a stylish design that perfectly reflects the essence of a high-end fashion brand. Whether you're launching a new collection, presenting your brand's story, or showcasing your latest fashion products, this template will captivate your audience. The presentation boasts sleek and elegant slides, featuring a blend of colors and images that will resonate with your brand's aesthetic. With its customizable elements, you can easily tailor the presentation to align with your brand's unique identity and aesthetics.


4 slides
Execution Phase Project Status Dashboard Presentation
Track execution phase progress at a glance with the Execution Phase Project Status Dashboard presentation slide. Featuring a visual traffic light indicator and pie charts, this layout helps communicate key metrics, task status, and completion percentages in a clear, engaging way. Ideal for internal reviews, stakeholder updates, or project team briefings. Fully editable in PowerPoint, Keynote, and Google Slides.


4 slides
Blockchain and Cryptocurrency Market Analysis Presentation
Present complex blockchain structures and crypto market layers with clarity using the Blockchain and Cryptocurrency Market Analysis presentation template. Featuring a stacked cylinder diagram with four interactive data points, this layout is ideal for breaking down transaction flows, network layers, or decentralized finance (DeFi) ecosystems. Each title block offers space for concise key insights. Best suited for blockchain consultants, fintech startups, and crypto analysts. Fully compatible with PowerPoint, Keynote, and Google Slides.