


Features
- 6 Unique slides
- Fully editable and easy to edit in Microsoft Powerpoint, Keynote and Google Slides
- 16:9 widescreen layout
- Clean and professional designs
- Export to JPG, PDF or send by email


Do you have any questions?
Recommend


25 slides
Hollowfern Brand Identity Presentation
Showcase your brand's unique essence with this structured and visually appealing brand identity presentation template. Highlight key elements like brand values, logo design, color palettes, and typography, providing a cohesive foundation for your brand's image. Dive deeper into the brand tone, consumer personas, and competitive positioning to ensure clarity and alignment with your target audience. This template offers dedicated sections for market analysis, unique selling proposition, and brand guidelines, helping you communicate your strategy with professionalism. Whether you're crafting a social media presence, building a website, or refining packaging designs, this template empowers you to stay consistent and compelling. Fully compatible with PowerPoint, Google Slides, and Keynote, it's tailored for seamless customization and presentation across platforms.


22 slides
Halo Small Business Pitch Deck Presentation
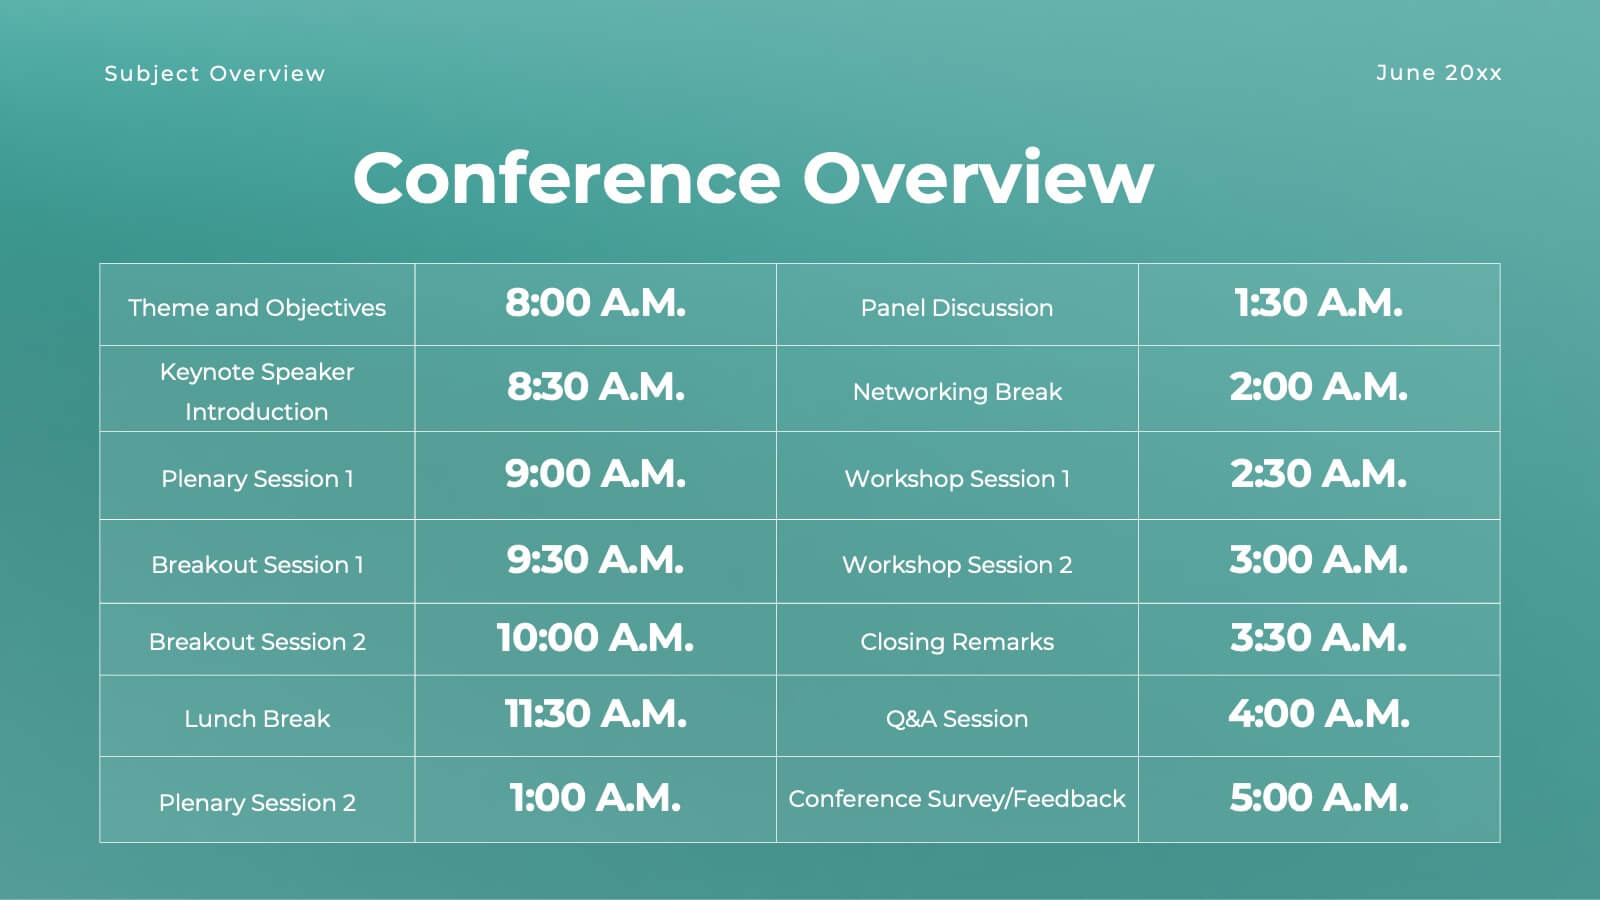
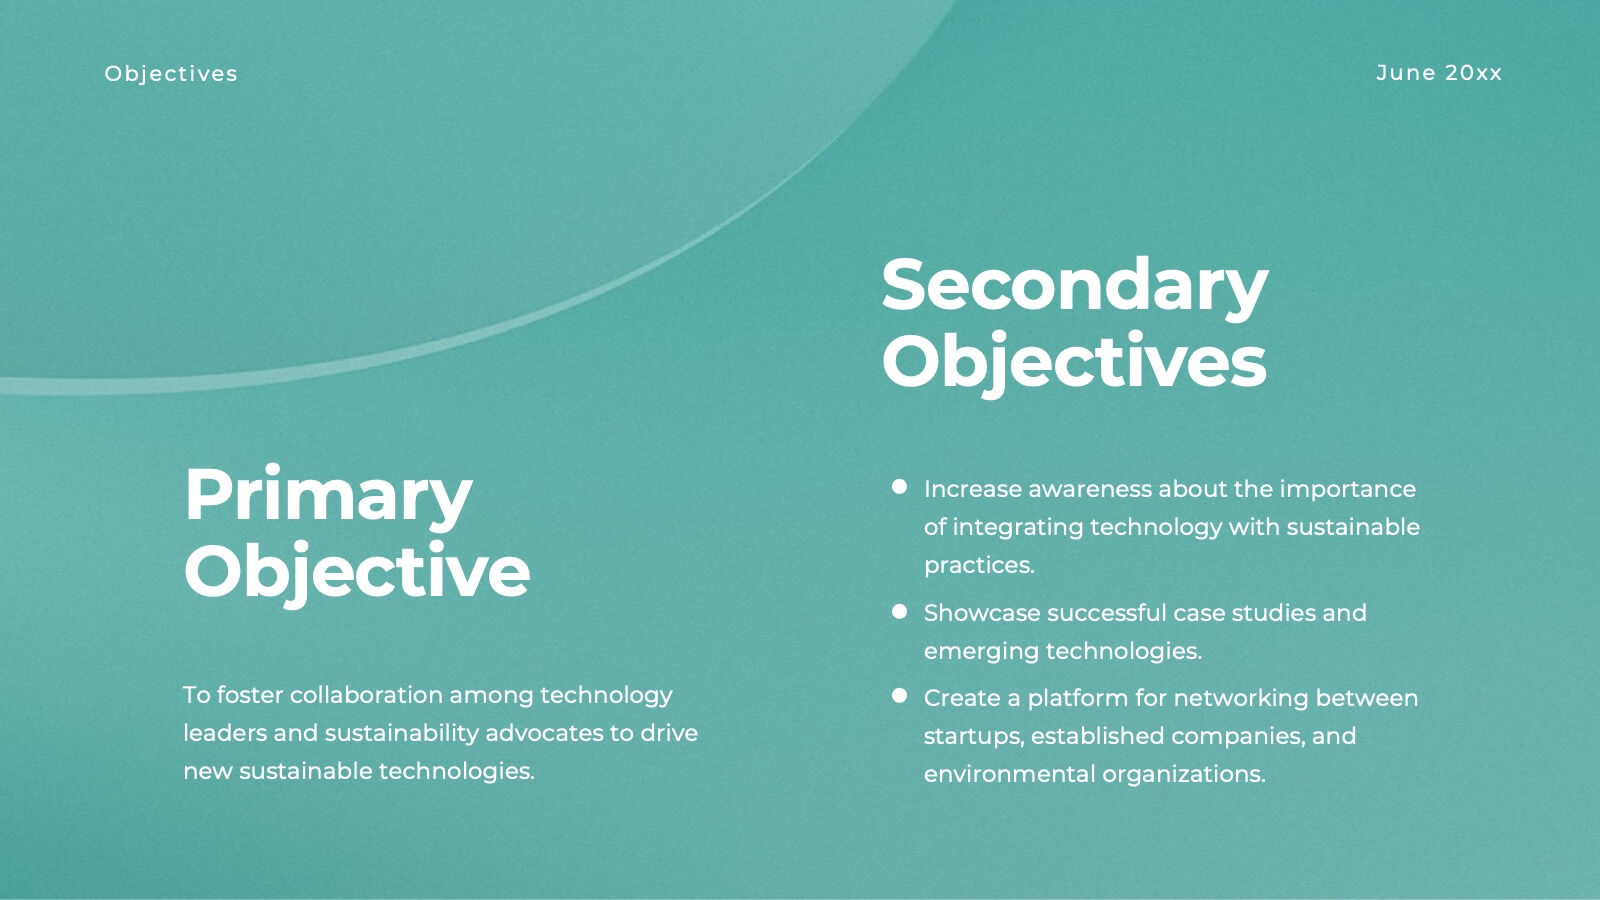
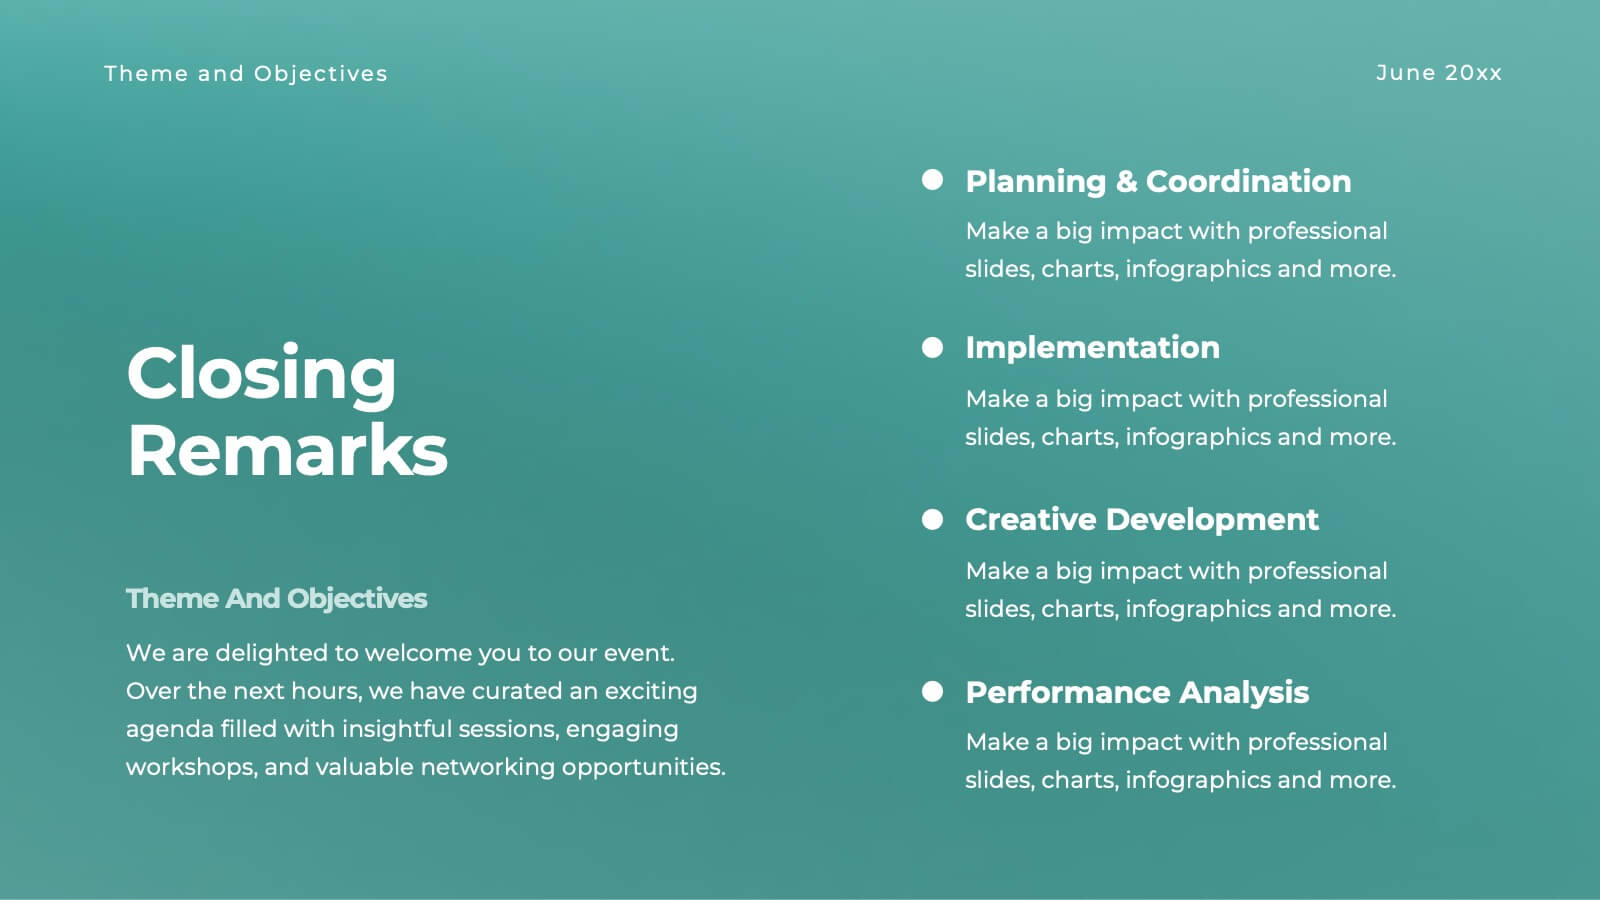
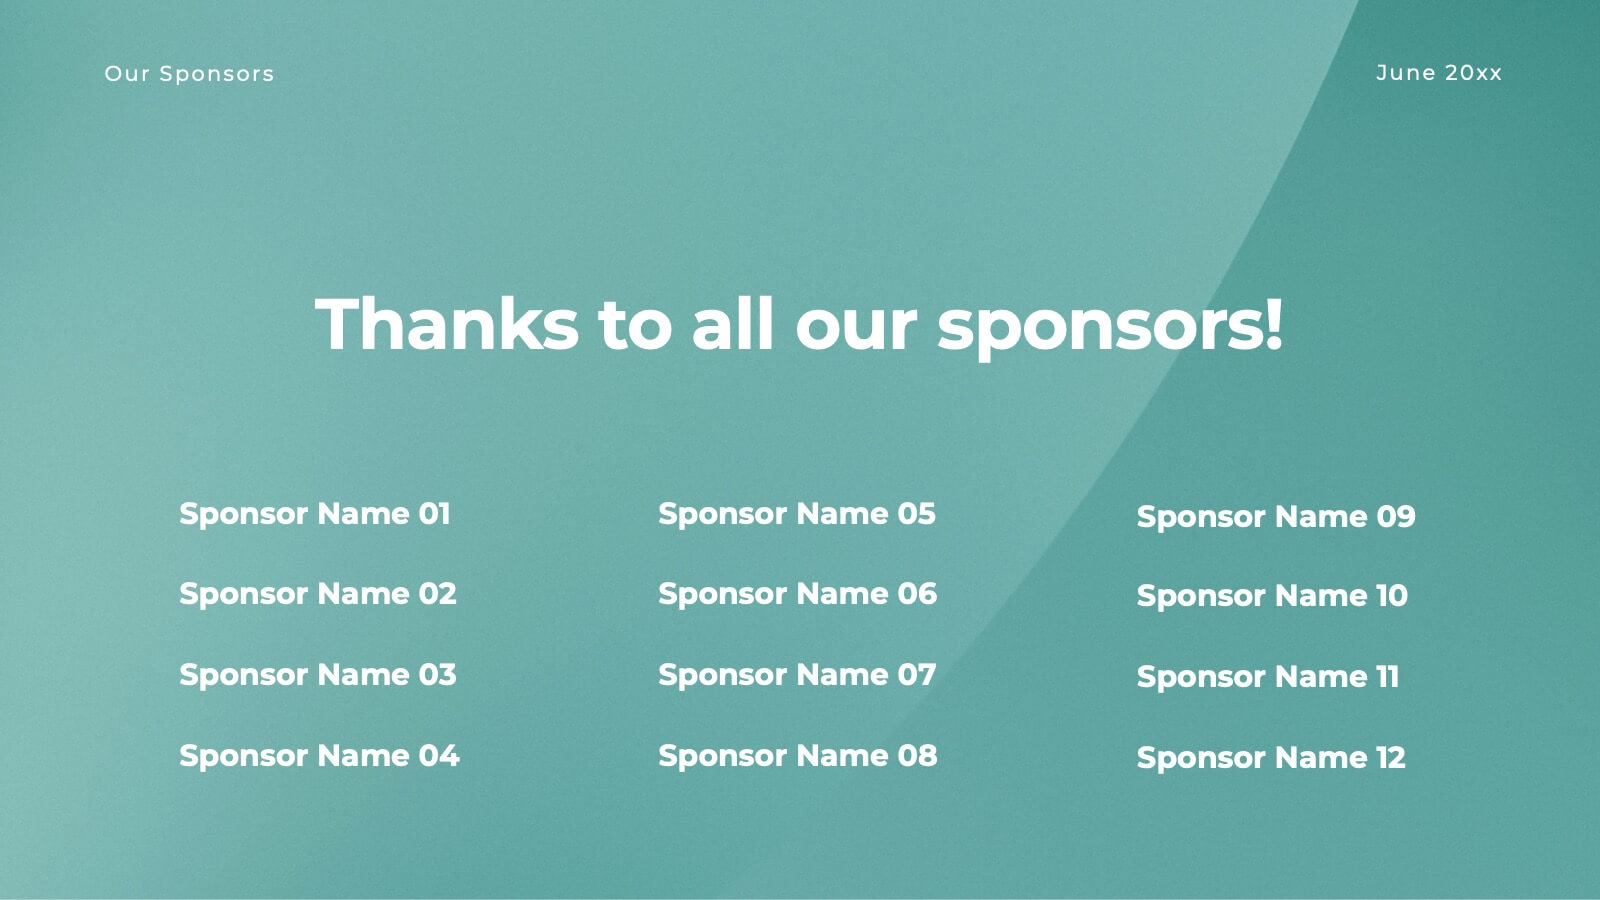
Streamline your business presentations with this versatile pitch deck template! Ideal for conferences and meetings, it includes slides for objectives, session details, keynote speakers, and panel discussions. Keep your audience engaged with professional design and clear, structured content. Compatible with PowerPoint, Keynote, and Google Slides for seamless presentations on any platform.


4 slides
OKRs Alignment for Performance Goals Presentation
Visualize and align your objectives with precision using the OKRs Alignment for Performance Goals Presentation. This template illustrates how Objectives, Key Activities, and Results converge toward a shared target, helping you communicate goals clearly to teams and stakeholders. Perfect for quarterly planning, team alignment, and executive reviews. Fully editable in Canva, PowerPoint, Keynote, and Google Slides.


6 slides
30 60 90 Day Plan for Executives Infographics
Develop a strategic plan for executives with our customizable 30, 60, and 90 Day Plan for Executives infographic template. This template is fully compatible with popular presentation software like PowerPoint, Keynote, and Google Slides, allowing you to easily customize it to outline the key objectives and priorities for executives over these timeframes. The 30, 60, and 90 Day Plan for Executives infographic template offers a visually engaging platform to structure and communicate short-term goals, milestones, and initiatives for executive leaders. Whether you're an executive, manager, or HR professional, this template provides a user-friendly canvas to create informative presentations and strategic plans. Optimize executive performance and alignment with this SEO-optimized 30, 60, and 90 Day Plan for Executives infographic template, thoughtfully designed for clarity and ease of use. Customize it to showcase specific objectives, key projects, performance metrics, and alignment with broader organizational goals, ensuring that executives have a clear roadmap for success. Start crafting your personalized infographic today to help executives drive strategic impact in their roles.


5 slides
Corporate Risk Assessment Framework Presentation
Streamline corporate risk evaluations with a structured framework. This Corporate Risk Assessment Framework provides a clear, organized approach to identifying, analyzing, and managing risks. Ideal for business strategists, project managers, and compliance teams. Fully customizable and compatible with PowerPoint, Keynote, and Google Slides for seamless integration into your workflow.


5 slides
Smart Decision Making Models Presentation
Make complex choices simple with this modern and colorful template designed to visualize analytical thinking and structured planning. Ideal for presenting frameworks, strategies, or goal-setting models, it helps communicate logic and clarity effectively. Fully compatible with PowerPoint, Keynote, and Google Slides for smooth customization and presentation delivery.


7 slides
Asia Map Geography Infographic
Explore the diverse landscapes and key data of Asia with our collection of Asia Map Infographics. These templates are expertly designed to illustrate various geographical and demographic insights across the continent, making them ideal for educational purposes, business presentations, or travel-related projects. Each infographic is crafted with a clean, clear layout that highlights different countries, regions, and significant data points such as population density, economic indicators, or cultural statistics. The use of color coding and spatial markers ensures that information is easily understandable and visually appealing. Fully customizable, these templates allow you to adjust the data points, colors, and text to suit specific presentation needs or to focus on particular areas of interest. Whether you're a teacher, a business analyst, or a traveler preparing a presentation, these slides offer a valuable resource for conveying complex geographical data in a straightforward and engaging manner.


6 slides
Demographic and Behavioral Customer Profile Presentation
Understand your audience better with the Demographic and Behavioral Customer Profile Presentation. This visually engaging template separates key demographic details from behavior-based insights to help you build more effective marketing strategies. Fully customizable in Canva, PowerPoint, or Google Slides—perfect for marketers, strategists, and sales teams targeting customer segmentation.


22 slides
Tranquil Project Status Report Presentation
This dynamic project report template delivers key insights with a bold, modern design. From performance metrics to market trends and client feedback, it's crafted for comprehensive yet visually appealing updates. Perfect for team presentations, this template ensures clarity and engagement. Compatible with PowerPoint, Keynote, and Google Slides, it’s ideal for project leaders!


4 slides
Economic Trends and Analysis of North America Map Presentation
Present key regional insights with this North America economic analysis map. Compare up to four locations using percentage stats and customizable titles. Ideal for showcasing market trends, financial metrics, or growth data. Fully editable in PowerPoint, Keynote, and Google Slides—perfect for economic forecasts, business reports, or strategy meetings.


7 slides
Business Continuity Plan Infographic Presentation
A well-written business plan helps entrepreneurs focus on their next steps, anticipate challenges and overcome them before they occur. This template will guide you through the process of writing a professional, successful and effective business plan. This template design is highly visual, vibrant and engaging with neutral colors. It uses the best parts of a business plan, such as graphs and charts, to visualize your ideas. This business plan infographic is a sharp visual aid for investors, partners, board members and anyone else who needs to know more about what you do and how you plan to grow.


7 slides
Digital Marketing Services Infographic
A Digital Marketing Services Infographic is a visual representation of information and data related to digital marketing services. This template is a type of graphic design that presents complex or large amounts of information in a simple and informative way. This infographic includes statistics, charts, graphs, and other visual elements to convey your information about various aspects of digital marketing, such as social media marketing, content marketing, search engine optimization, email marketing, and paid advertising. Compatible with Powerpoint, Keynote and Google Slides.


7 slides
Mind Map Process Infographic
A Mind Map Process Infographic is a visual representation that illustrates a process or a series of steps using the structure and principles of a mind map. This template diagram is a dynamic visual guide to help individuals and teams harness the true potential of mind mapping. This is used to visually organize information in a hierarchical and interconnected manner, often starting with a central concept or theme and branching out into related ideas or subtopics. Mind maps are the ultimate tool for brainstorming, planning, and innovating, and this template is your gateway to unlocking their full potential.


5 slides
Porter's Five Forces Market Analysis
Visualize competitive dynamics with this clear, easy-to-follow Porter’s Five Forces slide. Each force—Buyer Power, Supplier Power, Competitive Rivalry, Threat of Substitution, and Threat of New Entry—is color-coded and icon-labeled for quick reference. Perfect for strategy meetings, SWOT comparisons, or investment pitches. Editable in PowerPoint, Keynote, and Google Slides.


7 slides
Stock Market Futures Infographic
The stock market, also known as the equity market or share market, is a platform where buying, selling, and issuing shares of publicly-held companies take place. This infographic template serves as your compass through the intricate landscape of stocks and futures, empowering you with the knowledge to steer your investments towards a prosperous horizon. Compatible with Powerpoint, Keynote, and Google Slides. The striking visualizations present the clash between the bullish and bearish market forces, symbolizing the constant struggle that drives market movements. Easily showcase the latest stock prices with this template.


4 slides
Digital Payment and Card Services Presentation
Step into the world of contactless commerce with this clean, modern slide design. It’s built to help you present how digital payment systems and card-based services are transforming transactions in today’s economy. Perfect for fintech updates, product walkthroughs, or training decks. Fully compatible with PowerPoint, Keynote, and Google Slides.


6 slides
International Business Strategy World Map Presentation
Showcase your company’s global presence and strategic insights with this dynamic International Business Strategy World Map slide. Each marker corresponds to key business regions, linked to five customizable titles for region-specific data, objectives, or metrics. Clean design with a vertical legend layout keeps the focus on your insights. Fully editable and compatible with PowerPoint, Keynote, and Google Slides.