


Features
- 8 Unique slides
- Fully editable and easy to edit in Microsoft Powerpoint, Keynote and Google Slides
- 16:9 widescreen layout
- Clean and professional designs
- Export to JPG, PDF or send by email


Do you have any questions?
Recommend


20 slides
Celestique Photography Portfolio Template Presentation
This Photography Portfolio Presentation offers a sleek and modern design to showcase your work professionally. Featuring sections for project highlights, creative process, client testimonials, and pricing, it's fully customizable and easy to edit in PowerPoint, Keynote, and Google Slides. Perfect for photographers looking to impress potential clients.


5 slides
The History of Beer Infographics
Beer has a long and fascinating history that dates back thousands of years, throughout its history beer has played a significant role in social, cultural, and economic contexts. These engaging infographics take viewers on a journey through the fascinating history of beer. It provides a comprehensive overview of the origins, evolution, and cultural significance of beer throughout different eras and regions. This visual resource is perfect for beer enthusiasts, historians, and anyone interested in the cultural and historical aspects of this beloved beverage. Compatible with Powerpoint, Keynote, and Google Slides.


5 slides
Animal Health and Veterinary Care Presentation
Promote optimal animal health and veterinary practices with our comprehensive presentation template. Designed to facilitate discussions on veterinary care, this template is perfect for educational seminars, veterinary training, or healthcare meetings, ensuring all aspects of animal welfare are covered effectively.


10 slides
Risk Evaluation and Control Measures Presentation
Showcase your strategy for minimizing business risks with the Risk Evaluation and Control Measures Presentation. This upward arrow layout helps illustrate progressive risk management stages—from identification to control. Ideal for business continuity plans, audits, and compliance reporting. Fully customizable in Canva, PowerPoint, Keynote, and Google Slides.


7 slides
Transportation & Logistics Management Infographic
Transportation and logistics refer to the management, planning, and coordination of the movement of goods, people, and information from one place to another. This professionally crafted template is designed to guide and inspire professionals in the fast-paced domain of transportation and logistics management. Explore key concepts, strategies, and best practices that drive operational excellence and ensure seamless supply chain movements. This is compatible with Powerpoint, Keynote, and Google Slides. This infographic is your compass through the world of transportation and logistics.


5 slides
Health Care Access and Equity Infographics
Health Care Access refers to the ability of individuals and communities to obtain medical services and receive appropriate care when needed. These infographic templates serve as an educational and advocacy tool, helping to raise awareness about the importance of equitable healthcare access and the need for addressing disparities. Whether used in healthcare organizations, educational settings, or public awareness campaigns, this template effectively communicates the urgency of achieving health equity and encourages individuals to take action towards a more equitable healthcare system. Compatible with Powerpoint, Keynote, and Google Notes.


6 slides
Business Network Diagram Presentation
Bring your digital ecosystem to life with this modern presentation design. Ideal for showcasing system connections, IT workflows, or organizational networks, it helps visualize how key components interact seamlessly. Clean, structured, and fully customizable—compatible with PowerPoint, Keynote, and Google Slides for a professional and cohesive presentation every time.


7 slides
Smile Rating Operation Infographic
A smile rating is a way to measure or gauge satisfaction, happiness, or approval, often used in customer service, feedback systems, or surveys. This infographic template involves the use of smiley faces or emojis to represent different levels of contentment or approval. The purpose is to make feedback collection more engaging and easier for you and your audience. This template allows you to introduce the concept of a smile rating that celebrates smiles and rates experiences. This infographic will showcase how collective smiles paint a powerful picture of happiness and customer satisfaction.
22 slides
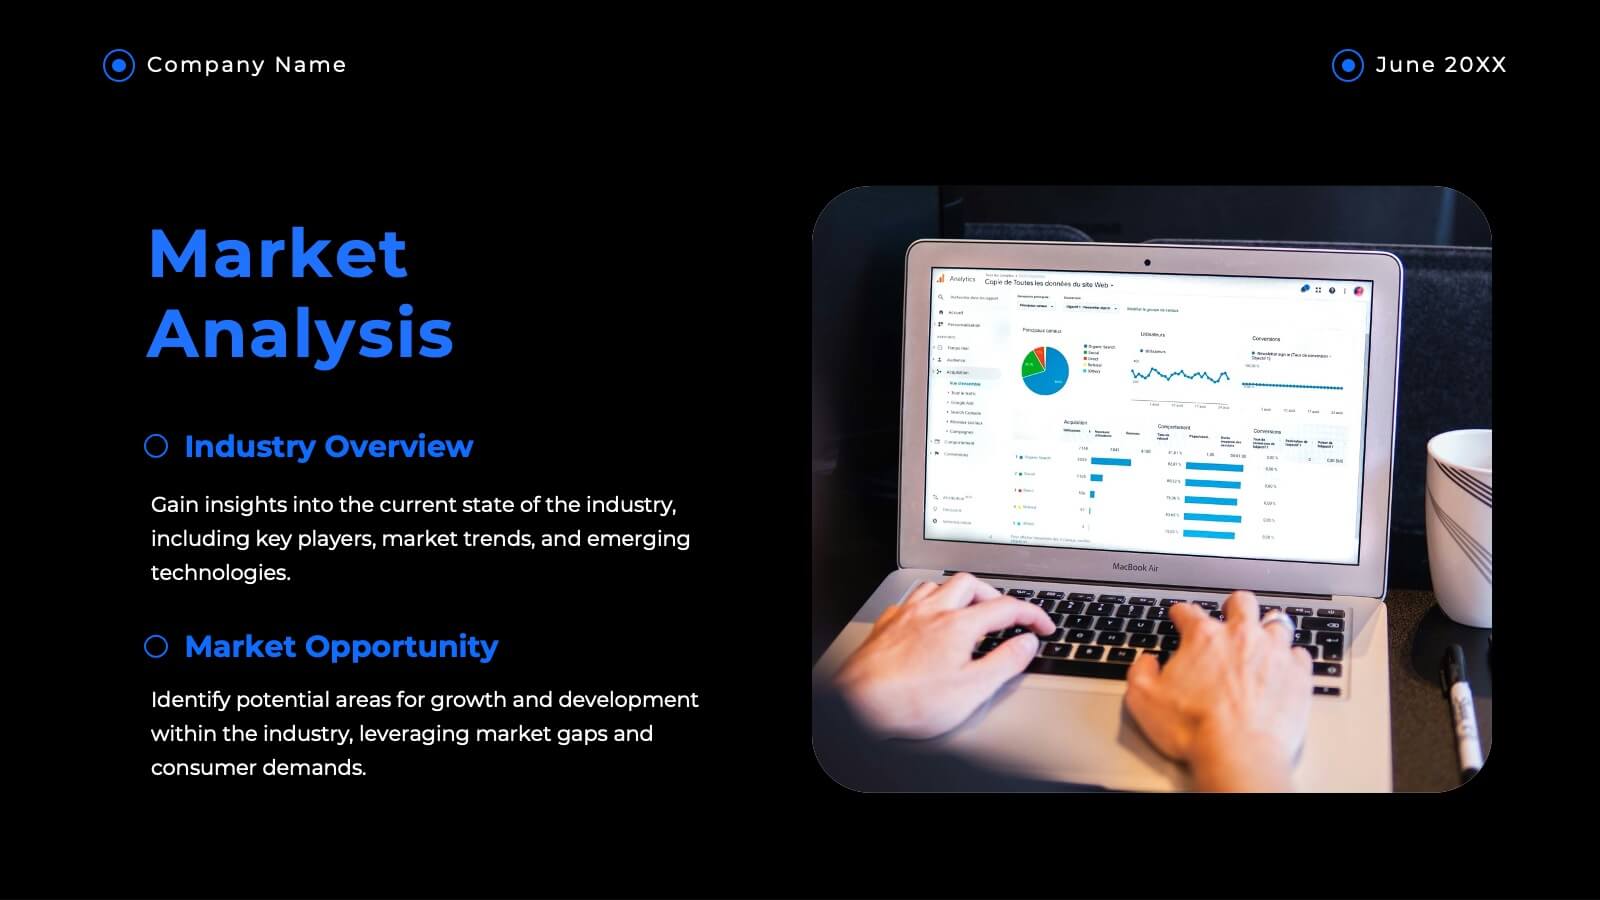
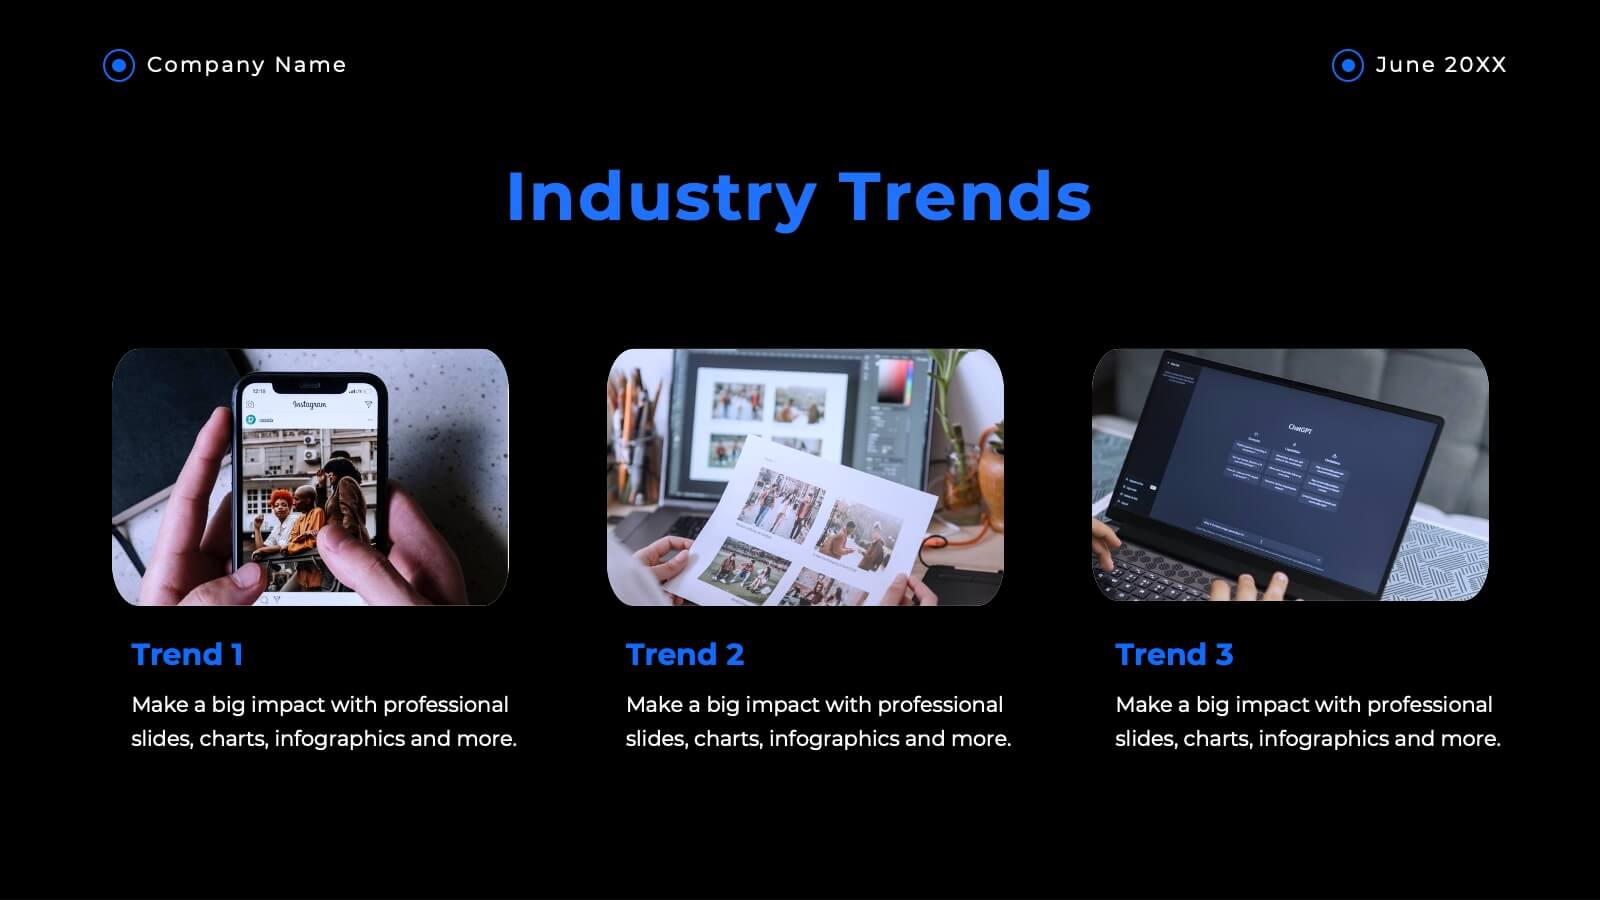
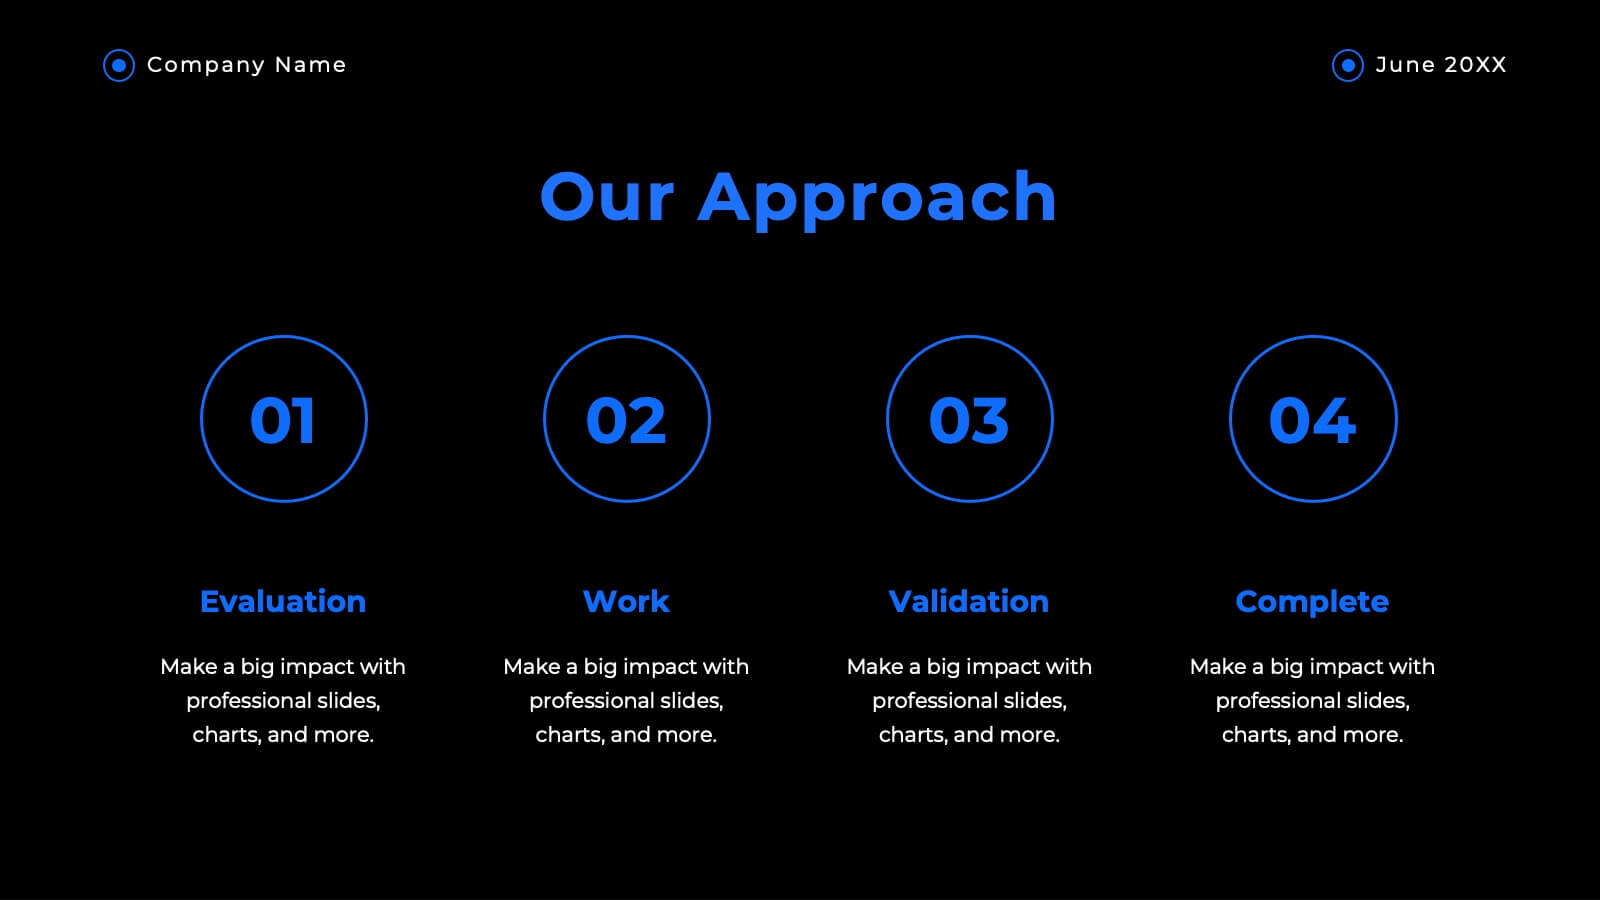
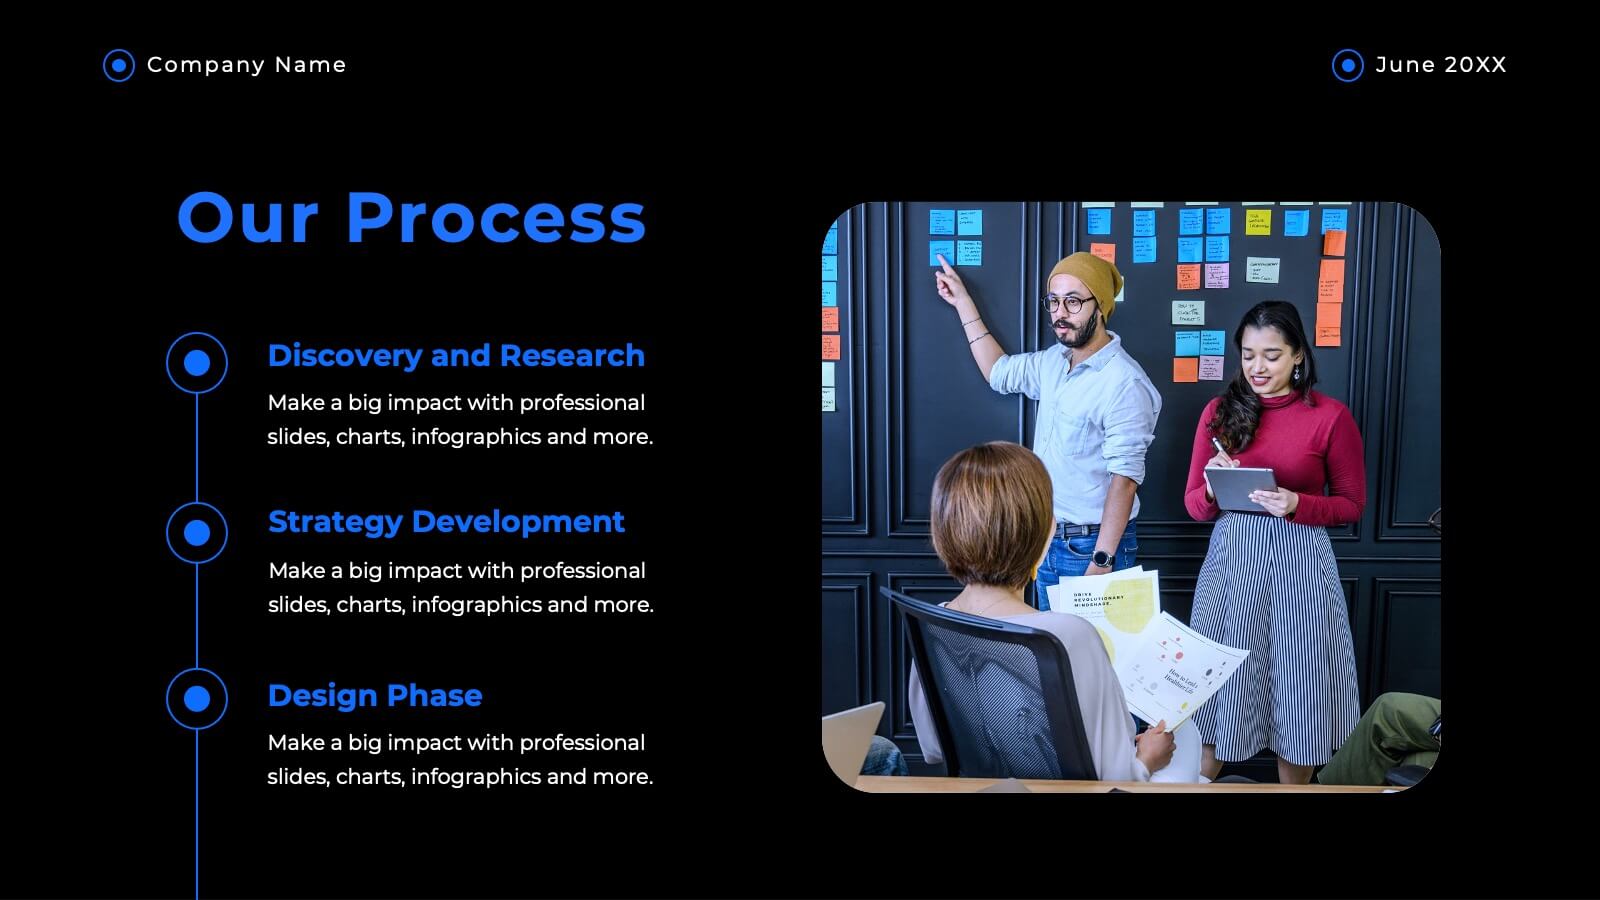
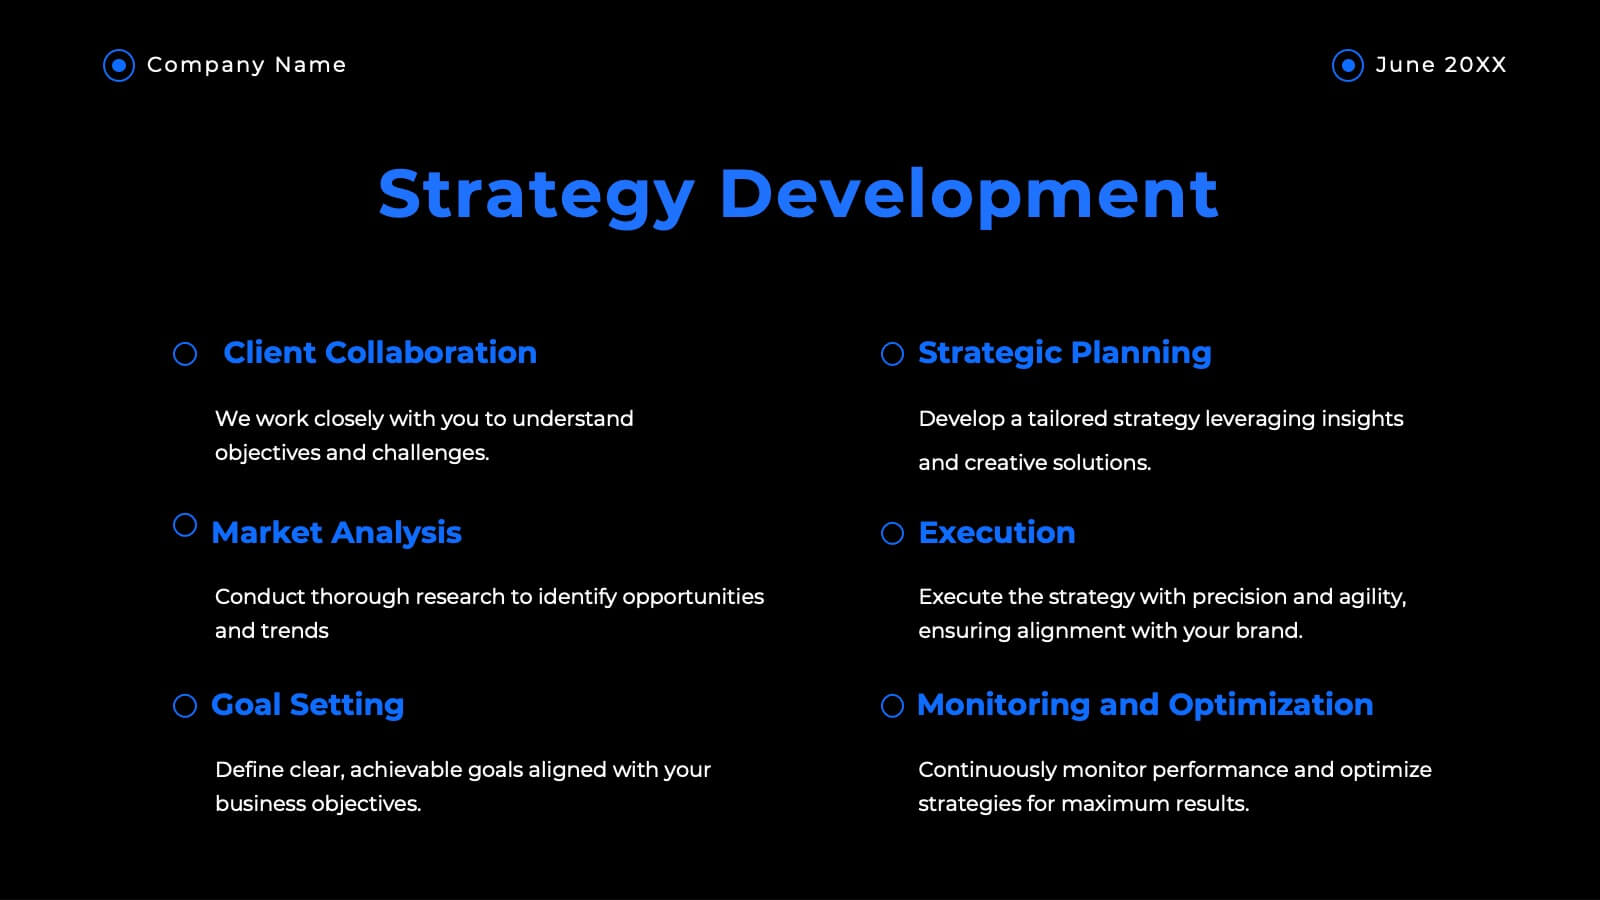
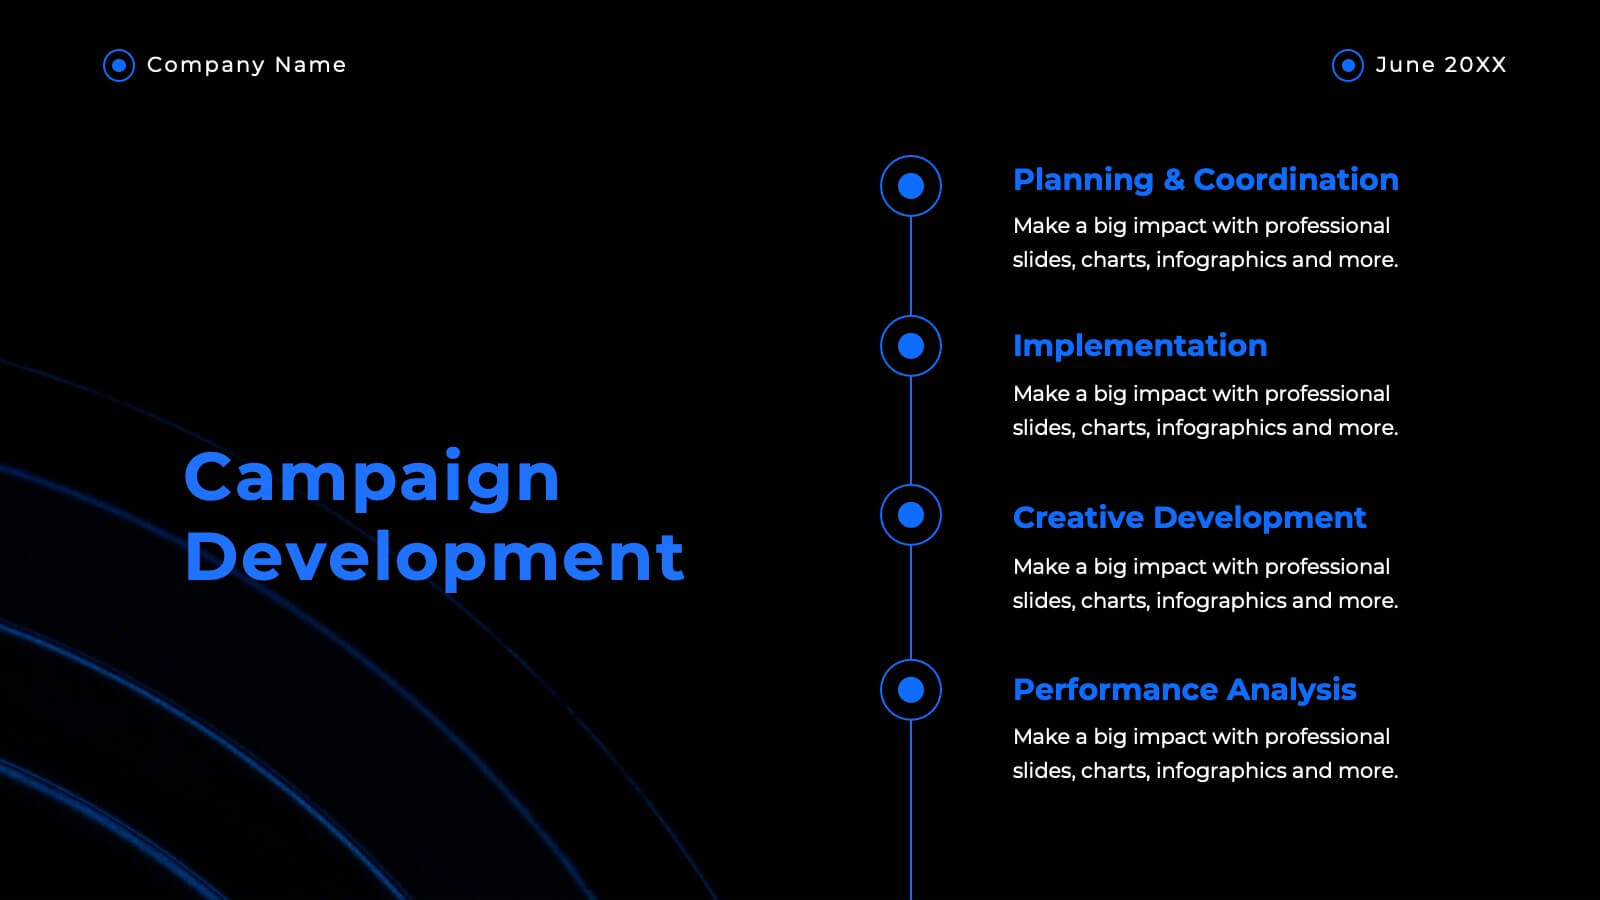
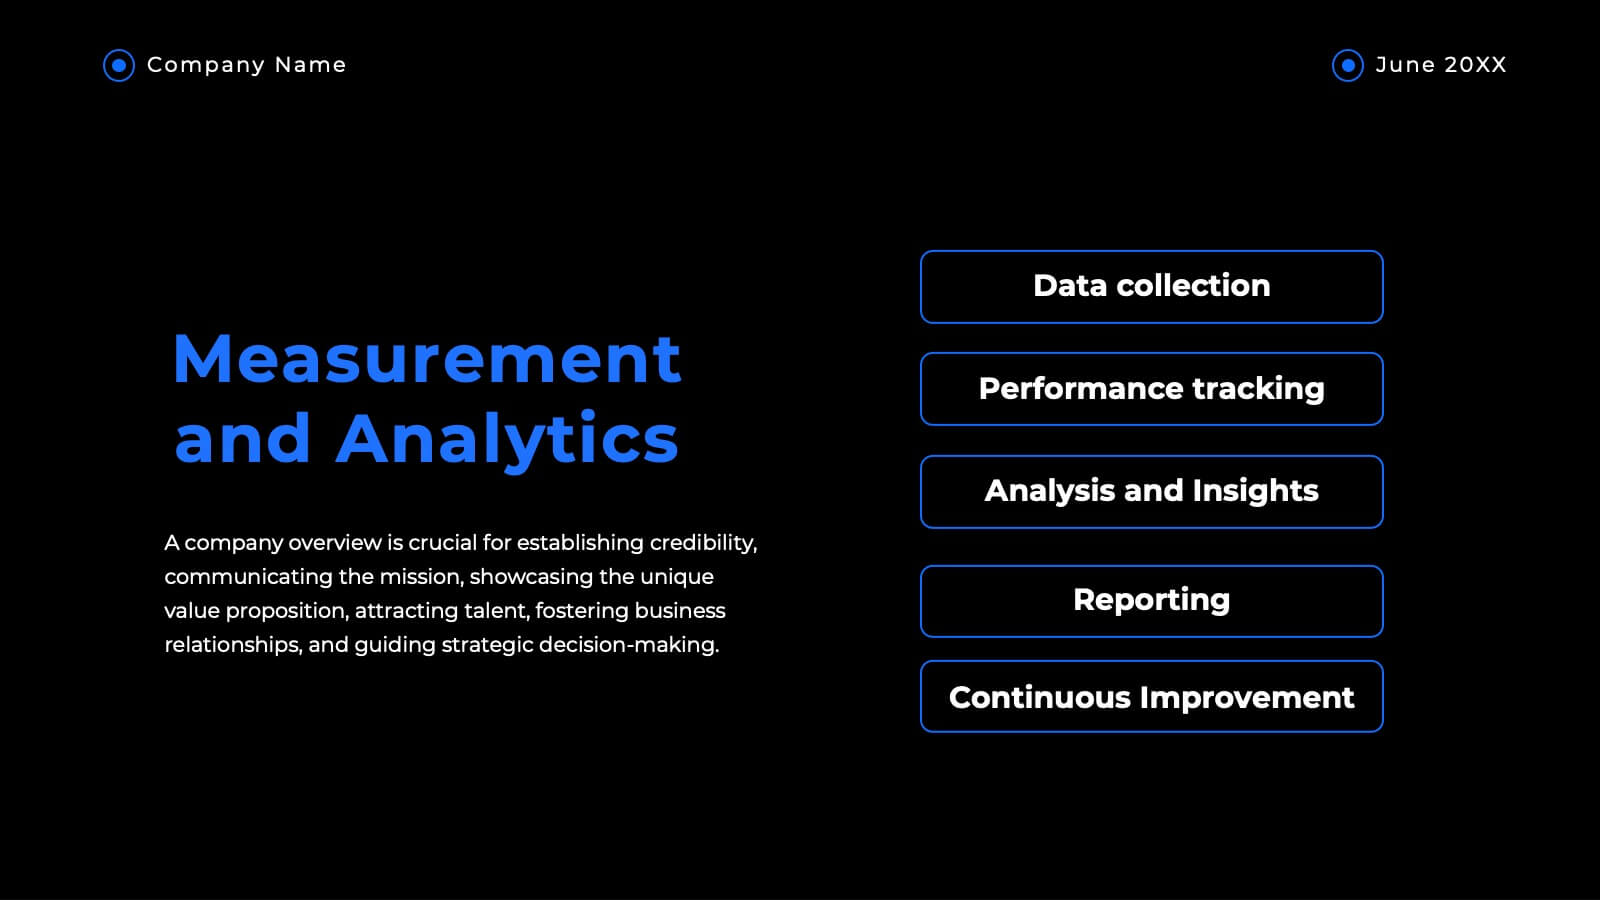
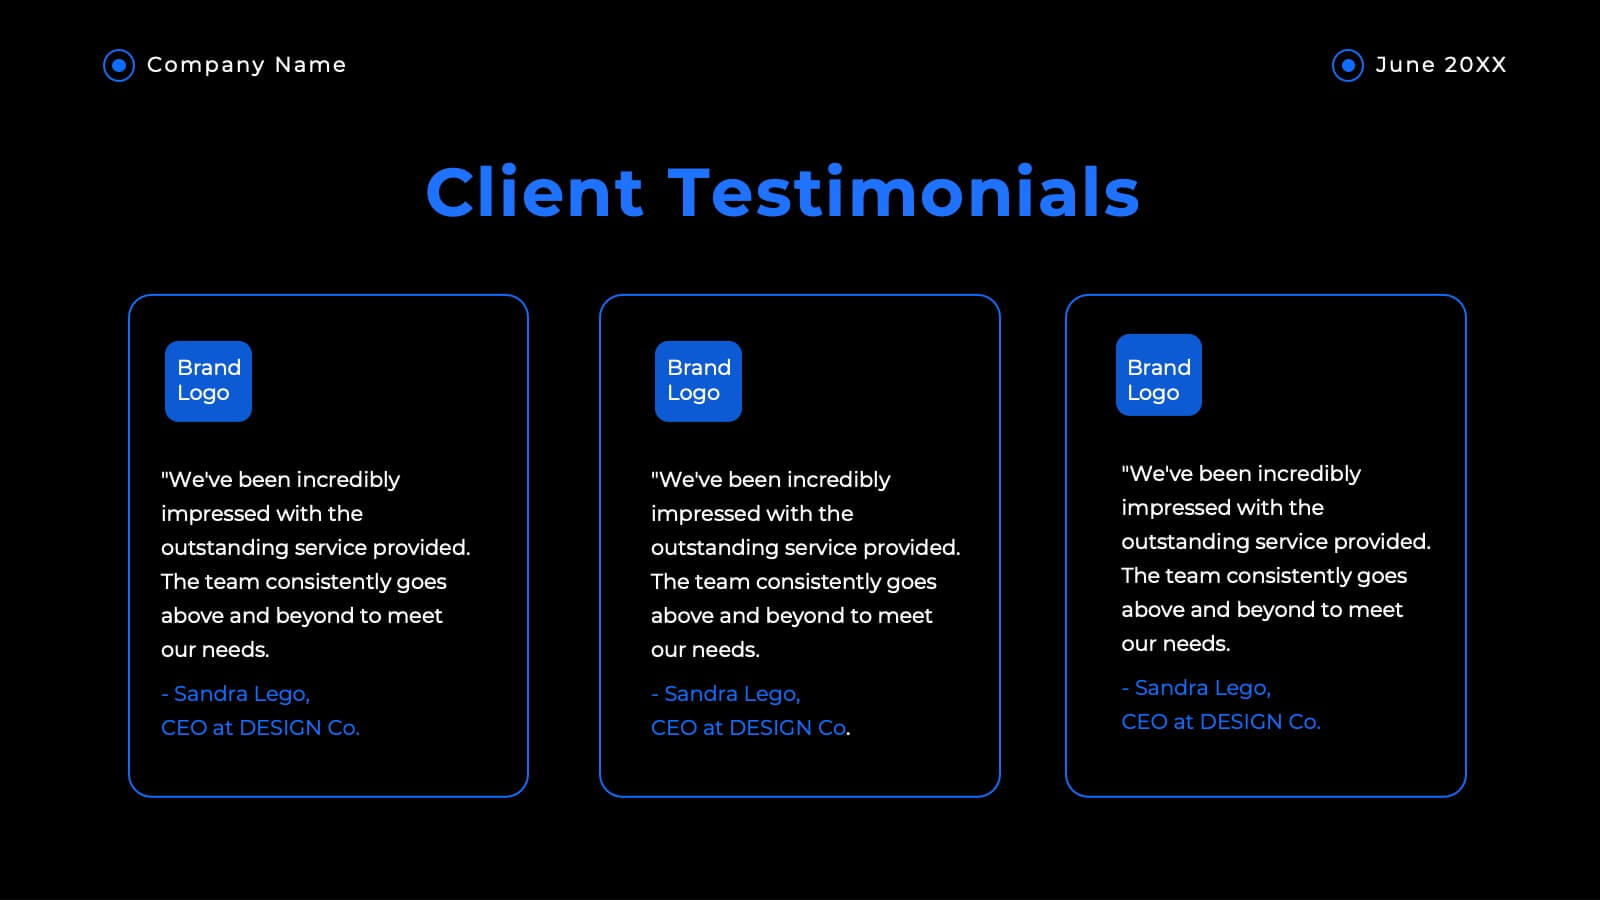
Haven Advertising Agency Proposal Presentation
Wow your clients with this sophisticated agency presentation template! Perfect for showcasing your services, client success stories, and market analysis. Ideal for agencies looking to impress and secure new business. Compatible with PowerPoint, Keynote, and Google Slides, this template ensures your proposals stand out with professional elegance. Perfect for any pitch or proposal.


7 slides
Communication Styles Infographic
Dive into the diverse world of communication with our communication styles infographic. Set against a palette of blue, yellow, and white, this template offers a visual exploration of different communication methods and their nuances. Whether it's assertive, passive, aggressive, or passive-aggressive, understanding these styles is vital in both personal and professional settings. Ideal for corporate trainers, educators, students, or anyone aiming to improve their interpersonal skills. Crafted for clarity and compatibility, this infographic is an excellent addition to PowerPoint, Keynote, and Google Slides, ensuring your presentations resonate with both substance and style.


4 slides
E-Learning Course Design Overview Presentation
Spark curiosity from the very first slide with a clean, modern layout that explains how effective online learning experiences are planned and delivered. This presentation walks through key elements of course structure, content flow, and learner engagement in a simple, visual way. Fully compatible with PowerPoint, Keynote, and Google Slides.


4 slides
Executive Data Overview Dashboard Presentation
Drive informed decision-making with the Executive Data Overview Dashboard Presentation. This sleek, data-centric slide layout features clean blocks for KPIs, progress percentages, and simple bar or donut charts—ideal for summarizing business insights, performance metrics, or operational updates. Fully editable in PowerPoint, Keynote, and Google Slides, it's designed for clarity, speed, and high-level reporting.


6 slides
Team Leadership and Management
Foster stronger collaboration with this team-focused circular diagram. Designed to showcase six key areas of team leadership, this template is perfect for outlining communication, goal-setting, delegation, performance, feedback, and development strategies. Ideal for managers, trainers, and HR professionals. Fully customizable in PowerPoint, Keynote, and Google Slides.


5 slides
Business Objectives and Strategic Goals Presentation
Clarify your roadmap to success with this visually structured Business Objectives and Strategic Goals slide. Featuring five segmented goal icons arranged in a semi-circle layout, this template is perfect for strategic planning, quarterly reports, and team briefings. Each section allows space to detail your specific objectives with matching visuals for easy comprehension. Fully editable in PowerPoint, Keynote, and Google Slides.


2 slides
Elegant Title Slide Design Presentation
Dress your presentation in sophistication with the "Elegant Title Slide," where simplicity meets style. This template elegantly frames your opening remarks in a polished and refined layout, highlighted by a chic, contemporary office backdrop. Perfect for any business aiming to impress, it's fully compatible with PowerPoint, Keynote, and Google Slides. Elevate your presentation game with this seamlessly designed slide.


5 slides
Physical Science Infographics
Immerse in the realm of physical sciences with our physical science infographics template. Set against a deep cosmos of blues and purples, this template serves as a bridge between complex scientific principles and audiences, ideal for educators, students, and science communicators. The design, balancing creativity and informativeness, integrates stunning graphics and icons, turning data and facts into captivating visual stories. This dark-themed, visually engaging layout is not just an educational tool, but a spark that ignites curiosity and exploration in classrooms, scientific presentations, or educational content, making science both profound and accessible.


6 slides
Customer Feedback Smile Rating Scale
Visualize customer satisfaction with this editable Smile Rating Scale Presentation. Featuring five emotive icons, it’s perfect for showcasing feedback, survey results, or performance reviews. Fully customizable in PowerPoint, Keynote, and Google Slides, it simplifies data presentation while adding a friendly, professional touch to your report or presentation.