


Features
- 7 Unique slides
- Fully editable and easy to edit in Microsoft Powerpoint, Keynote and Google Slides
- 16:9 widescreen layout
- Clean and professional designs
- Export to JPG, PDF or send by email


Do you have any questions?
Recommend


30 slides
Fusoria Brand Guidelines Proposal Presentation
Build a strong and cohesive brand identity with this sleek and professional brand guidelines proposal presentation. Covering essential topics like typography, color palettes, visual direction, and branding principles, this template helps you define and communicate your brand’s essence. Fully customizable and compatible with PowerPoint, Keynote, and Google Slides for a seamless presentation experience.


4 slides
Fixed and Variable Cost Balance Presentation
Visualize cost distribution using a balanced scale metaphor. This presentation helps compare fixed and variable costs with editable sections for data input. Ideal for financial planning, budgeting, or cost control analysis. Fully customizable in PowerPoint, Keynote, and Google Slides to match any brand or business presentation style.


26 slides
Personal Finance Management Presentation
Dive into the essentials of personal finance management with this comprehensive presentation template designed to empower individuals to achieve financial stability and growth. The template begins with an introduction that outlines the importance of effective financial management and the objectives of the presentation. It serves as a roadmap for those seeking to understand and enhance their financial literacy. In the main content section, the template offers detailed slides covering a variety of topics crucial for managing personal finances, such as budgeting strategies, savings plans, investment options, and debt management. Each slide is designed with clarity and focus, using engaging visuals and concise bullet points to explain complex financial concepts in an accessible manner. Features like comparison slides, process infographics, and timeline visuals help illustrate the progression and impact of good financial practices over time. The final segment ensures the presentation is practical for all users by confirming compatibility with popular platforms like PowerPoint, Google Slides, and Keynote. This ensures that the template can be easily accessed and utilized across different devices and settings, making it a versatile tool for individuals, financial advisors, or educational workshops looking to promote sound financial habits.


6 slides
Startup Investors Pitch Deck Presentation
Inspire confidence and spark investor interest with the Startup Investor Pitch Deck Presentation. Featuring a creative visual of a rocket launching from a piggy bank, this slide is ideal for illustrating funding momentum, business growth, or financial milestones. Each section allows space to highlight critical investment points such as traction, market opportunity, financials, and team highlights. Fully customizable in PowerPoint, Keynote, or Google Slides, this pitch-ready layout is perfect for entrepreneurs, startup founders, and innovation teams aiming to deliver a memorable and professional presentation.


5 slides
Creative Geometric Layouts Presentation
Give your content a fresh, modern spark with bold geometric elements that guide attention and create a clean visual rhythm. This presentation helps you structure ideas clearly, highlight key sections, and maintain a polished, creative look throughout your slides. Fully editable and compatible with PowerPoint, Keynote, and Google Slides.


4 slides
Effective Leadership Tips Presentation
Lead with clarity and confidence using this clean, modern presentation design. Perfect for sharing management insights, motivational principles, and communication strategies, it helps visualize ideas that inspire stronger teams and better decision-making. Fully editable and compatible with PowerPoint, Keynote, and Google Slides for effortless professional customization.


3 slides
Clean Water Initiative Overview Presentation
Communicate sustainability goals with this clean, modern layout featuring water droplet and faucet visuals. Ideal for summarizing three core focus areas of your environmental or nonprofit program. The minimalist design keeps attention on your key points. Fully editable and compatible with PowerPoint, Keynote, and Google Slides for easy customization.


5 slides
Agriculture Industry Infographics
Delve into the heart of the agricultural sector with our agriculture industry infographics. Cast in the earthy tones of green and yellow, reflecting growth and harvest, this template brings the farming industry to your fingertips. Its creative, vertical design infused with farm-style aesthetics makes it perfect for agricultural educators, and farming consultants seeking to present data with a touch of nature's essence. Compatible with Powerpoint, Keynote, and Google Slides. The template boasts graphics, intuitive icons, and flexible image placeholders. From showcasing industry trends to unraveling complex farming processes.


6 slides
Security Strategy and Risk Management Presentation
Keep your data safe and your strategy sharp with this modern, professional template built to explain protection frameworks, risk mitigation, and security planning. Its clean visuals make complex concepts easy to understand for teams and clients alike. Fully compatible with PowerPoint, Keynote, and Google Slides for effortless editing and presentation.


4 slides
Startup Investor Pitch Deck
Command investor attention with this dynamic Startup Pitch Deck slide. Featuring bold metrics, sleek data visualizations, and clean typography, it's designed to highlight growth and business potential. Fully editable in PowerPoint, Keynote, and Google Slides—ideal for tech, finance, and innovation-driven startups.
20 slides
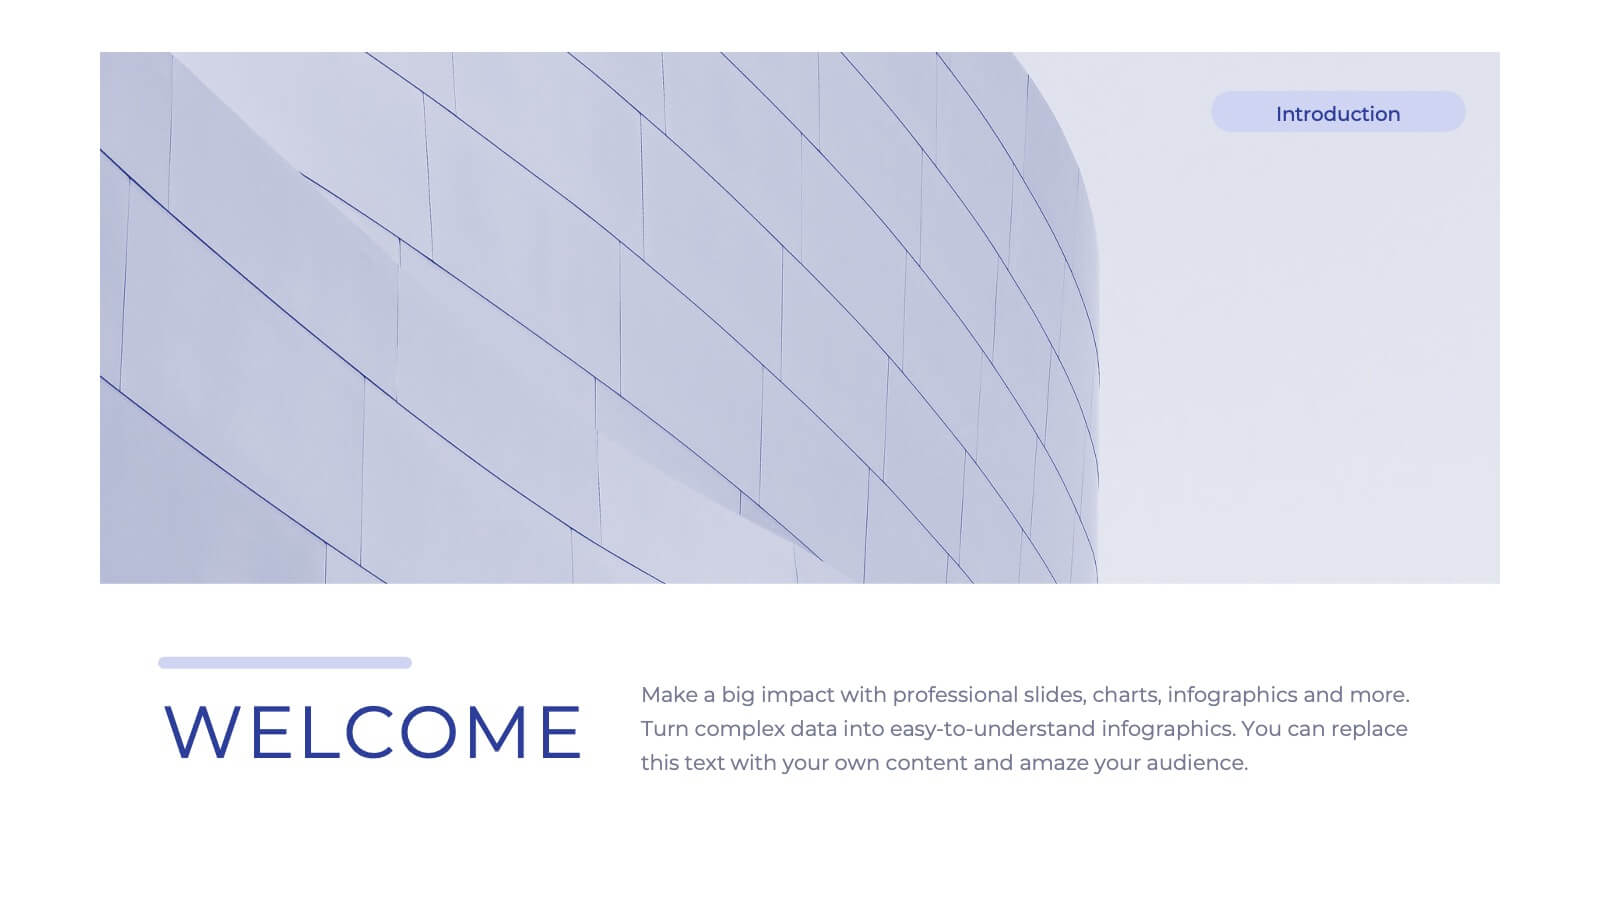
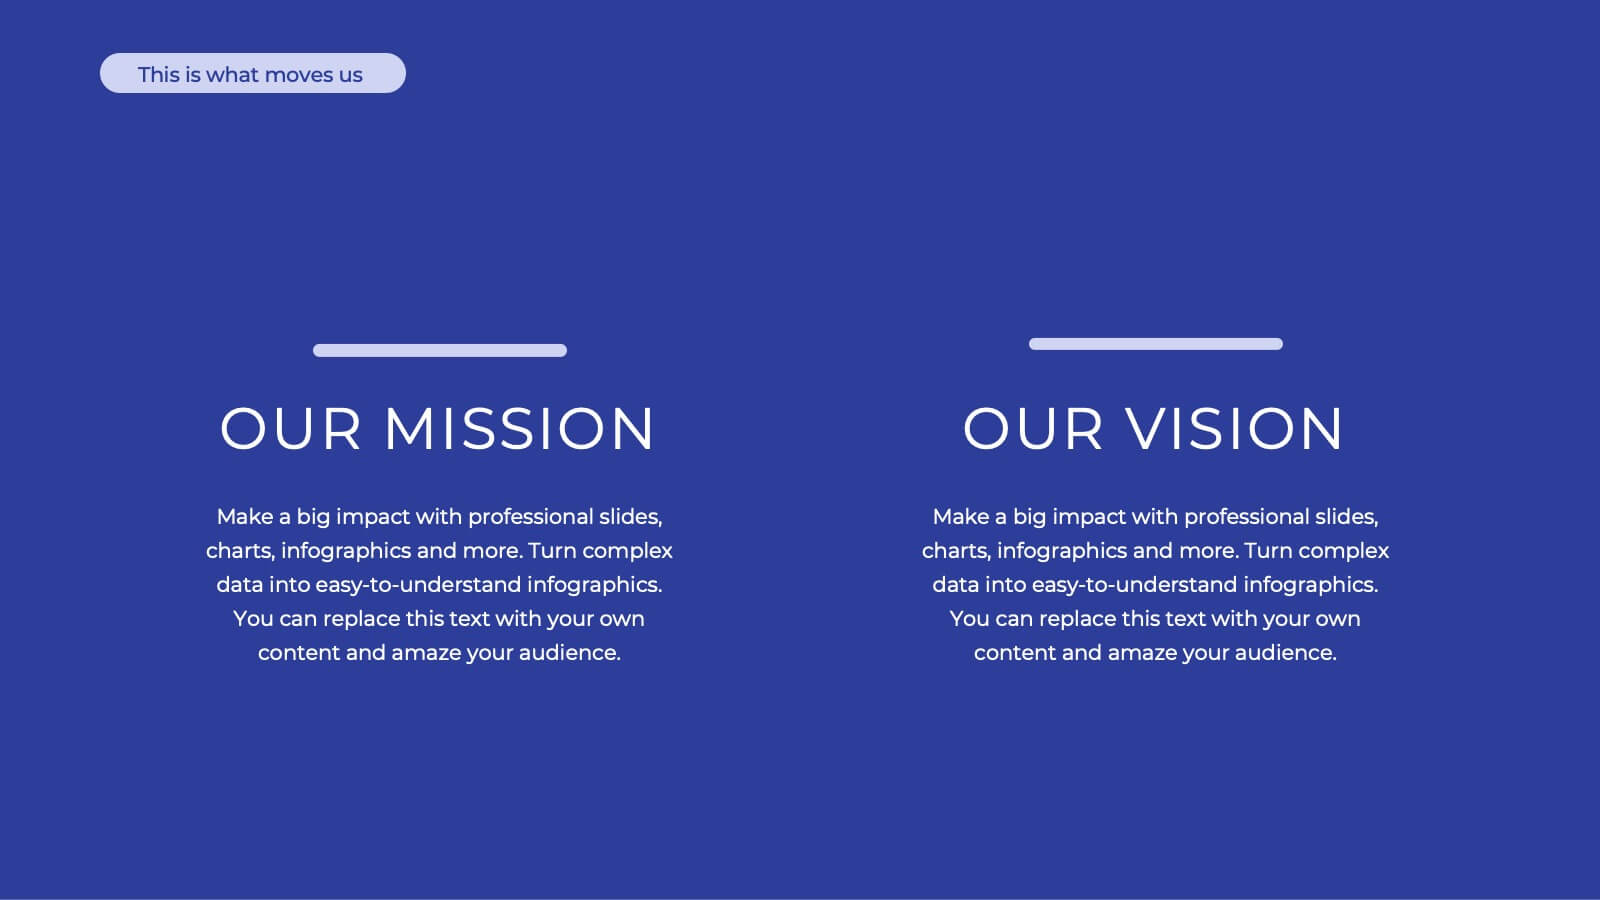
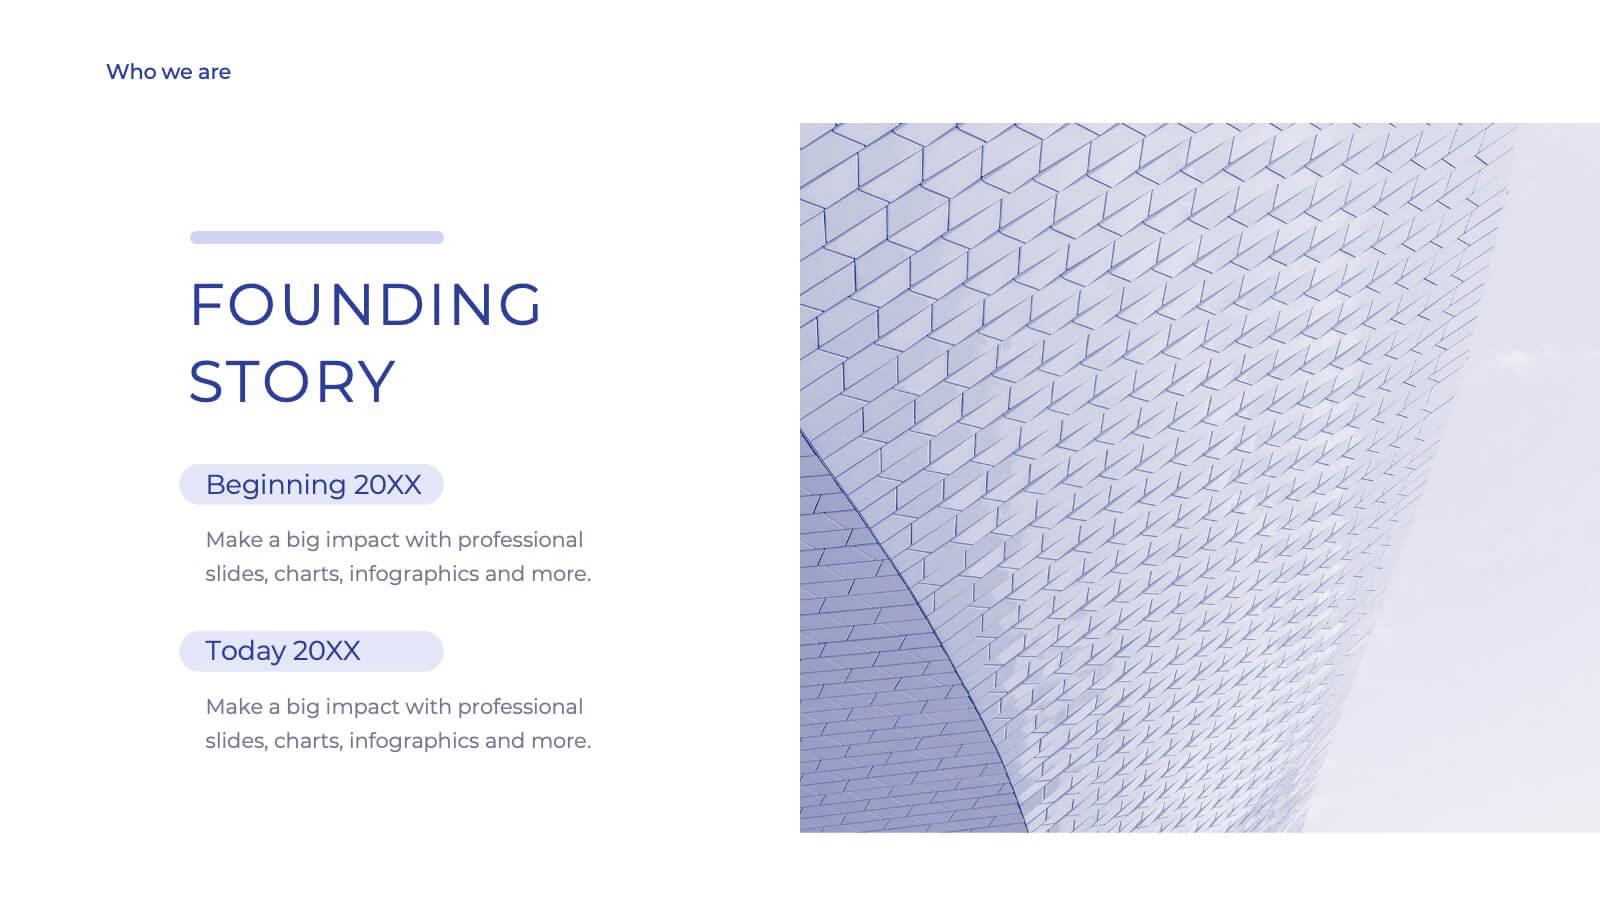
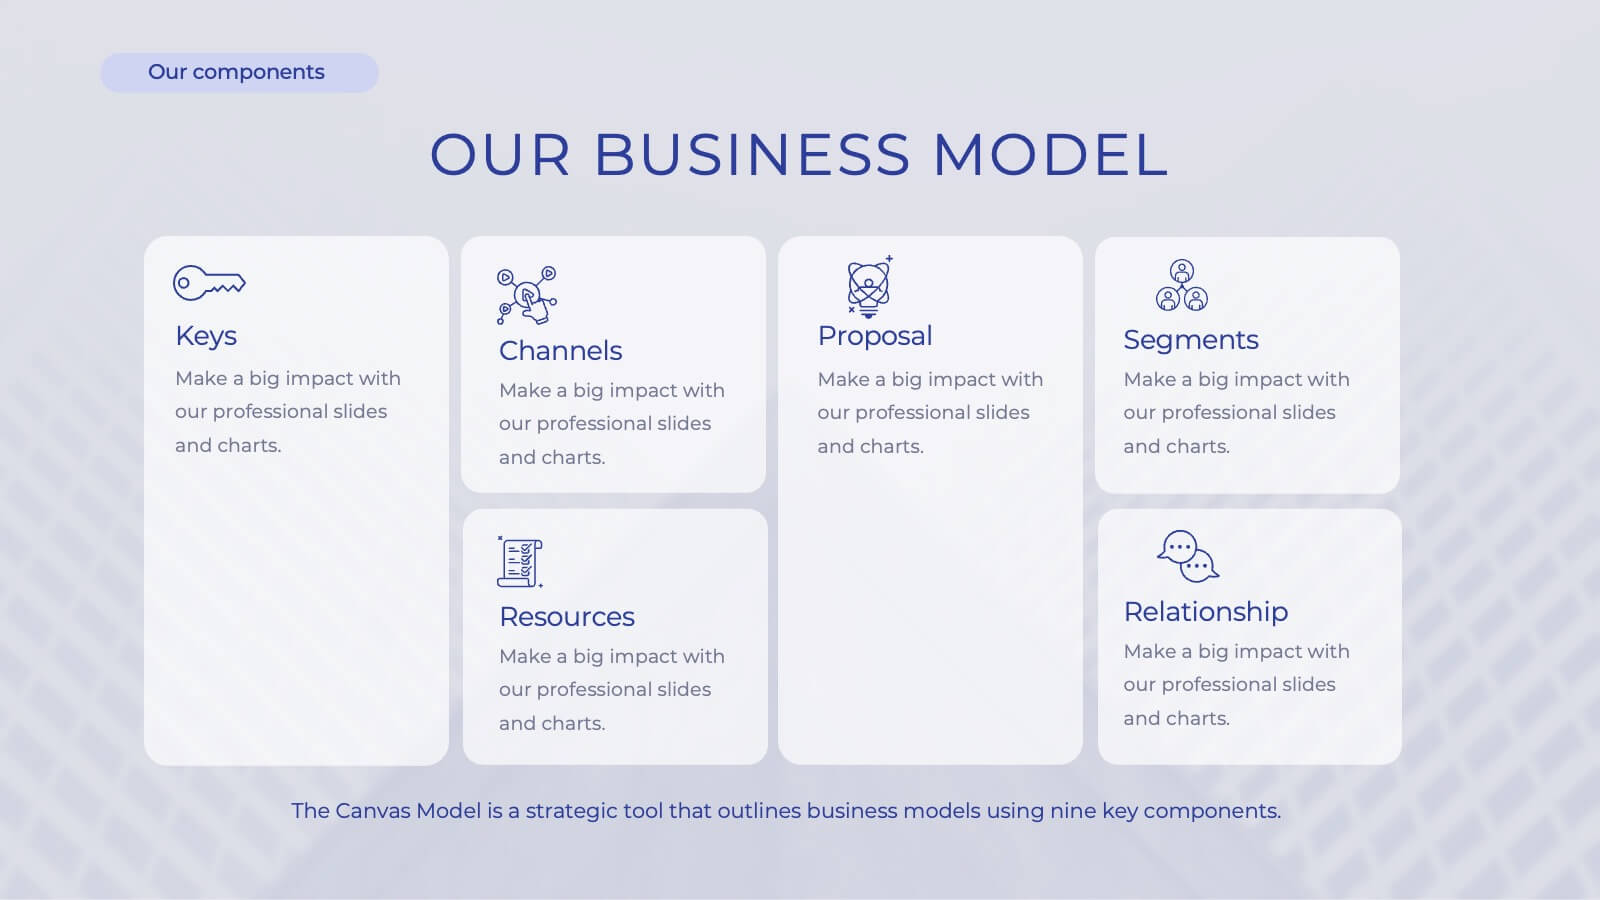
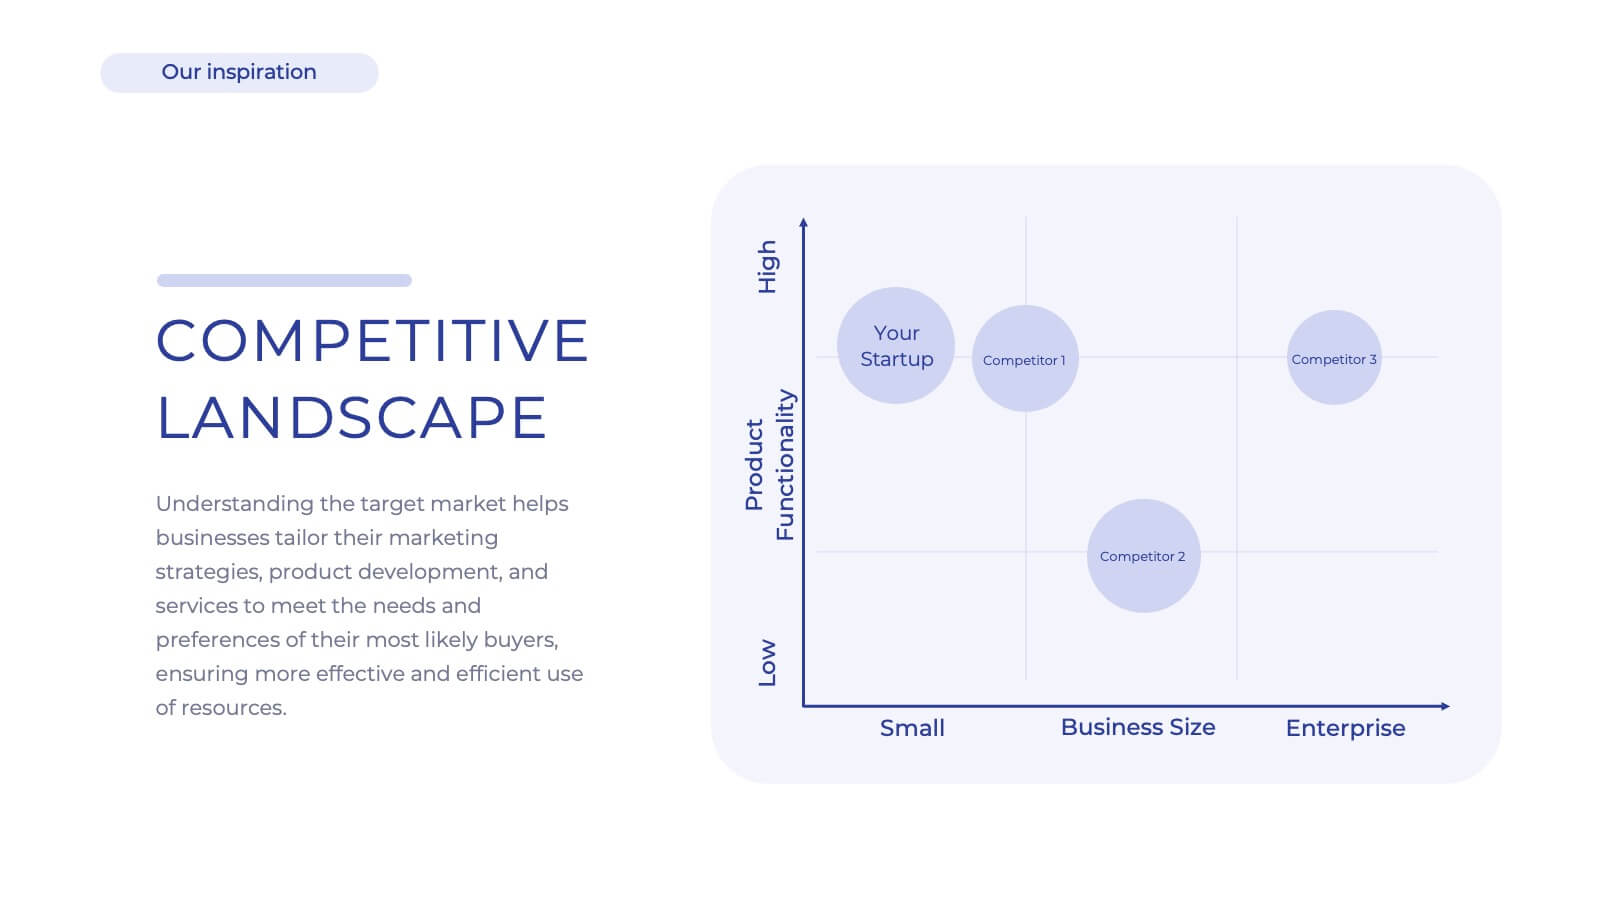
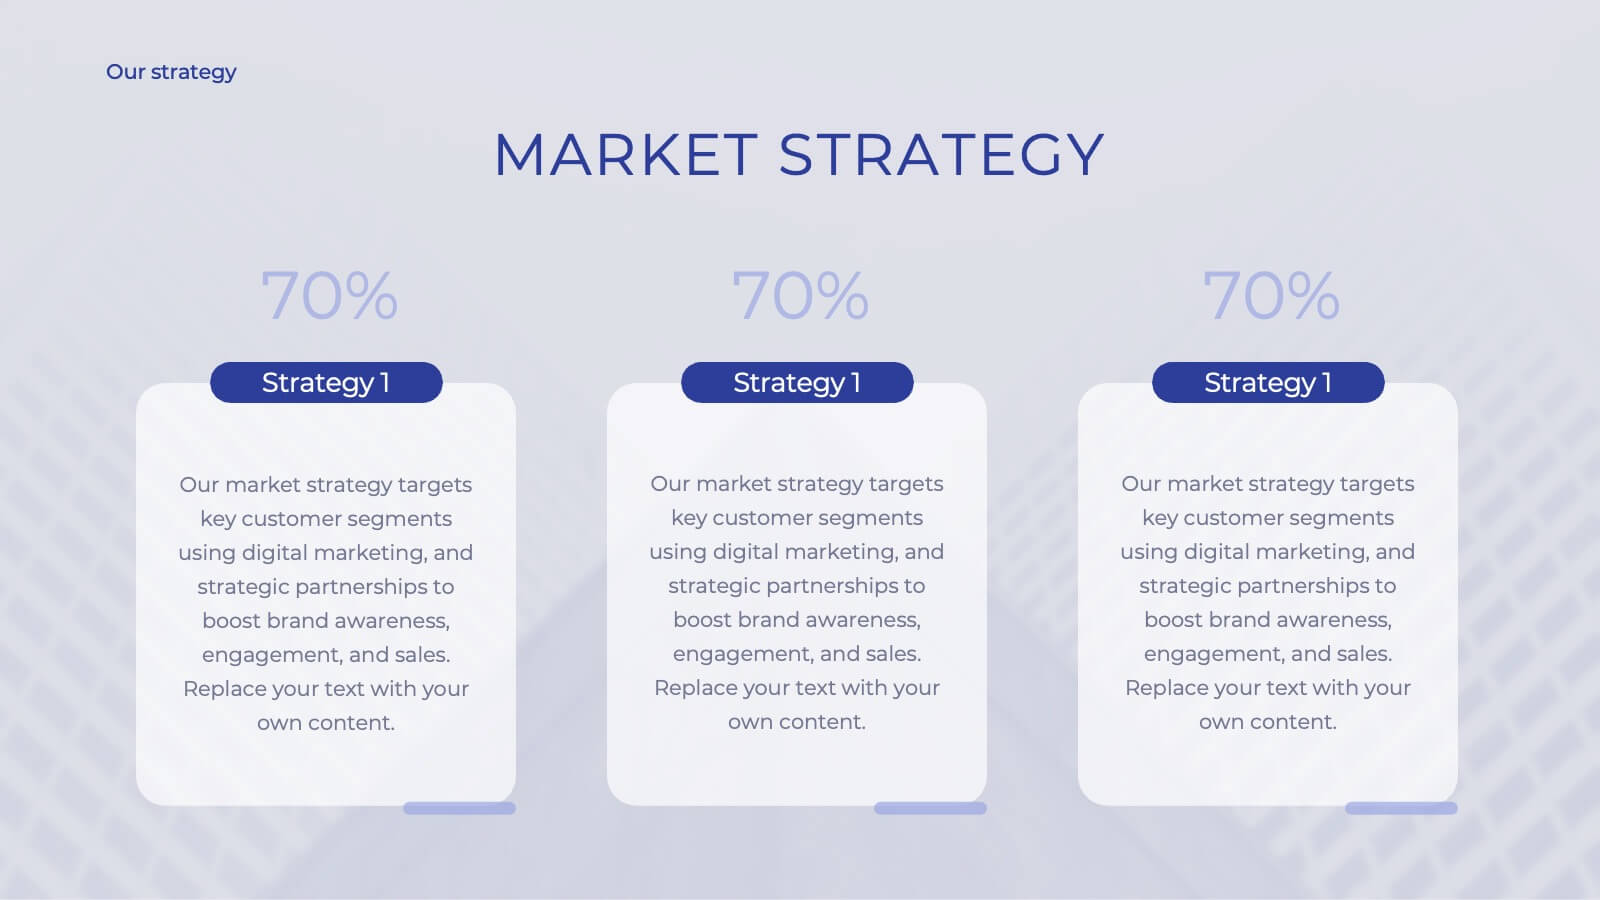
Iconic Startup Business Plan Presentation
Introducing our comprehensive corporate business plan template! Perfect for showcasing your company’s mission, vision, and services. Highlight your market strategy, competitive landscape, and growth plan in a professional design. Ideal for executives and entrepreneurs. Compatible with PowerPoint, Keynote, and Google Slides.


5 slides
Nutrition Facts Infographics
Nutrition facts provide important information about the nutritional content of food and beverages. This helps individuals make informed decisions about their dietary choices and understand the impact of food on their health. These infographic templates are designed to present essential information about nutrition and healthy eating habits. These infographics are suitable for nutritionists, dietitians, health educators, or anyone looking to communicate key facts and guidelines about nutrition in a clear and engaging manner. Compatible with Powerpoint, Keynote, and Google Slides, these are fully customizable.


4 slides
Interlocking Puzzle Chart Design Presentation
Unlock big ideas with a visual design that clicks your concepts together like a seamless 3D puzzle. This presentation makes it easy to explain connected processes, relationships, or strategic components in a clean, engaging way. Perfect for business, planning, and team alignment. Fully compatible with PowerPoint, Keynote, and Google Slides.


21 slides
Galactic Strategic Planning Report Presentation
Launch your strategic vision into the stars with this captivating Galactic-themed presentation template! Ideal for presenting a strategic planning report, it allows you to outline goals, action plans, and performance metrics with a sleek, cosmic design that captures attention. Compatible with PowerPoint, Keynote, and Google Slides for easy, seamless customization.


4 slides
Remote Learning Classroom Engagement Presentation
Make virtual classrooms more engaging with this clear, conversation-inspired visual. Designed for educators, trainers, and e-learning professionals, this infographic helps highlight interaction points, participation levels, or communication flows in remote learning. Easy to customize and fully compatible with PowerPoint, Keynote, and Google Slides.


26 slides
Katlina Presentation Template
Everyone wants to be on top of their SEO game. This Katlina presentation template provides a way for you to teach your audience about the importance of Search Engine Optimization. Start creating your own slides with this template. With fun graphics that will also make the information more interesting and easy to understand charts and timelines.This presentation will help your audience see how they can increase their sites visibility in search results. It can also be use for your presentations at work or in class due to it's customizability. Get started today makeing an impact in your industry.


6 slides
Progressive Work From Home Infographics
The "Progressive Work From Home" infographic template is an essential tool for today's evolving workplace. Compatible with PowerPoint, Keynote, and Google Slides, this template is designed for managers, team leaders, and organizations embracing the remote work model. This innovative template features essential elements of remote working, including tools for virtual collaboration, productivity metrics, and strategies for maintaining team cohesion. It's crafted to help you effectively communicate the benefits and best practices of remote work, making it invaluable for presentations aimed at optimizing work-from-home policies and procedures. The design is sleek and modern, with a color scheme that is both professional and uplifting. It embodies the flexibility and efficiency of remote work, making your presentation not just informative but also inspiring. Whether you're discussing remote work strategies with your team, presenting to management, or conducting a workshop, this template will ensure your message is clear, concise, and impactful.