


Features
- 24 Unique slides
- Fully editable and easy to edit in Microsoft Powerpoint, Keynote and Google Slides
- 16:9 widescreen layout
- Clean and professional designs
- Export to JPG, PDF or send by email


Do you have any questions?
Recommend


10 slides
Business Growth and Market Statistics Presentation
Showcase key business growth trends and market insights with the "Business Growth and Market Statistics" presentation templates. These visuals are crafted to enhance clarity in communicating growth drivers, market dynamics, and performance metrics effectively. Ideal for corporate presentations, they're compatible with PowerPoint, Keynote, and Google Slides, ensuring a professional look across all platforms.


6 slides
Professional Company Profile Deck Presentation
Present your business with impact using this modern company profile deck. Designed for clarity and professionalism, it includes structured icons, visual highlights, and customizable content sections. Ideal for pitches, internal briefings, or executive introductions. Fully editable in PowerPoint, Keynote, and Google Slides to match your brand and messaging effortlessly.


4 slides
Elegant Watercolor Background Presentation
Add a touch of sophistication to your presentation with soft watercolor textures that create a calming, professional atmosphere. Perfect for creative projects, proposals, or portfolios, this elegant design blends artistry with clarity. Fully compatible with PowerPoint, Keynote, and Google Slides for seamless customization and a refined visual finish.


6 slides
Monthly Business Calendar Planning Presentation
Stay on top of your schedule with this clean and effective business calendar template. Designed for monthly planning, each slide features a weekly breakdown across Monday through Saturday, allowing you to map out initiatives, tasks, or events. Customize labels for meetings, milestones, or campaigns with color-coded weeks and neat icons for quick reference. Ideal for project managers, team leads, and small businesses. Fully editable in PowerPoint, Keynote, and Google Slides.


6 slides
Business Decision Flow Model Presentation
Make smarter choices with this Business Decision Flow Model presentation. Clearly map out key decisions, steps, and potential outcomes using a structured, color-coded flow. Perfect for strategy reviews, team meetings, and executive briefings. Fully editable in Canva, PowerPoint, and Google Slides for seamless customization.


20 slides
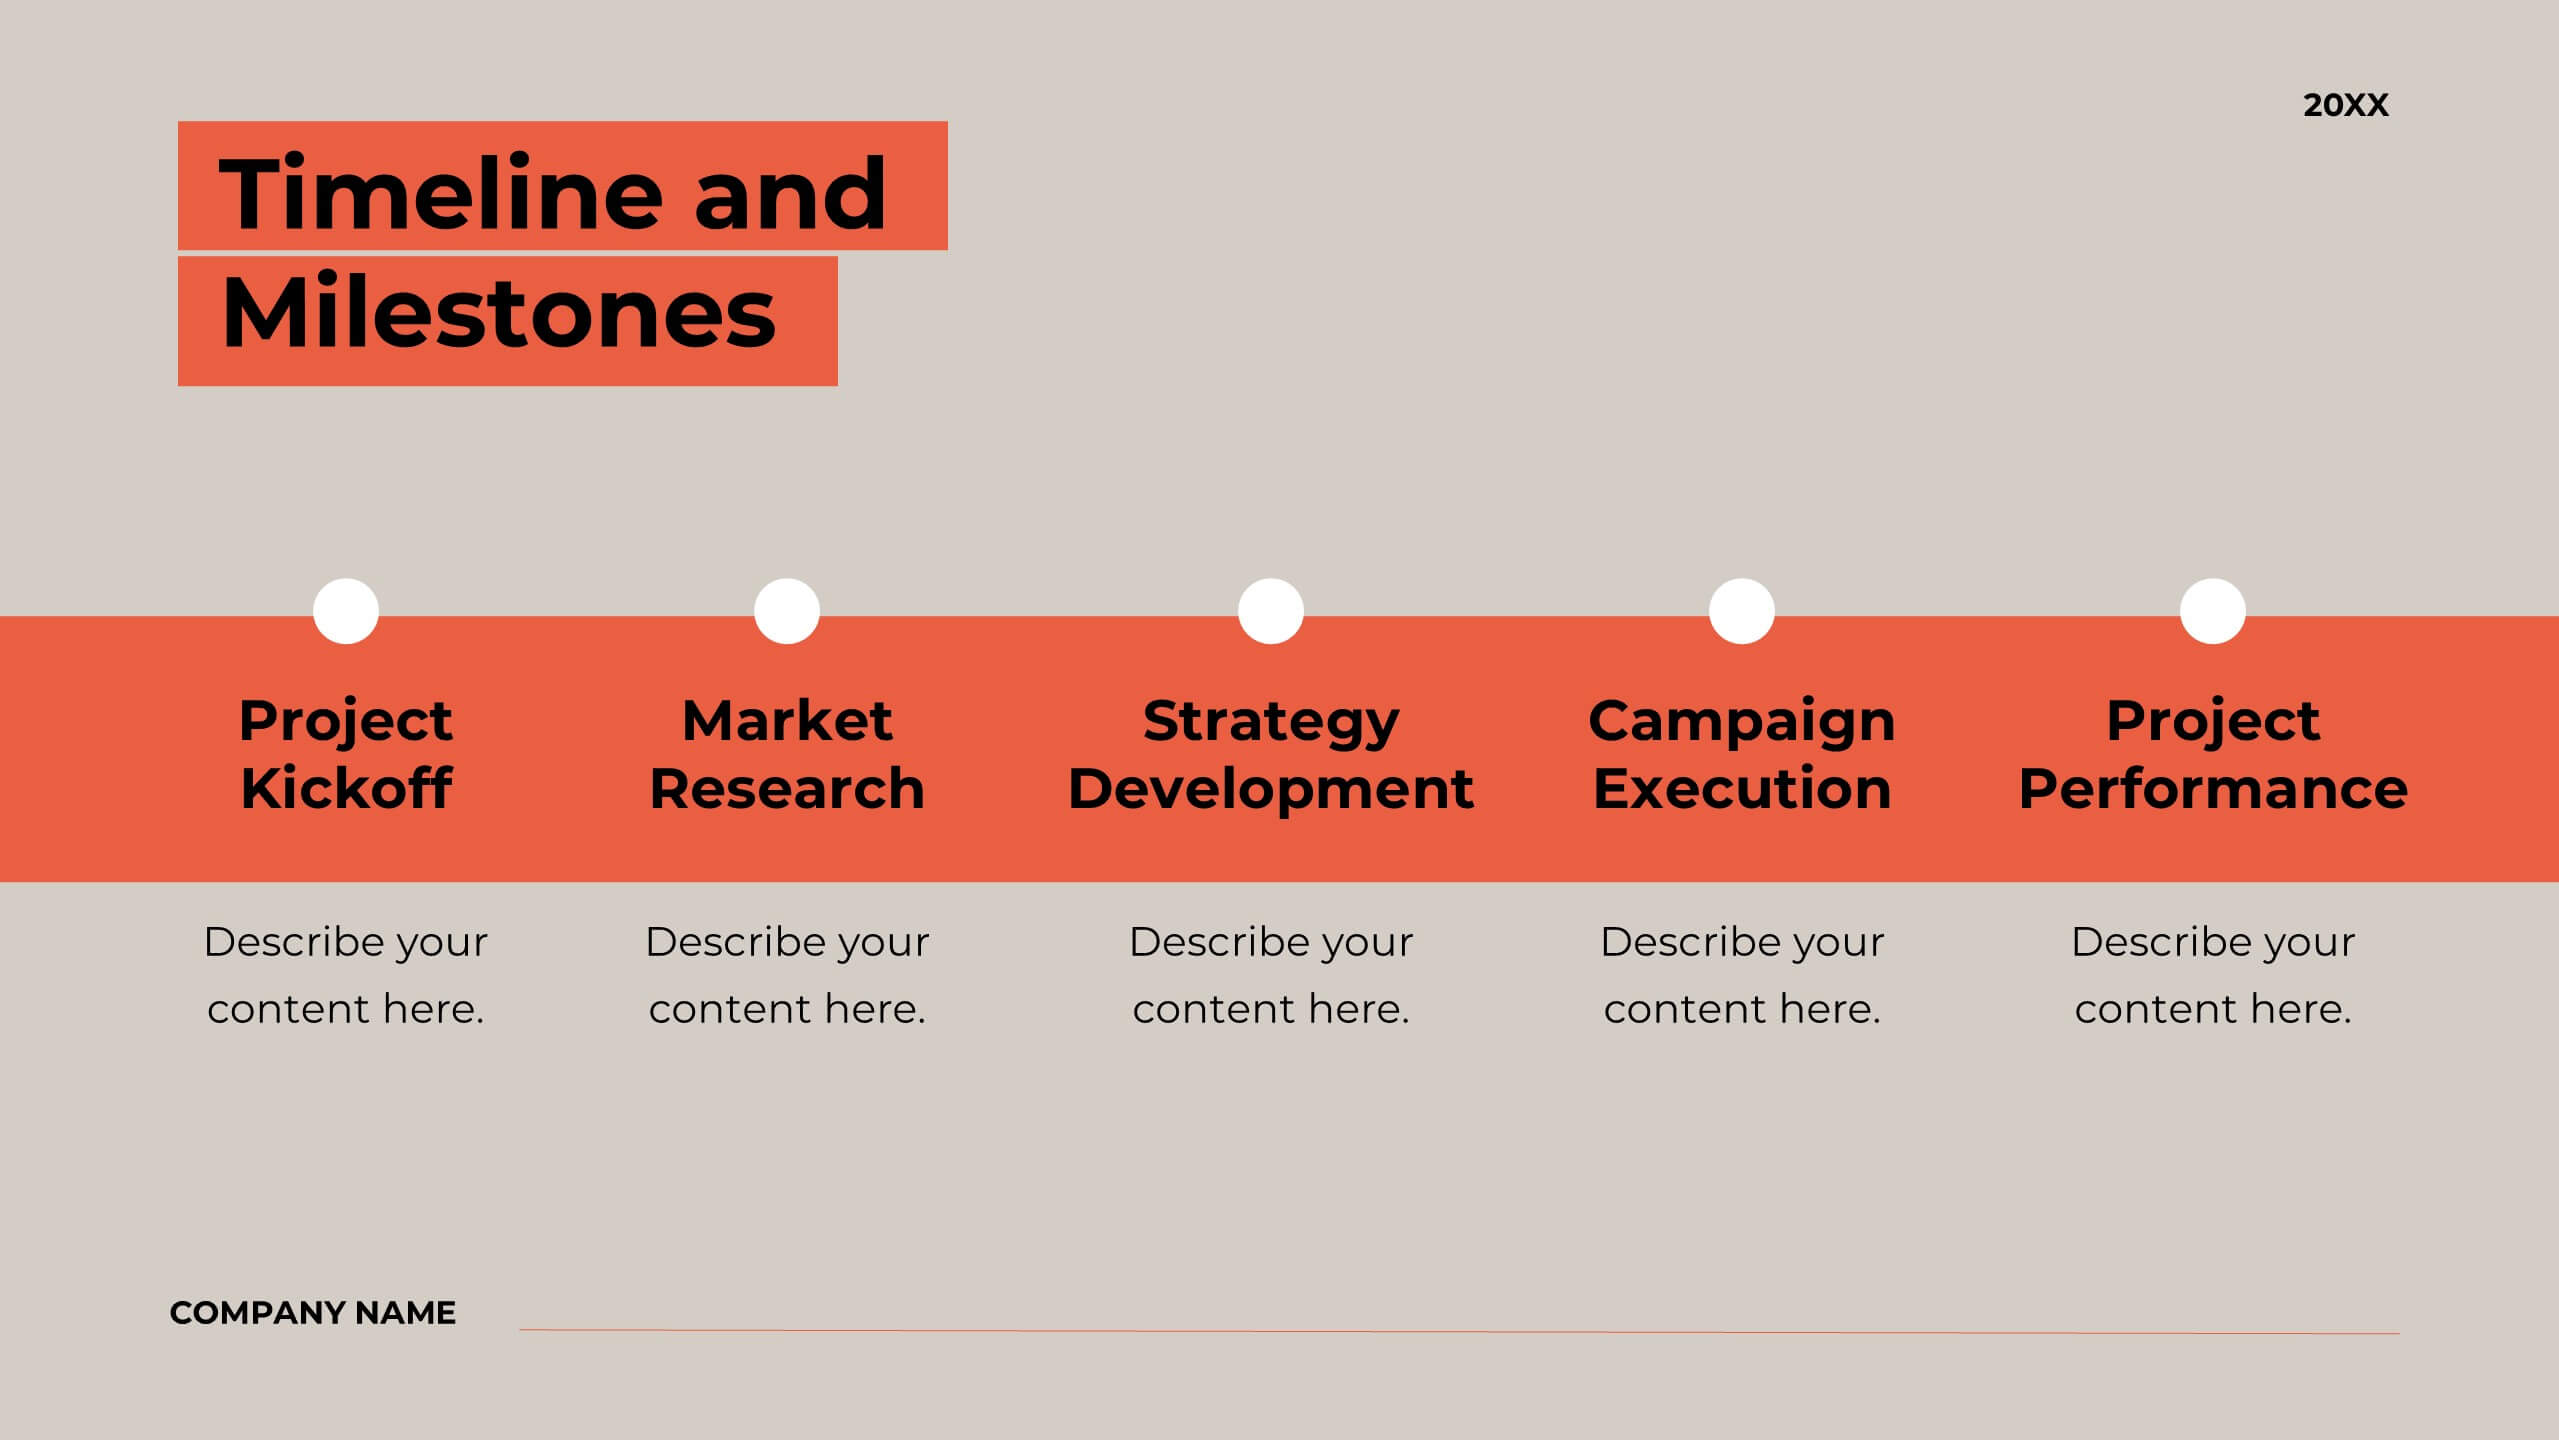
Bentom Marketing Proposal Presentation
This marketing proposal template is crafted to communicate your strategy with impact. With sections covering company overview, project summary, objectives, methodology, budget breakdown, and deliverables, it provides a professional layout for presenting key details to clients. Tailor it to fit your needs, and present confidently using PowerPoint, Keynote, or Google Slides.


5 slides
Campaign Funnel & Outreach Strategy Presentation
Present your marketing funnel clearly with this layered funnel chart design. Ideal for outlining awareness, engagement, and conversion stages, this slide helps visualize outreach strategies effectively. Fully editable in PowerPoint, Keynote, and Google Slides—perfect for campaign overviews, marketing reports, or client presentations that require structured, strategic communication.


21 slides
Runewood Marketing Proposal Template Presentation
The Marketing Proposal Presentation Template provides 21 slides covering core aspects like market presence, growth strategies, and financial highlights. Perfect for agencies and businesses to showcase their marketing strategies effectively. Fully customizable and compatible with PowerPoint, Keynote, and Google Slides.


5 slides
Hydrological Cycle Explained Presentation
Break down complex water systems with ease using the Hydrological Cycle Explained Presentation. This clean and modern slide illustrates each phase of the cycle—from precipitation to collection—with intuitive icons and a pipeline layout. Ideal for educational, environmental, or sustainability content. Fully editable in Canva, PowerPoint, Keynote, and Google Slides.


6 slides
Iceberg Visualization Business Concept Presentation
Make your message stand out with a bold visual that reveals what lies above and below the surface. This presentation uses a clear iceberg structure to help explain business concepts, hidden insights, and layered ideas with ease. Perfect for strategy, planning, and analysis. Compatible with PowerPoint, Keynote, and Google Slides.


6 slides
Comparative Analysis with Butterfly Chart Presentation
The "Comparative Analysis with Butterfly Chart" presentation template offers a visually striking way to compare and contrast data between two entities, such as Supplier A and Supplier B, across multiple variables. This format is particularly useful for presentations aiming to showcase cost comparisons, performance evaluations, or any side-by-side metric analysis in a concise and impactful way. Each variable is represented by a row of circles, where the color intensity and the number of circles filled can denote different levels of achievement or value, making it clear at a glance where strengths and disparities lie.


5 slides
SMART Objectives Slide Presentation
Kick your planning into gear with a bold, structured layout that makes goal-setting feel energetic and achievable. This presentation helps you outline clear objectives, track progress, and communicate strategy with a clean, organized flow designed for teams and leaders. Fully compatible with PowerPoint, Keynote, and Google Slides.


22 slides
Quantum Scientific Research Presentation
Present your scientific research with this comprehensive and professional template! Perfect for detailing research objectives, methodology, and key findings. Ideal for researchers and academics aiming to share their work clearly and effectively. Compatible with PowerPoint, Keynote, and Google Slides, this template ensures your scientific presentations are thorough, engaging, and visually appealing.


6 slides
Investment Portfolio Breakdown Presentation
Give your financial insights a clean, confident voice with a layout designed to make complex data feel simple and strategic. This presentation helps you compare allocations, highlight key performance areas, and communicate investment decisions with clarity and ease. Fully editable and compatible with PowerPoint, Keynote, and Google Slides.


23 slides
Starbloom Corporate Strategy Report Presentation
This Corporate Strategy Report Presentation Template provides a sleek and professional layout to present business insights, market opportunities, and strategic goals. It covers essential aspects like SWOT analysis, financial performance, risk management, and future outlook, making it perfect for corporate reports and investor briefings. Fully editable in PowerPoint, Keynote, and Google Slides.


5 slides
Side-by-Side Product Comparison Table Presentation
Clearly showcase differences with the Side-by-Side Product Comparison Table Presentation. This modern, easy-to-scan layout is perfect for comparing two features, services, or product options. Use icons and color highlights to emphasize key advantages. Ideal for marketing, sales decks, or client proposals. Compatible with PowerPoint, Keynote, Canva, and Google Slides.


4 slides
30-60-90 Day Business Plan
Kickstart new roles, projects, or team onboarding with this bold 30-60-90 Day Business Plan template. Designed to outline goals, milestones, and deliverables over three critical phases, this layout is ideal for managers, job candidates, and team leaders. Fully editable in PowerPoint, Keynote, and Google Slides.