


Features
- 4 Unique slides
- Fully editable and easy to edit in Microsoft Powerpoint, Keynote and Google Slides
- 16:9 widescreen layout
- Clean and professional designs
- Export to JPG, PDF or send by email


Do you have any questions?
Recommend


7 slides
Demographic Segmentation Infographic Presentation
A Demographic Infographic is designed to provide a quick and easy-to-understand snapshot of the key demographic trends and insights. This Template is easy to edit and intuitive, so you can create a stunning presentation in minutes. With this template, you can focus on your content and the design. It's a multipurpose template which means it can be used for different topics: business, education, marketing, and more. You can use this as a template to explain concepts related to your studies, statistics or market research. This template is compatible with Powerpoint, Keynote and Google Slides.


3 slides
Early Detection and Prevention of Breast Cancer
Promote awareness and proactive care with this “Early Detection and Prevention of Breast Cancer” slide. Designed with an impactful visual of a female silhouette and icon-based health markers, it’s ideal for medical presentations, awareness campaigns, and corporate wellness programs. The infographic layout clearly communicates key statistics, risk factors, or steps for prevention. Fully editable in PowerPoint, Keynote, and Google Slides.


5 slides
Business Model Canvas Overview Presentation
Streamline your business strategy with the Business Model Canvas Overview Presentation. Designed for entrepreneurs, startups, and strategists, this template visualizes key partners, activities, value propositions, customer segments, revenue streams, and more. Fully editable for PowerPoint, Keynote, and Google Slides, ensuring a structured and professional business plan presentation.


22 slides
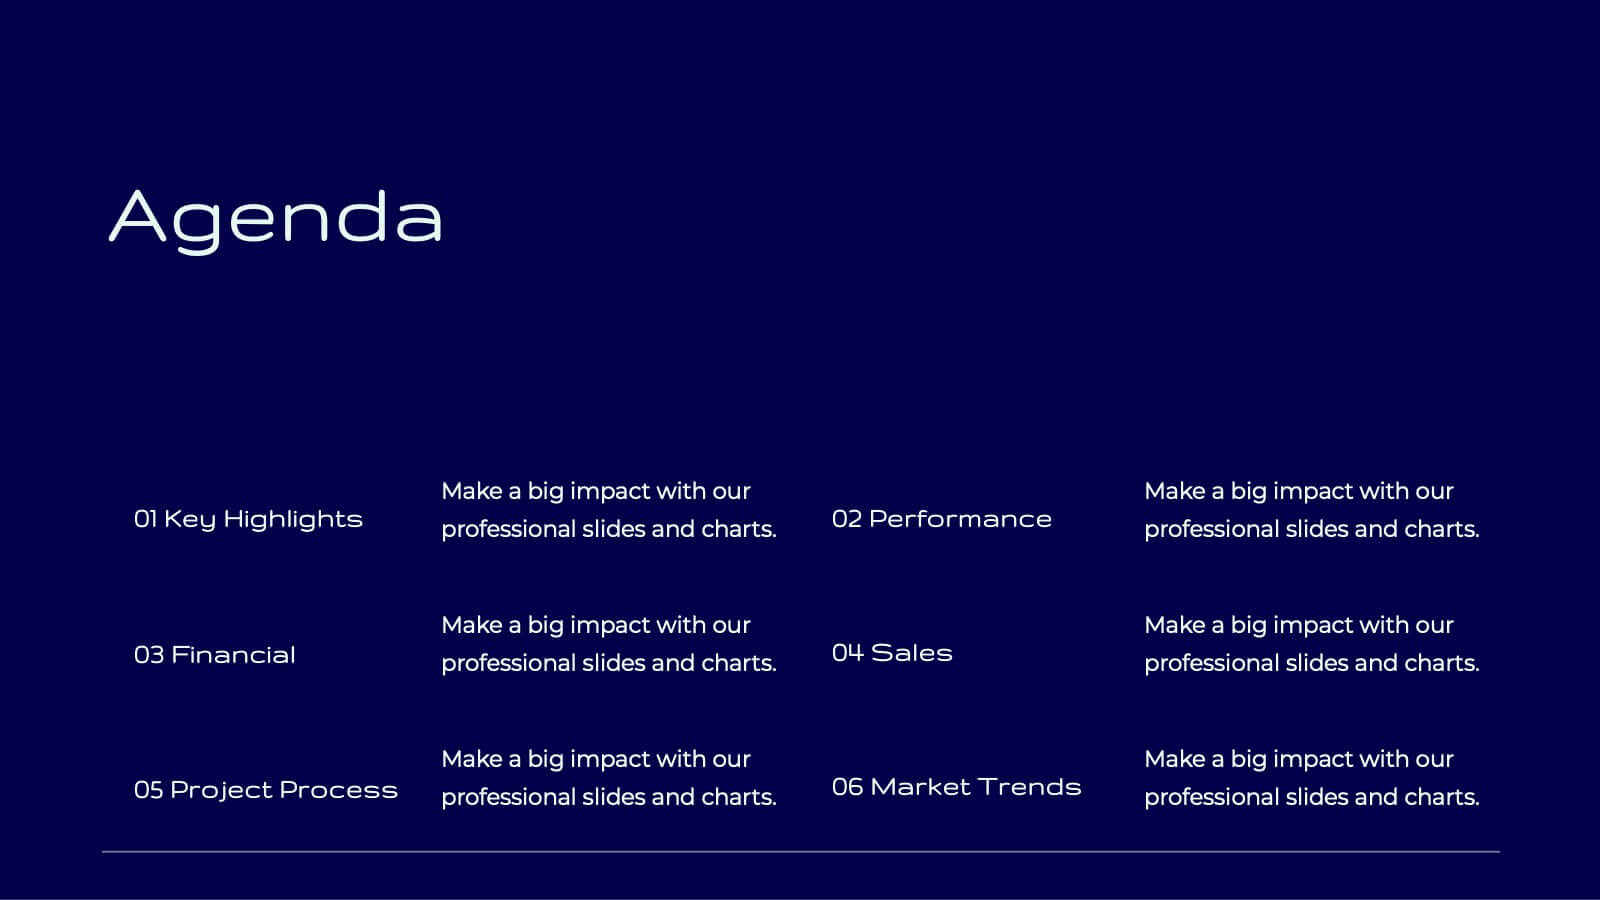
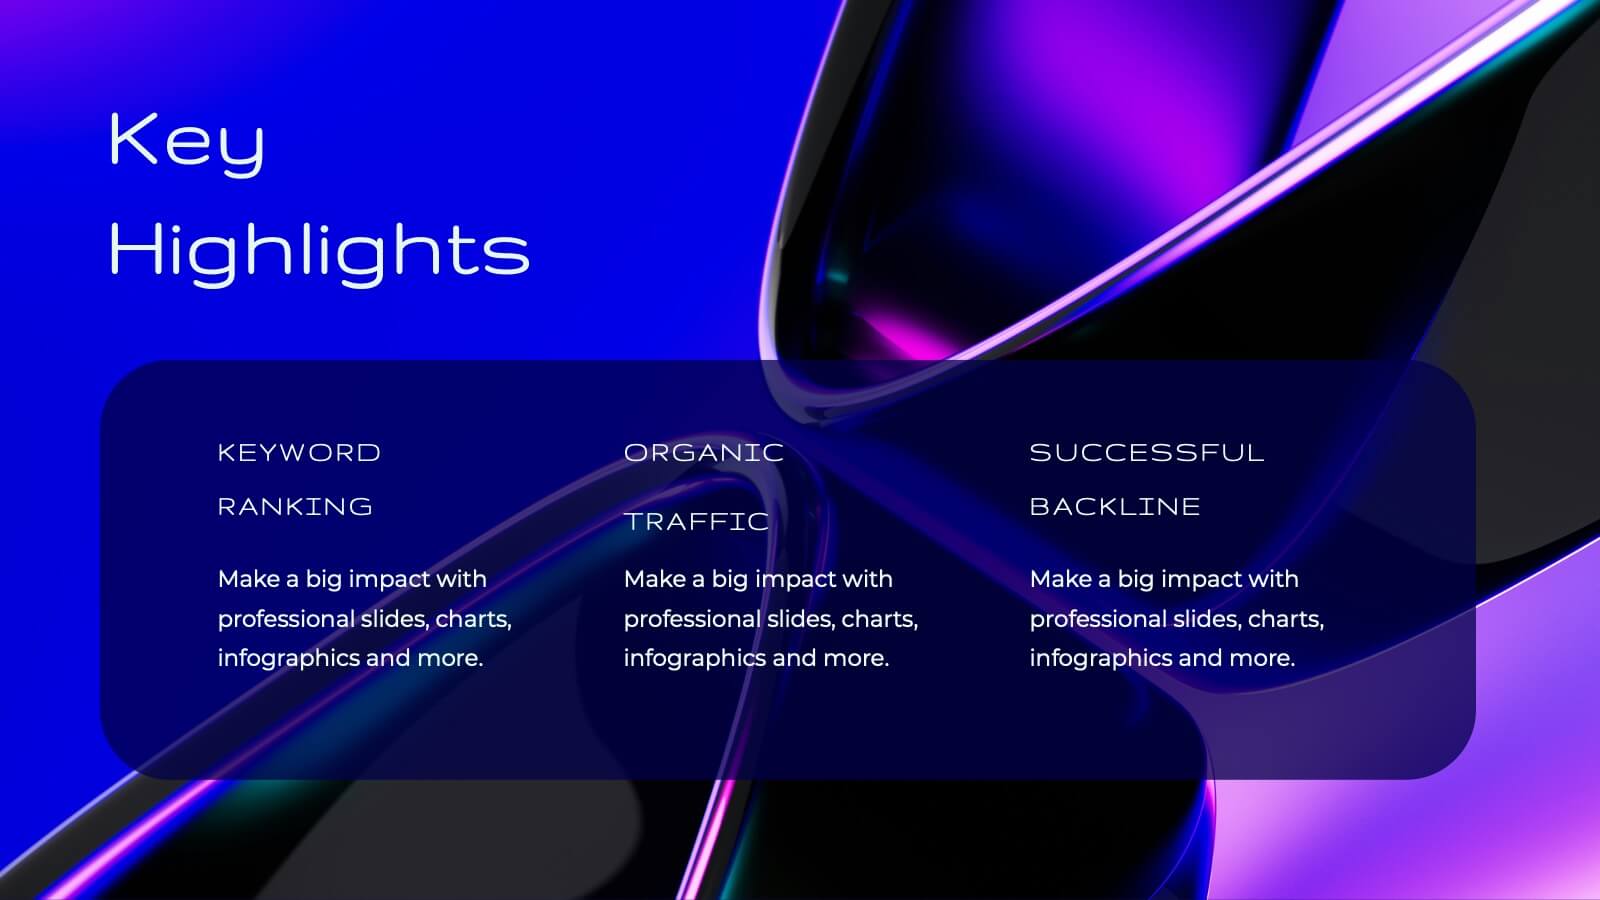
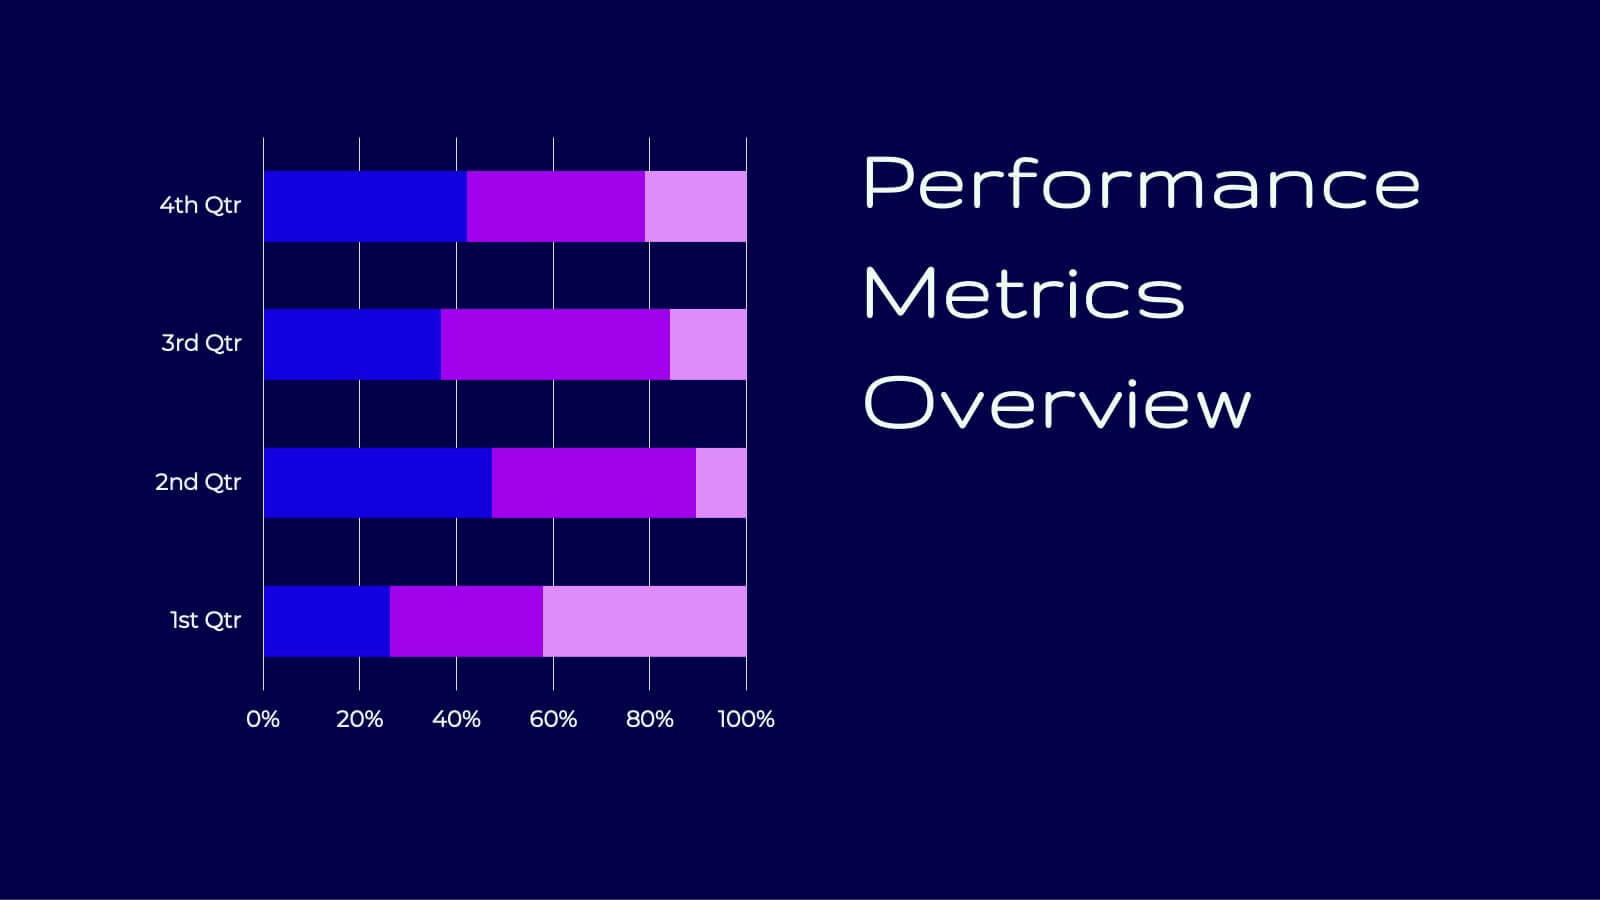
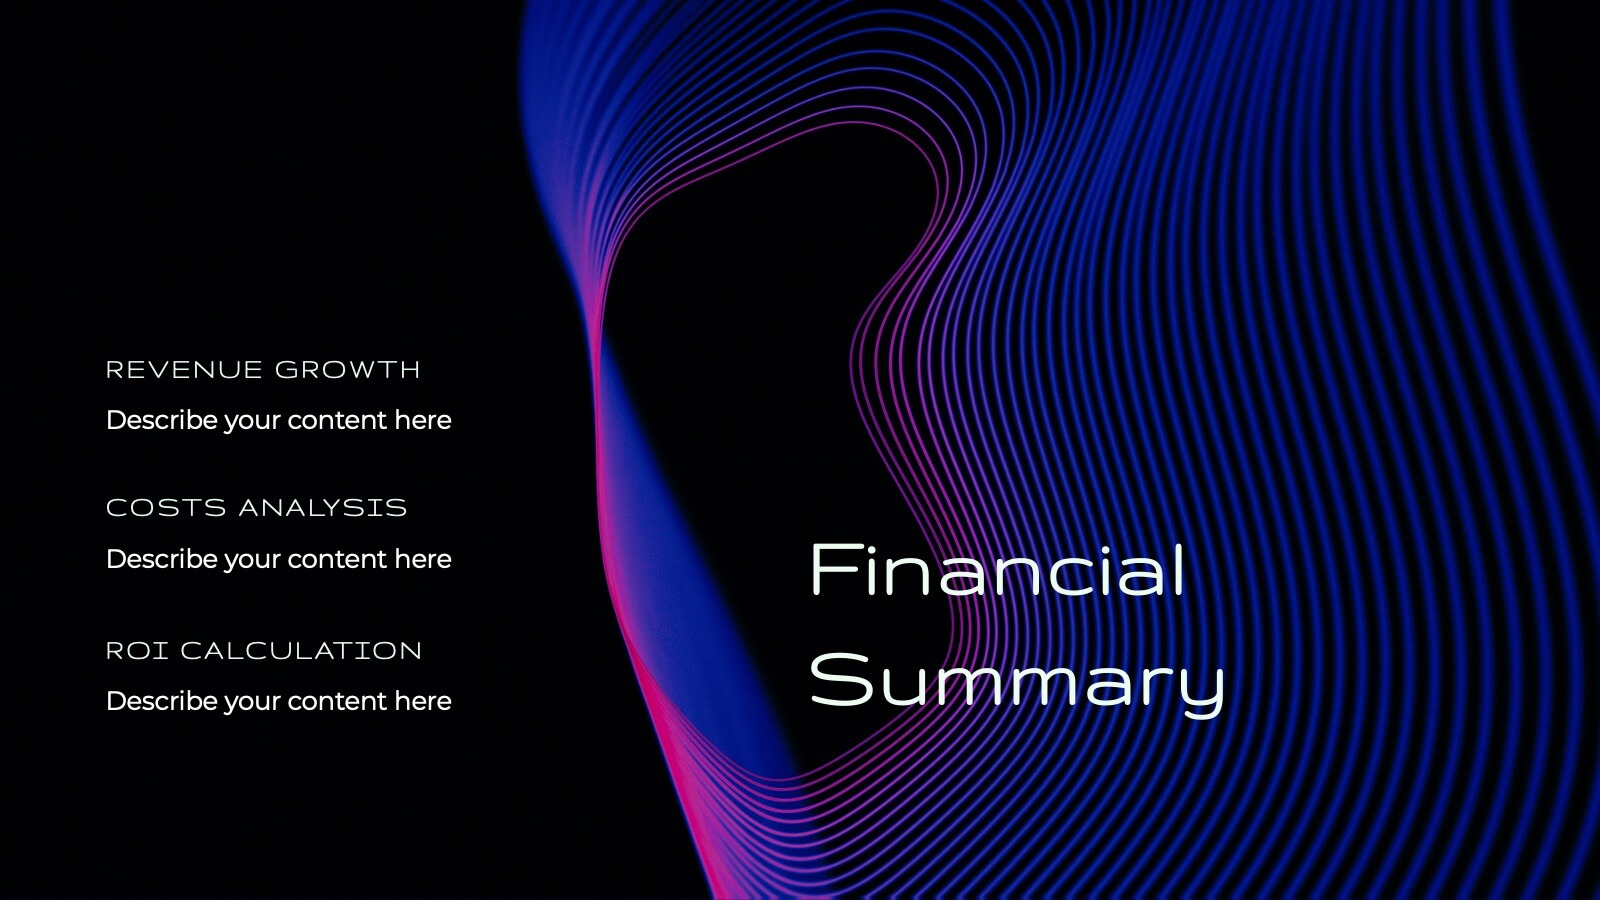
Tidal Research Findings Report Presentation
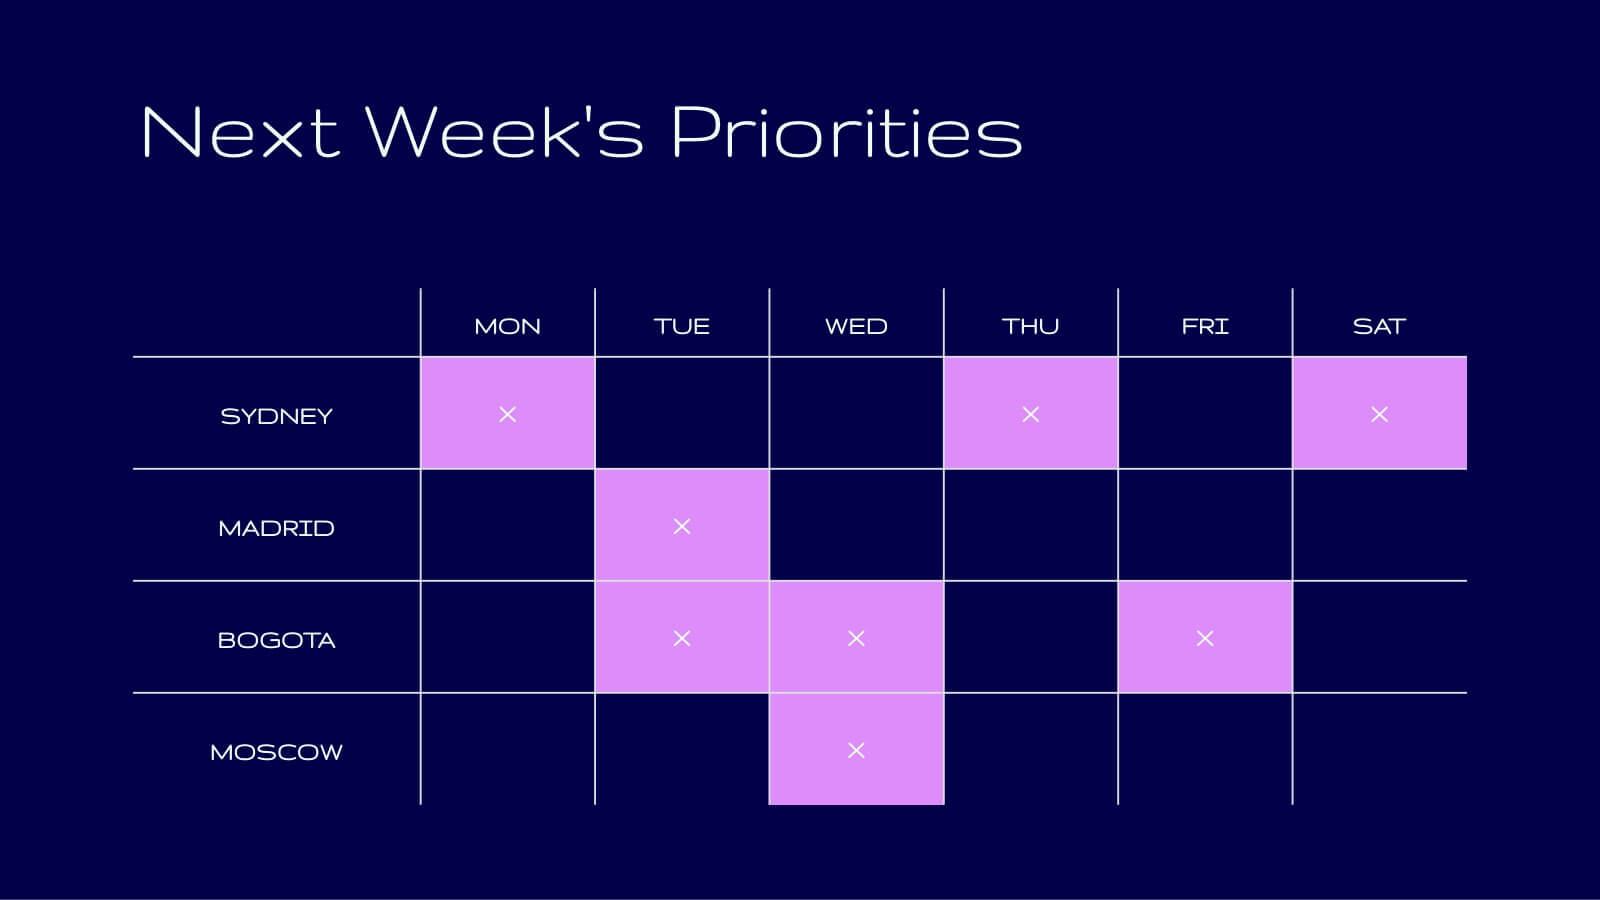
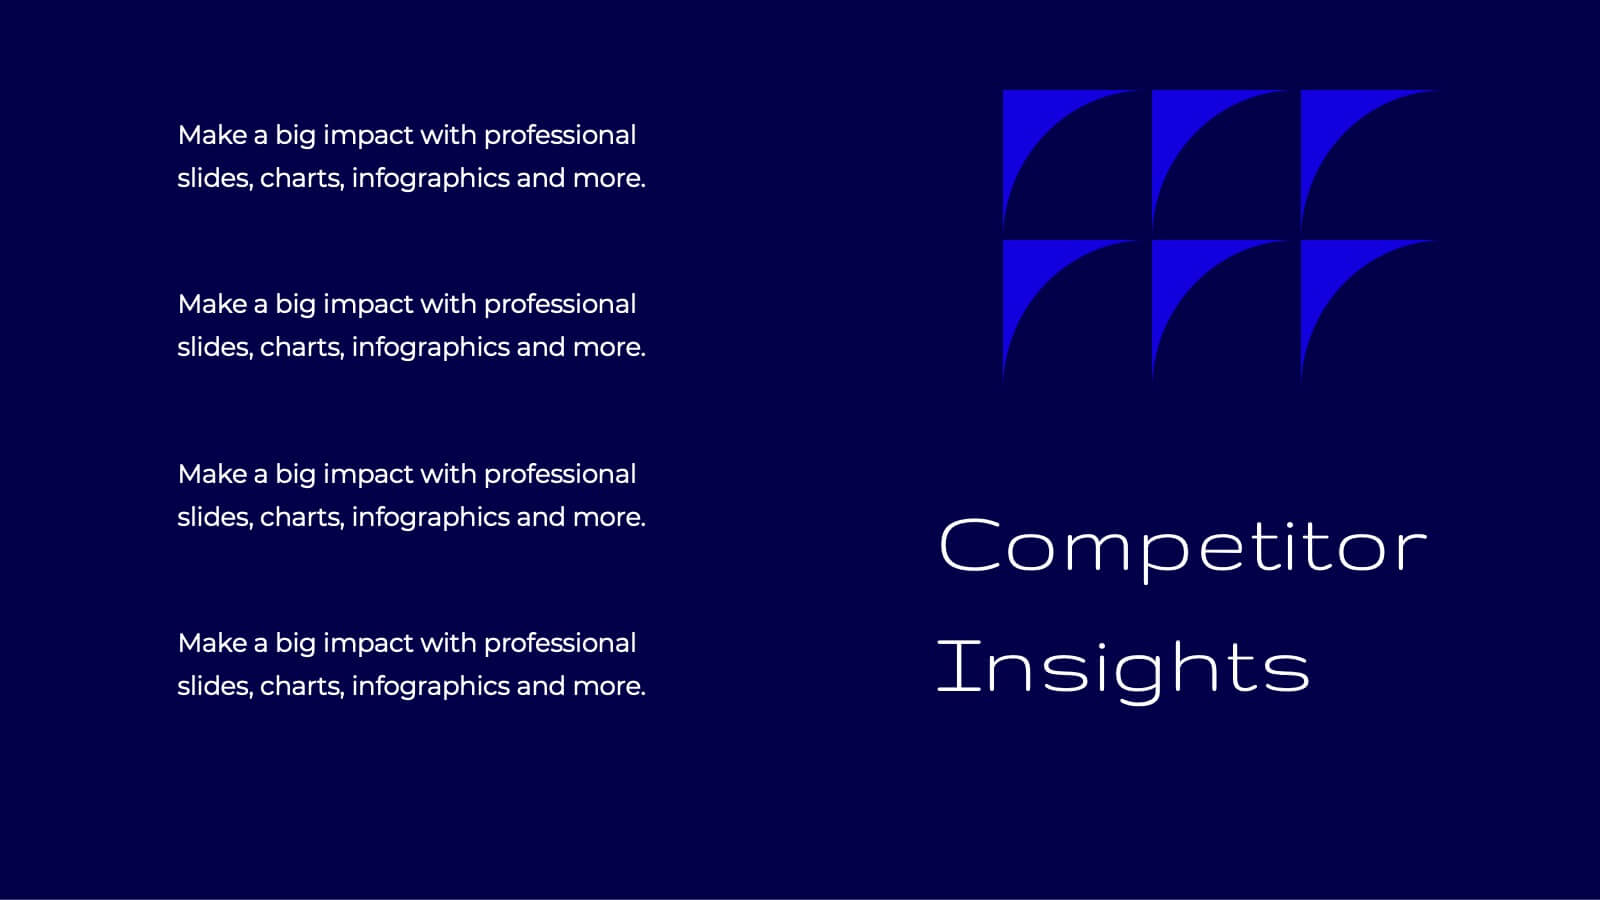
Deliver your research findings with impact using this sleek and modern report template! It covers key highlights, performance metrics, project progress, and competitor insights, making it ideal for clear, professional presentations. Perfect for summarizing challenges, solutions, and strategic initiatives. Compatible with PowerPoint, Keynote, and Google Slides for seamless reporting.


23 slides
Rainshadow Digital Strategy Presentation
This Digital Strategy Presentation Template is designed to provide a structured approach to planning and implementing digital initiatives. Covering essential elements such as market trends, competitive analysis, value proposition, and risk management, it offers a professional framework to align goals with actionable steps. Fully customizable and compatible with PowerPoint, Keynote, and Google Slides.


6 slides
Corporate Team Management Presentation
Highlight the interconnected roles of your corporate team with this sleek Corporate Team Management slide. The circular flow design emphasizes collaboration, leadership, and operational structure—making it ideal for showcasing team roles, department functions, or workflow cycles. Each of the six editable segments includes a title and description area with clean iconography. Fully compatible with PowerPoint, Keynote, and Google Slides.


26 slides
Coffee Shop Simple Presentation
Perk up your presentation with this Coffee Shop template, brimming with the energy of a bustling café. It’s the perfect blend for baristas, café owners, or anyone presenting on the coffee industry. The design features rich, warm colors and images that evoke the cozy ambiance of a coffee shop. Introduce your team with 'Meet Our Team' slides, and discuss your menu or business strategies with the option slides. Utilize the 'Chart Slide' for sales figures or customer preferences, and map out your global coffee sources with the 'Asia Map Slide'. The 'Mobile Device Mockup' is ideal for demonstrating your café's app or online ordering system. Each slide is like a cup of your finest brew—crafted to energize and engage your audience. The 'Thank You' slide sends them off with the satisfaction of a well-spent coffee break. This template isn’t just a visual aid; it's an experience, inviting your audience to savor every detail of your coffee-centric venture.


7 slides
Human Resources Infographic Presentation Template
A human resources infographic is data related to the management of people in an organization. This template can be used to cover various HR-related topics, such as recruitment and selection, employee benefits, performance management, and career development. The purpose of our HR infographic is to communicate information in a clear and engaging way, making complex HR concepts and processes easier to understand. This well-designed infographic template can help you effectively communicate HR information, improve engagement and understanding, and support the overall success of your presentation.


6 slides
Business Logic Flow Chart
Streamline complex processes with the Business Logic Flow Chart Presentation. This modern, curved connector design helps you visually outline up to five sequential steps or logic paths, using colorful icons and editable text fields. Ideal for business workflows, strategic plans, or data flow maps. Fully compatible with PowerPoint, Keynote, and Google Slides.


3 slides
Cost-Benefit Analysis and Strategic Outcomes Presentation
Present trade-offs with clarity using the Cost-Benefit Analysis and Strategic Outcomes Presentation. Designed with visual balance scales and segmented callouts, this layout helps you compare investments versus returns, making complex decisions easier to explain. Ideal for proposals, audits, or business strategy reviews. Fully editable in PowerPoint, Keynote, and Google Slides.


4 slides
Company Long-Term Vision Presentation
Craft your company's roadmap with our "Company Long-Term Vision" presentation template. This design lets you vividly showcase your strategic direction and future goals through a modern, image-centric layout. Ideal for board meetings and stakeholder briefings, it supports PowerPoint, Keynote, and Google Slides, ensuring you can reach your audience on any platform. Utilize this template to clearly communicate your vision and drive your organization forward.


6 slides
Strategic Expansion in Africa Map Presentation
Showcase your regional growth plan with the Strategic Expansion in Africa Map Presentation. This layout combines a clean Africa map with color-coded country highlights and directional labels, making it perfect for outlining market entry, regional operations, or investment focus. Ideal for business consultants or NGOs. Works in PowerPoint, Canva, and Google Slides.


8 slides
Economic Improvement in South America Map Presentation
Highlight regional performance with this South America economic growth map. Featuring 3D bar charts and country-specific markers, it’s ideal for visualizing financial progress, investments, or development trends. Fully editable in PowerPoint, Google Slides, and Keynote, this layout is perfect for reports, forecasts, and business reviews with a geographic focus.


7 slides
Job Title Infographic
The slides displayed offer a range of stylish and clear title designs for various business and creative presentations, ideal for introducing key concepts and sections within a professional document or presentation. Each slide is crafted to represent themes such as annual reports, digital strategies, and project retrospectives, as well as specialized areas like web design, strategic planning, and SEO. The designs incorporate modern aesthetics with clean lines, bold color palettes, and minimalist graphic elements, ensuring that the titles are not only eye-catching but also effectively convey the subject matter. This variety allows presenters to choose a slide that best fits the tone and topic of their presentation, making each section distinct and engaging for the audience. These slides are perfect for professionals looking to present complex information in an accessible and visually appealing format.


6 slides
Root Cause Breakdown with Impact Lines Presentation
Visualize the path from causes to consequences with the Root Cause Breakdown with Impact Lines Presentation. Designed with a clear horizontal arrow flow and dual-level layout, this slide helps you dissect key issues and their cascading effects. Ideal for risk analysis, incident reviews, and operational strategy meetings. Fully customizable in PowerPoint, Keynote, and Google Slides.


10 slides
Business Planning and Risk Assessment Presentation
Visualize risk levels and strategic priorities with this matrix-style business planning template. Ideal for mapping uncertainties against impact and likelihood, it supports clear, data-driven decisions. Fully customizable in PowerPoint, Keynote, and Google Slides—perfect for risk reports, operational planning, and stakeholder communication in corporate, finance, or project management settings.


6 slides
Ecological Sustainability Goals Presentation
Bring your environmental vision to life with a clean, uplifting layout that guides audiences through key sustainability milestones. This presentation helps you explain eco-focused goals, long-term impact, and actionable strategies in a simple, structured way that’s easy to follow. Fully compatible with PowerPoint, Keynote, and Google Slides.