


Features
- 6 Unique slides
- Fully editable and easy to edit in Microsoft Powerpoint, Keynote and Google Slides
- 16:9 widescreen layout
- Clean and professional designs
- Export to JPG, PDF or send by email


Do you have any questions?
Recommend


22 slides
Aurora Agency Portfolio Presentation
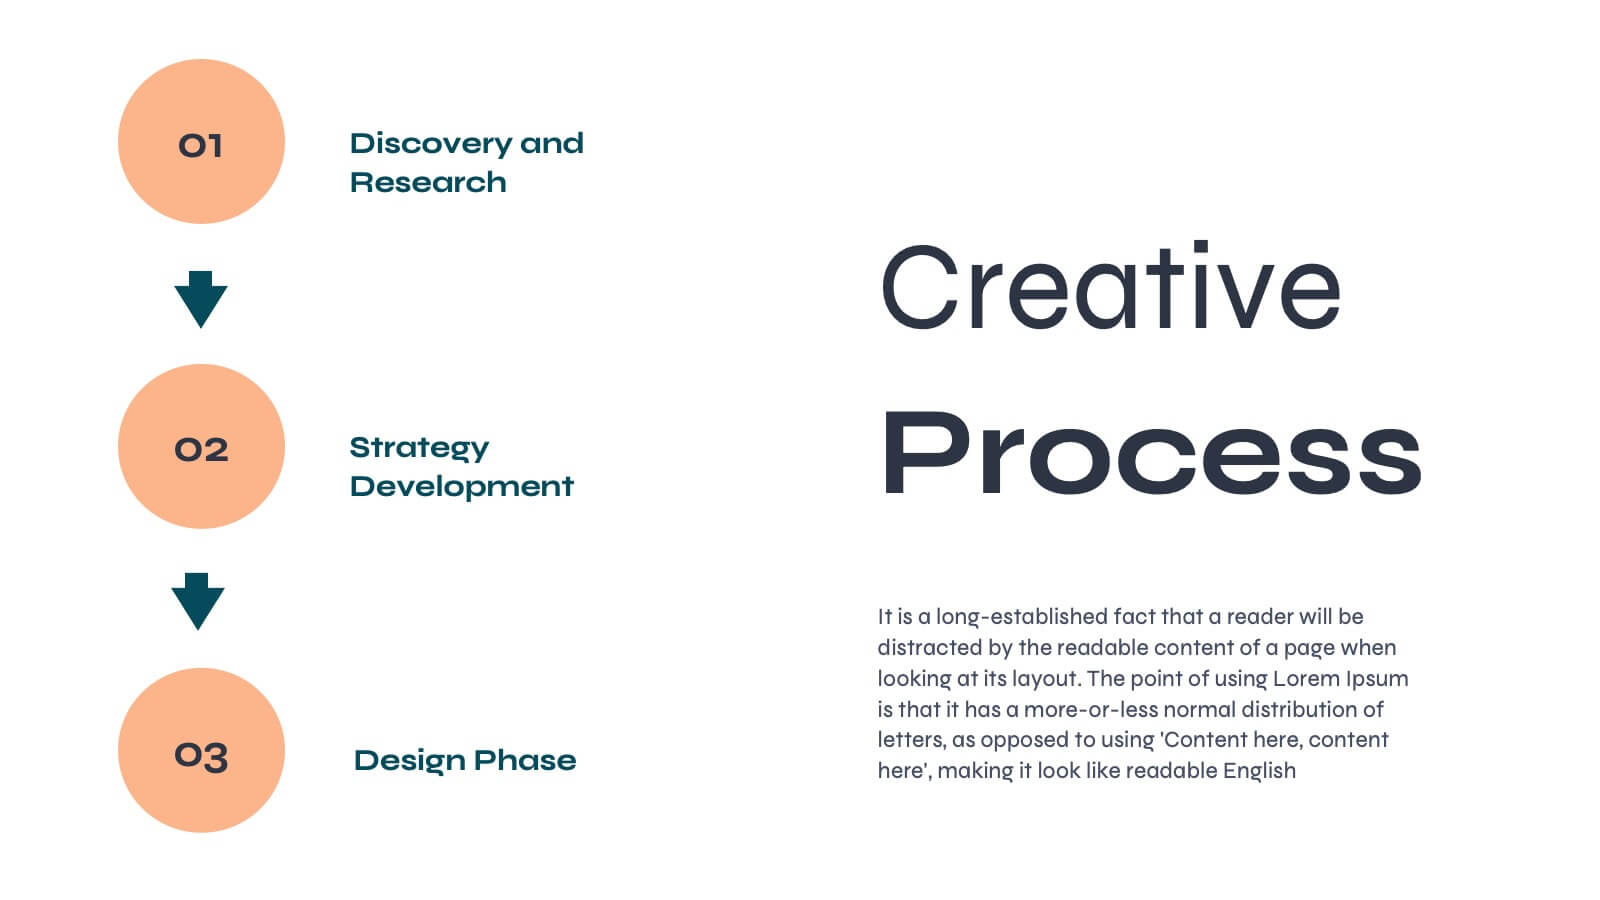
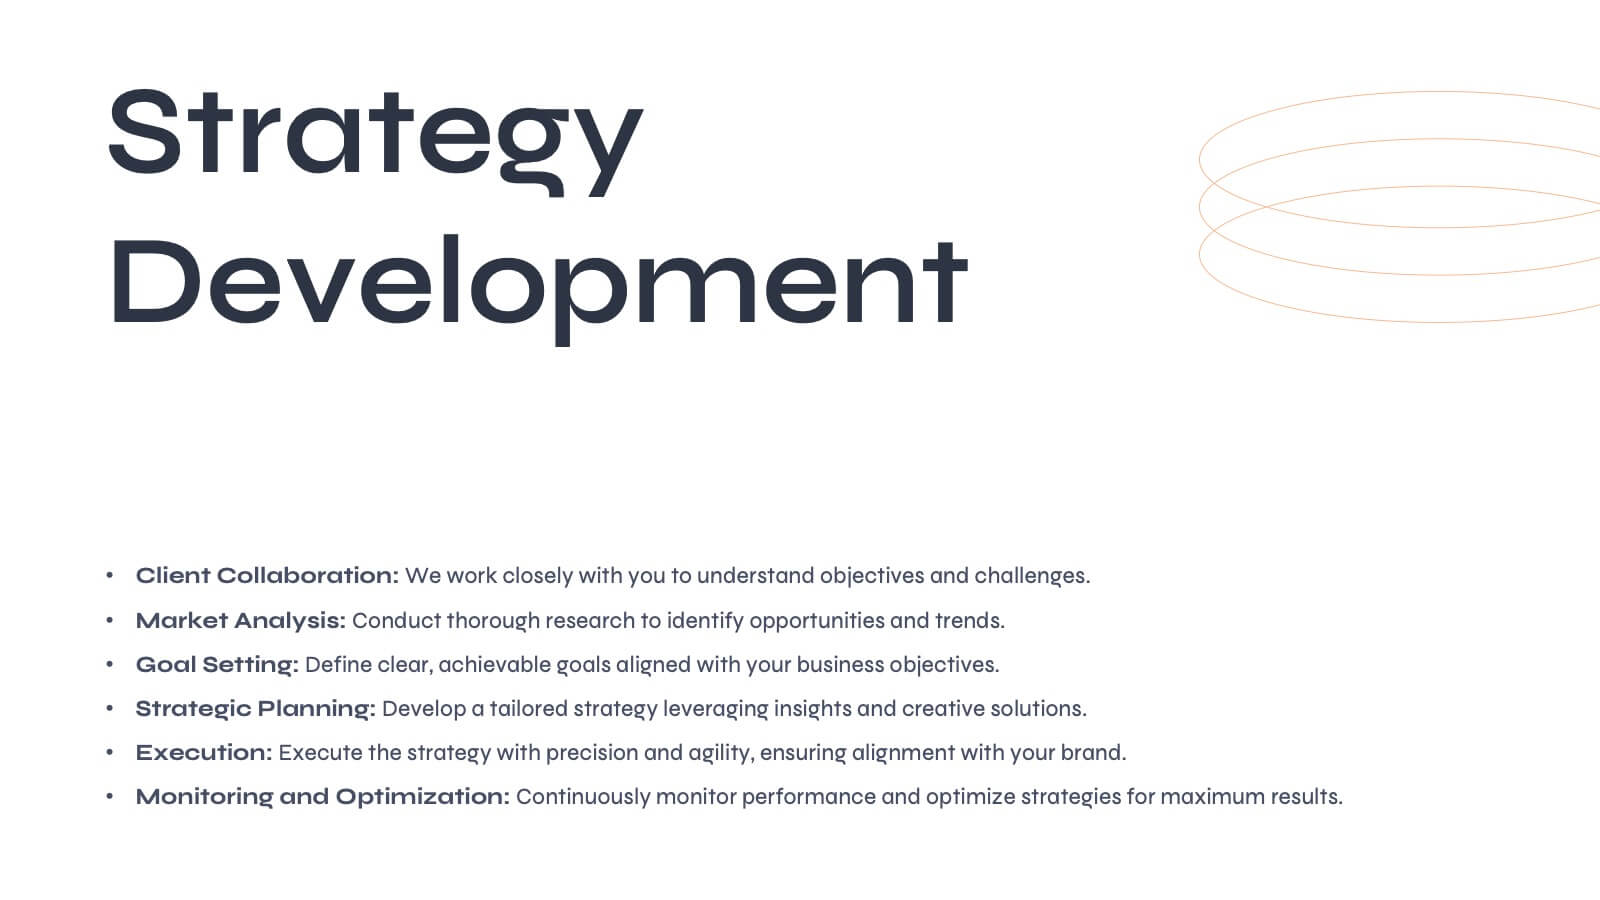
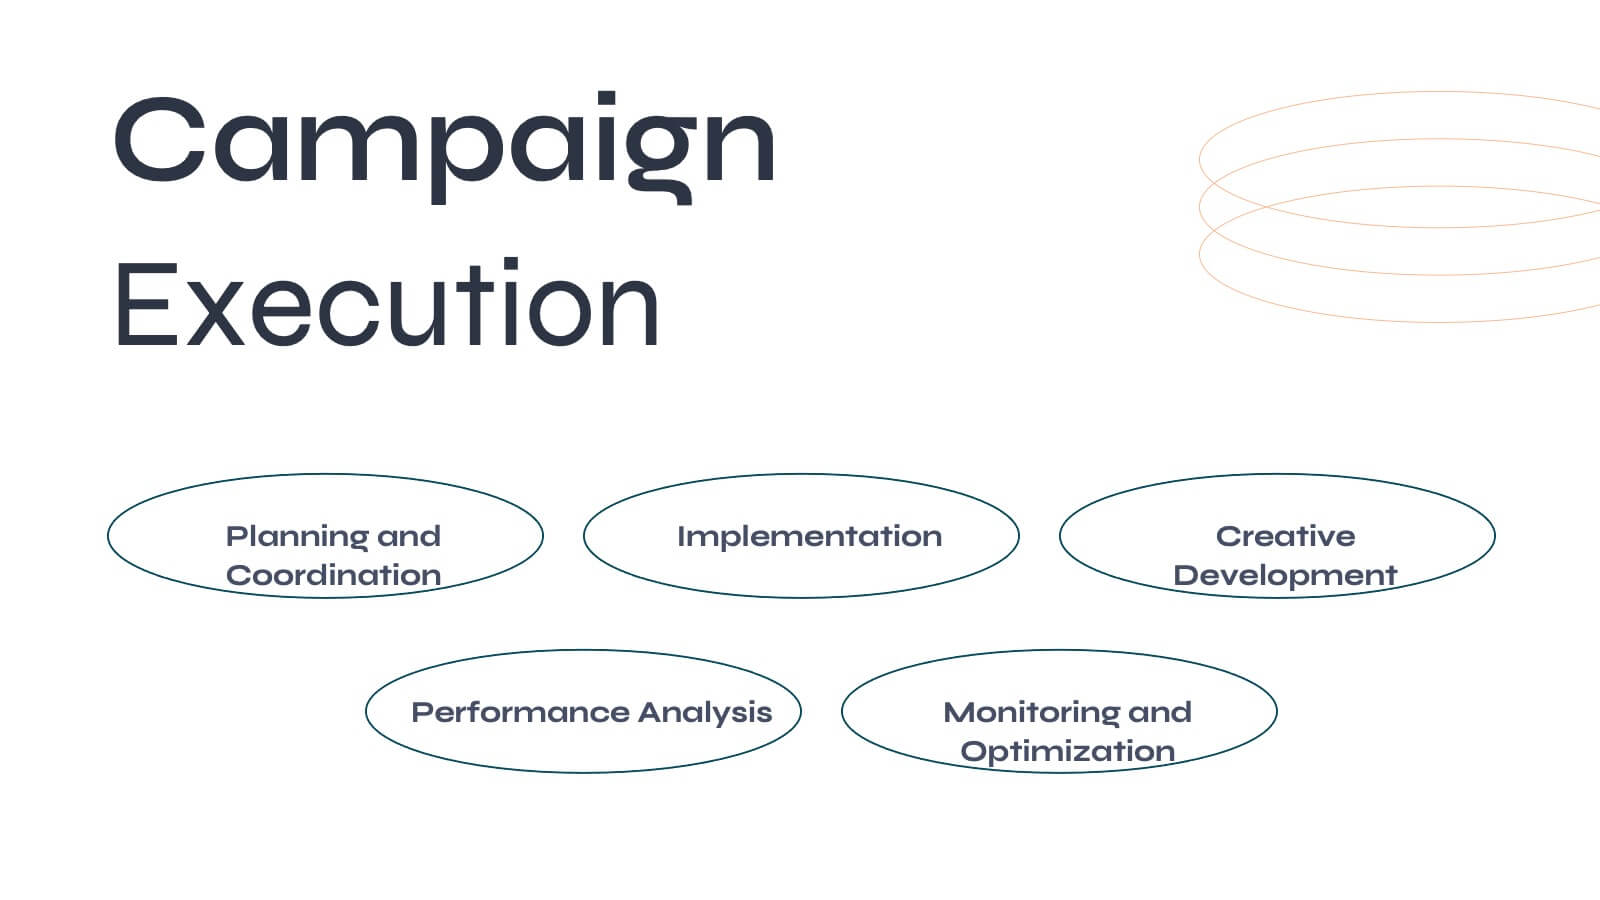
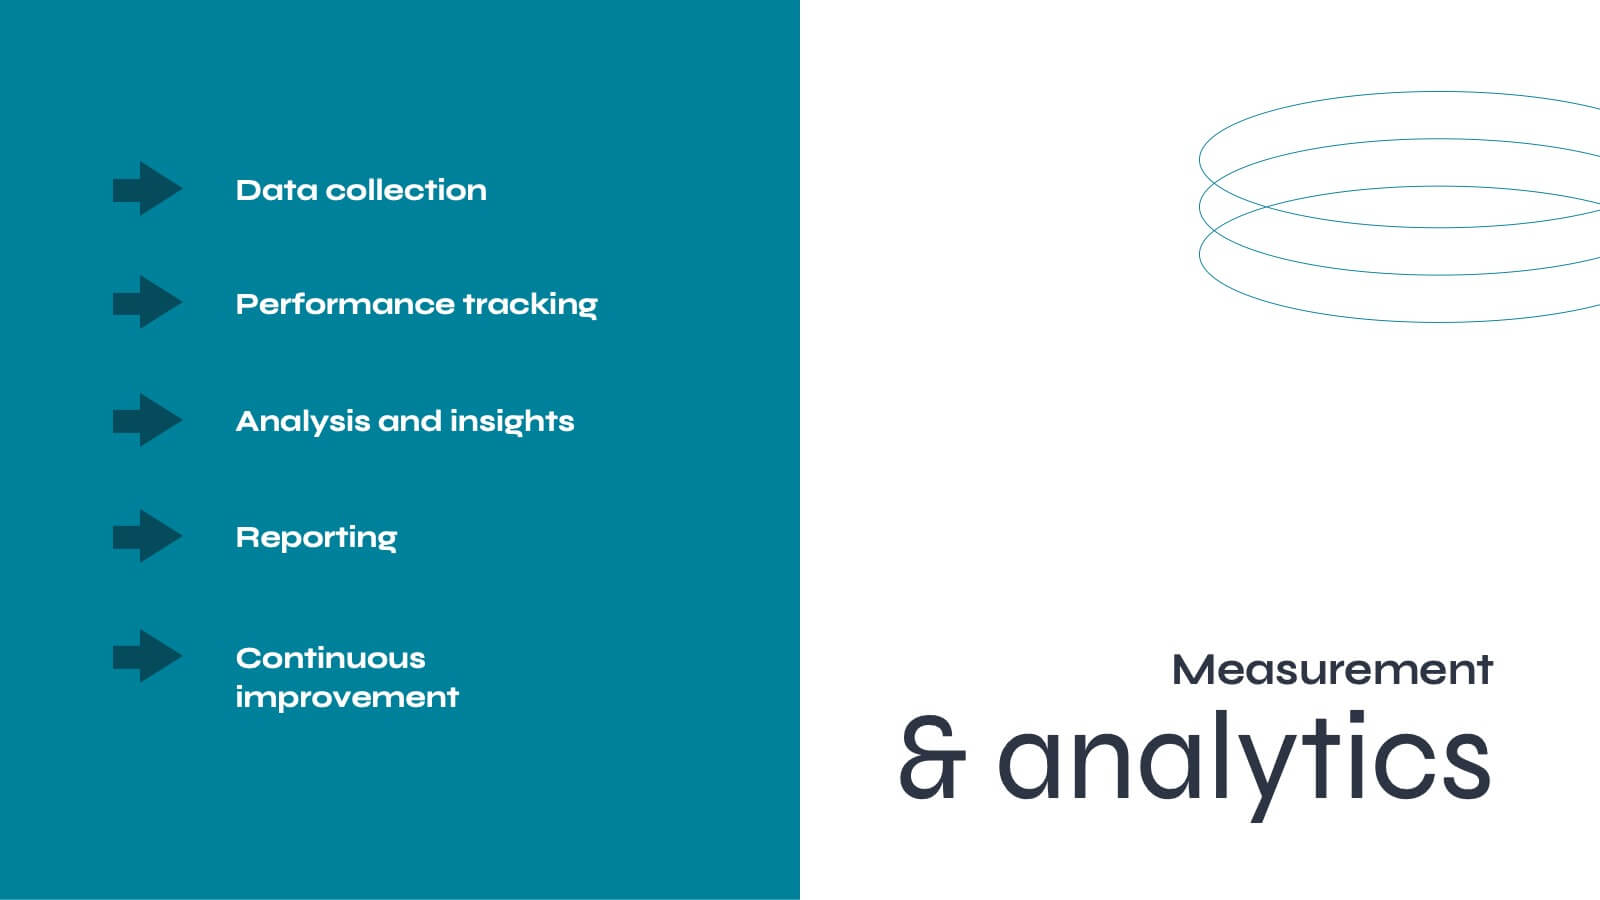
Showcase your agency's strengths with this polished, modern presentation template. Perfect for presenting market analysis, client success stories, and creative processes, it features a clean and professional design. Highlight your team's expertise and strategic approach to impress potential clients. Compatible with PowerPoint, Keynote, and Google Slides, it ensures seamless presentations on any platform.


6 slides
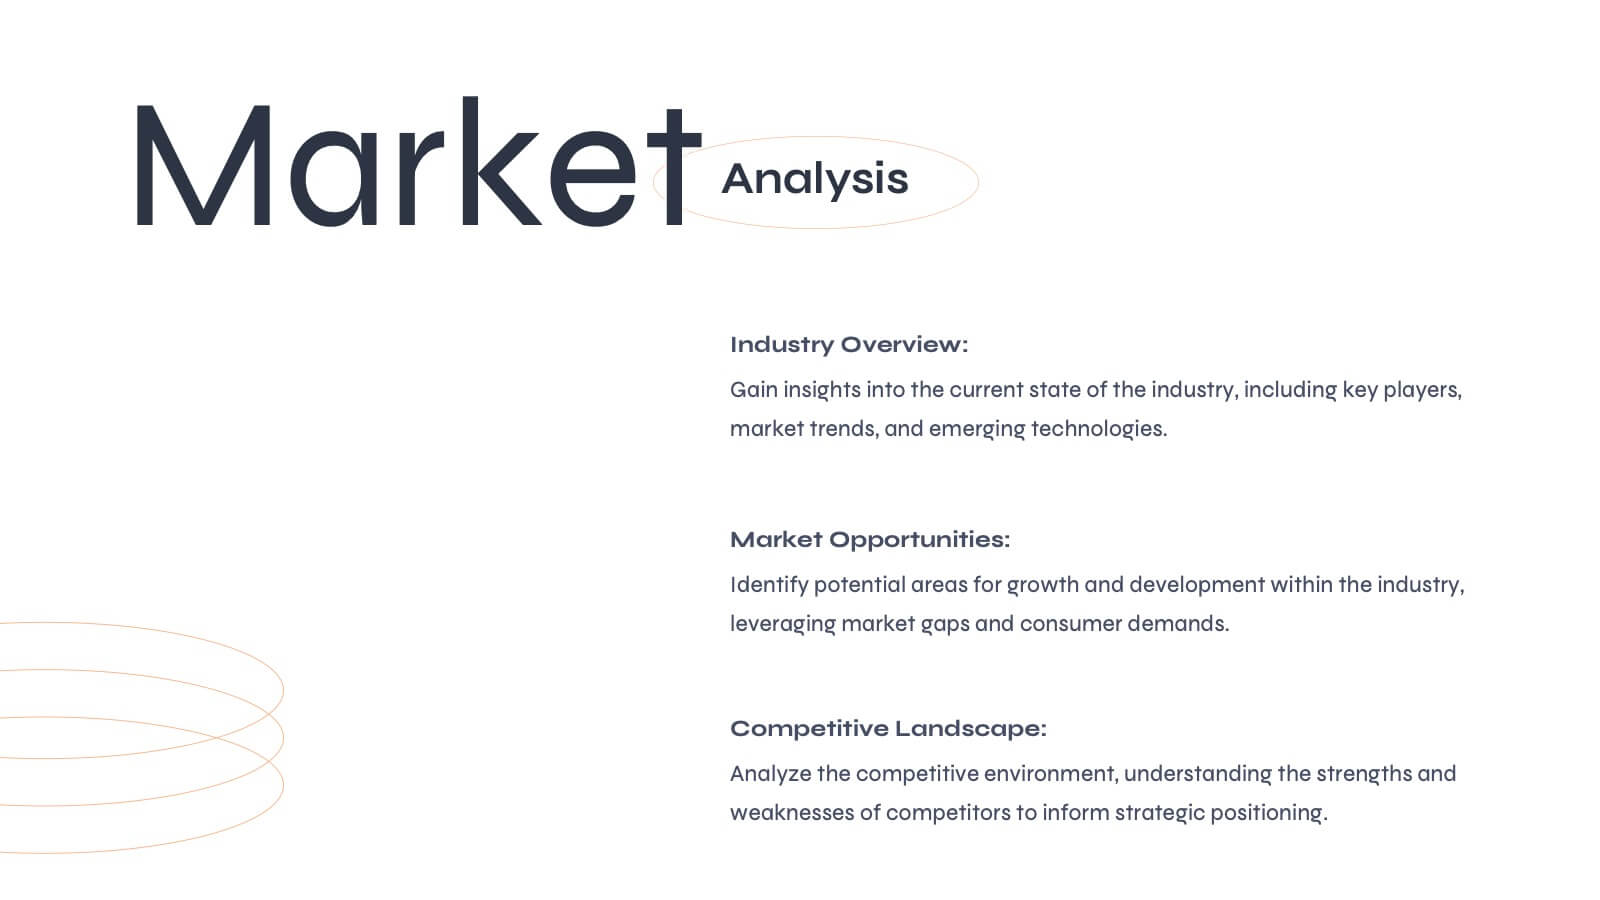
Porter's Five Forces Market Analysis Presentation
Gain a competitive edge with this Porter's Five Forces market analysis template! Designed to help businesses assess industry dynamics, this structured layout highlights competitive rivalry, supplier power, buyer influence, new market entries, and substitute threats. Perfect for strategists and analysts. Fully customizable and compatible with PowerPoint, Keynote, and Google Slides.


6 slides
Market Sizing with TAM SAM SOM Strategy Presentation
Clearly define your market opportunity using the Market Sizing with TAM SAM SOM Strategy Presentation. This template breaks down Total Addressable Market, Serviceable Available Market, and Serviceable Obtainable Market with a visual bullseye format that’s intuitive and persuasive. Easily editable in PowerPoint, Keynote, and Google Slides.


8 slides
Strategic Planning Gap Assessment Presentation
Bridge the gap in your strategic planning with this visually compelling Strategic Planning Gap Assessment presentation template. Designed to highlight key challenges and solutions, this template helps you outline critical gaps, assess risks, and develop actionable strategies. Ideal for business leaders, consultants, and project managers, this fully customizable template is compatible with PowerPoint, Keynote, and Google Slides.


10 slides
Data Security and Privacy Measures Presentation
Illustrate your protection protocols clearly with the Data Security and Privacy Measures presentation slide. Featuring a smartphone icon secured with lock, shield, and magnifying glass elements, this layout is ideal for communicating encryption policies, access controls, and compliance steps. Fully editable in PowerPoint, Keynote, and Google Slides.


3 slides
Project Completion Checklist Presentation
Keep projects on track with the Project Completion Checklist template. This structured layout helps you monitor tasks, update statuses, and document progress seamlessly. Featuring status indicators, date tracking, and notes sections, this template enhances productivity and organization. Fully customizable and compatible with PowerPoint, Keynote, and Google Slides for effortless use.


5 slides
Concept Overlap with Venn Diagram Presentation
Visually map overlapping concepts and relationships with this four-circle Venn diagram slide. Perfect for presenting interdependencies, cross-functional insights, or product comparisons. Each section includes editable labels and icons to personalize your content. Compatible with PowerPoint, Keynote, and Google Slides—ideal for business strategies, brainstorming sessions, and collaborative team presentations.


5 slides
Product and Service Benefits Slide
Highlight your value offerings with this clean, 4-column benefits layout. Each box provides space for an icon, title, and concise description—ideal for comparing features, services, or product advantages. Fully editable in PowerPoint, Keynote, and Google Slides to match your brand style.


5 slides
Business Statistics Infographic Report Presentation
Present data with clarity using the Business Statistics Infographic Report presentation. This layout combines clean bar graphs, donut charts, and legends to showcase KPIs, progress benchmarks, and segmented insights. Ideal for quarterly reviews, executive updates, or client reporting. Fully editable in PowerPoint, Keynote, or Google Slides.


2 slides
Professional Cover Slide Design Presentation
Make a bold first impression with this clean and modern cover slide layout. Featuring a split design with customizable photo space and a vibrant call-to-action label, this slide balances professionalism with creativity. Perfect for proposals, company overviews, or keynote introductions. Easily personalize the title, color palette, and image. Fully compatible with PowerPoint, Keynote, and Google Slides.


6 slides
Matrix Diagram Business Analysis Infographic
Streamline your business analysis with our Matrix Diagram Infographic Template. This versatile tool is designed for clarity and impact, helping you compare and contrast various data points. Whether you're assessing risks, evaluating performance, or categorizing information, our template provides a visually appealing and easy-to-understand matrix layout. Compatible with PowerPoint, Google Slides, and Keynote, it's the perfect addition to your business presentations. With its customizable design, you can tailor the colors, shapes, and text to fit your specific needs. Use this template to bring a professional edge to your strategic planning and stakeholder communication.


20 slides
Museara Sales Pitch Deck Presentation
Create a compelling sales pitch with this dynamic and modern presentation template. It includes key sections like company overview, competitive analysis, pricing strategy, and future opportunities to help you showcase your value proposition effectively. Ideal for startups and enterprises alike. Compatible with PowerPoint, Keynote, and Google Slides for easy editing.


6 slides
North America Market Map Infographic
North America is the third largest continent in the world and home to over 50 countries, with a population of over 400 million. This infographic template is designed to show you where each country is located within North America, as well as its population, annual GDP per capita, and other important data points that make it unique. This template is the perfect tool for navigating the international market. This infographic map allows you to get a bird's eye view of how your business is performing across the region, and what areas need more attention. Fully customizable and compatible with Powerpoint, Keynote, and Google Slides.


10 slides
Growth Strategy in Four Steps Presentation
Achieve sustainable business expansion with the Growth Strategy in Four Steps presentation. This structured template guides teams through progressive development phases, using clear visuals to illustrate key milestones and percentage-based improvements. Ideal for entrepreneurs, marketers, and business strategists, this slide layout is fully customizable and compatible with PowerPoint, Keynote, and Google Slides for seamless integration into your workflow.


21 slides
Frostwind Financial Report Presentation
Deliver a comprehensive financial report with the Frostwind Financial Report Presentation. This sleek and modern template is designed to captivate your audience while showcasing essential business metrics and insights. With dedicated sections for key highlights, financial summaries, performance metrics, and operational updates, this presentation ensures clarity and professionalism. Dive deeper into customer feedback, market trends analysis, and competitive insights to provide a well-rounded view of your organization's performance. Showcase strategic initiatives, goals review, and next week's priorities with visually engaging charts and graphics. The inclusion of a Q&A and recommendations for improvement slide allows for seamless interaction with your audience. Perfect for corporate meetings, annual reviews, and financial updates, this template is fully customizable to suit your branding. Compatible with PowerPoint, Google Slides, and Keynote, it offers versatility and ease of use, ensuring you leave a lasting impression. Take your financial reporting to the next level!


6 slides
Office Scenes Season Infographic
"Office Scenes" typically refer to the environments and activities that take place within an office setting. This Infographic template is a visual representation that showcases different scenarios and activities that commonly take place in an office environment. This type of infographic can be used to illustrate various aspects of office life, work culture, and interactions. This template provide insights into the day-to-day activities and culture of your workplace. Fully customizable and compatible with Powerpoint, Keynote, and Google Slides. Include your company logo or branding elements in the infographic.


6 slides
Fishbone Concept Infographic
Dissect complex issues with our Fishbone Concept Infographic, ideal for Powerpoint, Google Slides, and Keynote. This infographic, also known as the Ishikawa or cause-and-effect diagram, is designed for problem-solving and root cause analysis. This template features a series of branching arrows leading to a central spine, enabling you to map out multiple cause-and-effect relationships. Each ‘bone’ represents a category of causes that you can customize to fit your specific analysis needs. With this fishbone infographic, you can effectively organize and present complex data, making it easier for your audience to understand and engage with the content of your presentation.