


Features
- 23 Unique Slides
- Fully editable and easy to edit in Microsoft Powerpoint, Keynote and Google Slides
- 16:9 widescreen layout
- Clean and professional designs
- Export to JPG, PDF or send by email


Do you have any questions?
Recommend


22 slides
Metaphor Advertising Agency Proposal Presentation
The Advertising Agency Proposal Presentation Template offers a polished structure to present your agency's expertise. With slides covering mission, case studies, services, and market analysis, it’s designed to leave a lasting impression. Perfect for securing new clients, it’s fully editable and works seamlessly with PowerPoint, Keynote, and Google Slides.


5 slides
Business Revenue and Expense Analysis Presentation
Present your financial growth and cost breakdowns with this 3D bar chart layout. Each bar is paired with clearly labeled sections to explain key revenue sources, expense categories, or profit margins. Ideal for business reviews, financial proposals, or investor reports. Fully editable in PowerPoint, Keynote, and Google Slides.


6 slides
Business Funnel Breakdown Visualization
Break down your entire sales or operational funnel with clarity using the Business Funnel Breakdown Visualization Presentation. This clean, 3D-styled funnel graphic divides your process into five editable layers, making it ideal for showcasing lead flow, process stages, or customer lifecycle phases. Fully customizable in PowerPoint, Keynote, and Google Slides.


10 slides
Modern Healthcare Technology Trends Presentation
Highlight innovations in healthcare with the Modern Healthcare Technology Trends Presentation. This slide features a central device graphic connected to four key icons, perfect for showcasing digital tools, emerging trends, or medical tech strategies. Fully customizable in Canva, PowerPoint, Keynote, and Google Slides—ideal for medical tech briefings and strategic presentations.

20 slides
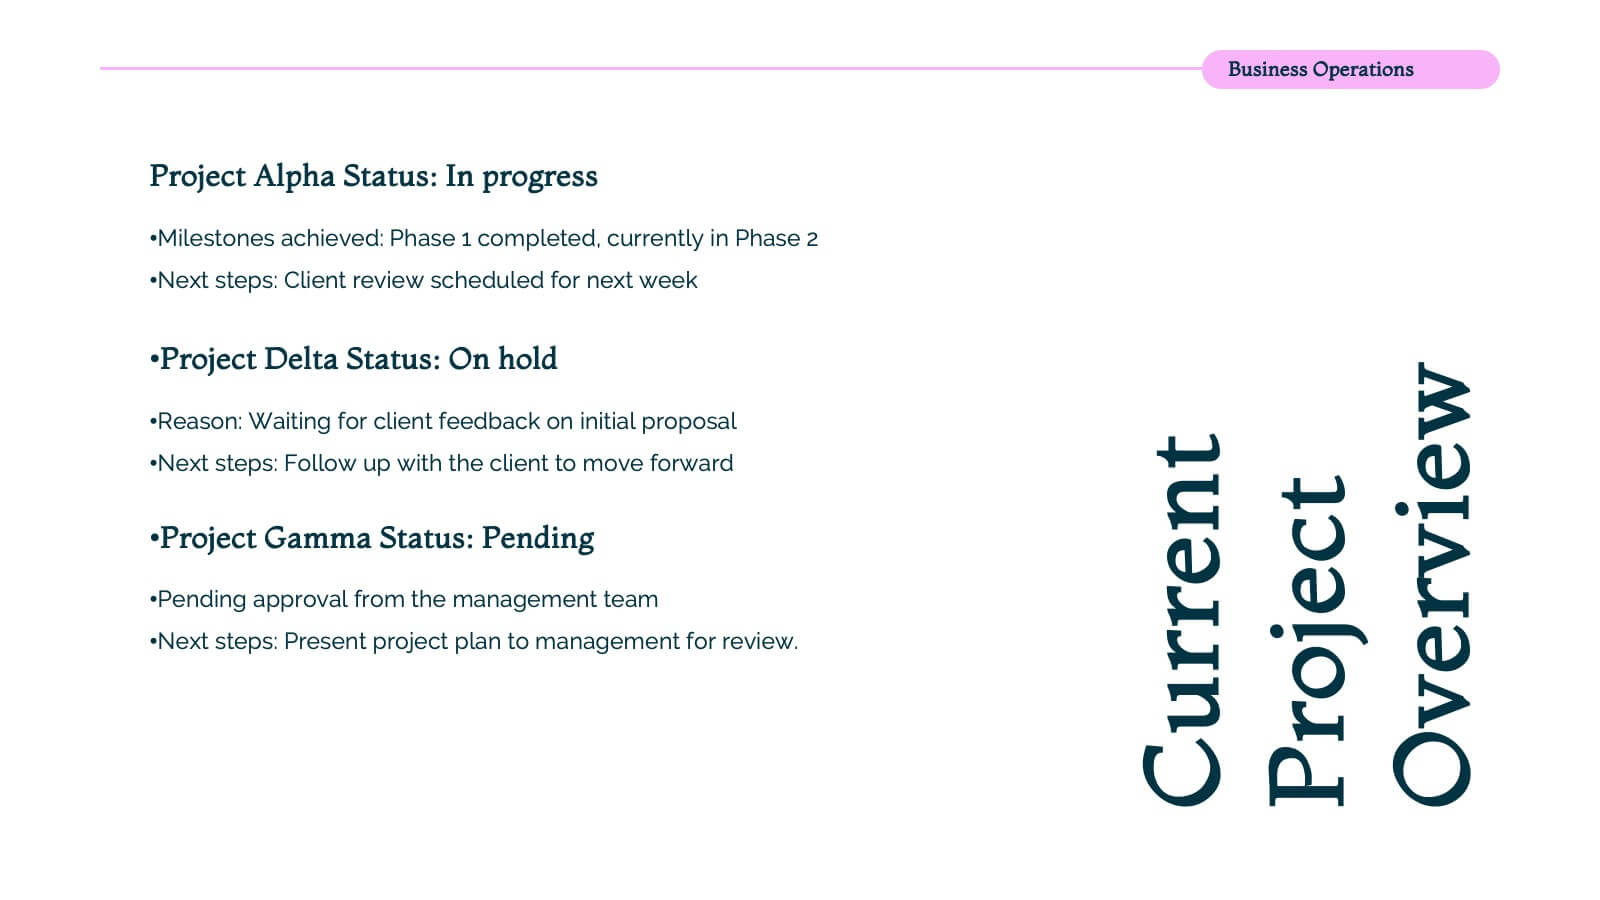
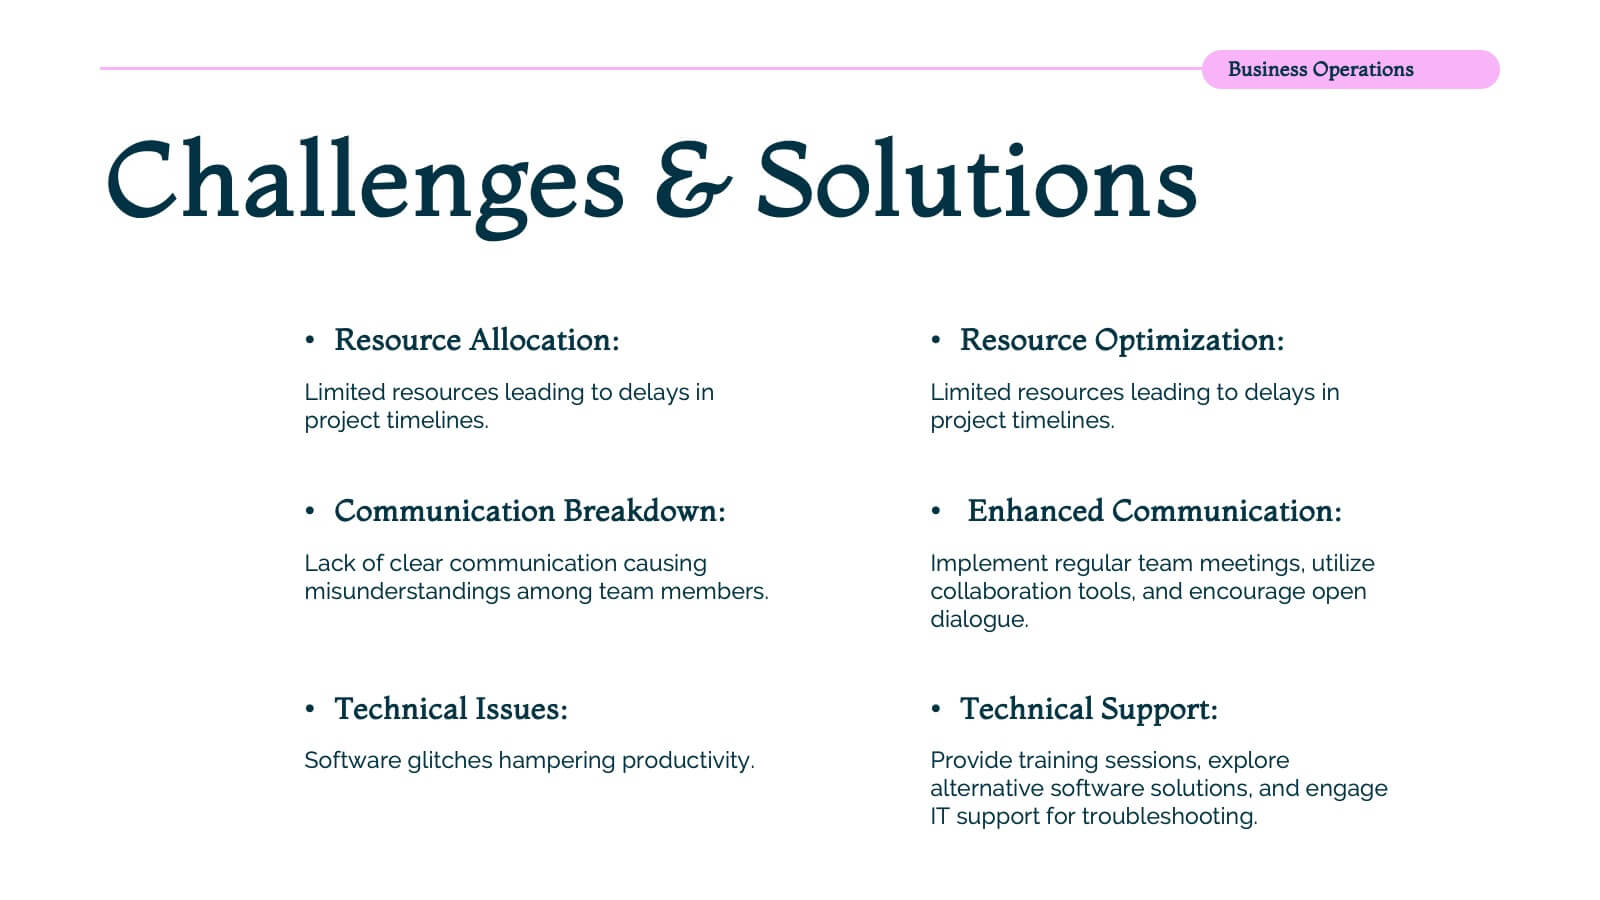
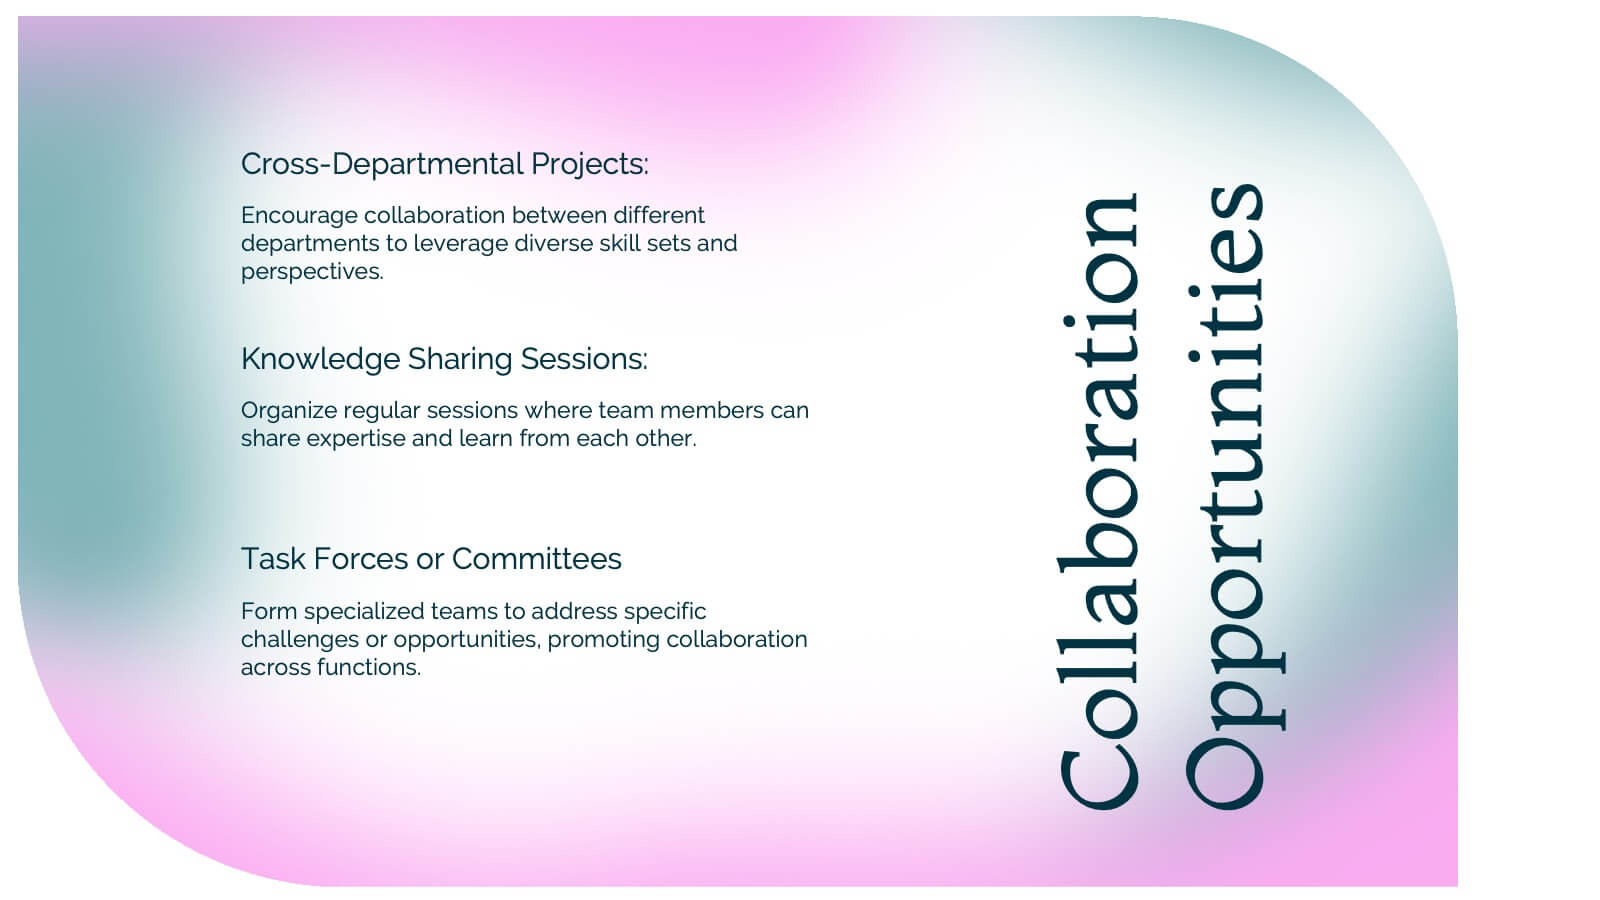
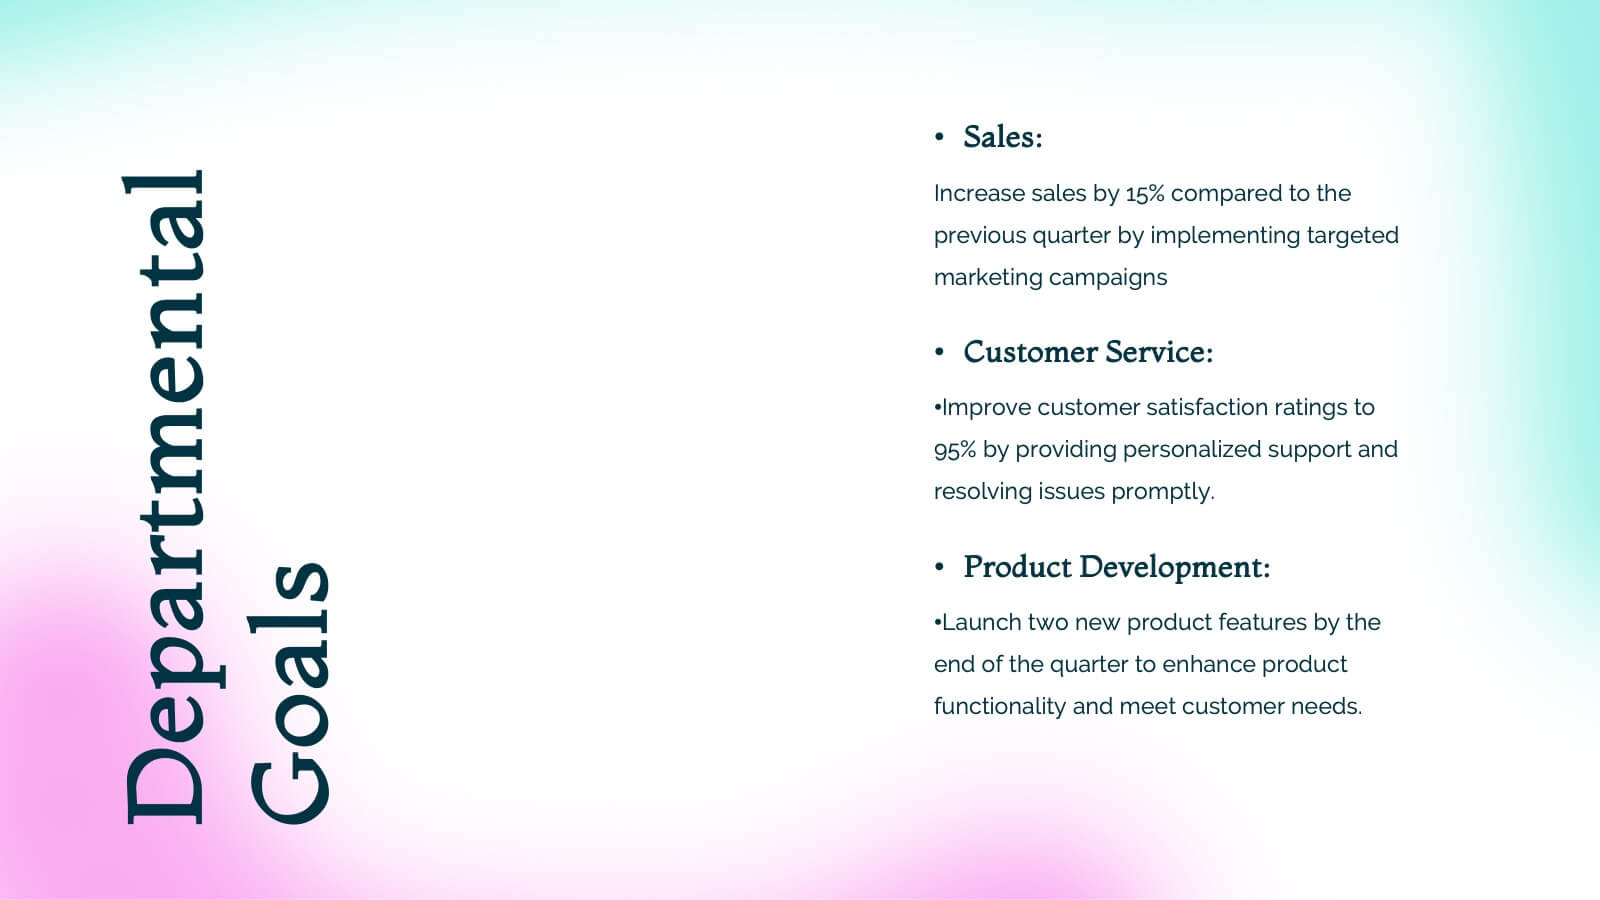
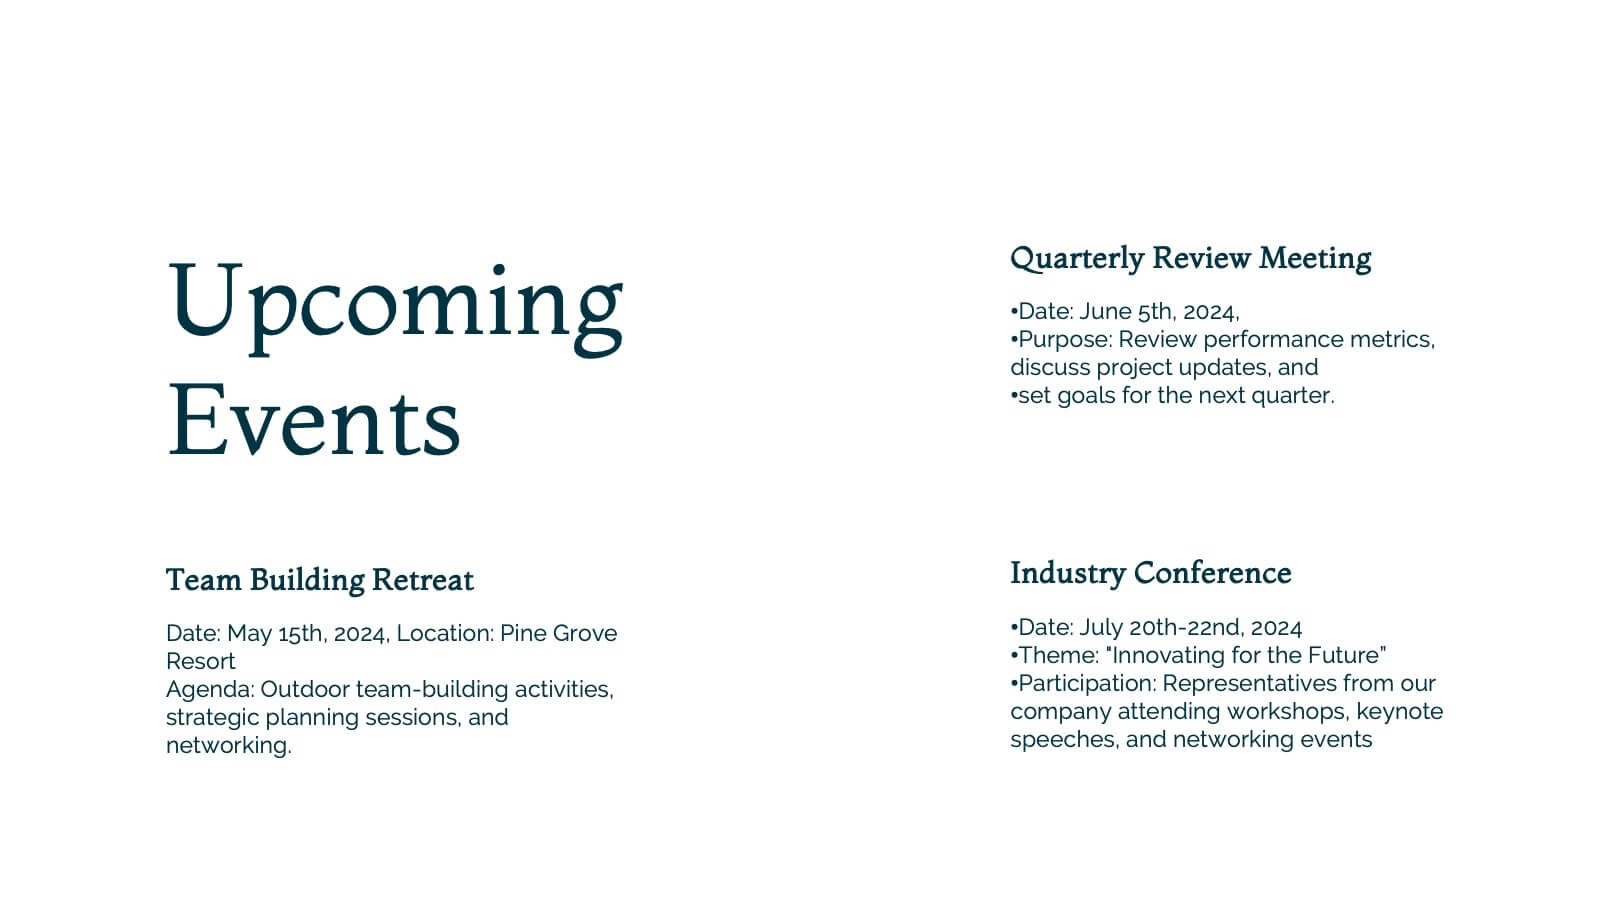
Nova Business Operations Plan Presentation
Create a polished business operations plan with this modern and organized template! It covers everything from team updates and project overviews to resource allocation and collaboration opportunities. Perfect for structuring departmental goals, process improvements, and employee recognition. Compatible with PowerPoint, Keynote, and Google Slides for a seamless, professional presentation.


21 slides
Cascade Marketing Proposal Template Presentation
Ignite your creativity with our dazzling Cascade Marketing Proposal Template Presentation! This captivating design brings your ideas to life, ensuring your presentation stands out. The sleek, dark theme is punctuated by electric blue accents, adding a modern, professional touch. Each slide is meticulously crafted, offering a perfect blend of visuals and content that keeps your audience engaged from start to finish. From the Company Overview to Growth Projections, every aspect of your pitch is highlighted with style and clarity. The template is fully customizable, allowing you to tailor it to your brand's identity effortlessly. Whether you're pitching to investors or presenting internally, this template has everything you need to make a lasting impression. Compatible with PowerPoint, Keynote, and Google Slides, it’s versatile and easy to use. Get ready to electrify your next presentation and leave your audience in awe!


4 slides
Executive Business Planning Roadmap Presentation
Outline your strategic initiatives with this Executive Business Planning Roadmap. Ideal for mapping product development, quarterly goals, or department plans, this slide helps visualize key stages across multiple projects. Easy to edit in PowerPoint, Keynote, and Google Slides—perfect for leadership updates, planning meetings, or executive-level presentations.


2 slides
Visual Resume and Project Gallery Presentation
Showcase your personality and creative work with the Visual Resume and Project Gallery Presentation. This vibrant layout blends a professional “About Me” section with a clean, image-focused gallery—ideal for designers, freelancers, or artists. Fully editable in Canva, PowerPoint, Keynote, and Google Slides for easy customization and seamless presentation.


21 slides
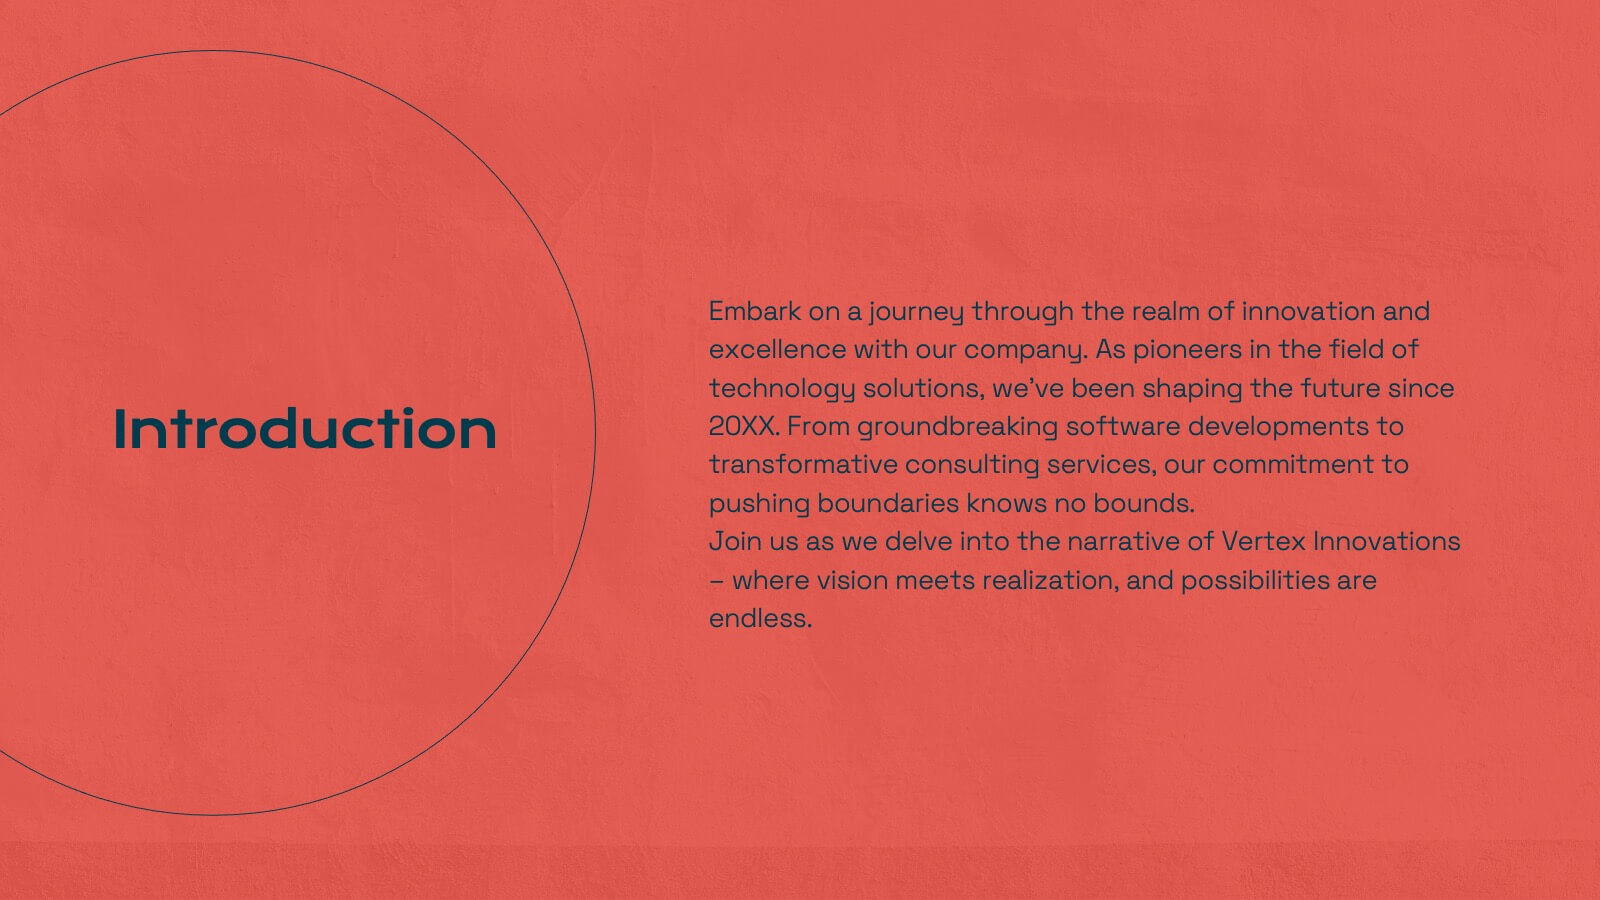
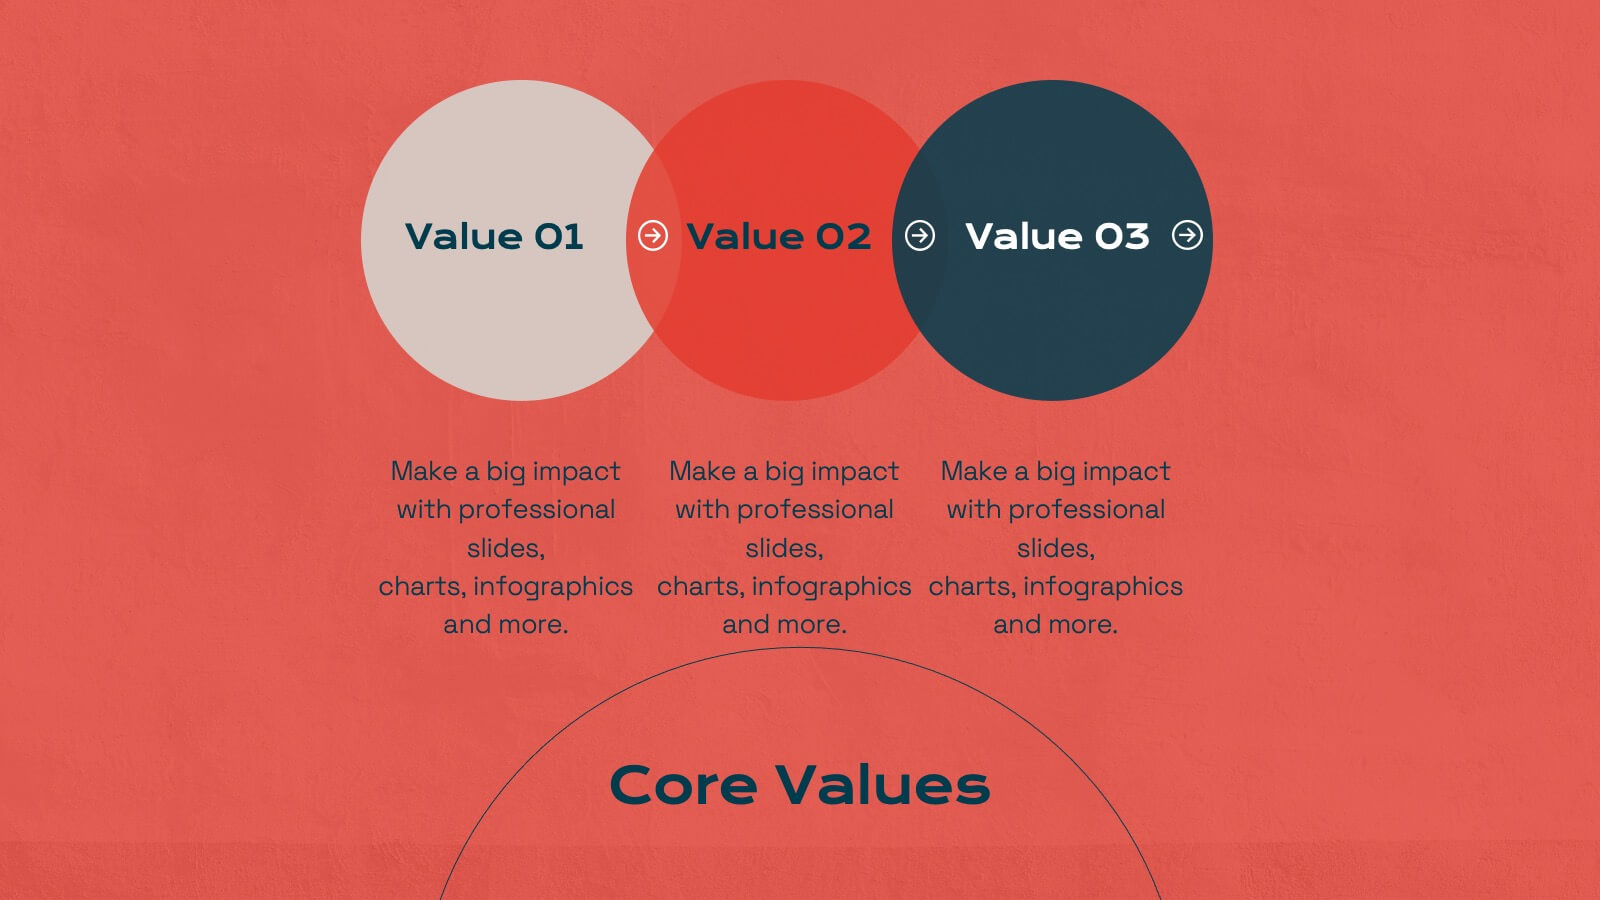
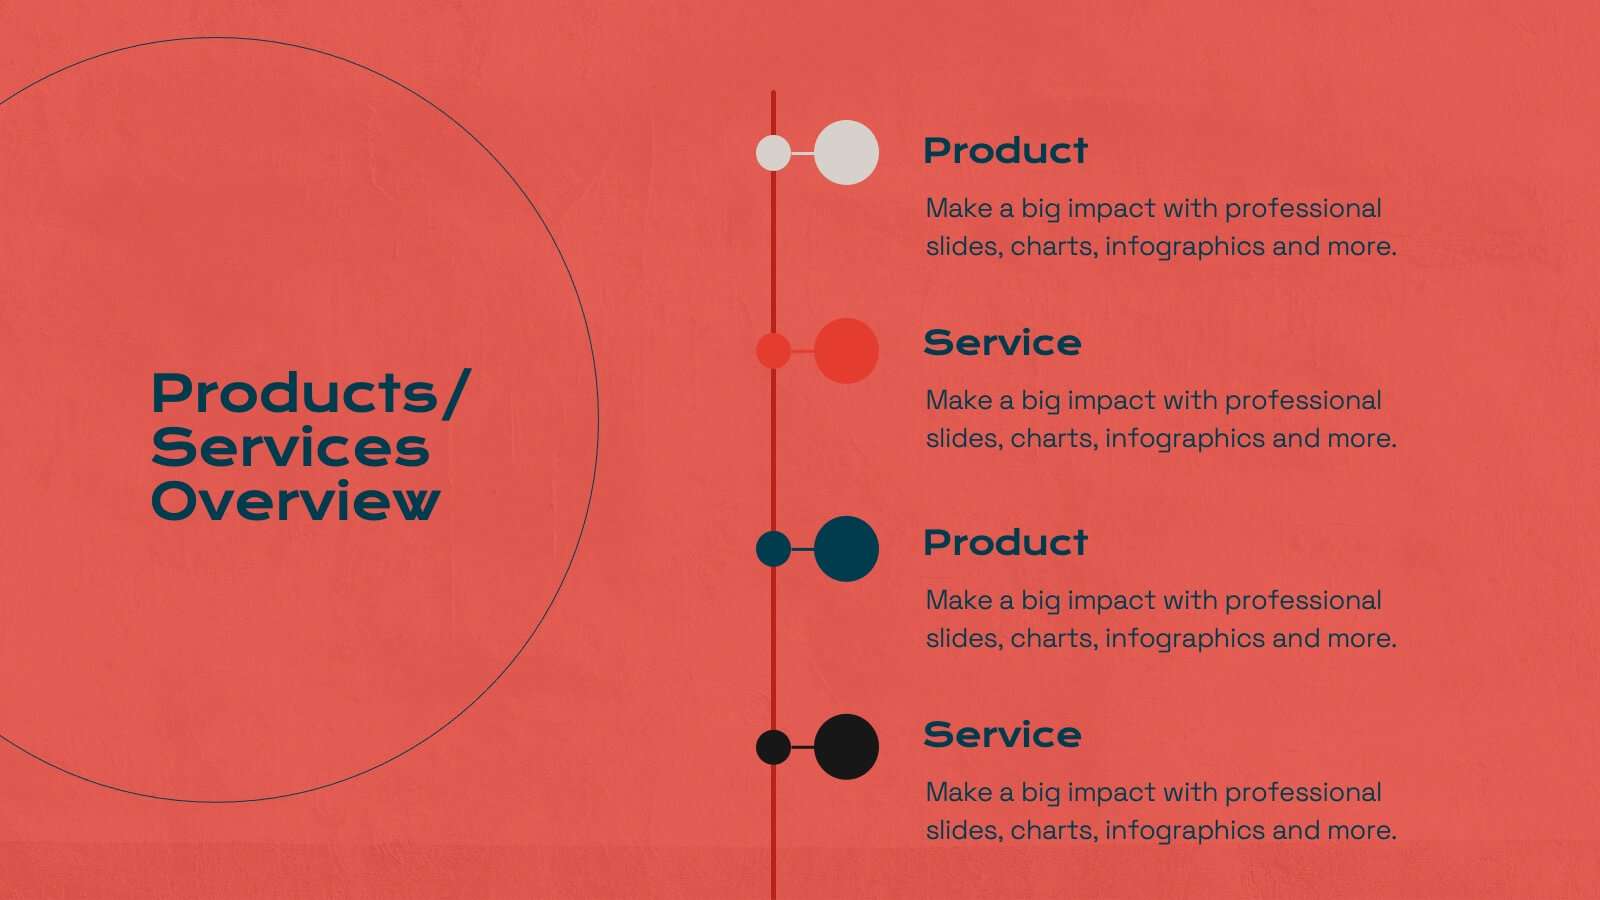
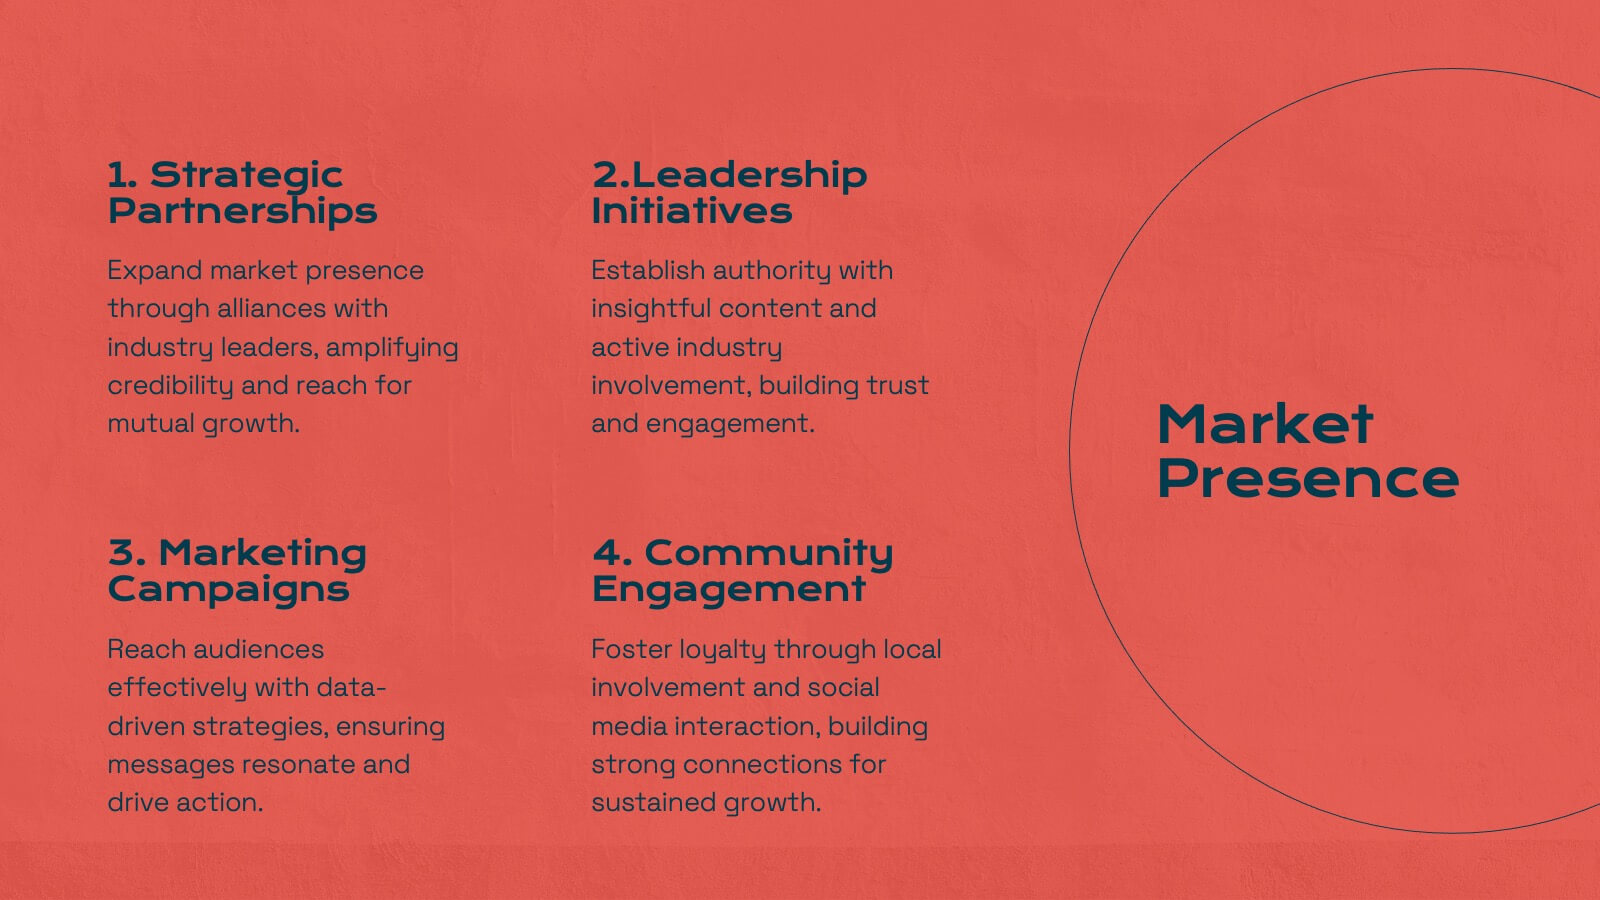
Titan Marketing Research Report Presentation
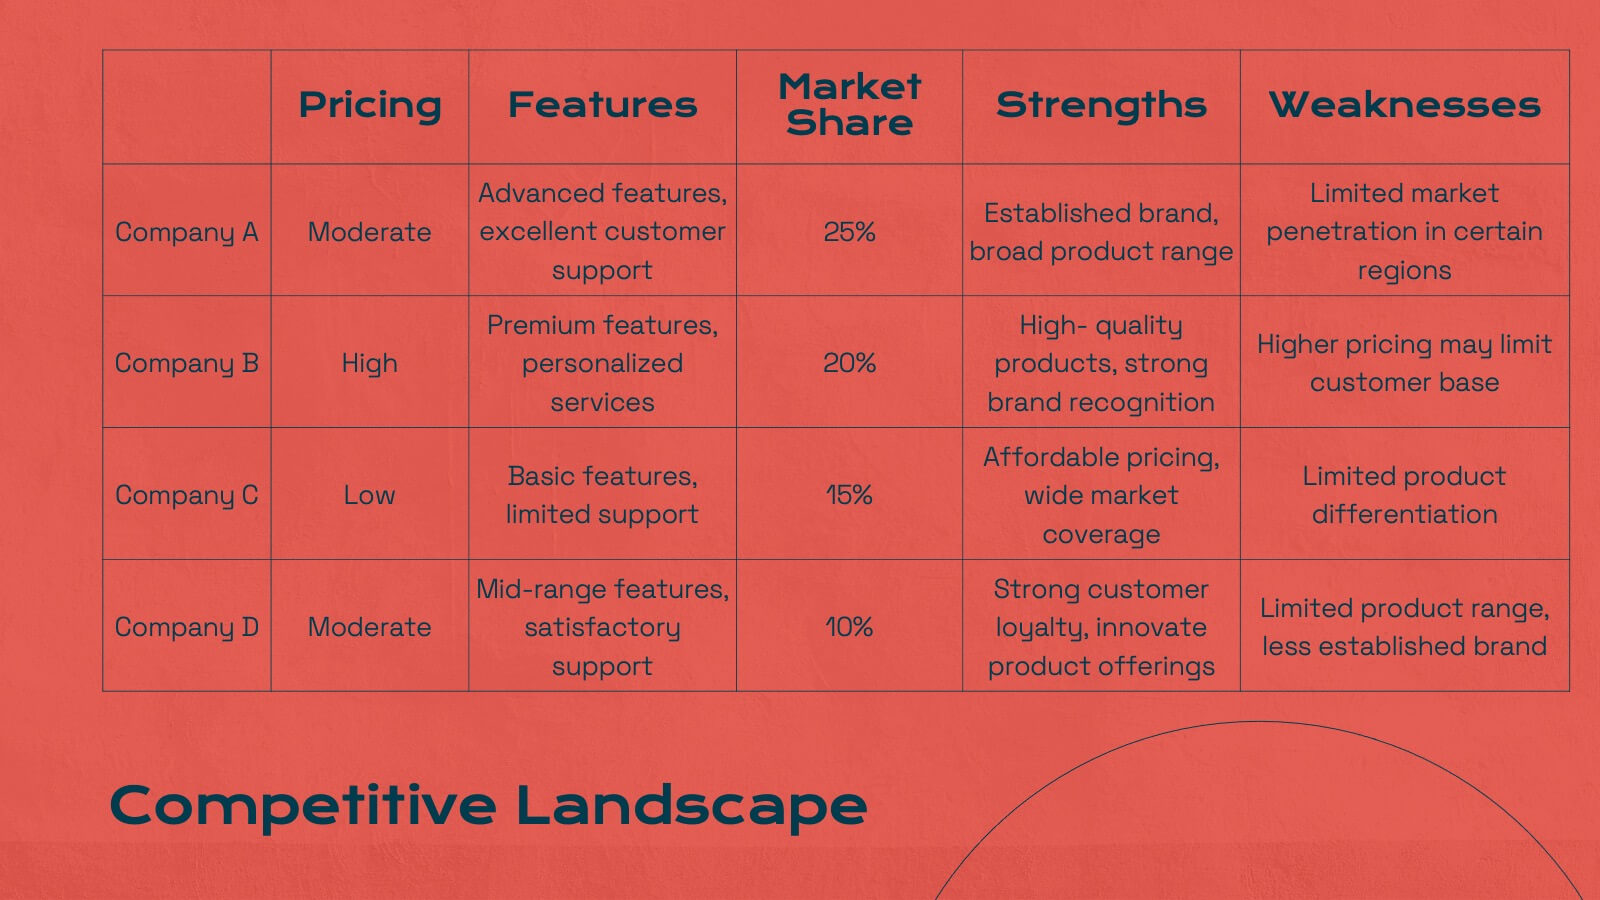
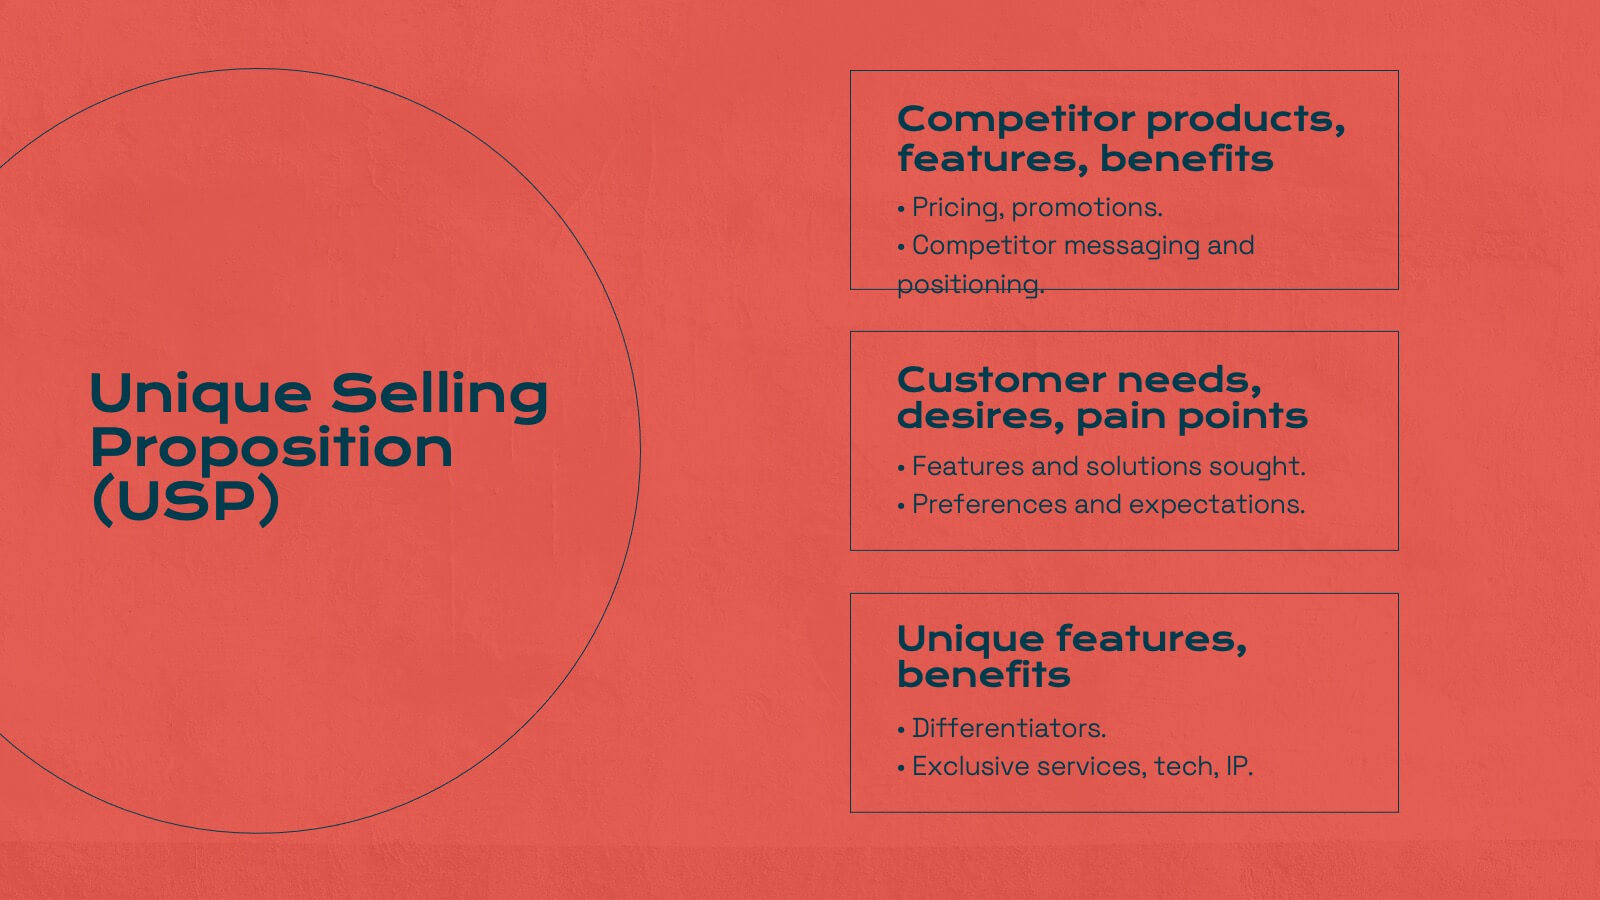
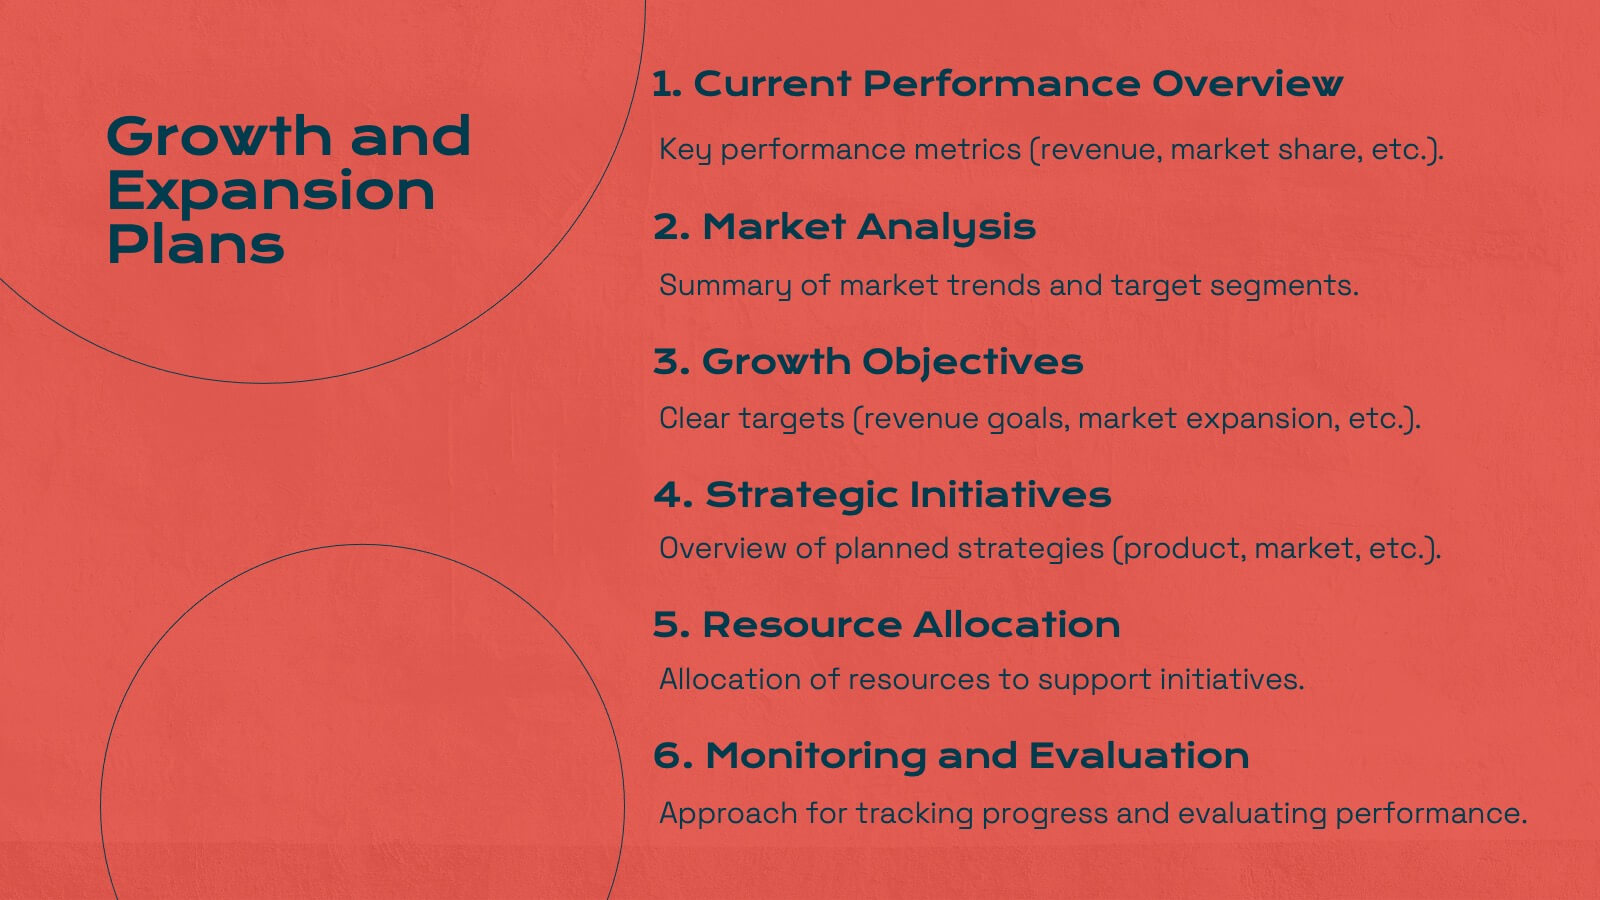
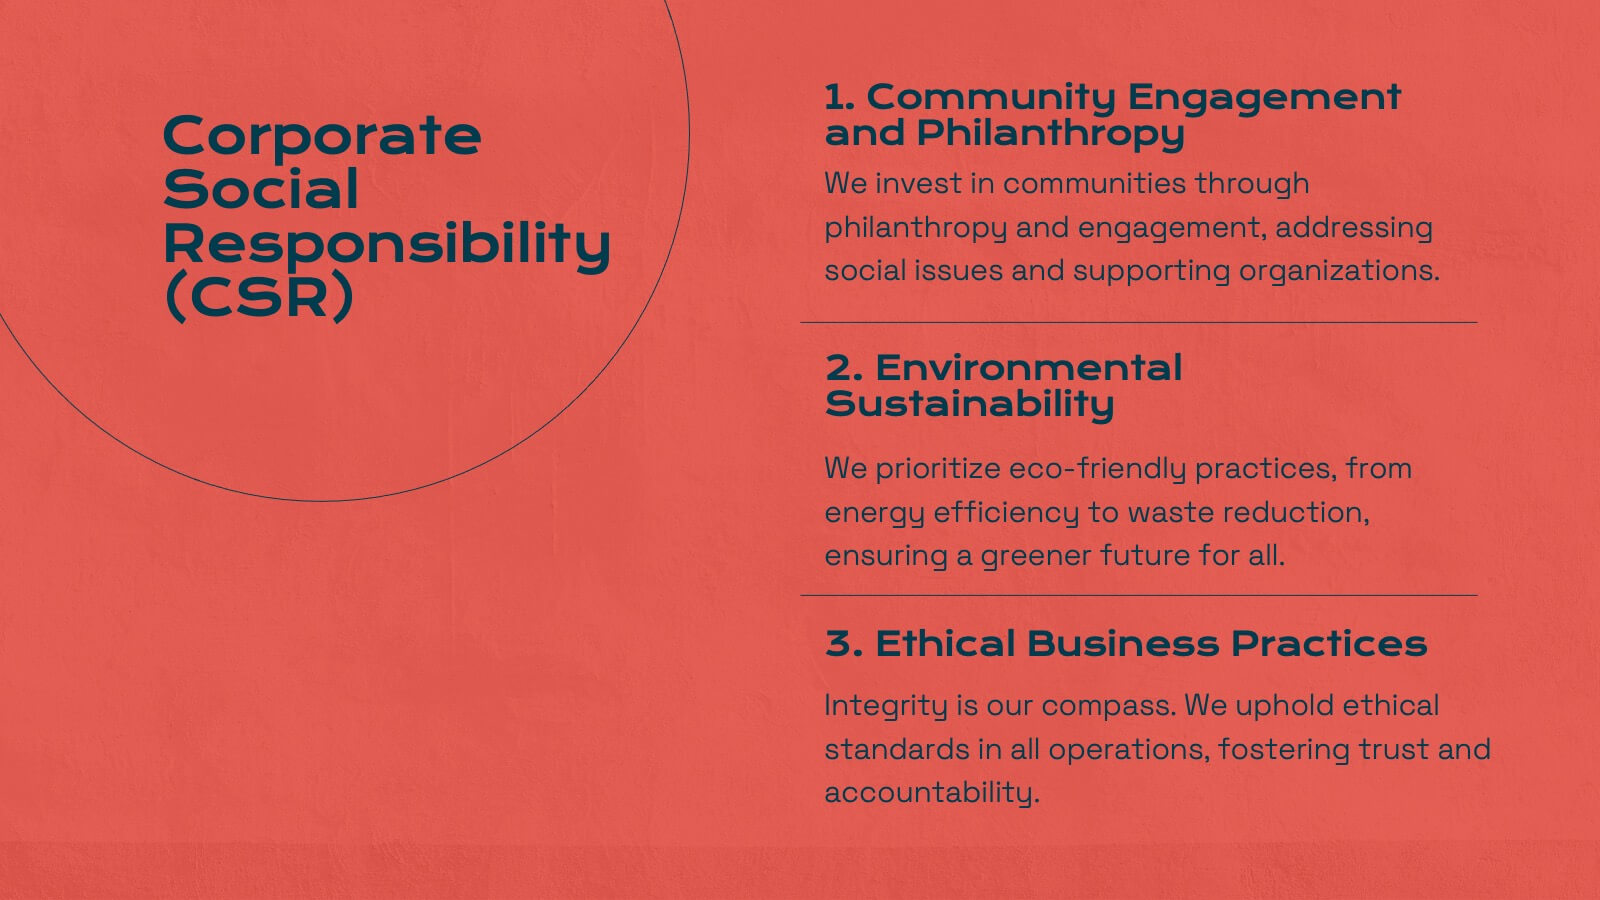
Energize your marketing research presentations with this bold, vibrant template. Perfect for detailing company history, market presence, and competitive landscapes, it features a striking red design that captures attention. Highlight key insights like target audience, financial highlights, and growth plans to engage your audience. Compatible with PowerPoint, Keynote, and Google Slides, it ensures seamless presentations on any platform.


7 slides
Market Focus and Demographic Insights Presentation
Present your audience data with clarity using this Market Focus and Demographic Insights presentation. Designed with a central persona and six key data points, this slide helps visualize customer characteristics, behavioral trends, and strategic targets. Great for marketing, branding, or investor decks. Fully editable in Canva, PowerPoint, and Google Slides.


8 slides
7-Step Business Process Presentation
Streamline your workflow with this 7-Step Business Process template. Perfect for illustrating step-by-step strategies, milestones, and project phases. Easily customizable with editable colors, icons, and text to fit your brand. Enhance presentations with a professional, clean layout. Compatible with PowerPoint, Keynote, and Google Slides for seamless integration.


4 slides
Report Recap and Summary Section Presentation
Summarize key takeaways clearly with this Report Recap and Summary Section slide. Featuring a step-by-step horizontal layout with bold numbering, icons, and text boxes, this design helps emphasize three main points or stages in your report. Ideal for executive briefs or performance reviews. Fully editable in Canva, PowerPoint, or Google Slides.


28 slides
Hawking Brand Strategy Report Presentation
Introduce your brand's vision with this polished and professional strategy report presentation template. Designed for businesses, marketers, and branding agencies, it features comprehensive sections for communicating your brand identity, goals, and market positioning. This template highlights areas such as brand philosophy, target audience insights, competitive analysis, and visual identity systems. Showcase your brand’s unique selling proposition with engaging slides dedicated to colors, typography, logos, and packaging. With layouts tailored for presenting data, strategies, and case studies, you’ll ensure every aspect of your brand resonates clearly. Compatible with PowerPoint, Google Slides, and Keynote, this template is fully customizable to match your style and branding needs. Its clean, modern design and easy-to-edit structure make it a versatile choice for strategy reports, pitches, or team presentations. Elevate your branding efforts and communicate your story with confidence and clarity.


23 slides
Cosmira Digital Strategy Presentation
This Digital Strategy Presentation provides a comprehensive framework for outlining business objectives, competitive analysis, and growth opportunities. It includes key sections such as SWOT analysis, performance metrics, and implementation plans. Ideal for businesses and marketers, the slides are fully editable and compatible with PowerPoint, Keynote, and Google Slides.


6 slides
Agile Delivery Framework for Projects Presentation
Visualize agile project phases with this spiral delivery framework slide. Ideal for project managers and scrum teams to outline each step in a continuous delivery process. Features six clearly labeled stages, icons, and bold colors. Fully editable in PowerPoint, Keynote, and Google Slides for clear, structured agile workflow presentations.


4 slides
Strategic Risk Assessment and Control Presentation
Highlight layered risk priorities with the Strategic Risk Assessment and Control Presentation. This visual template uses a 3D concentric model (D to A) to illustrate escalating risk levels or control measures. Ideal for risk managers and compliance teams. Fully editable in PowerPoint, Google Slides, and Canva for seamless customization.


4 slides
Corporate Strategy Business Case Presentation
Develop a winning corporate strategy with this structured business case template! Perfect for analyzing finances, operations, market trends, and client insights, this clean and organized layout helps businesses communicate key strategies effectively. Fully customizable and compatible with PowerPoint, Keynote, and Google Slides for seamless, professional presentations.