


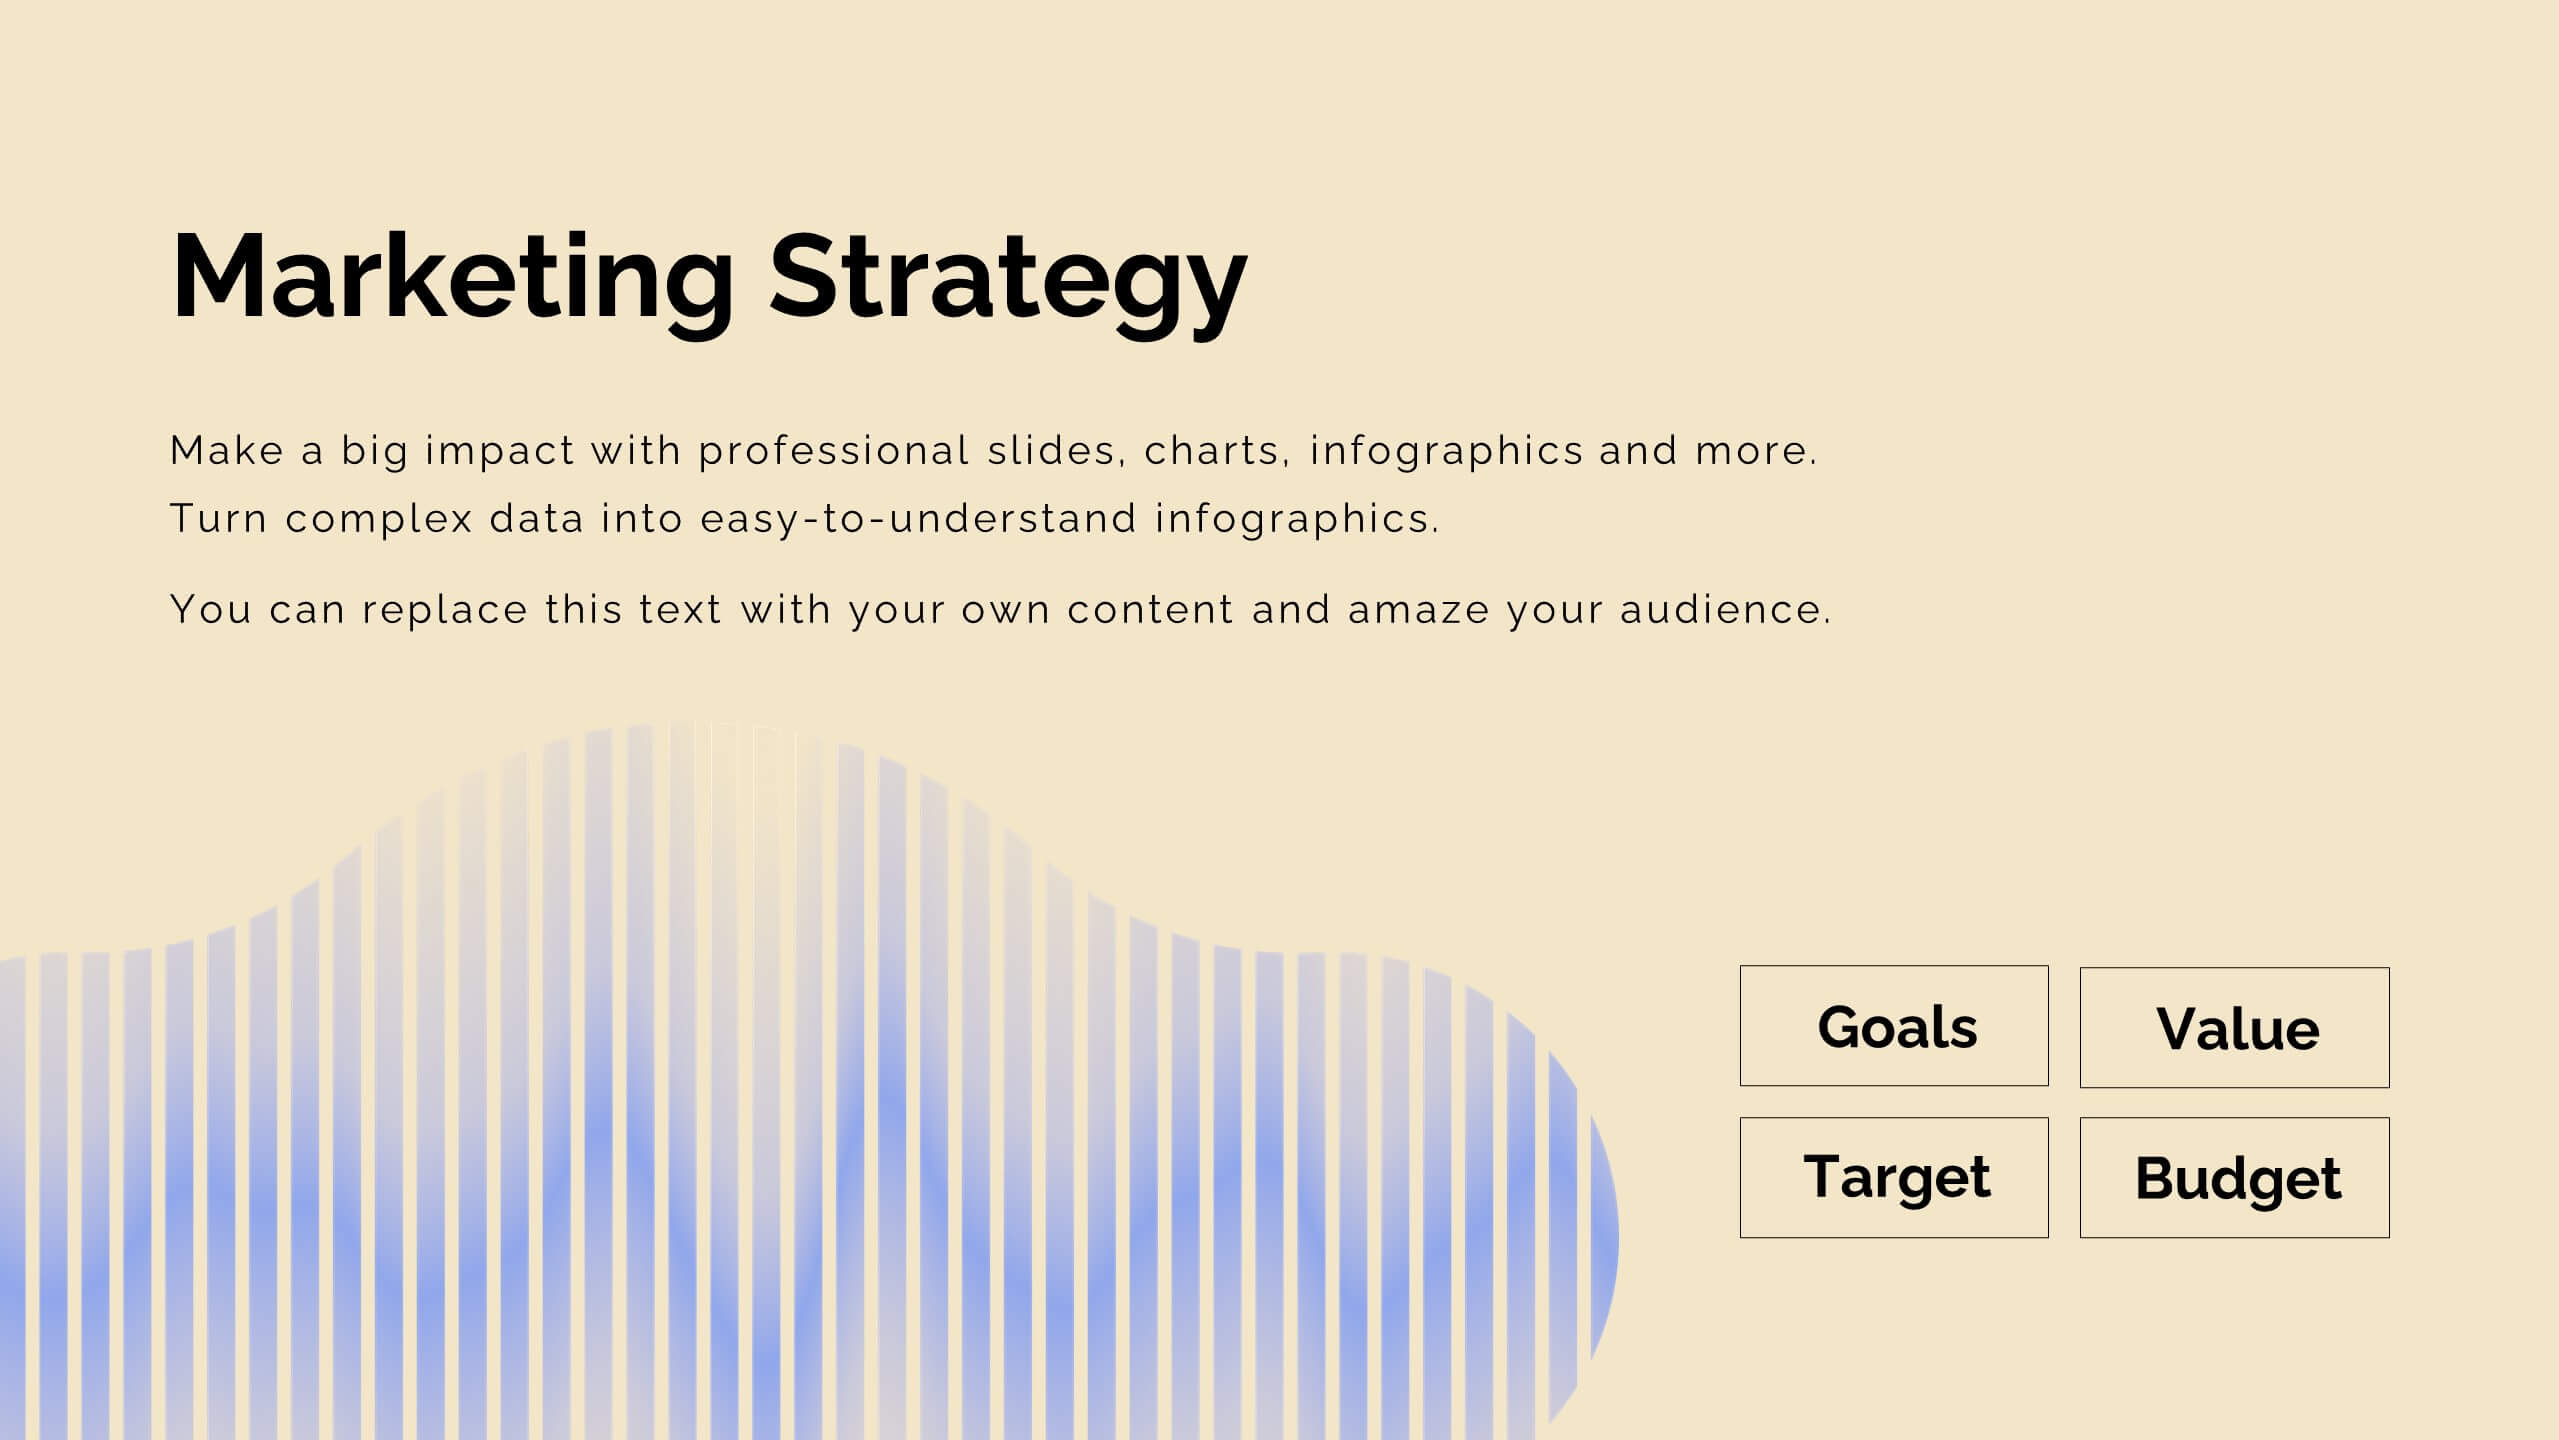
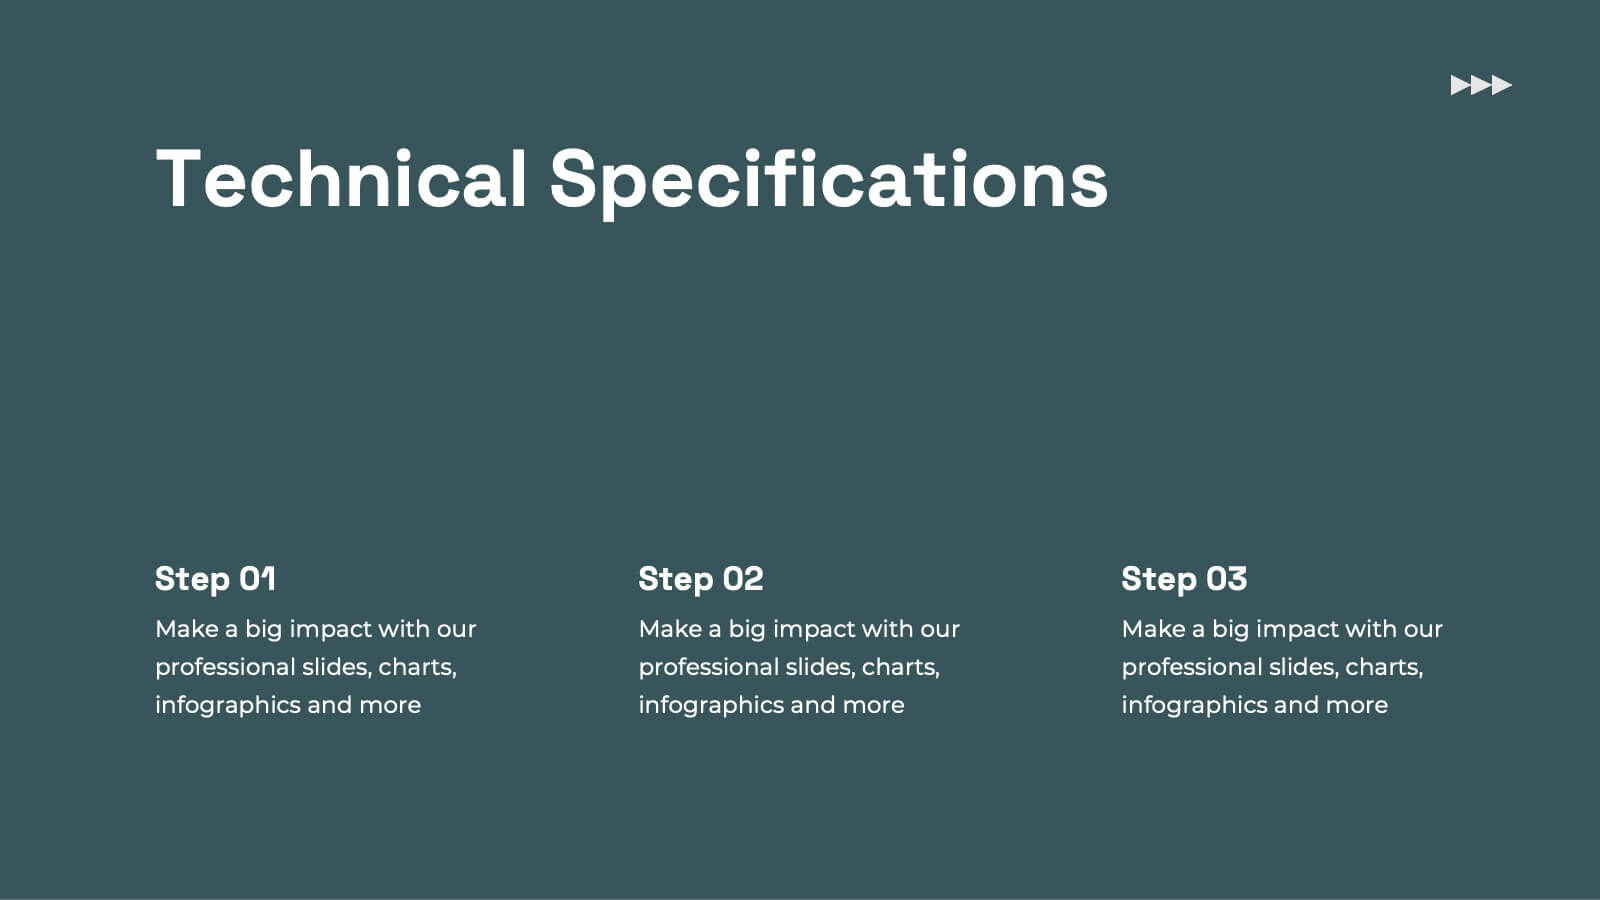
Features
- 5 Unique slides
- Fully editable and easy to edit in Microsoft Powerpoint, Keynote and Google Slides
- 16:9 widescreen layout
- Clean and professional designs
- Export to JPG, PDF or send by email


Do you have any questions?
Recommend


23 slides
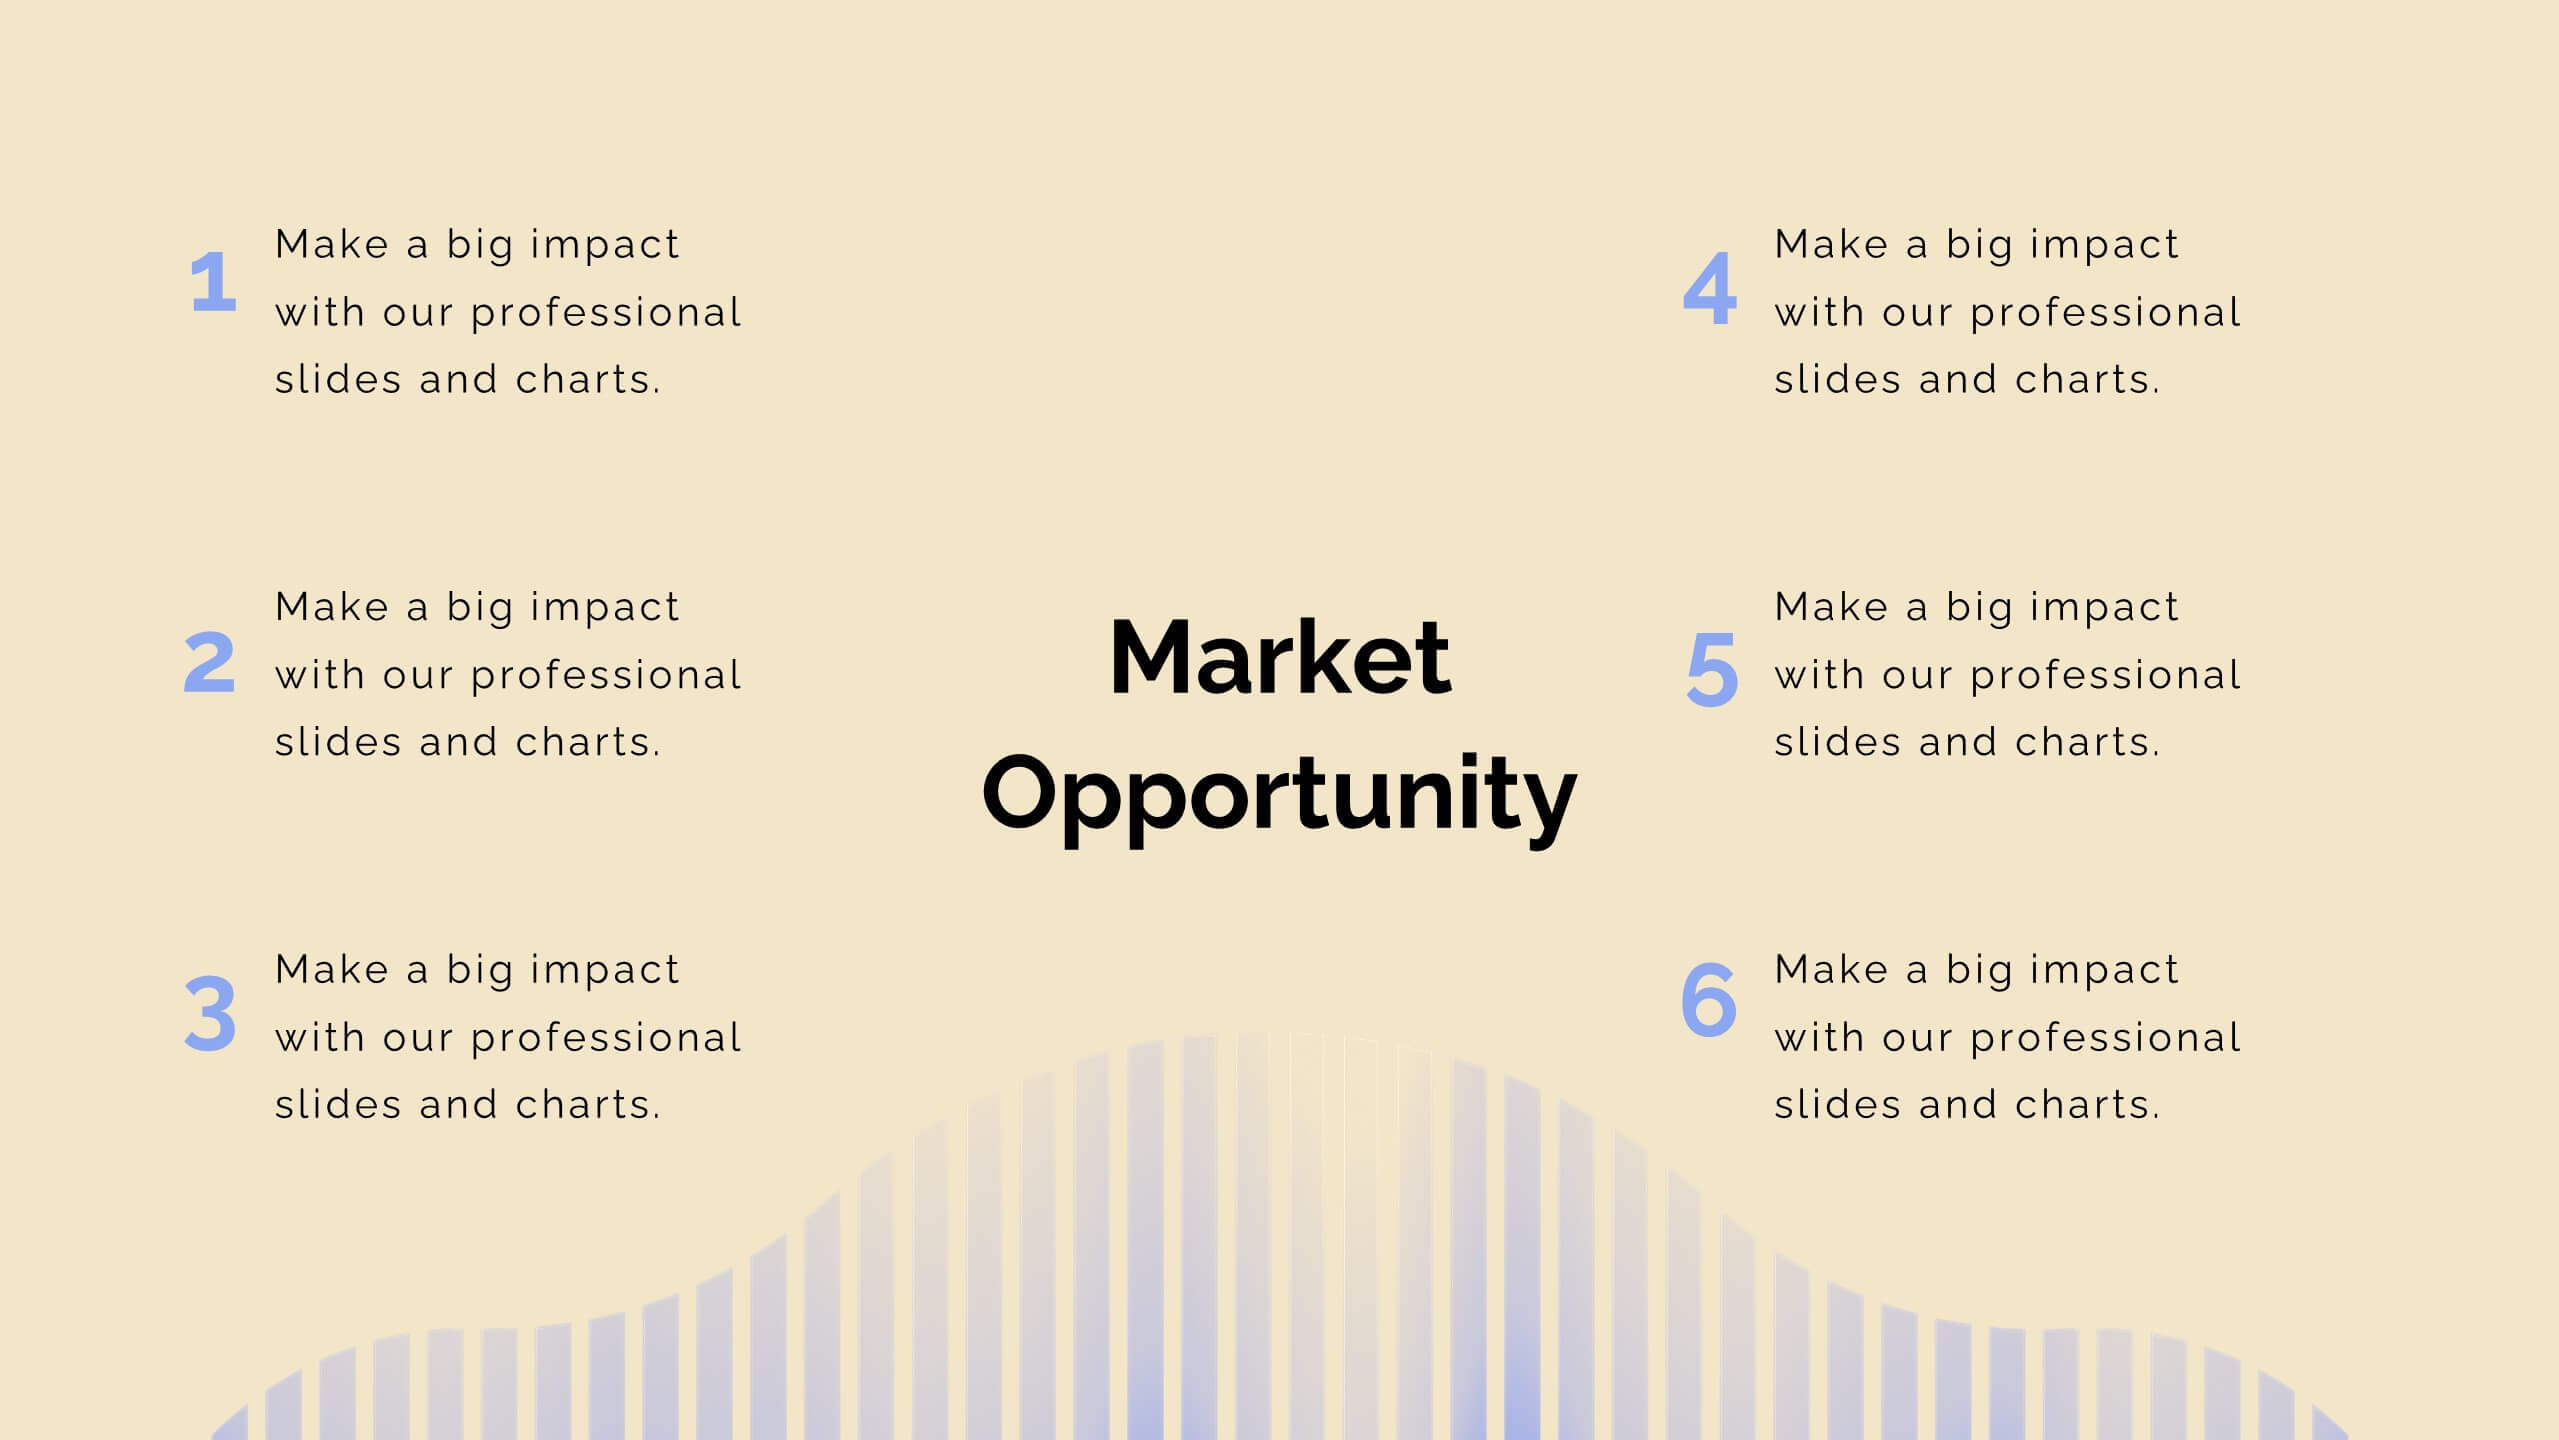
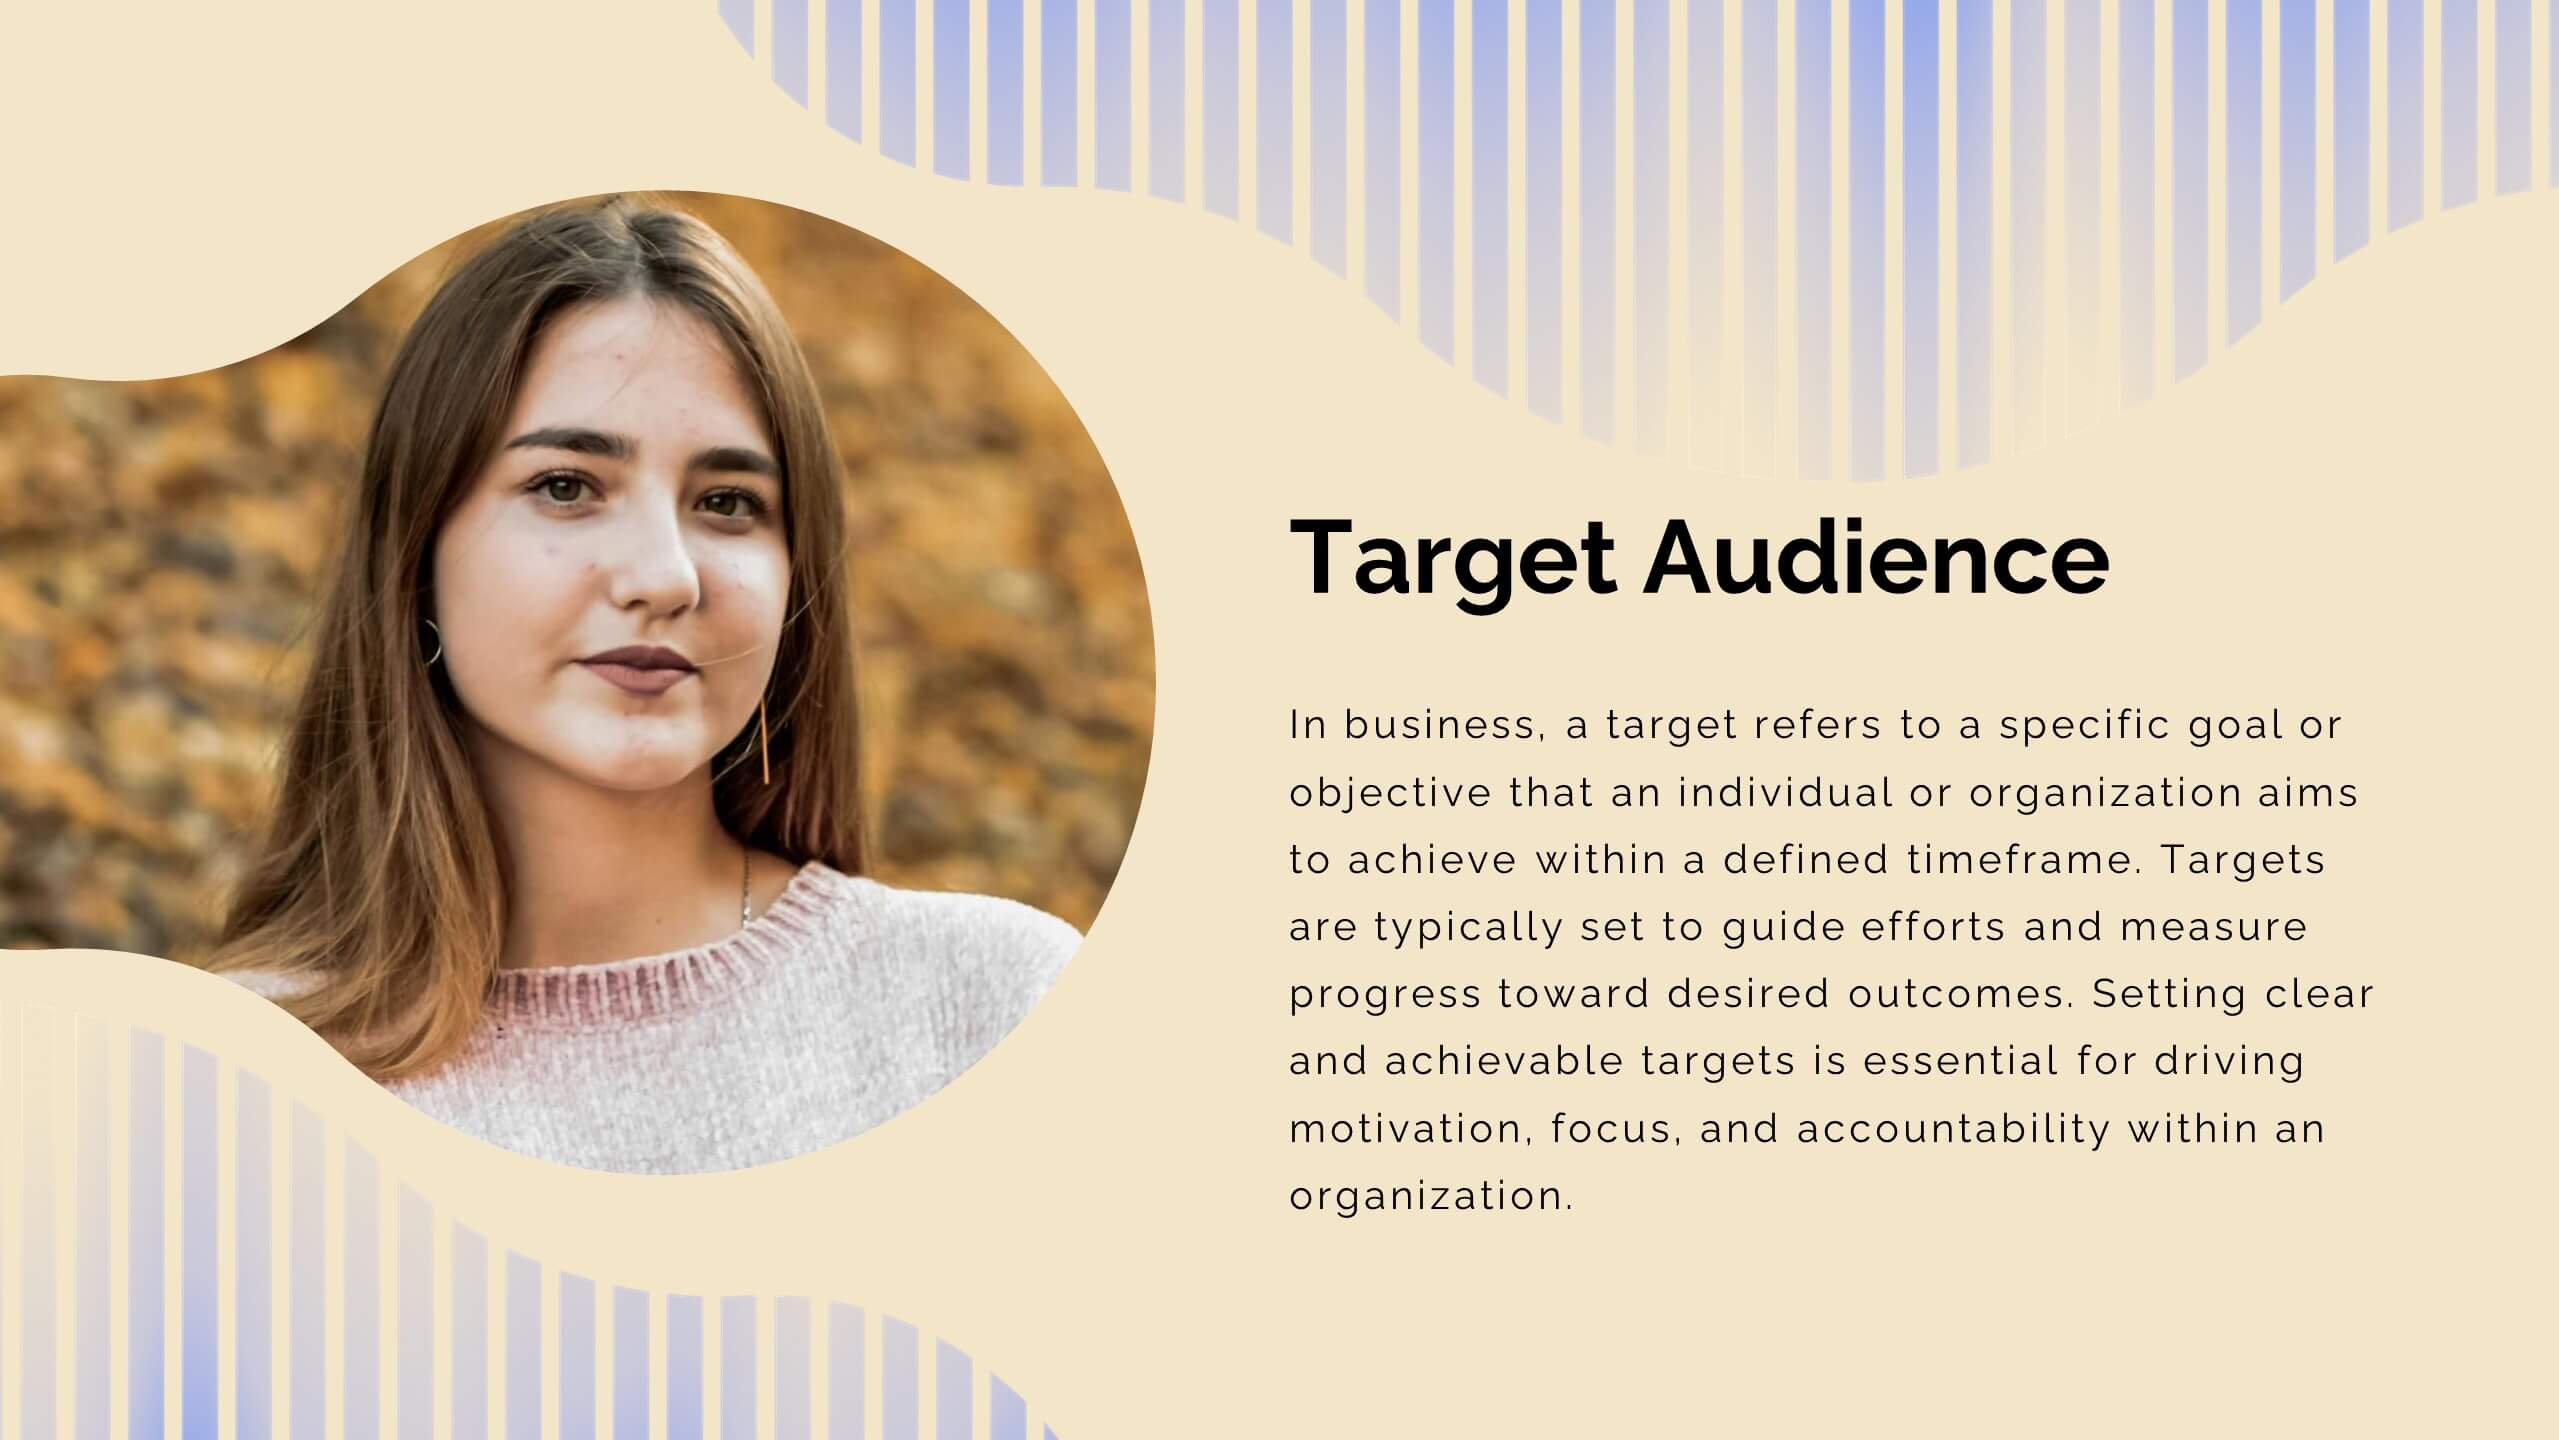
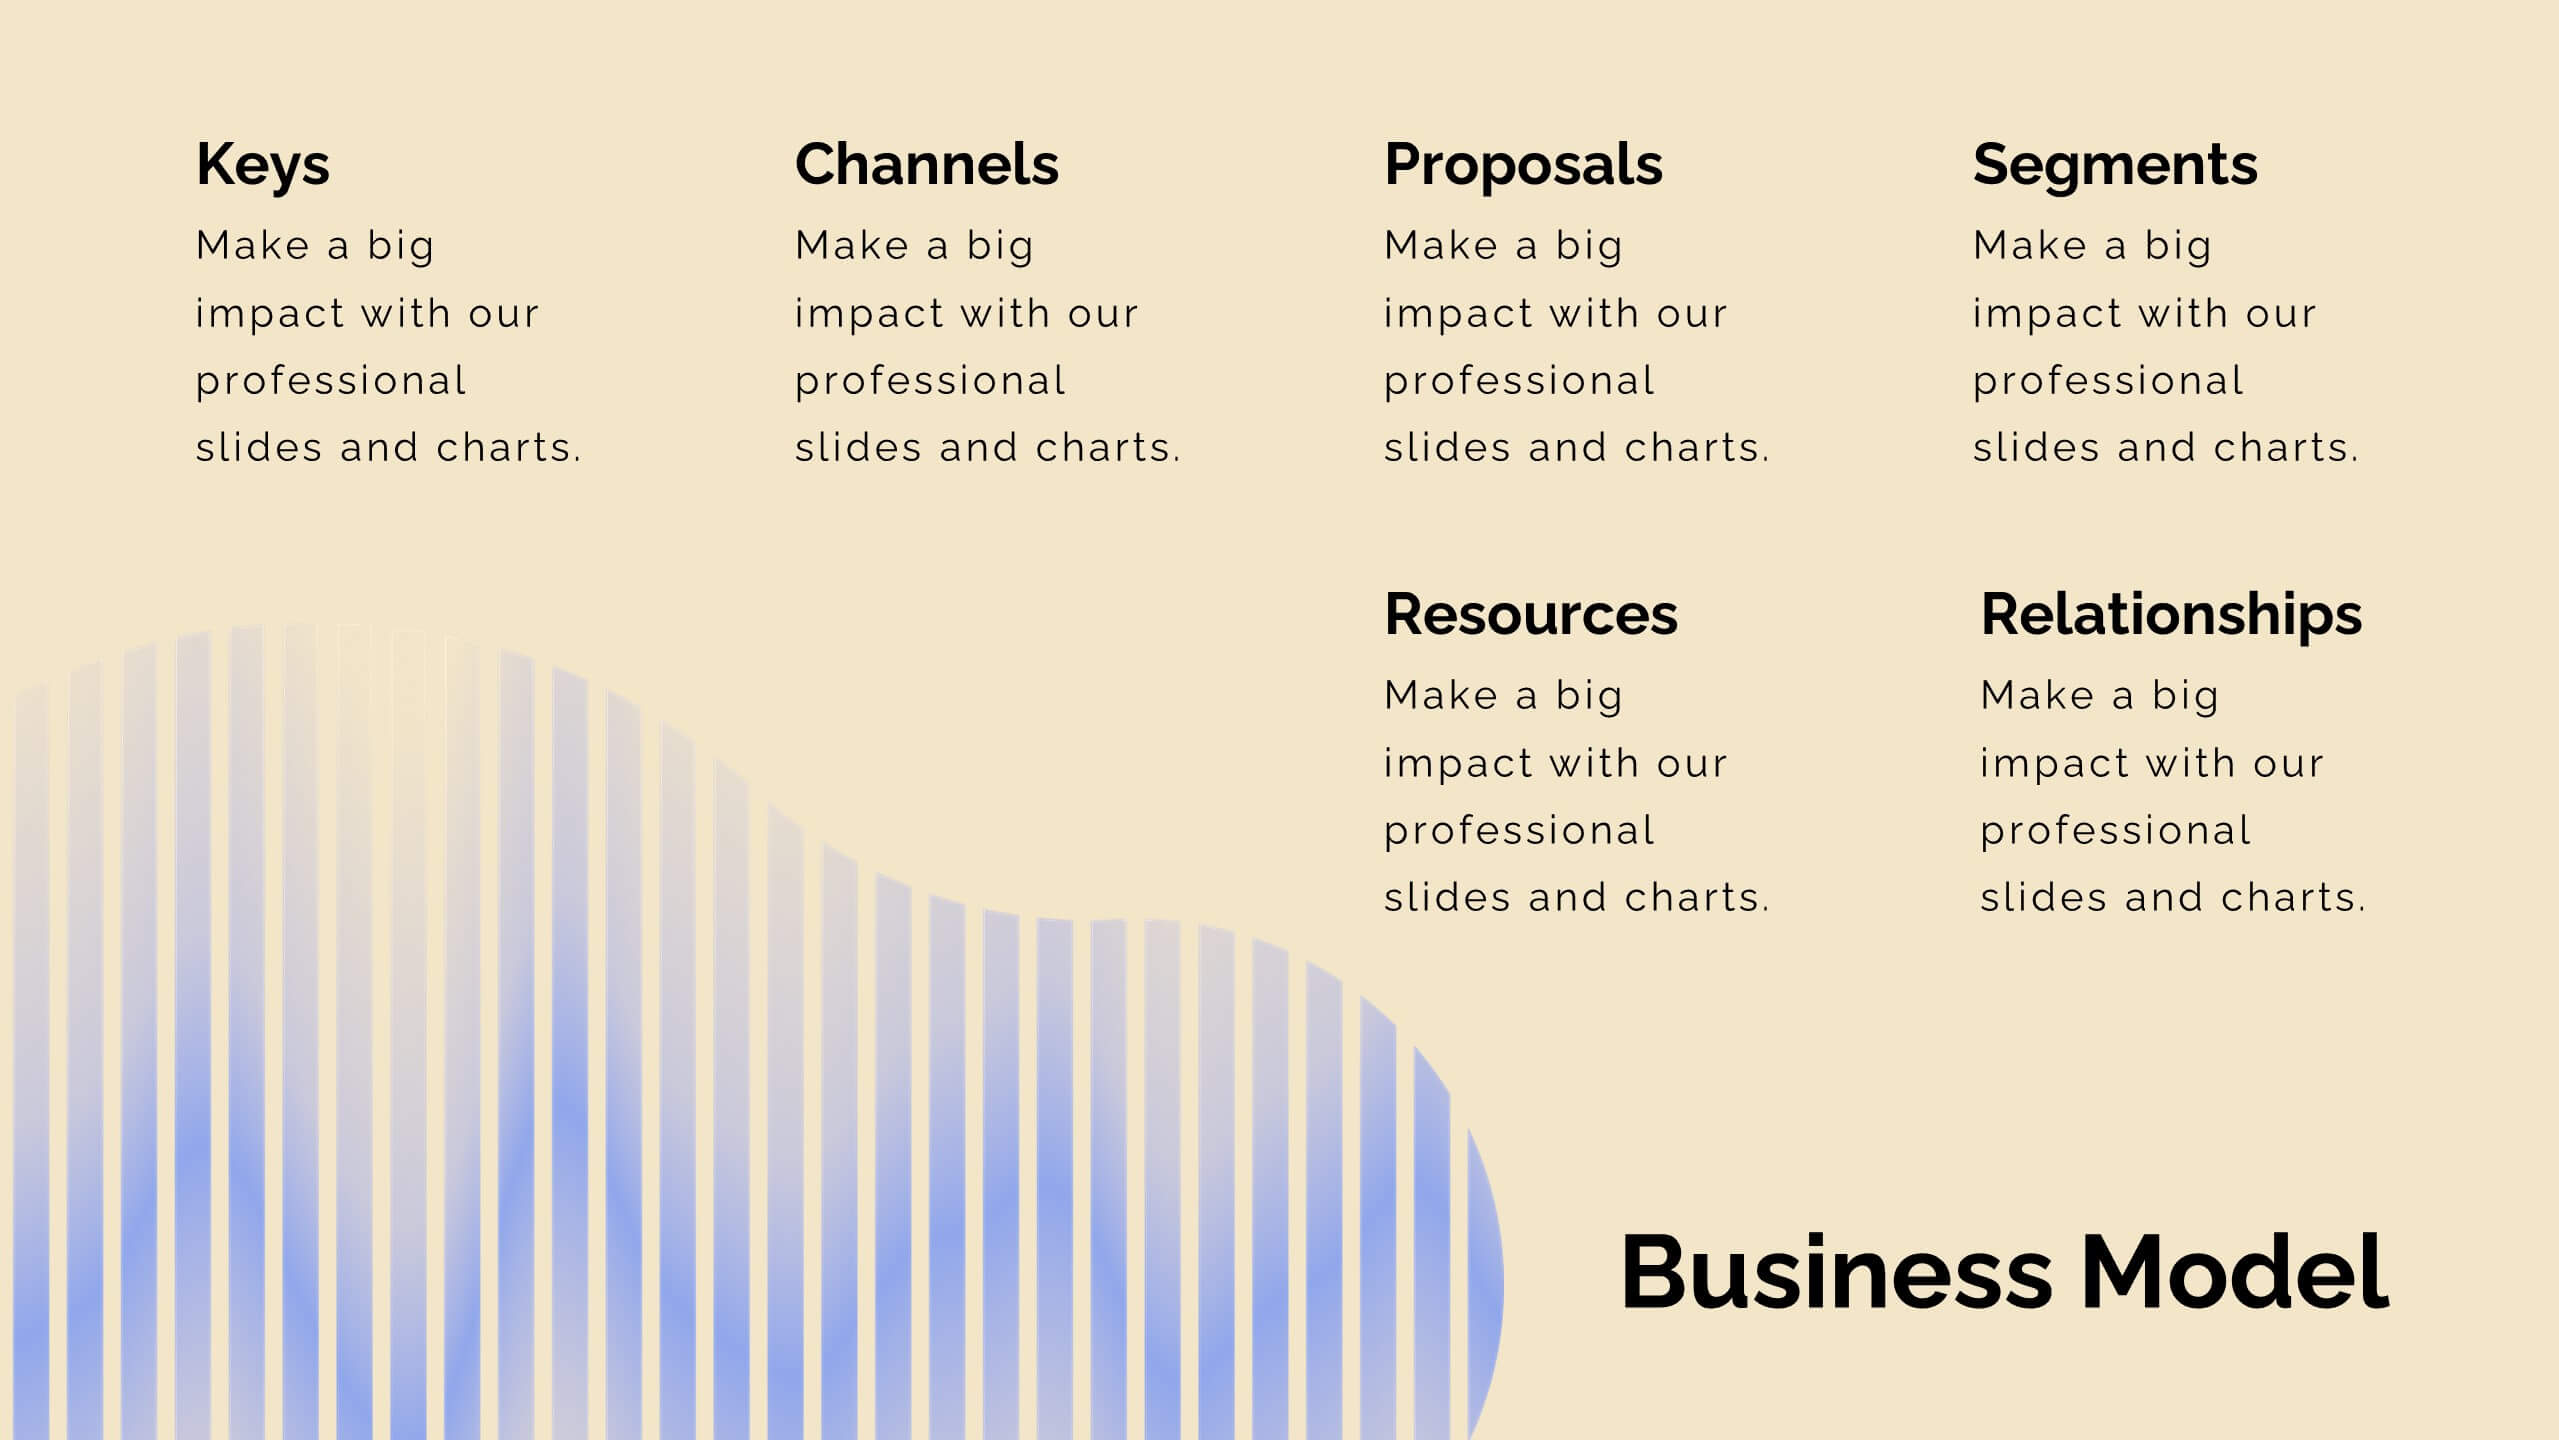
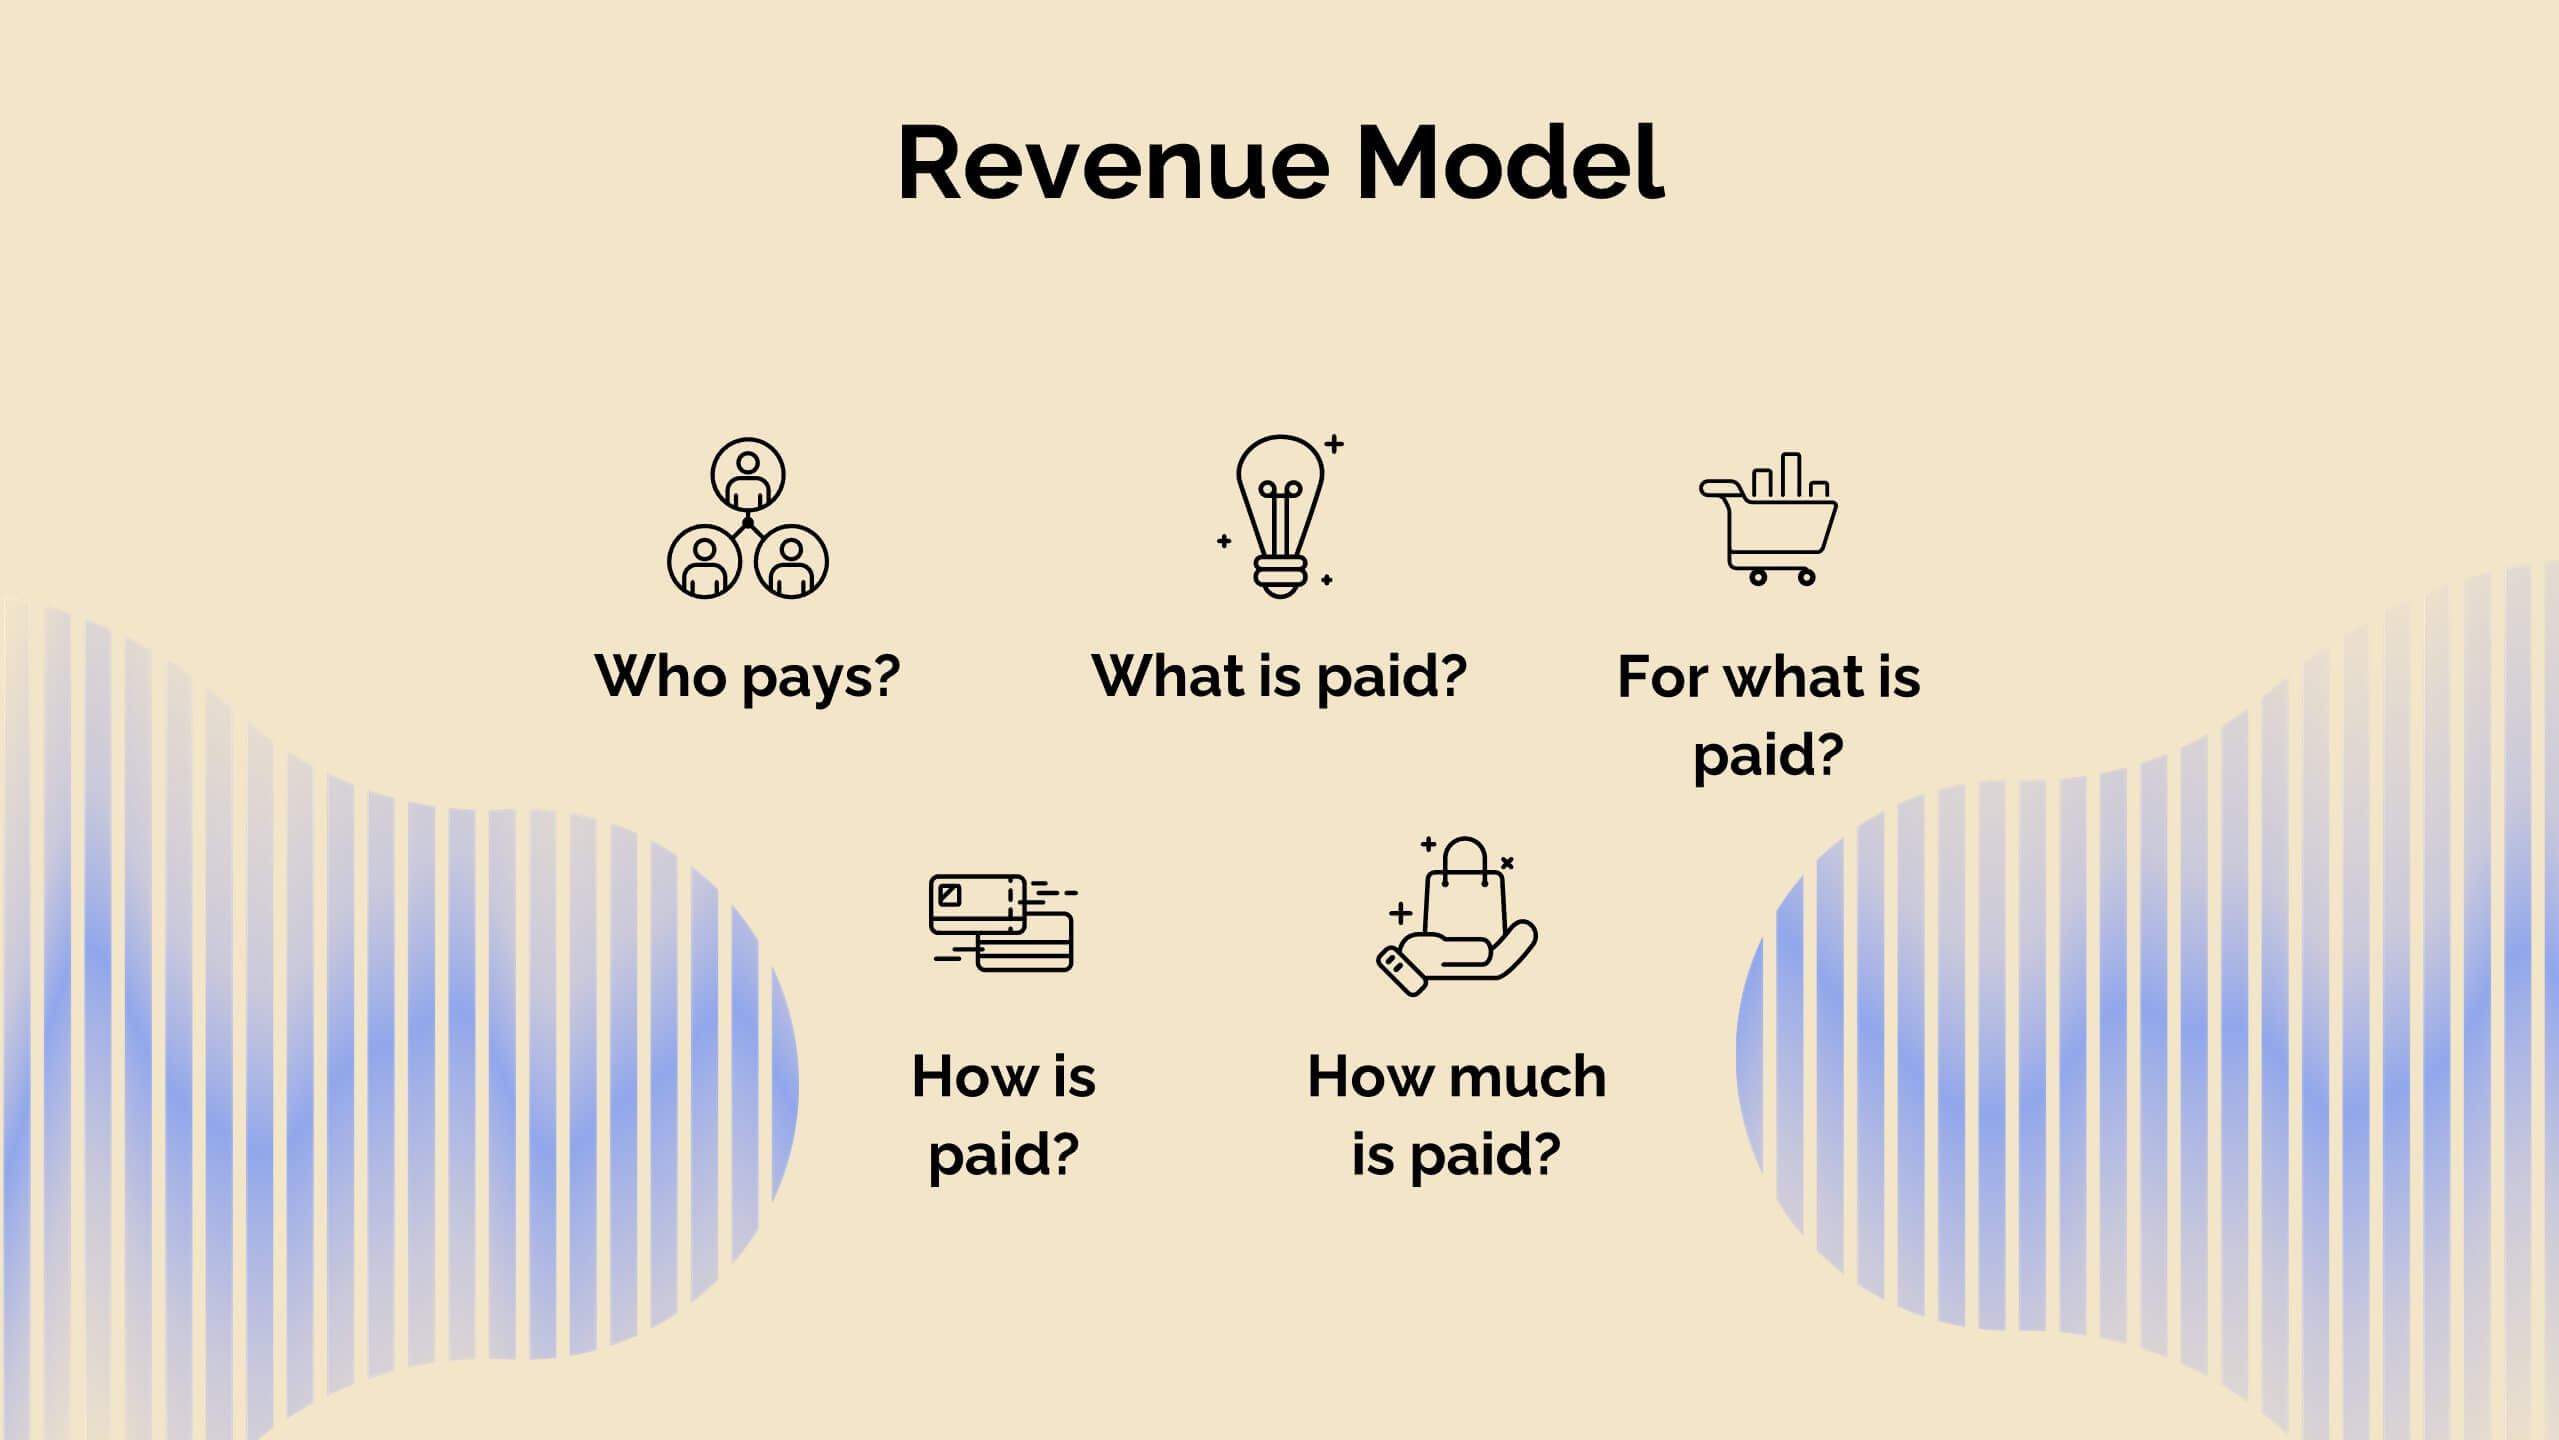
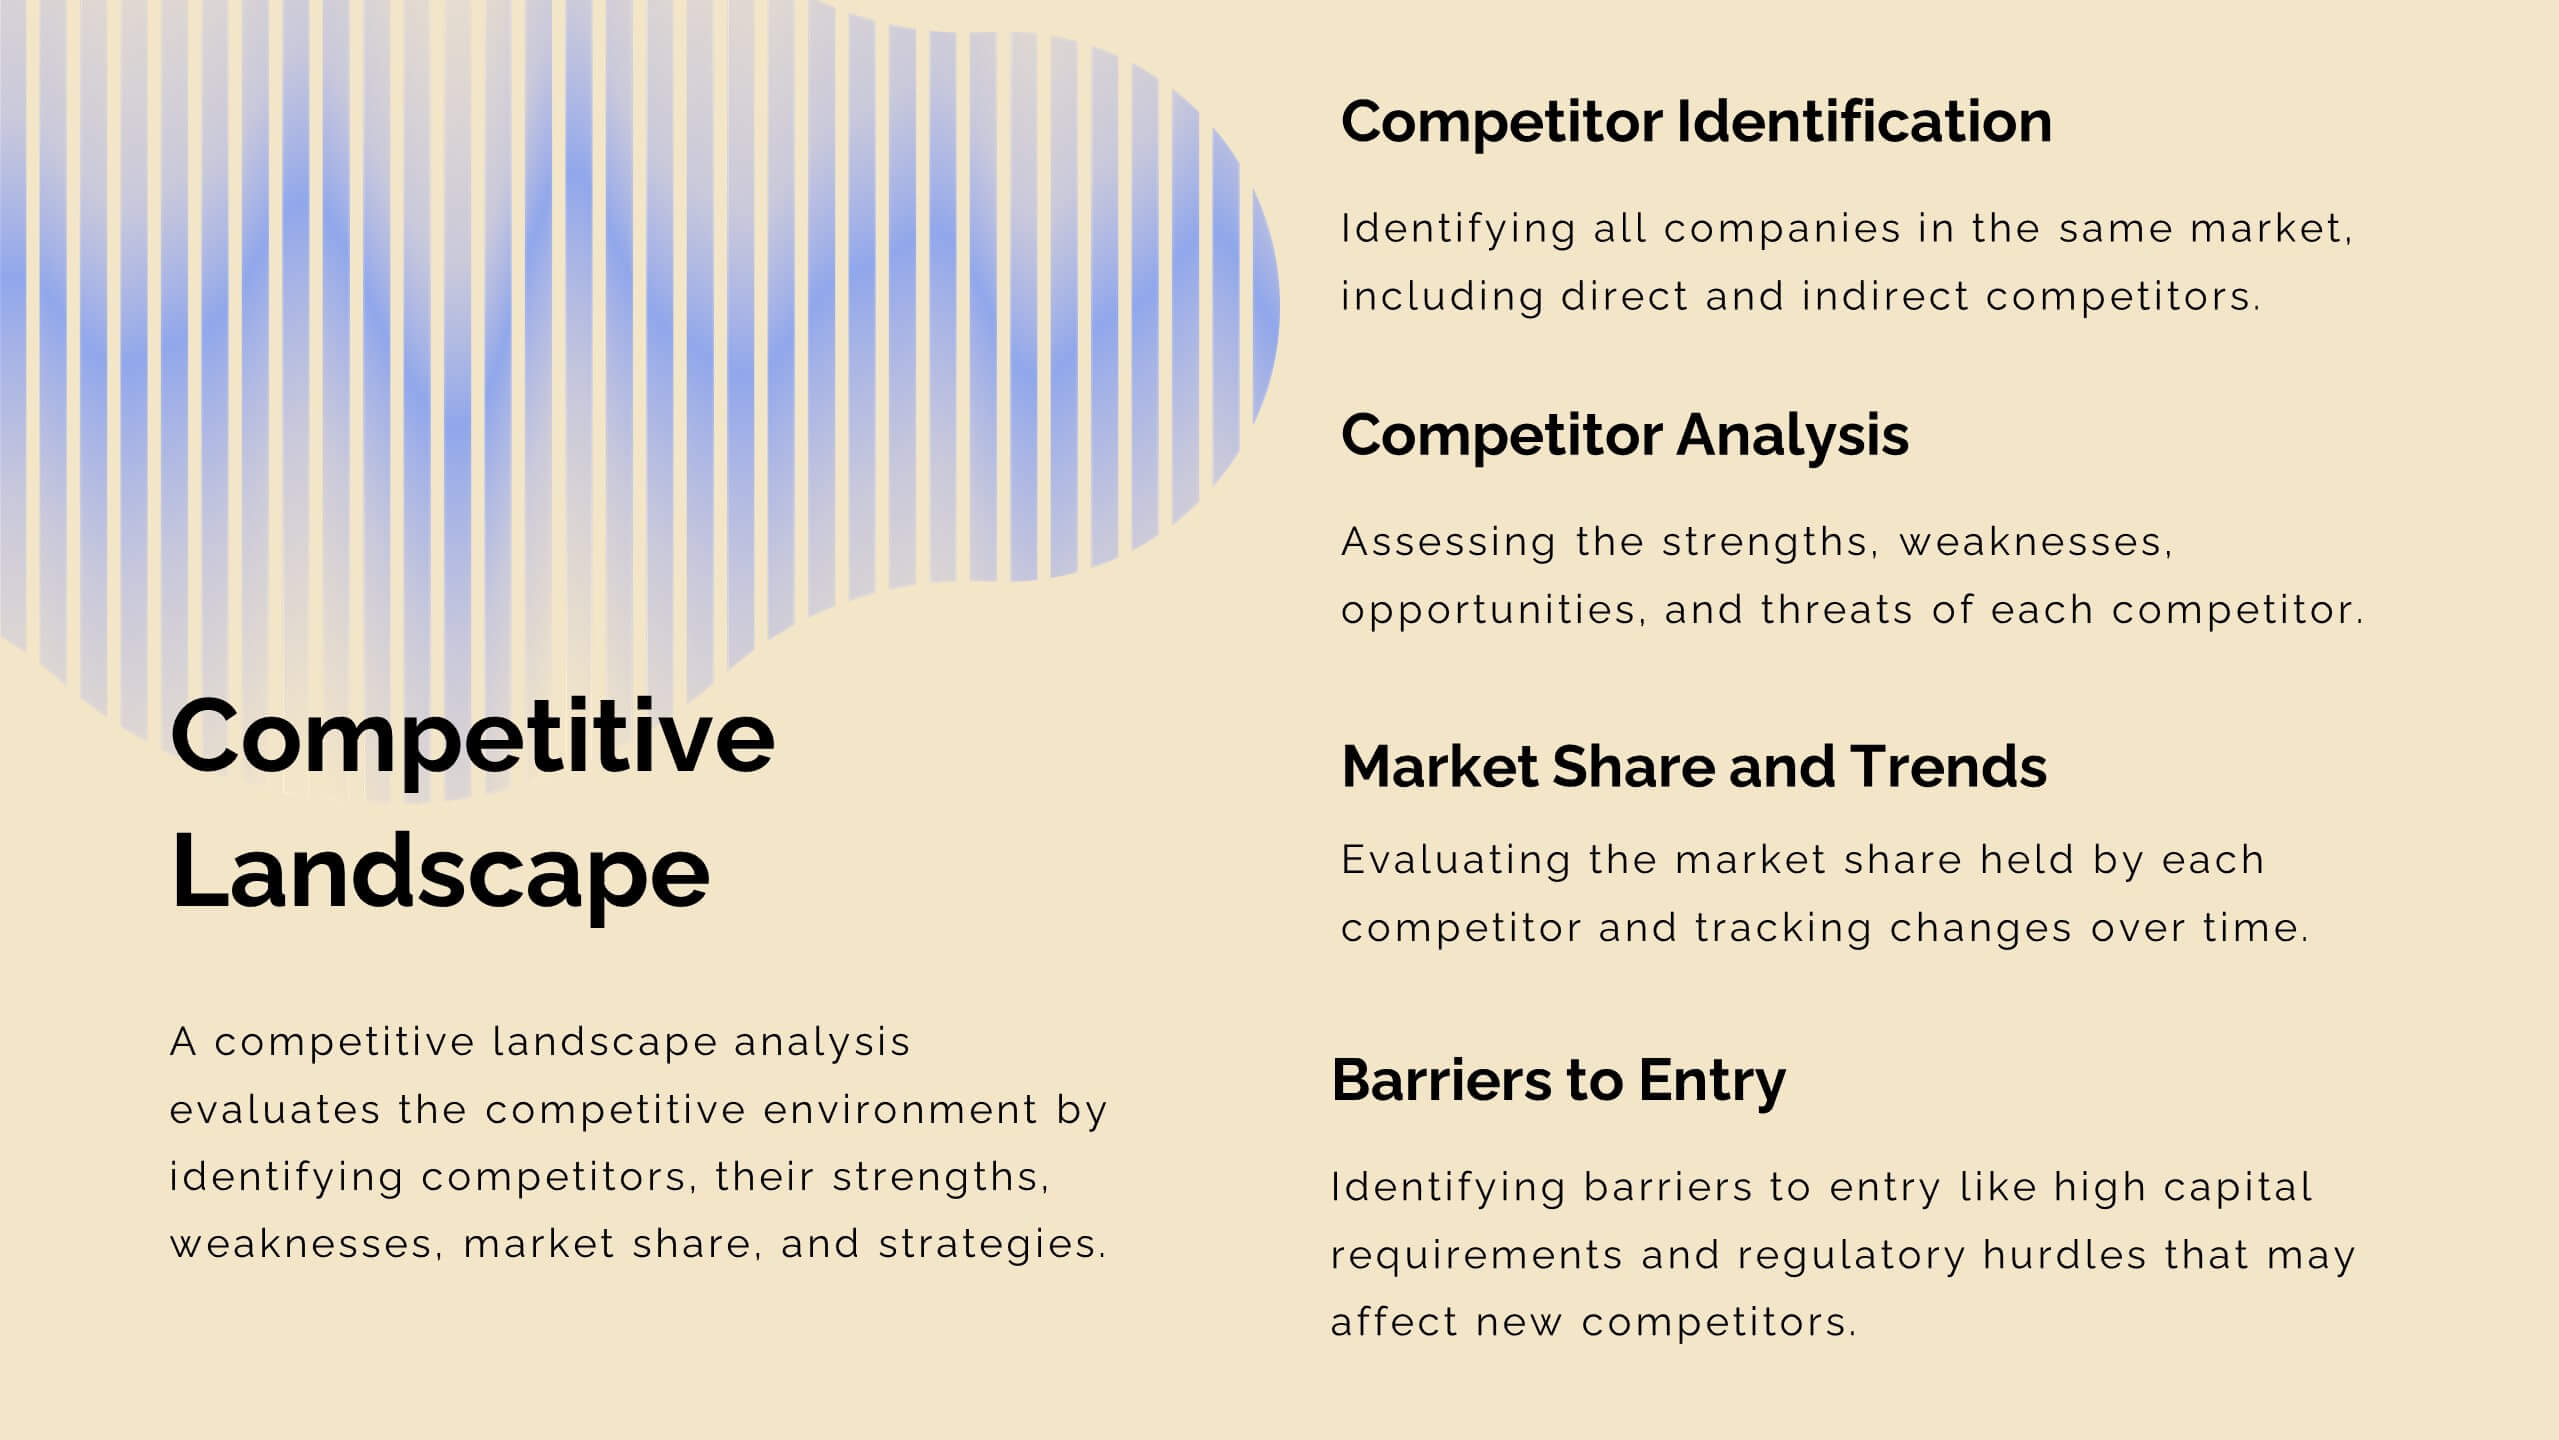
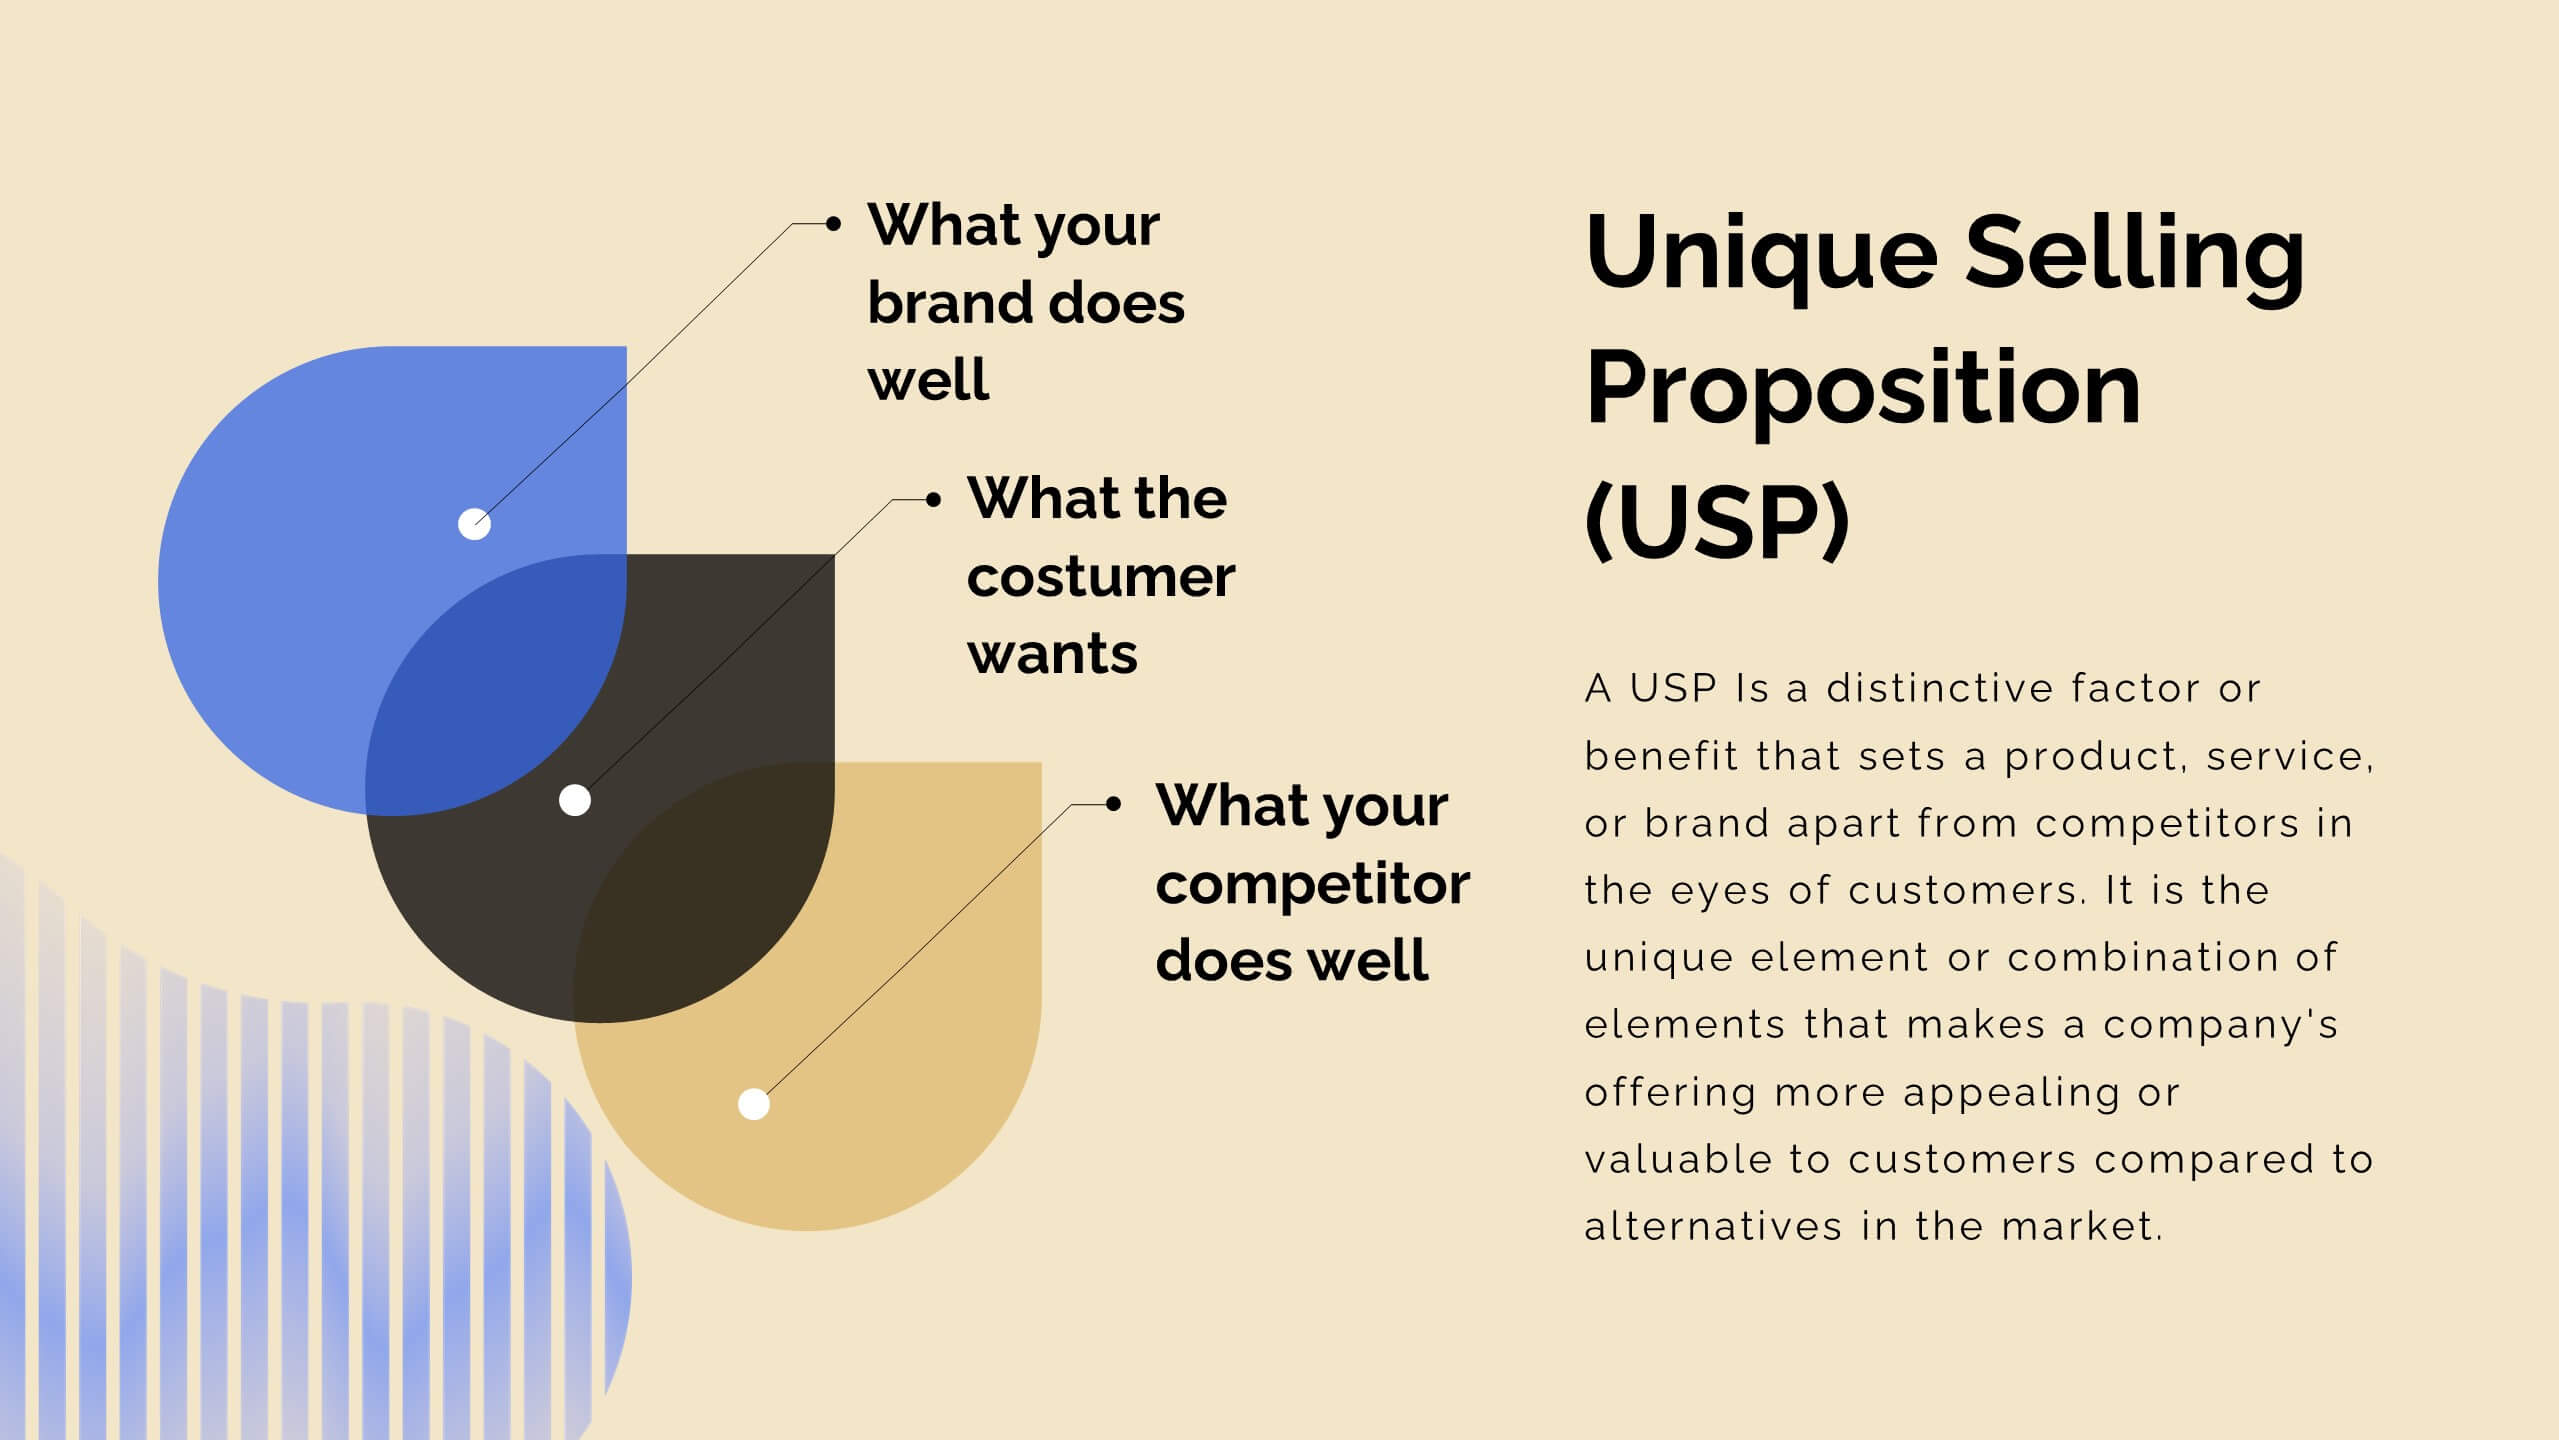
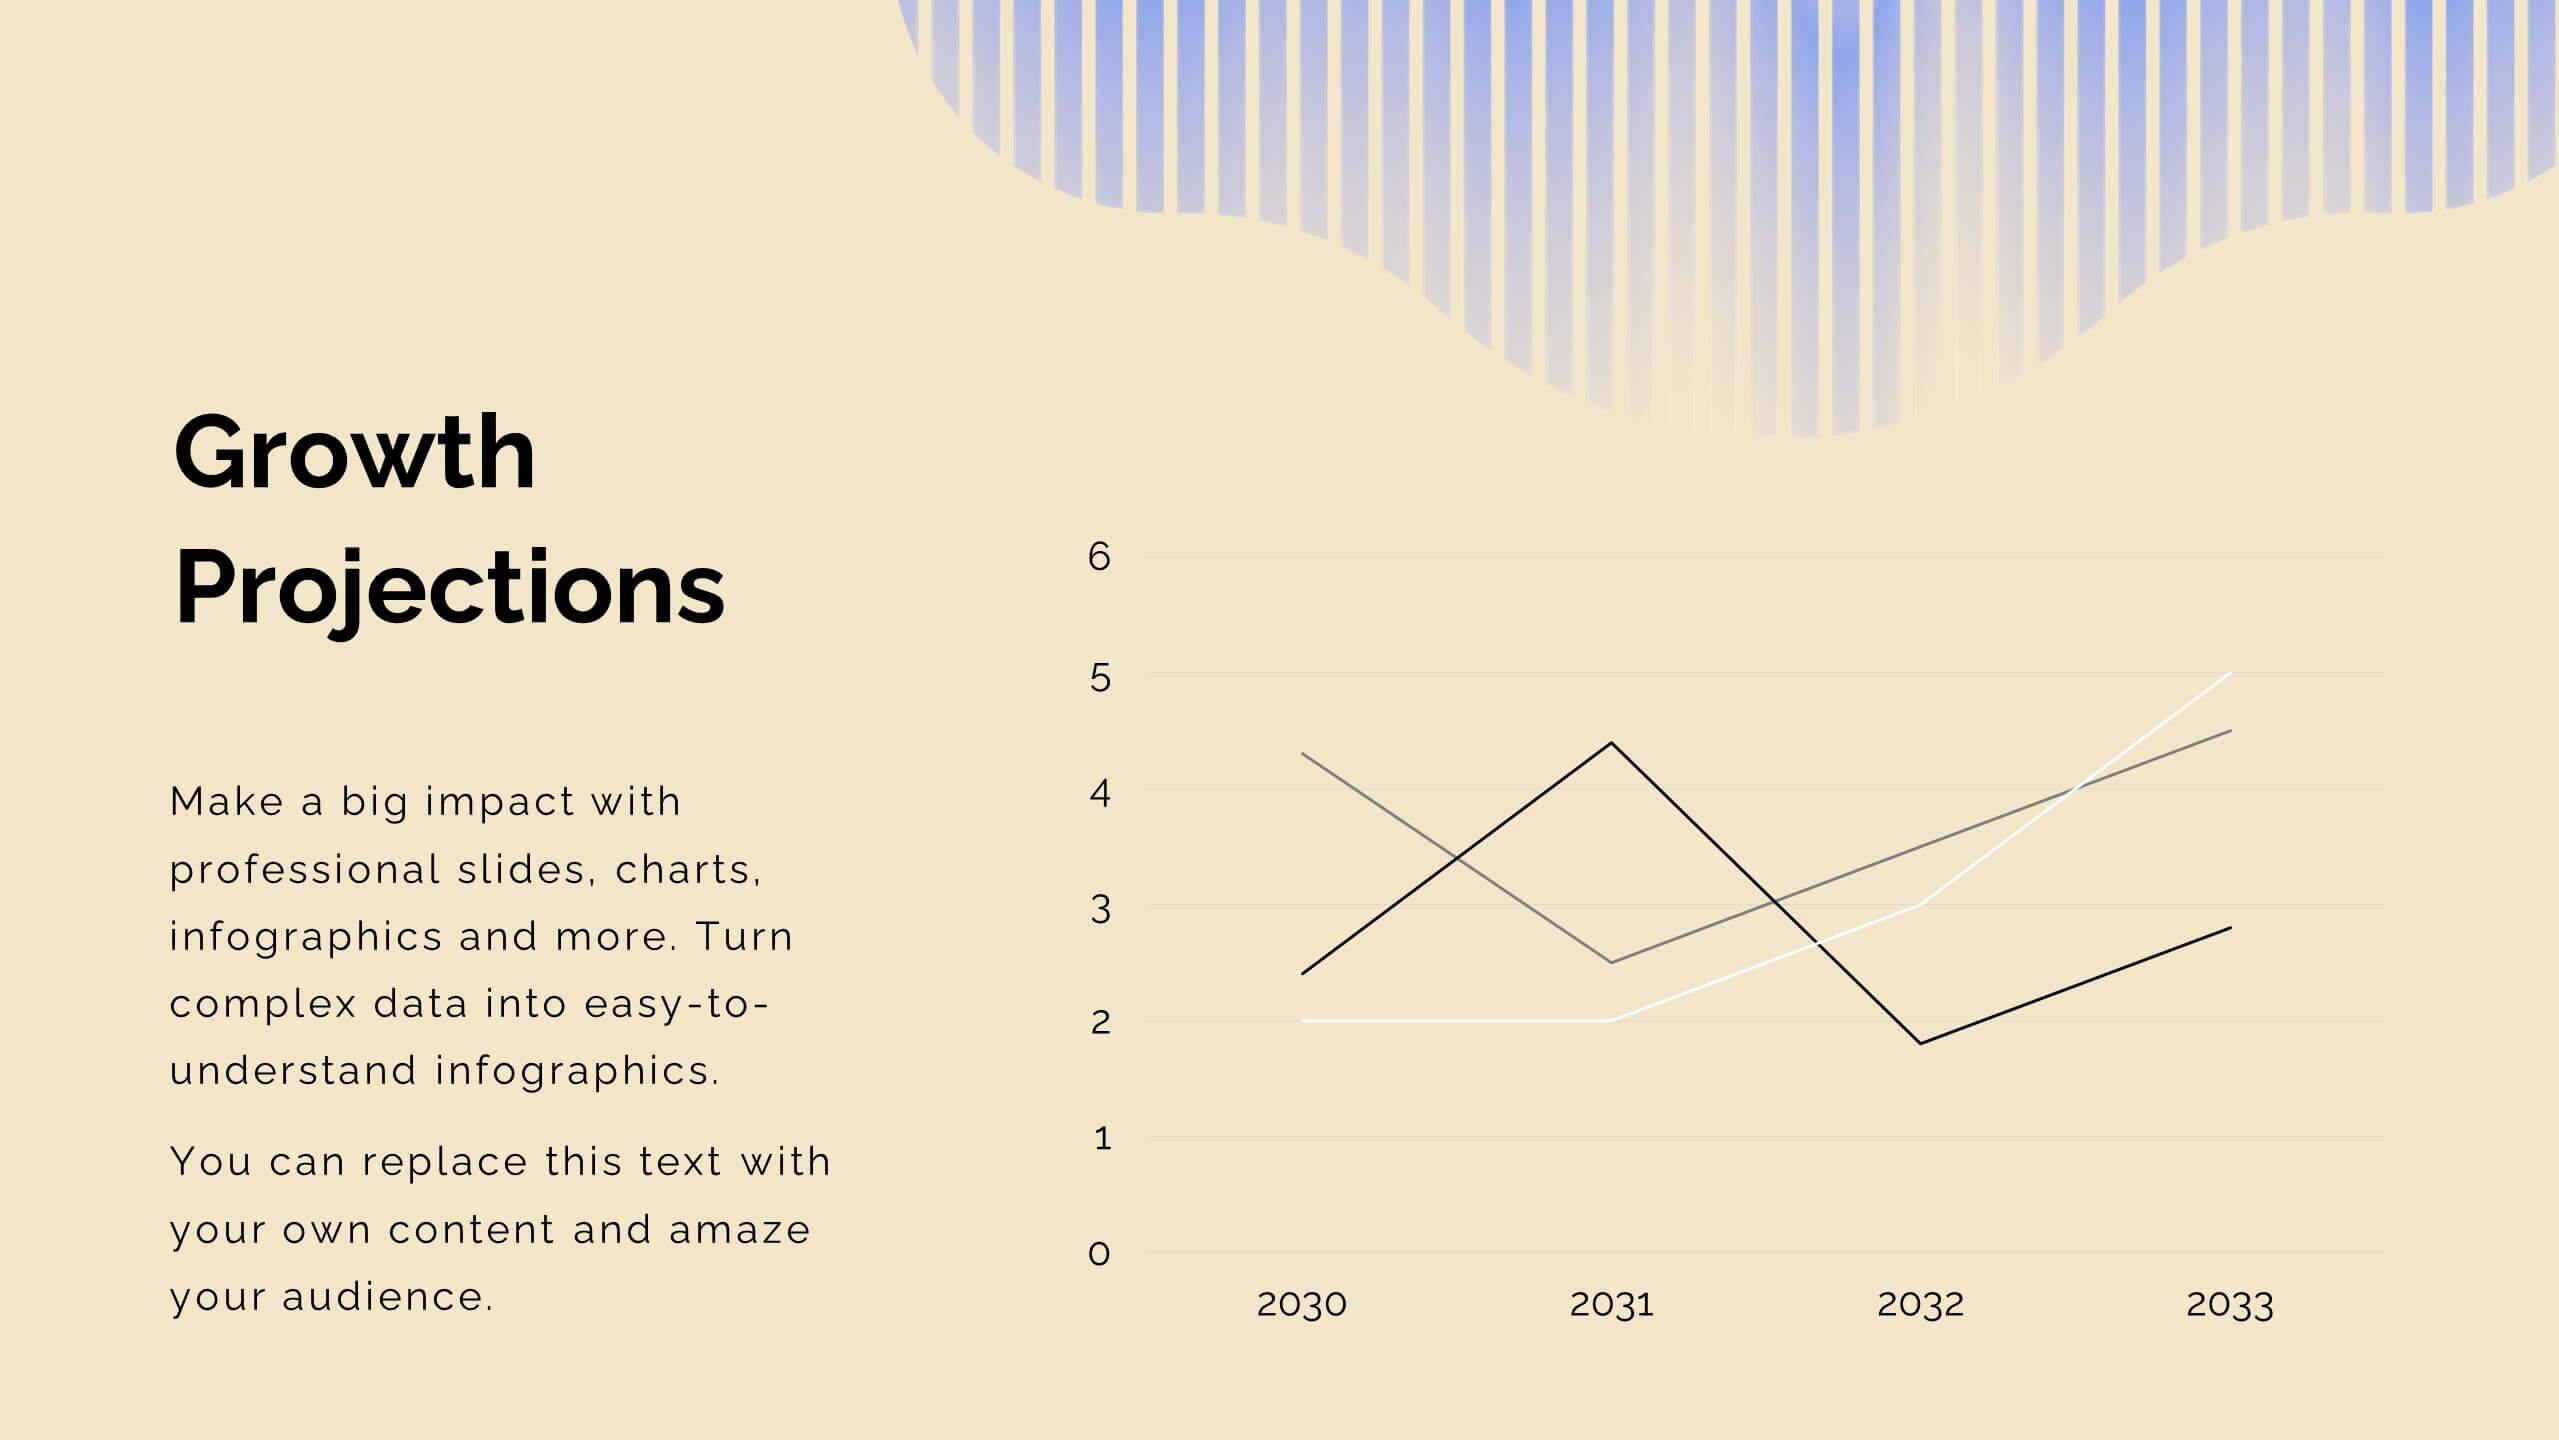
Journey Product Roadmap Presentation
Embark on a seamless journey through your product’s lifecycle with this comprehensive roadmap template! Perfect for illustrating key milestones, business models, and market opportunities, it’s your go-to for clear and engaging presentations. Dive into competitive analysis, showcase your unique selling proposition, and outline your growth projections with style. Compatible with PowerPoint, Keynote, and Google Slides.


6 slides
Alphabet Learning Presentation
Make learning fun and engaging with this alphabet learning presentation template! Designed with vibrant visuals and a structured layout, this template helps educators, parents, and trainers introduce letters effectively. Perfect for early childhood education, homeschooling, and interactive lessons. Fully customizable and compatible with PowerPoint, Keynote, and Google Slides.

21 slides
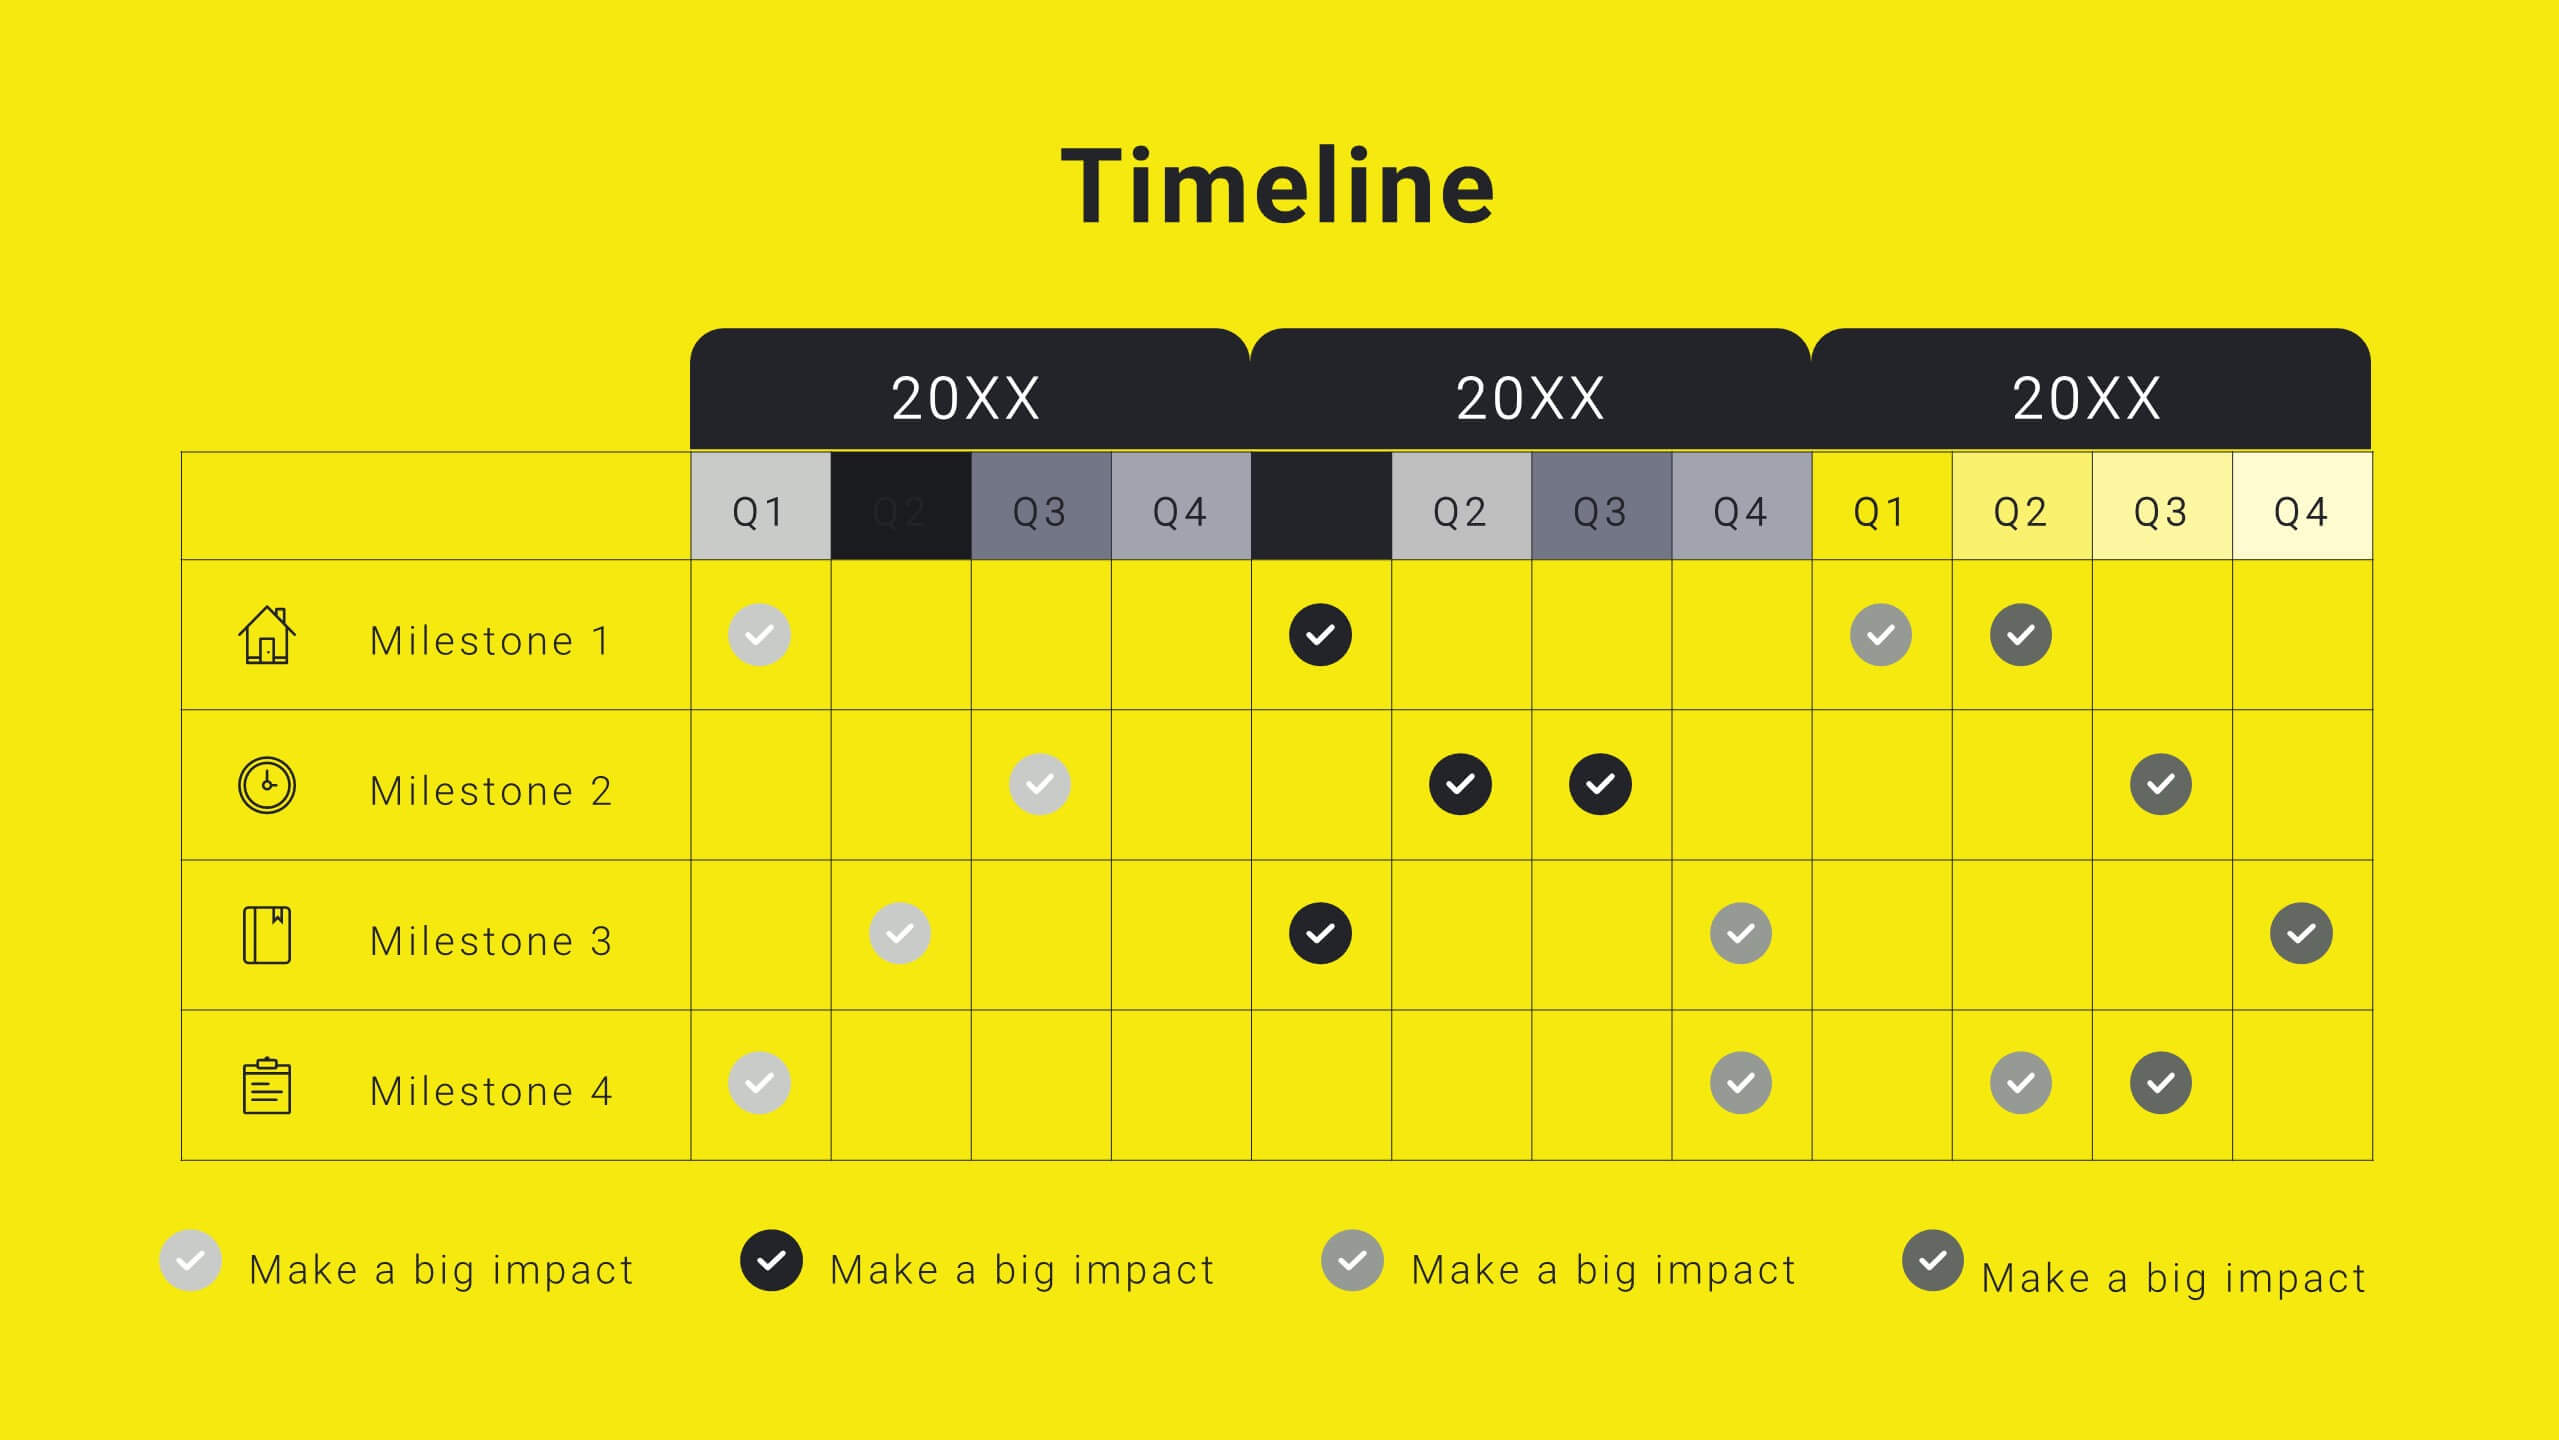
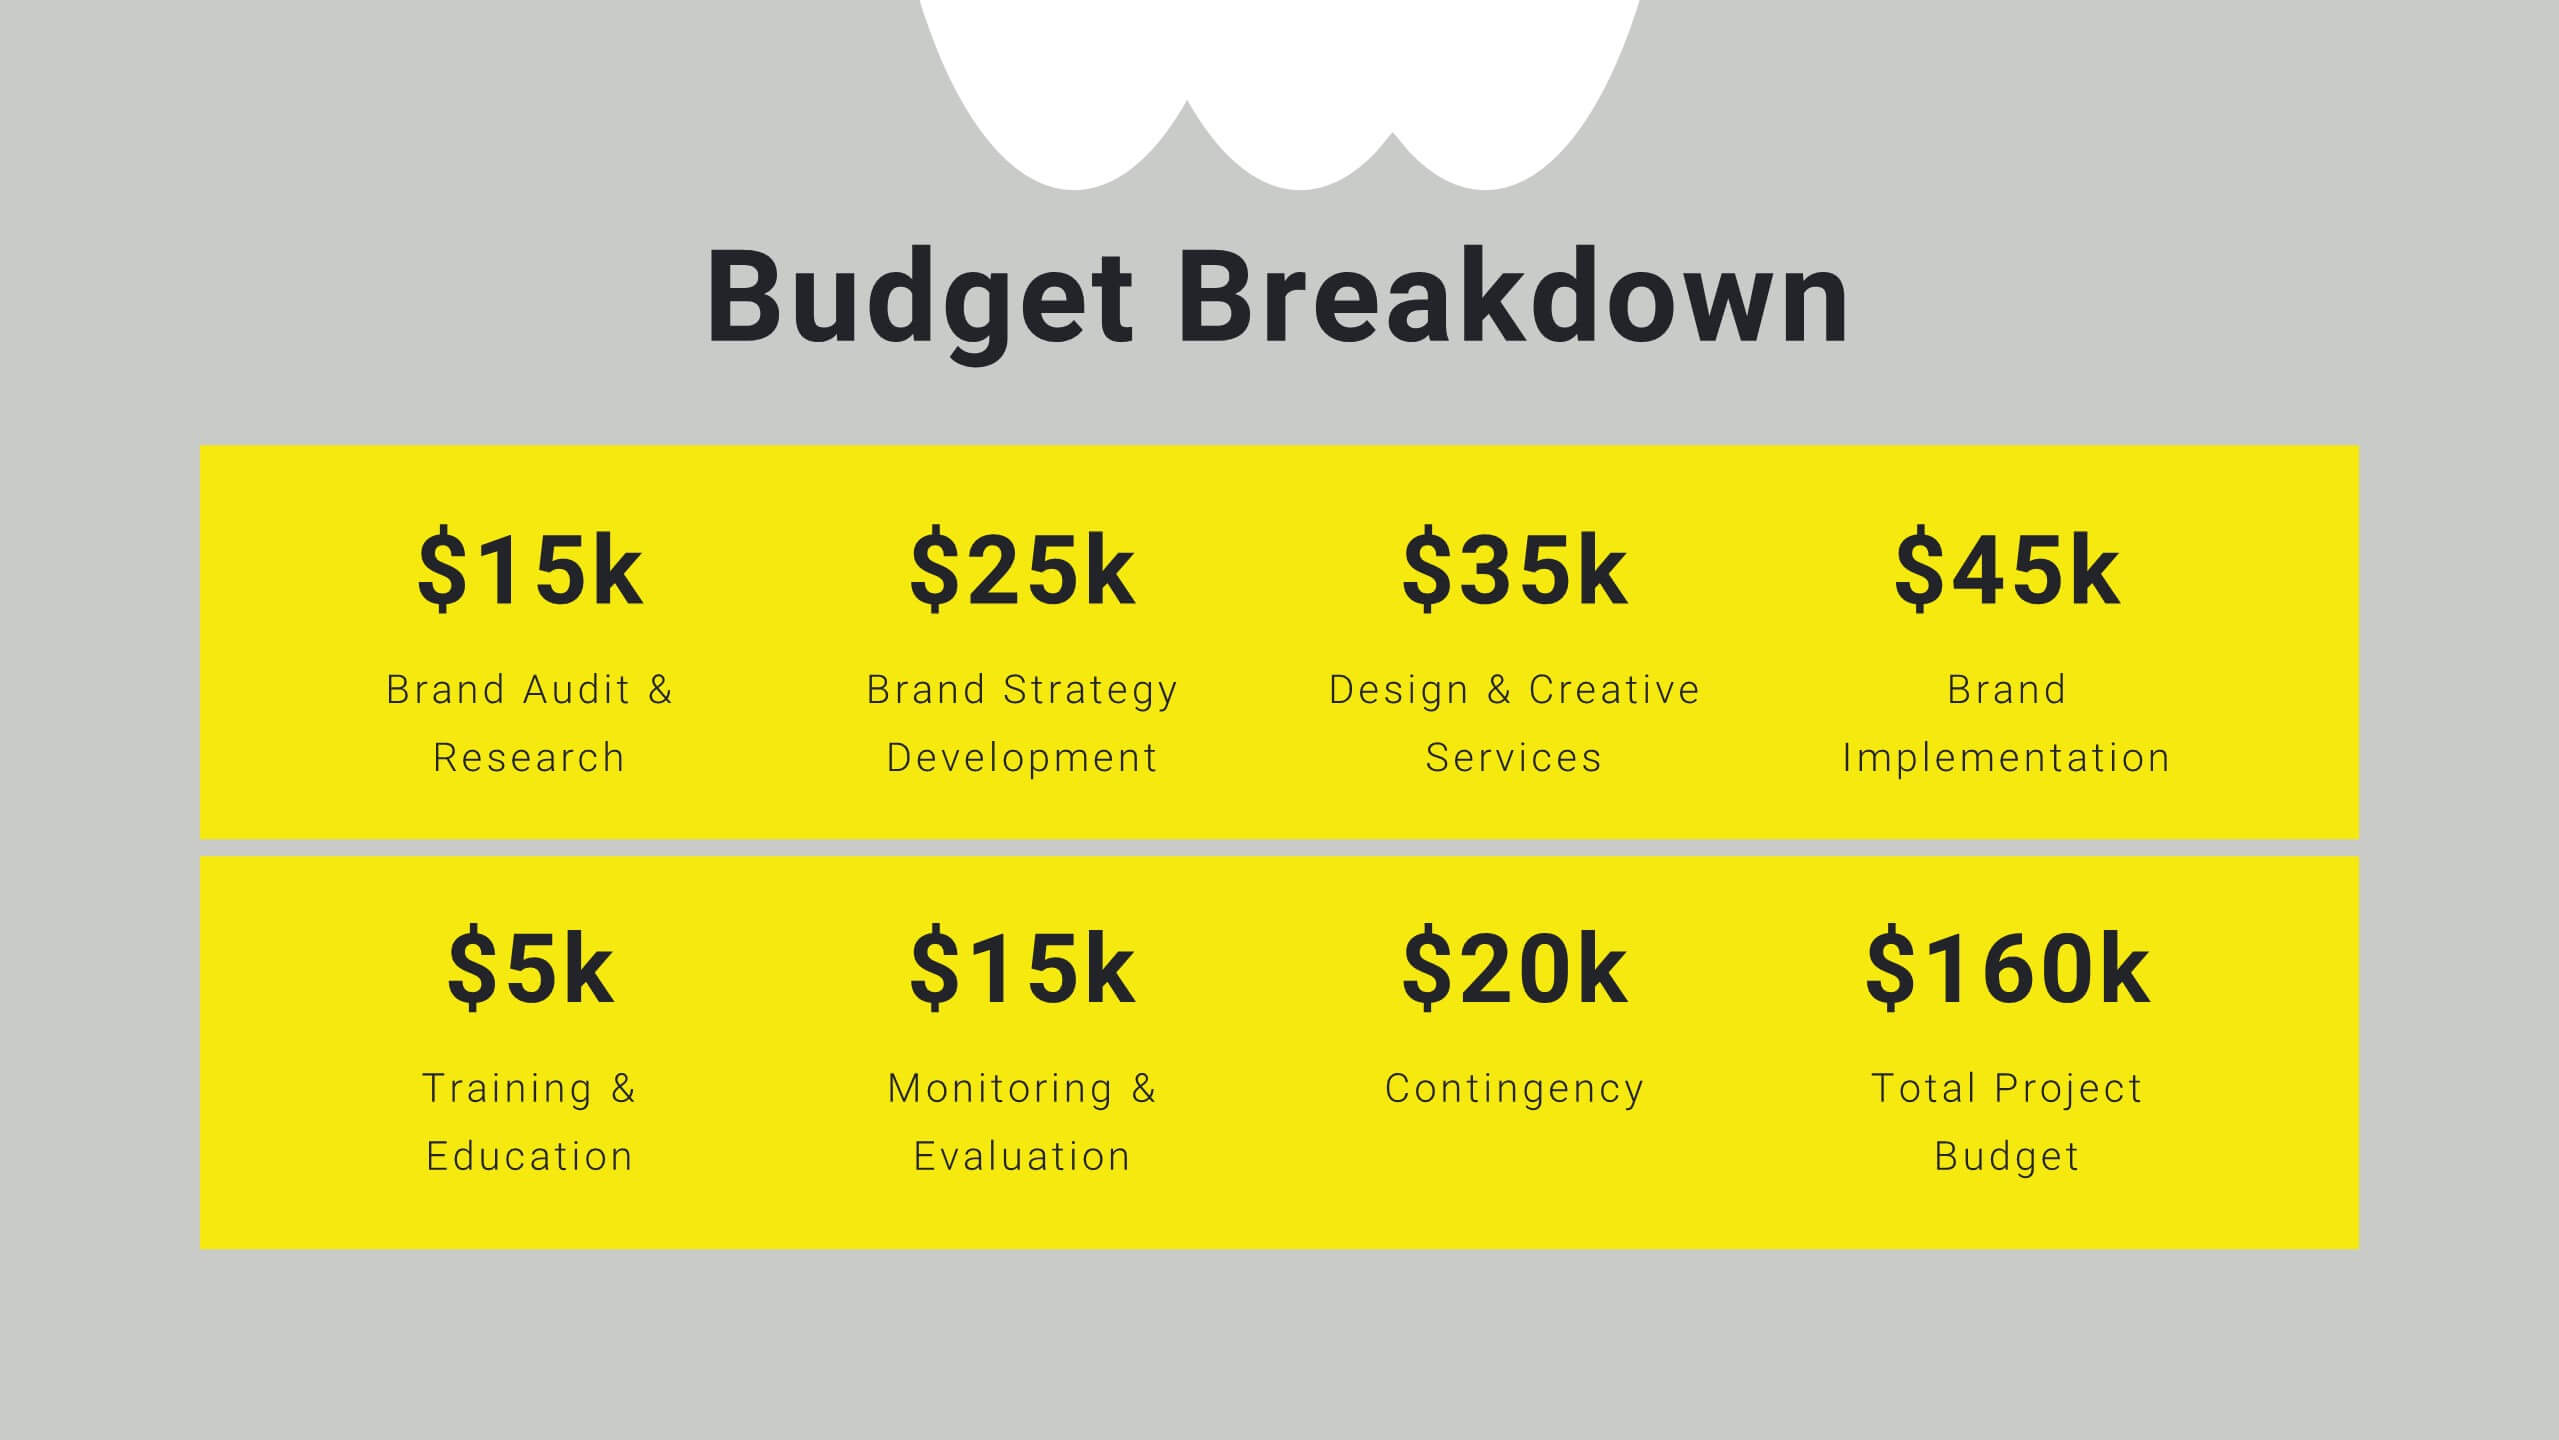
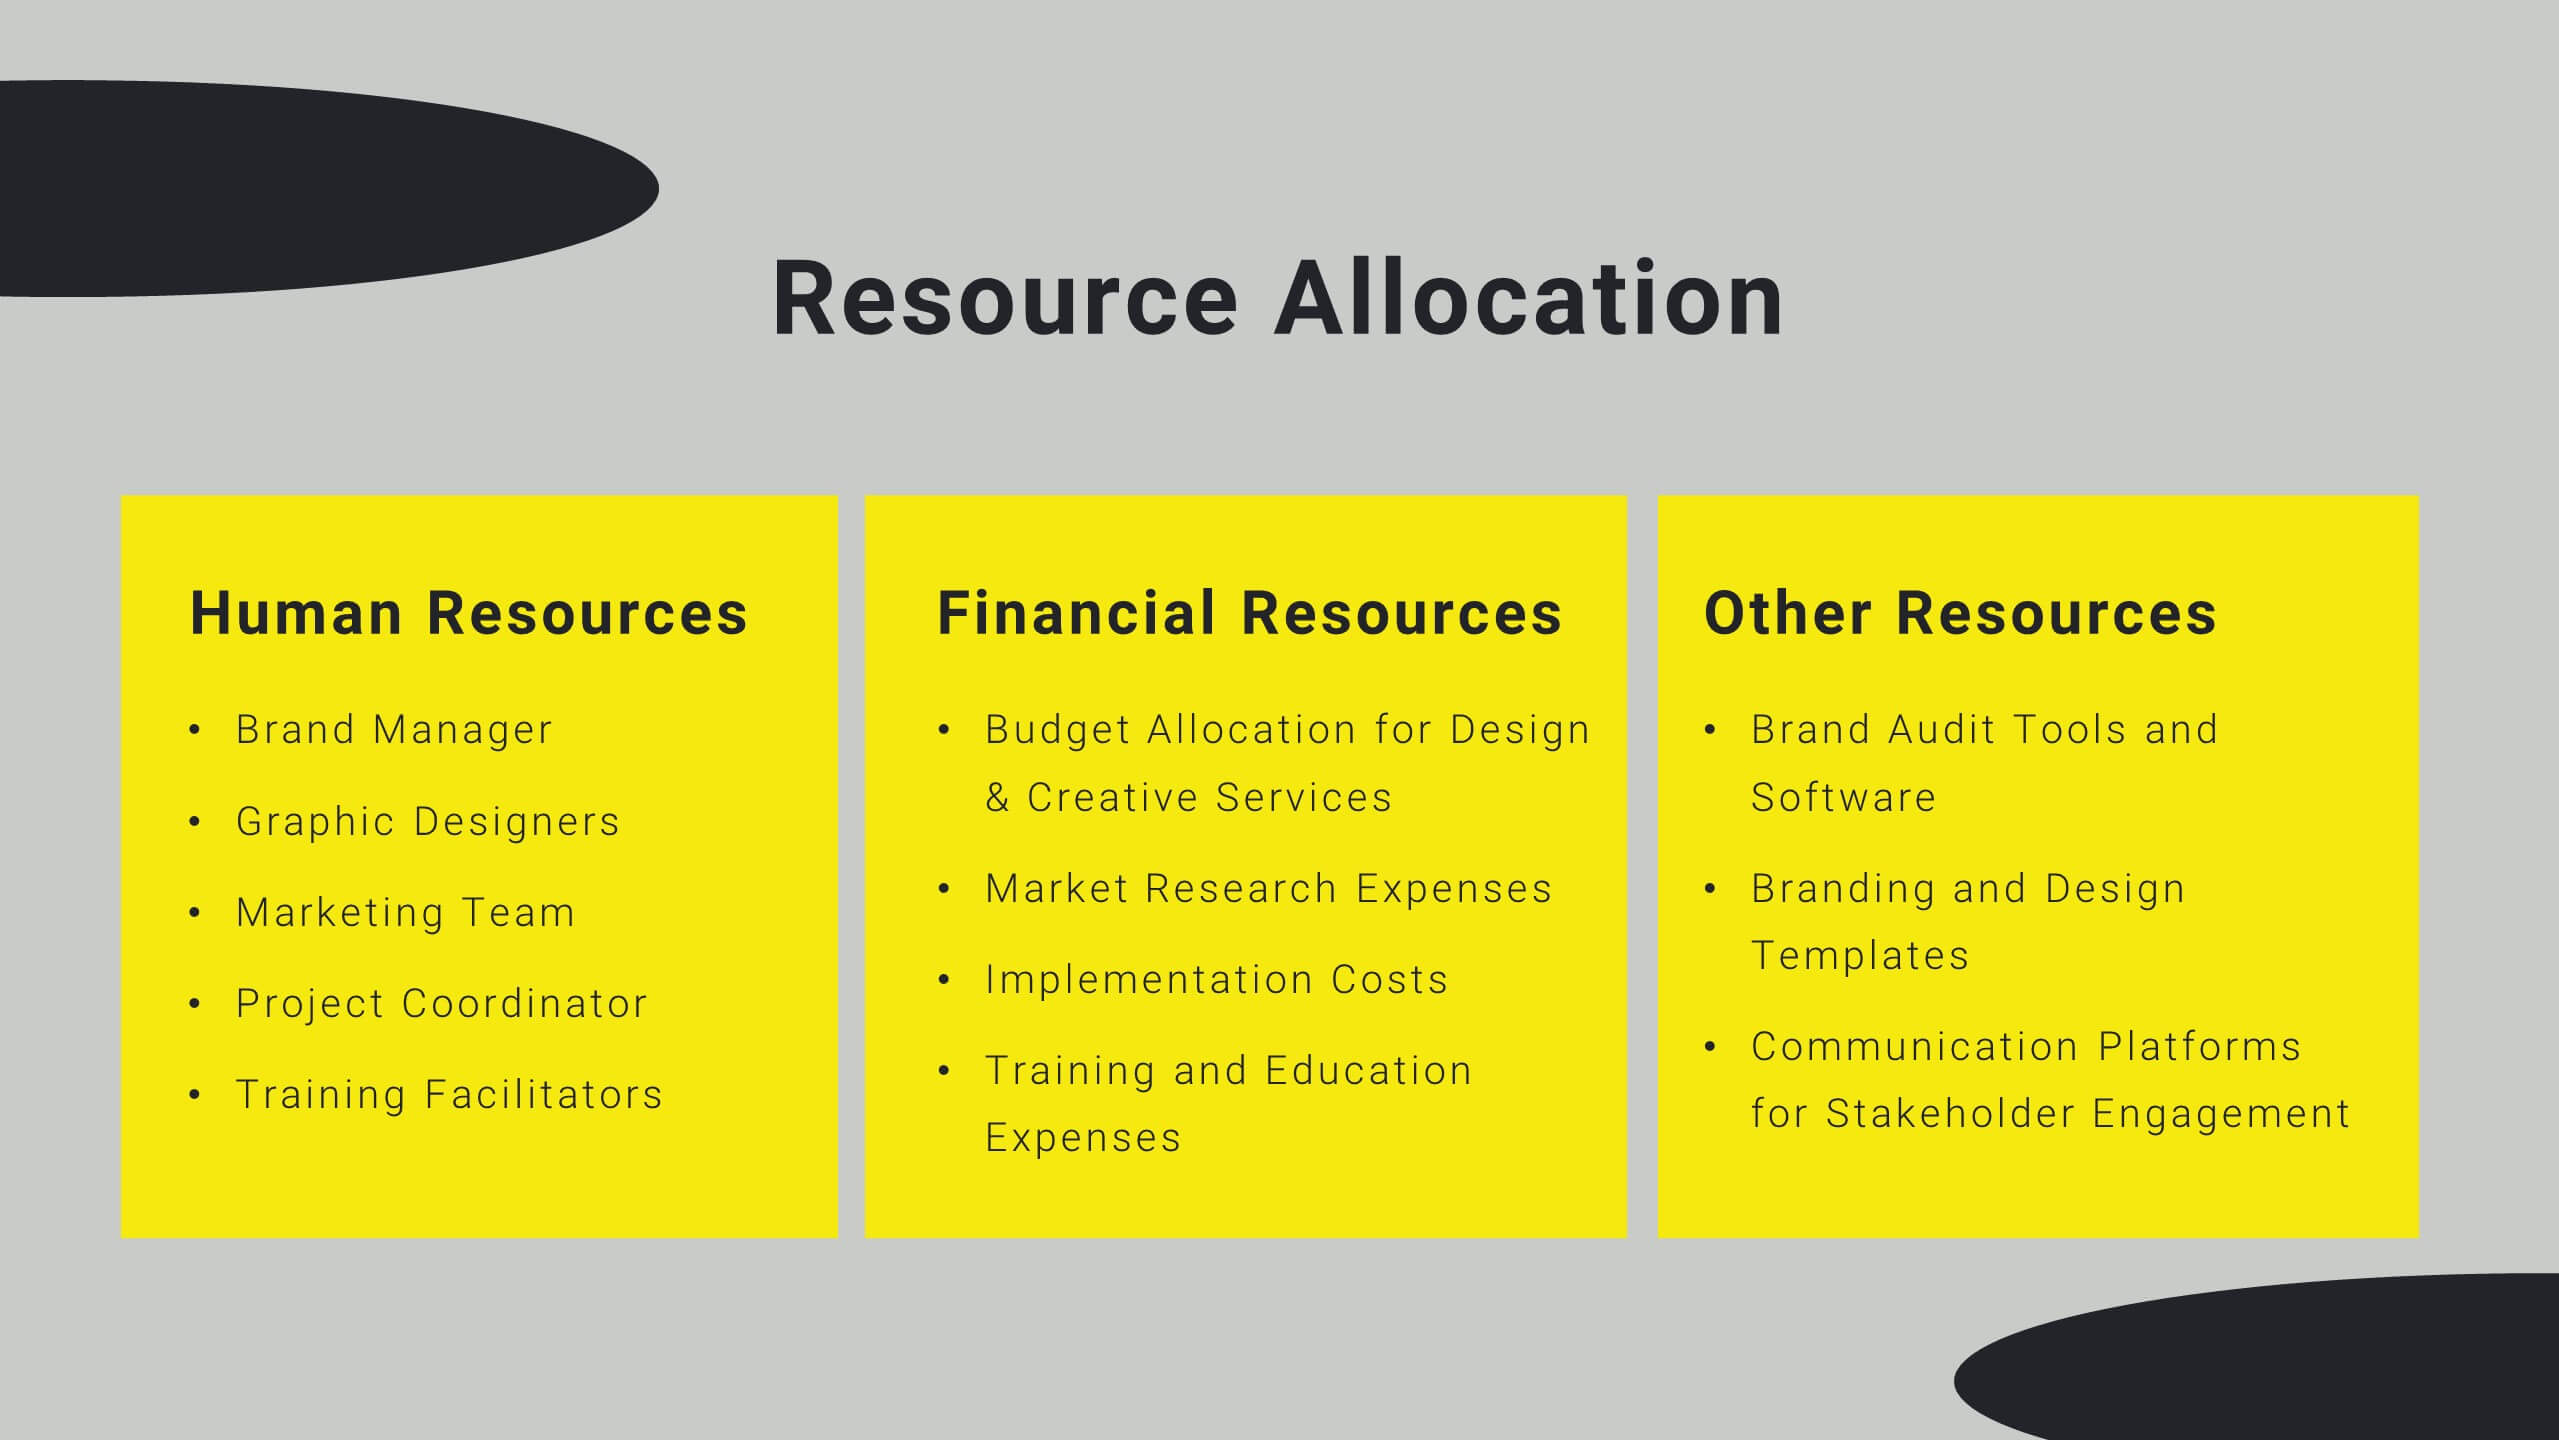
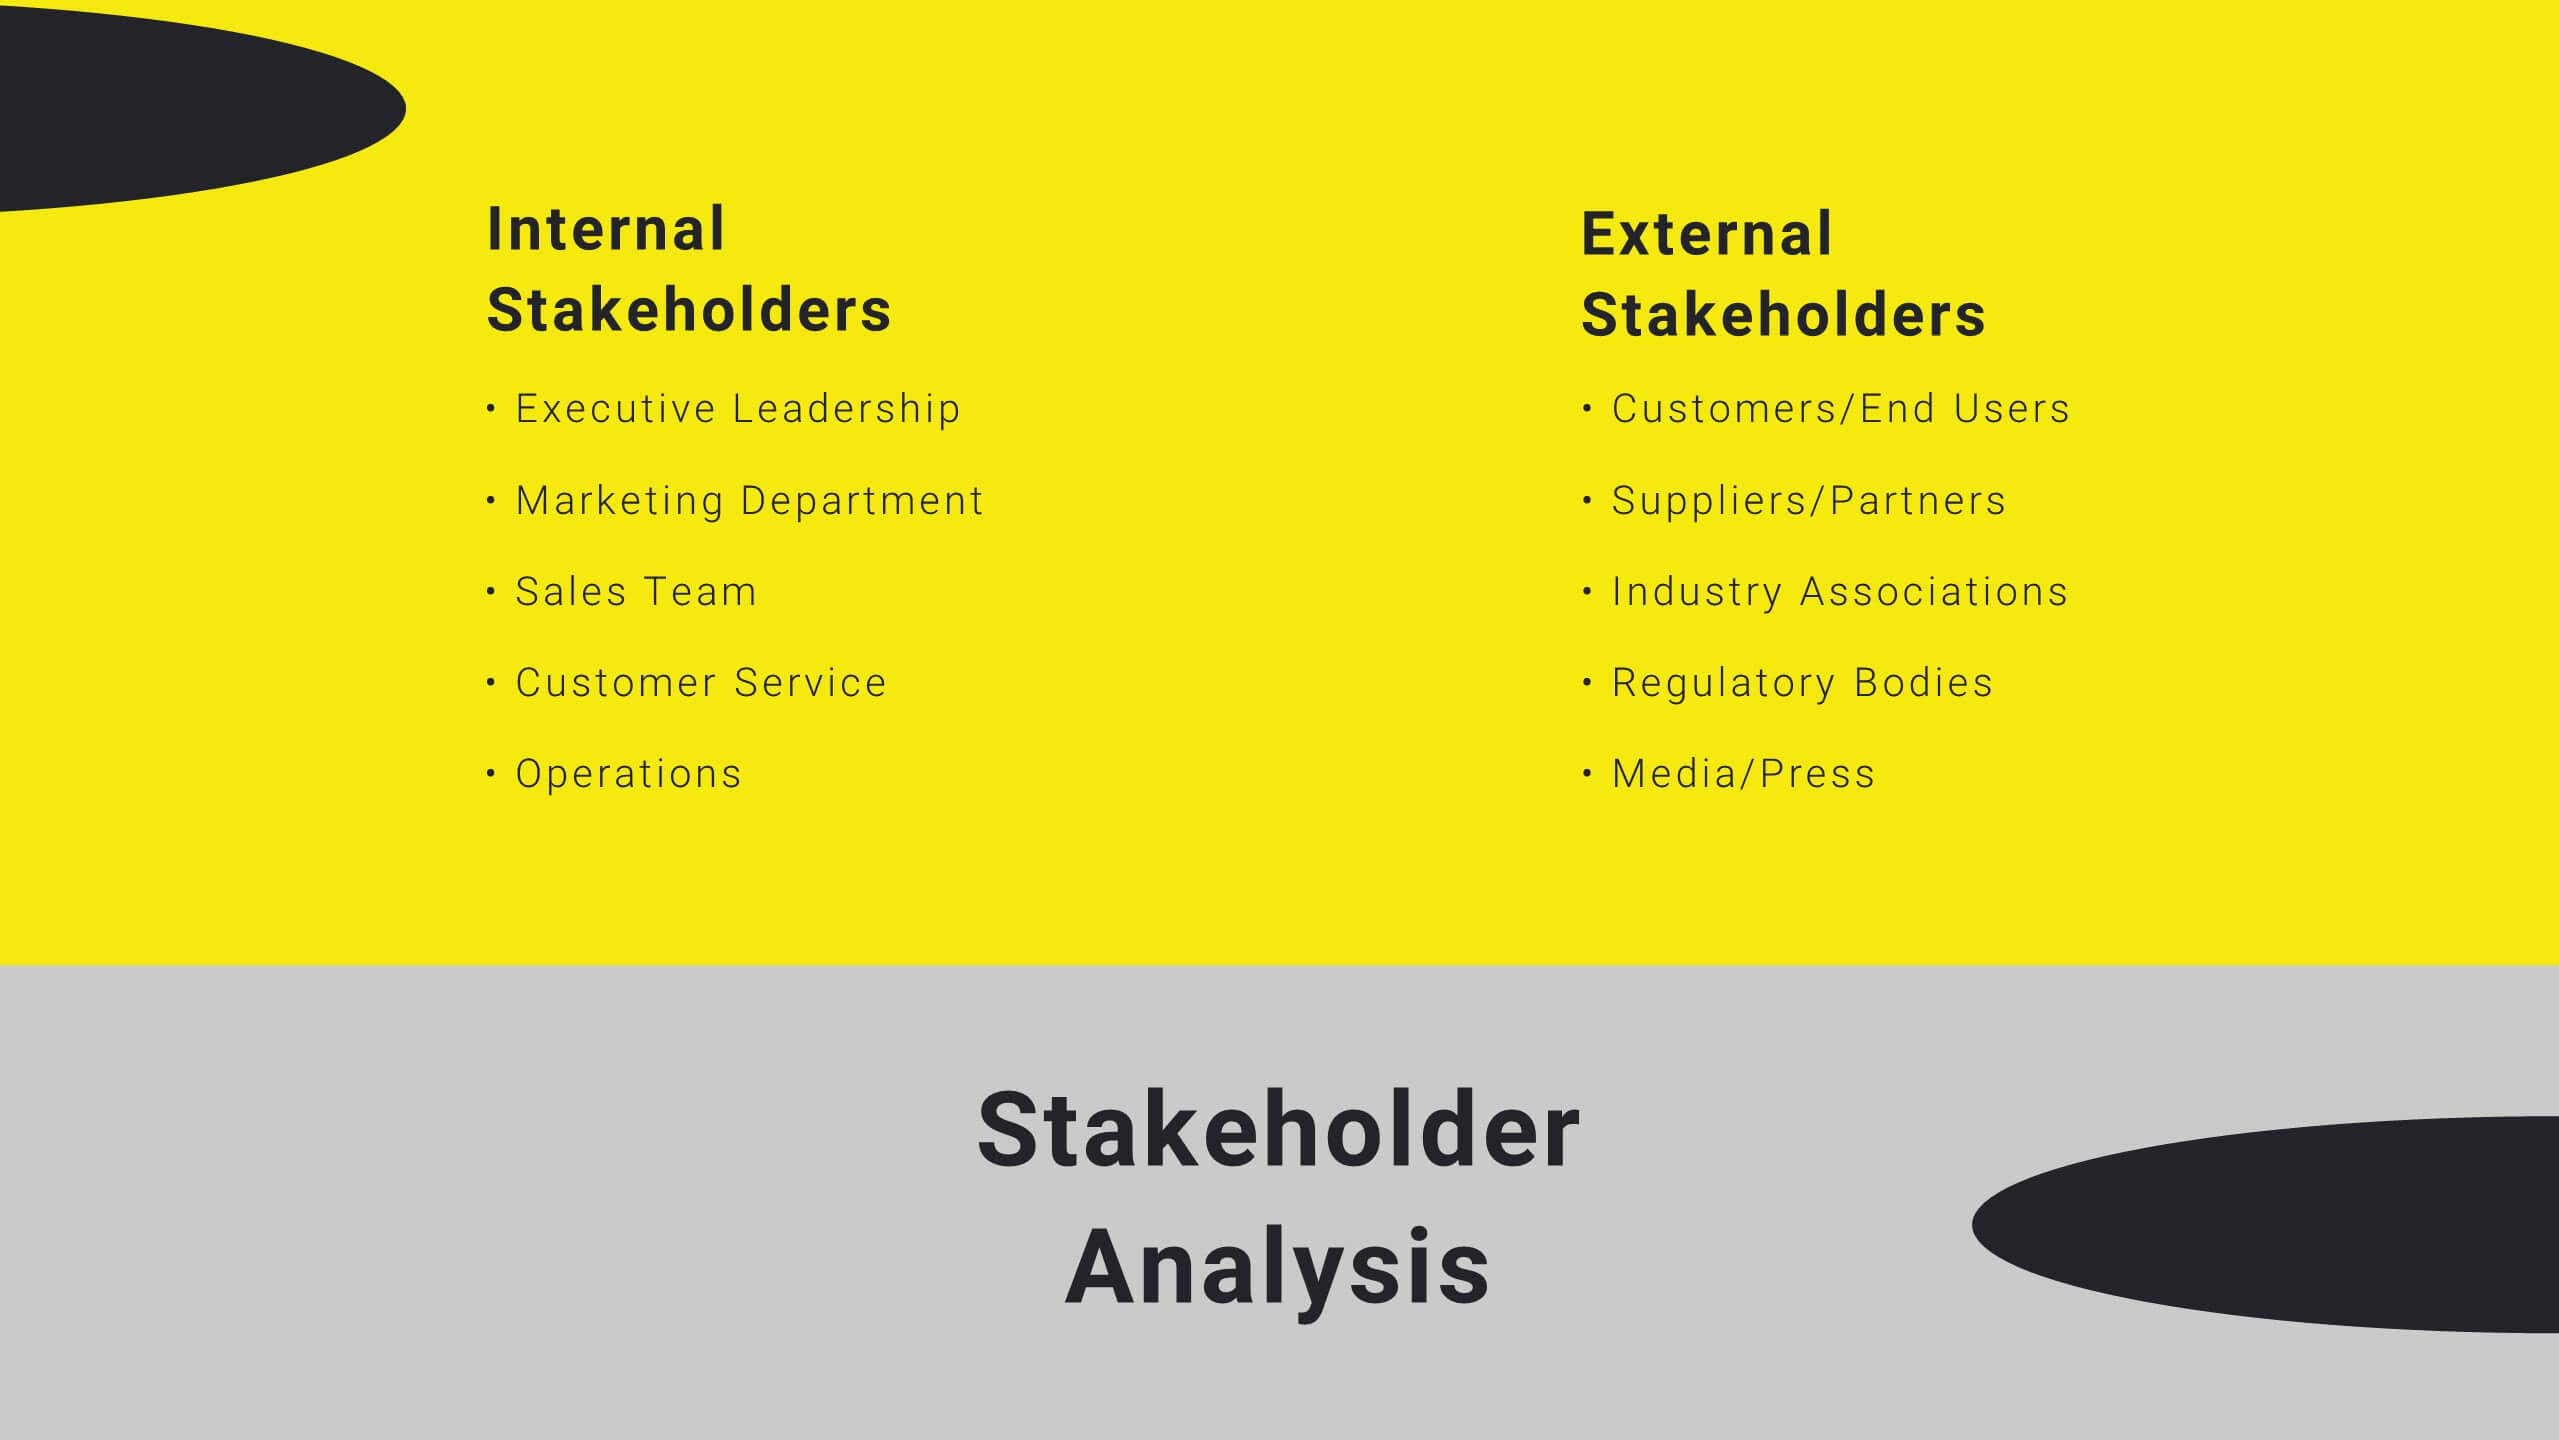
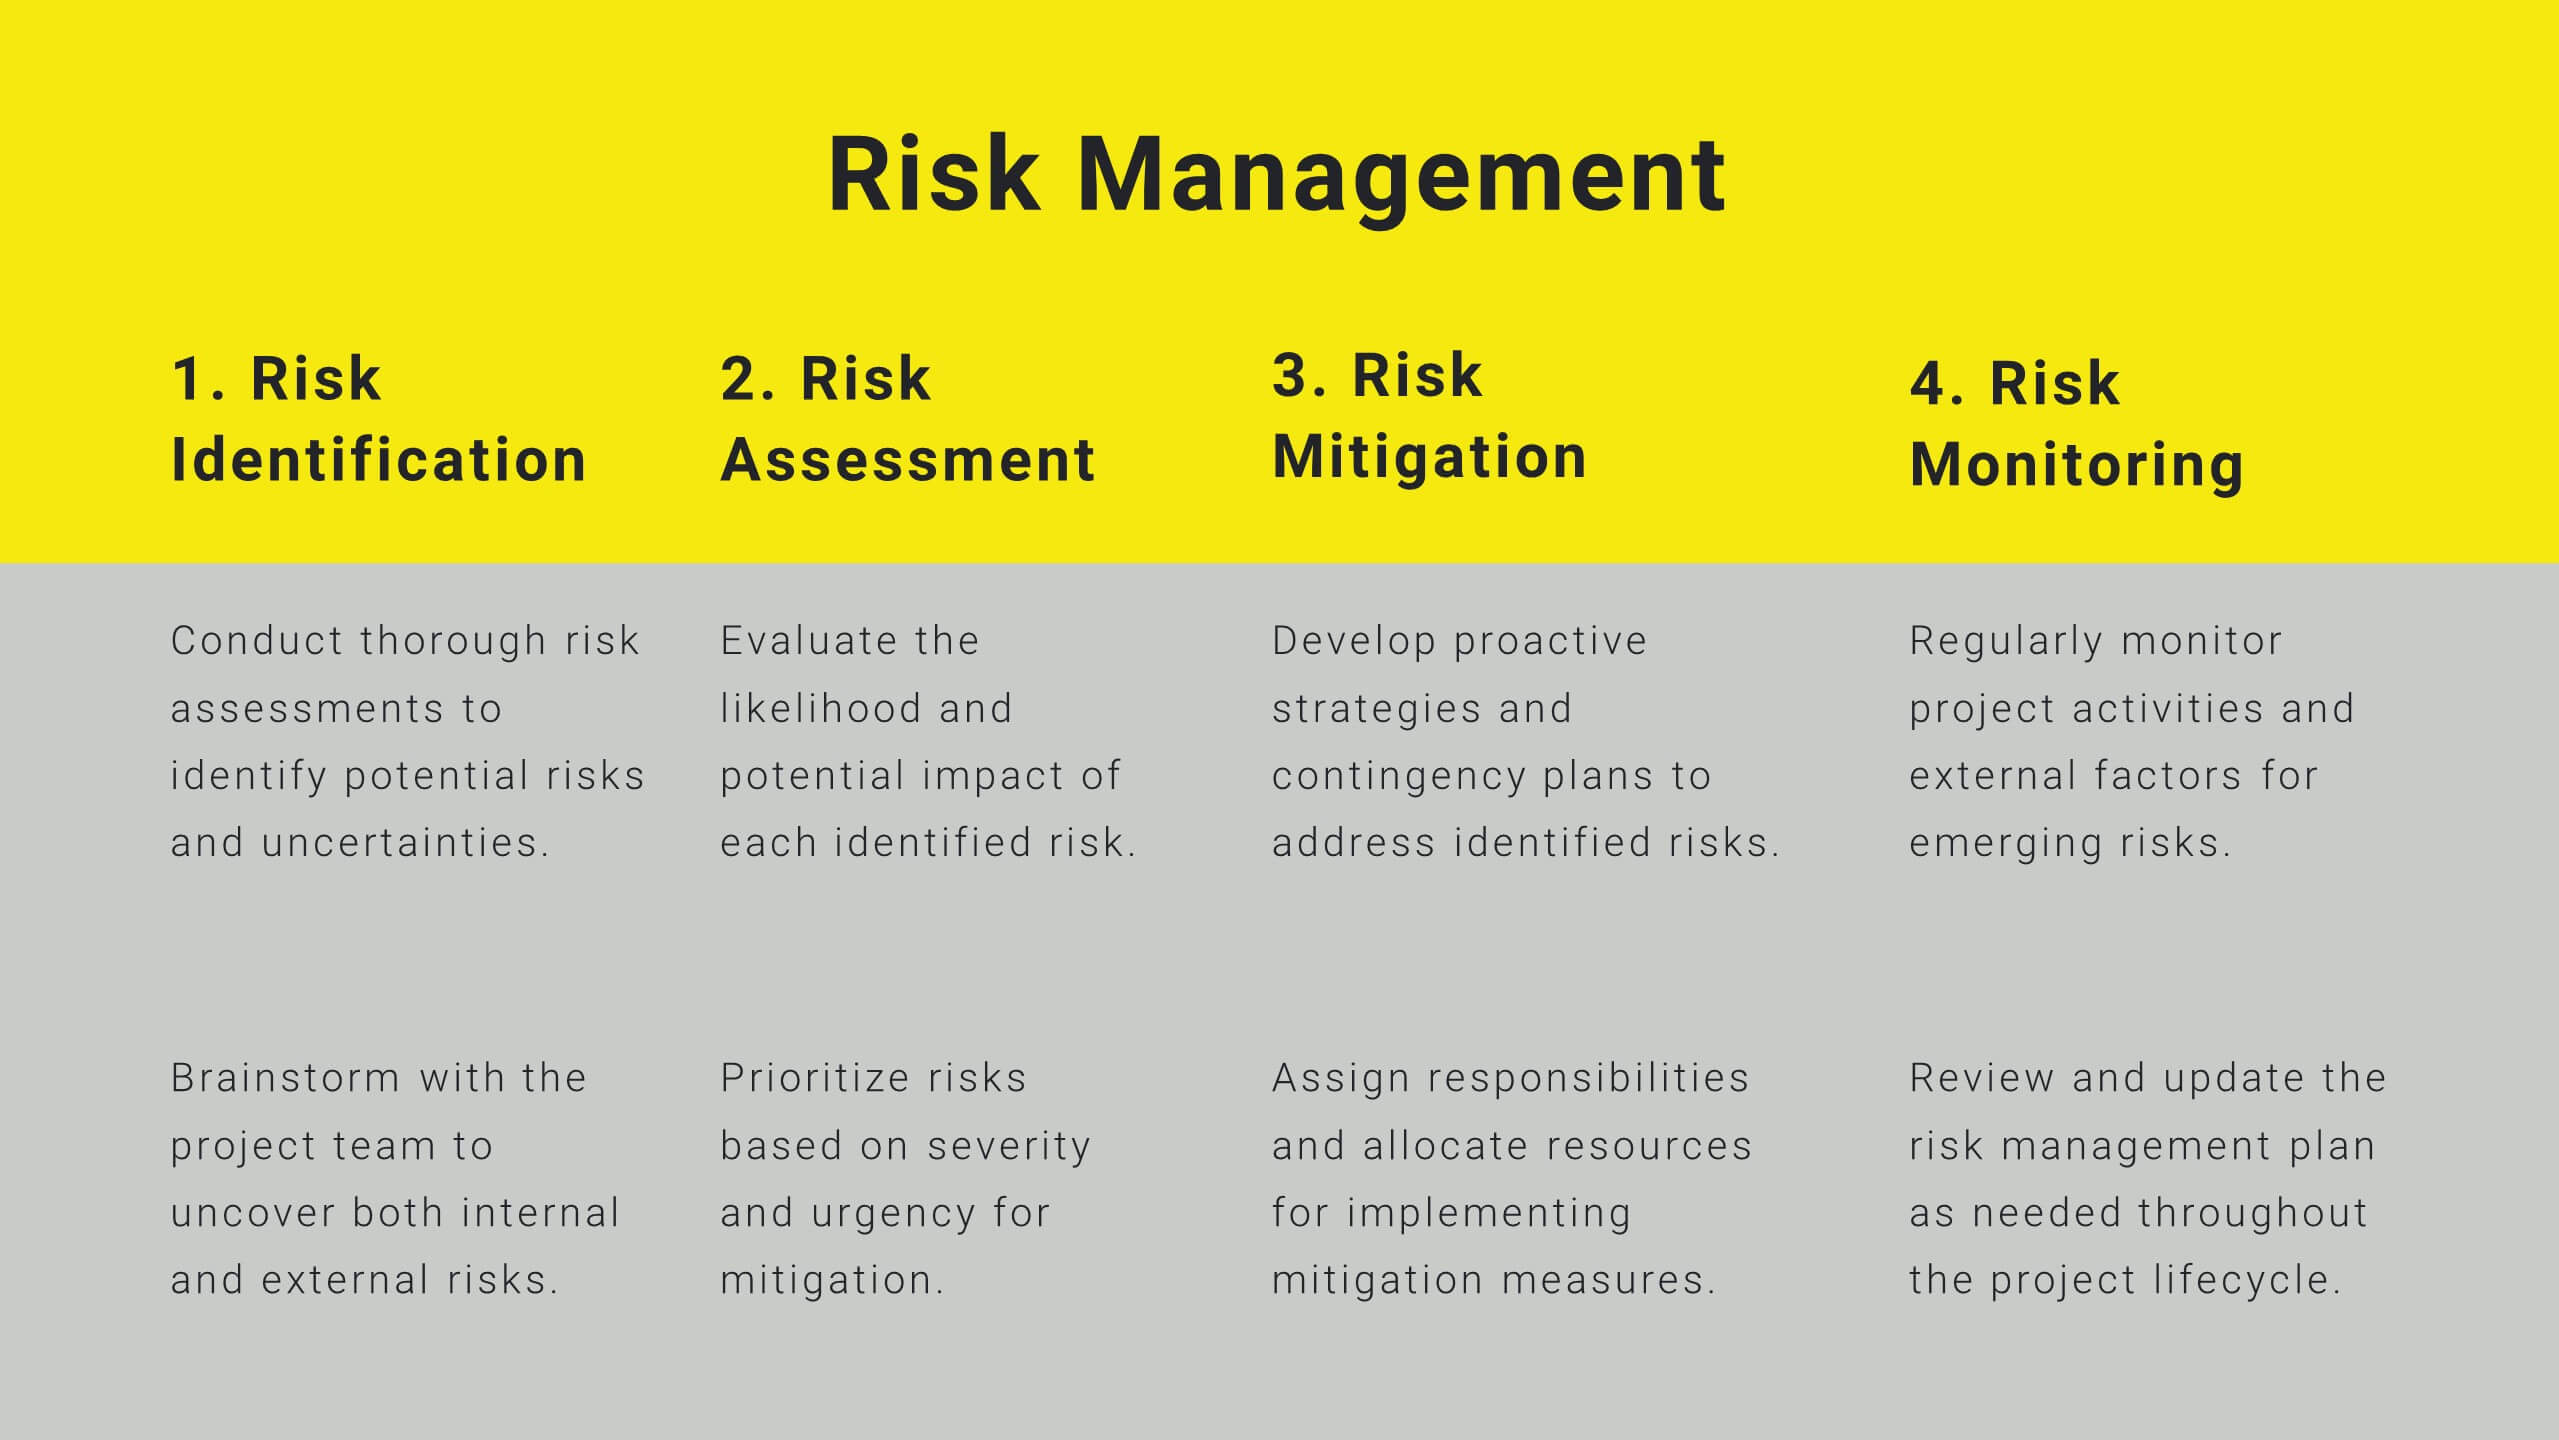
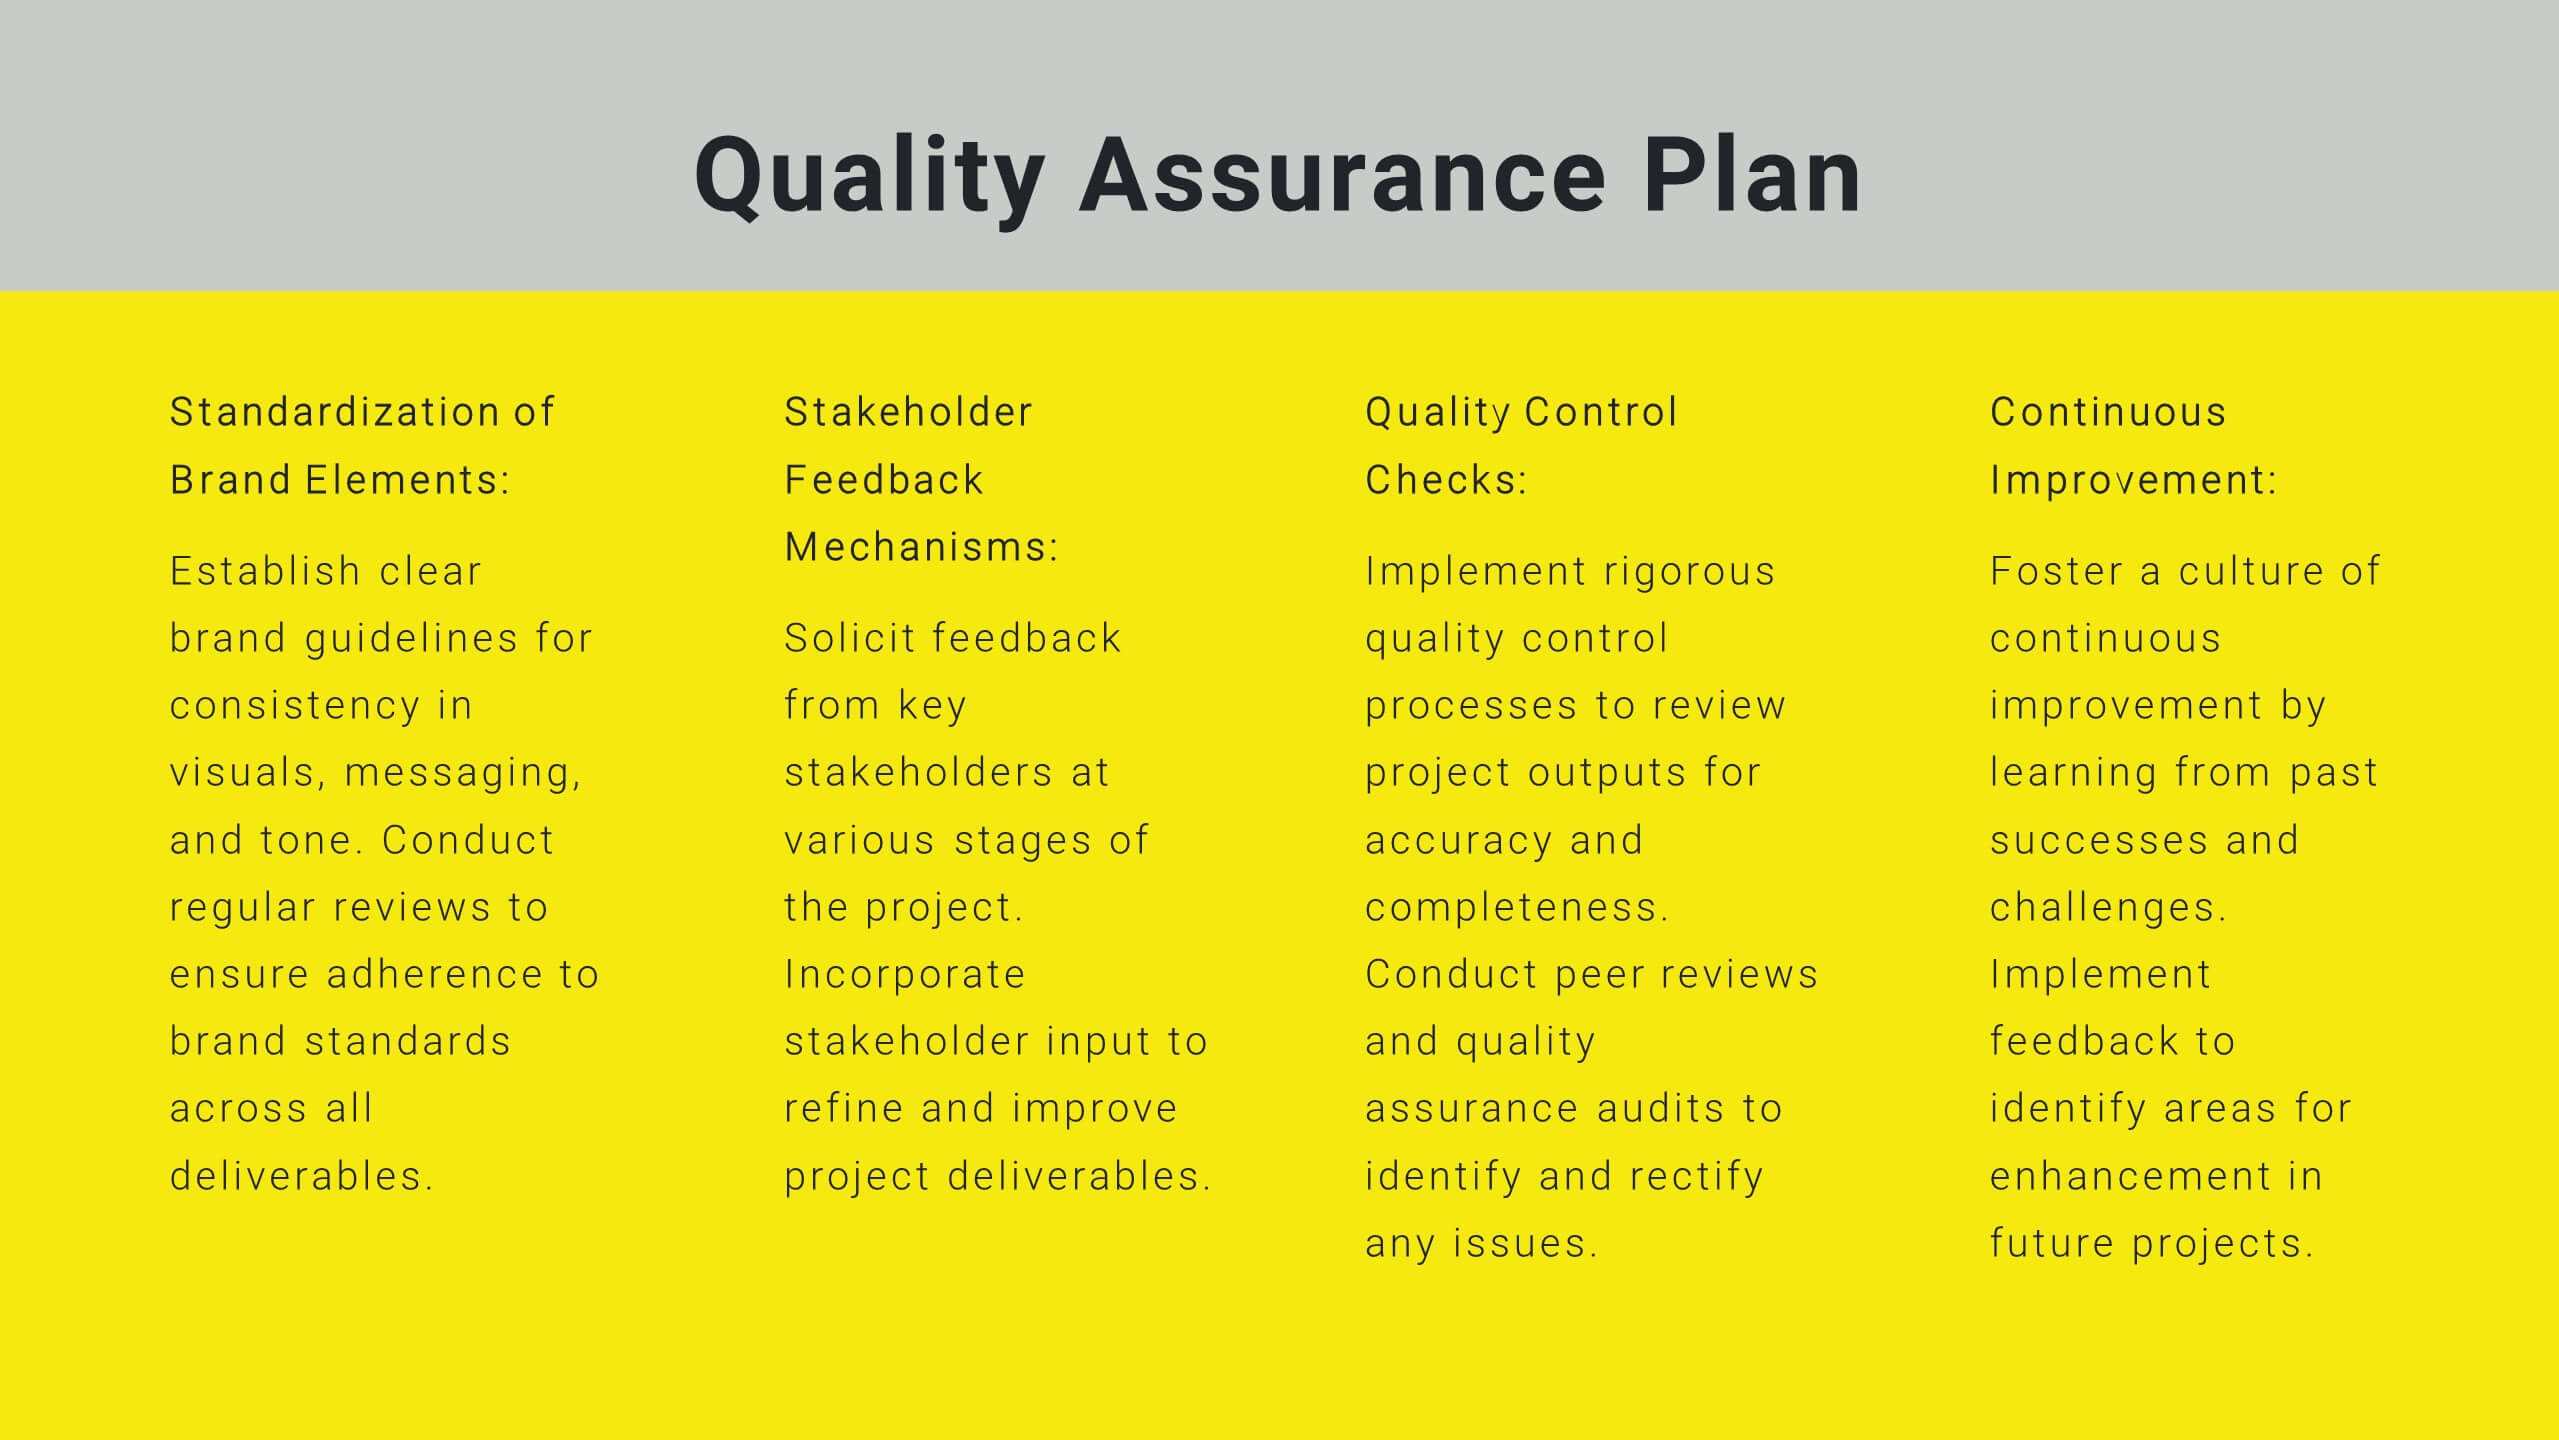
Sable Detailed Project Execution Plan Presentation
Master your project planning with this comprehensive execution plan template! Perfect for detailing project overviews, objectives, and timelines, it includes slides for budget breakdowns, resource allocation, and risk management. Ensure every detail is covered with structured content and clear visuals. Compatible with PowerPoint, Keynote, and Google Slides for seamless presentations on any platform.


4 slides
Europe Market Expansion Visualization Presentation
Showcase your European growth strategy with the Europe Market Expansion Visualization Presentation. This map-based slide design allows you to clearly highlight regional opportunities, new market entries, and key expansion zones using icons and color-coded country markers. Ideal for strategic planning, investor updates, and sales overviews. Fully editable in PowerPoint, Keynote, Google Slides, and Canva.
4 slides
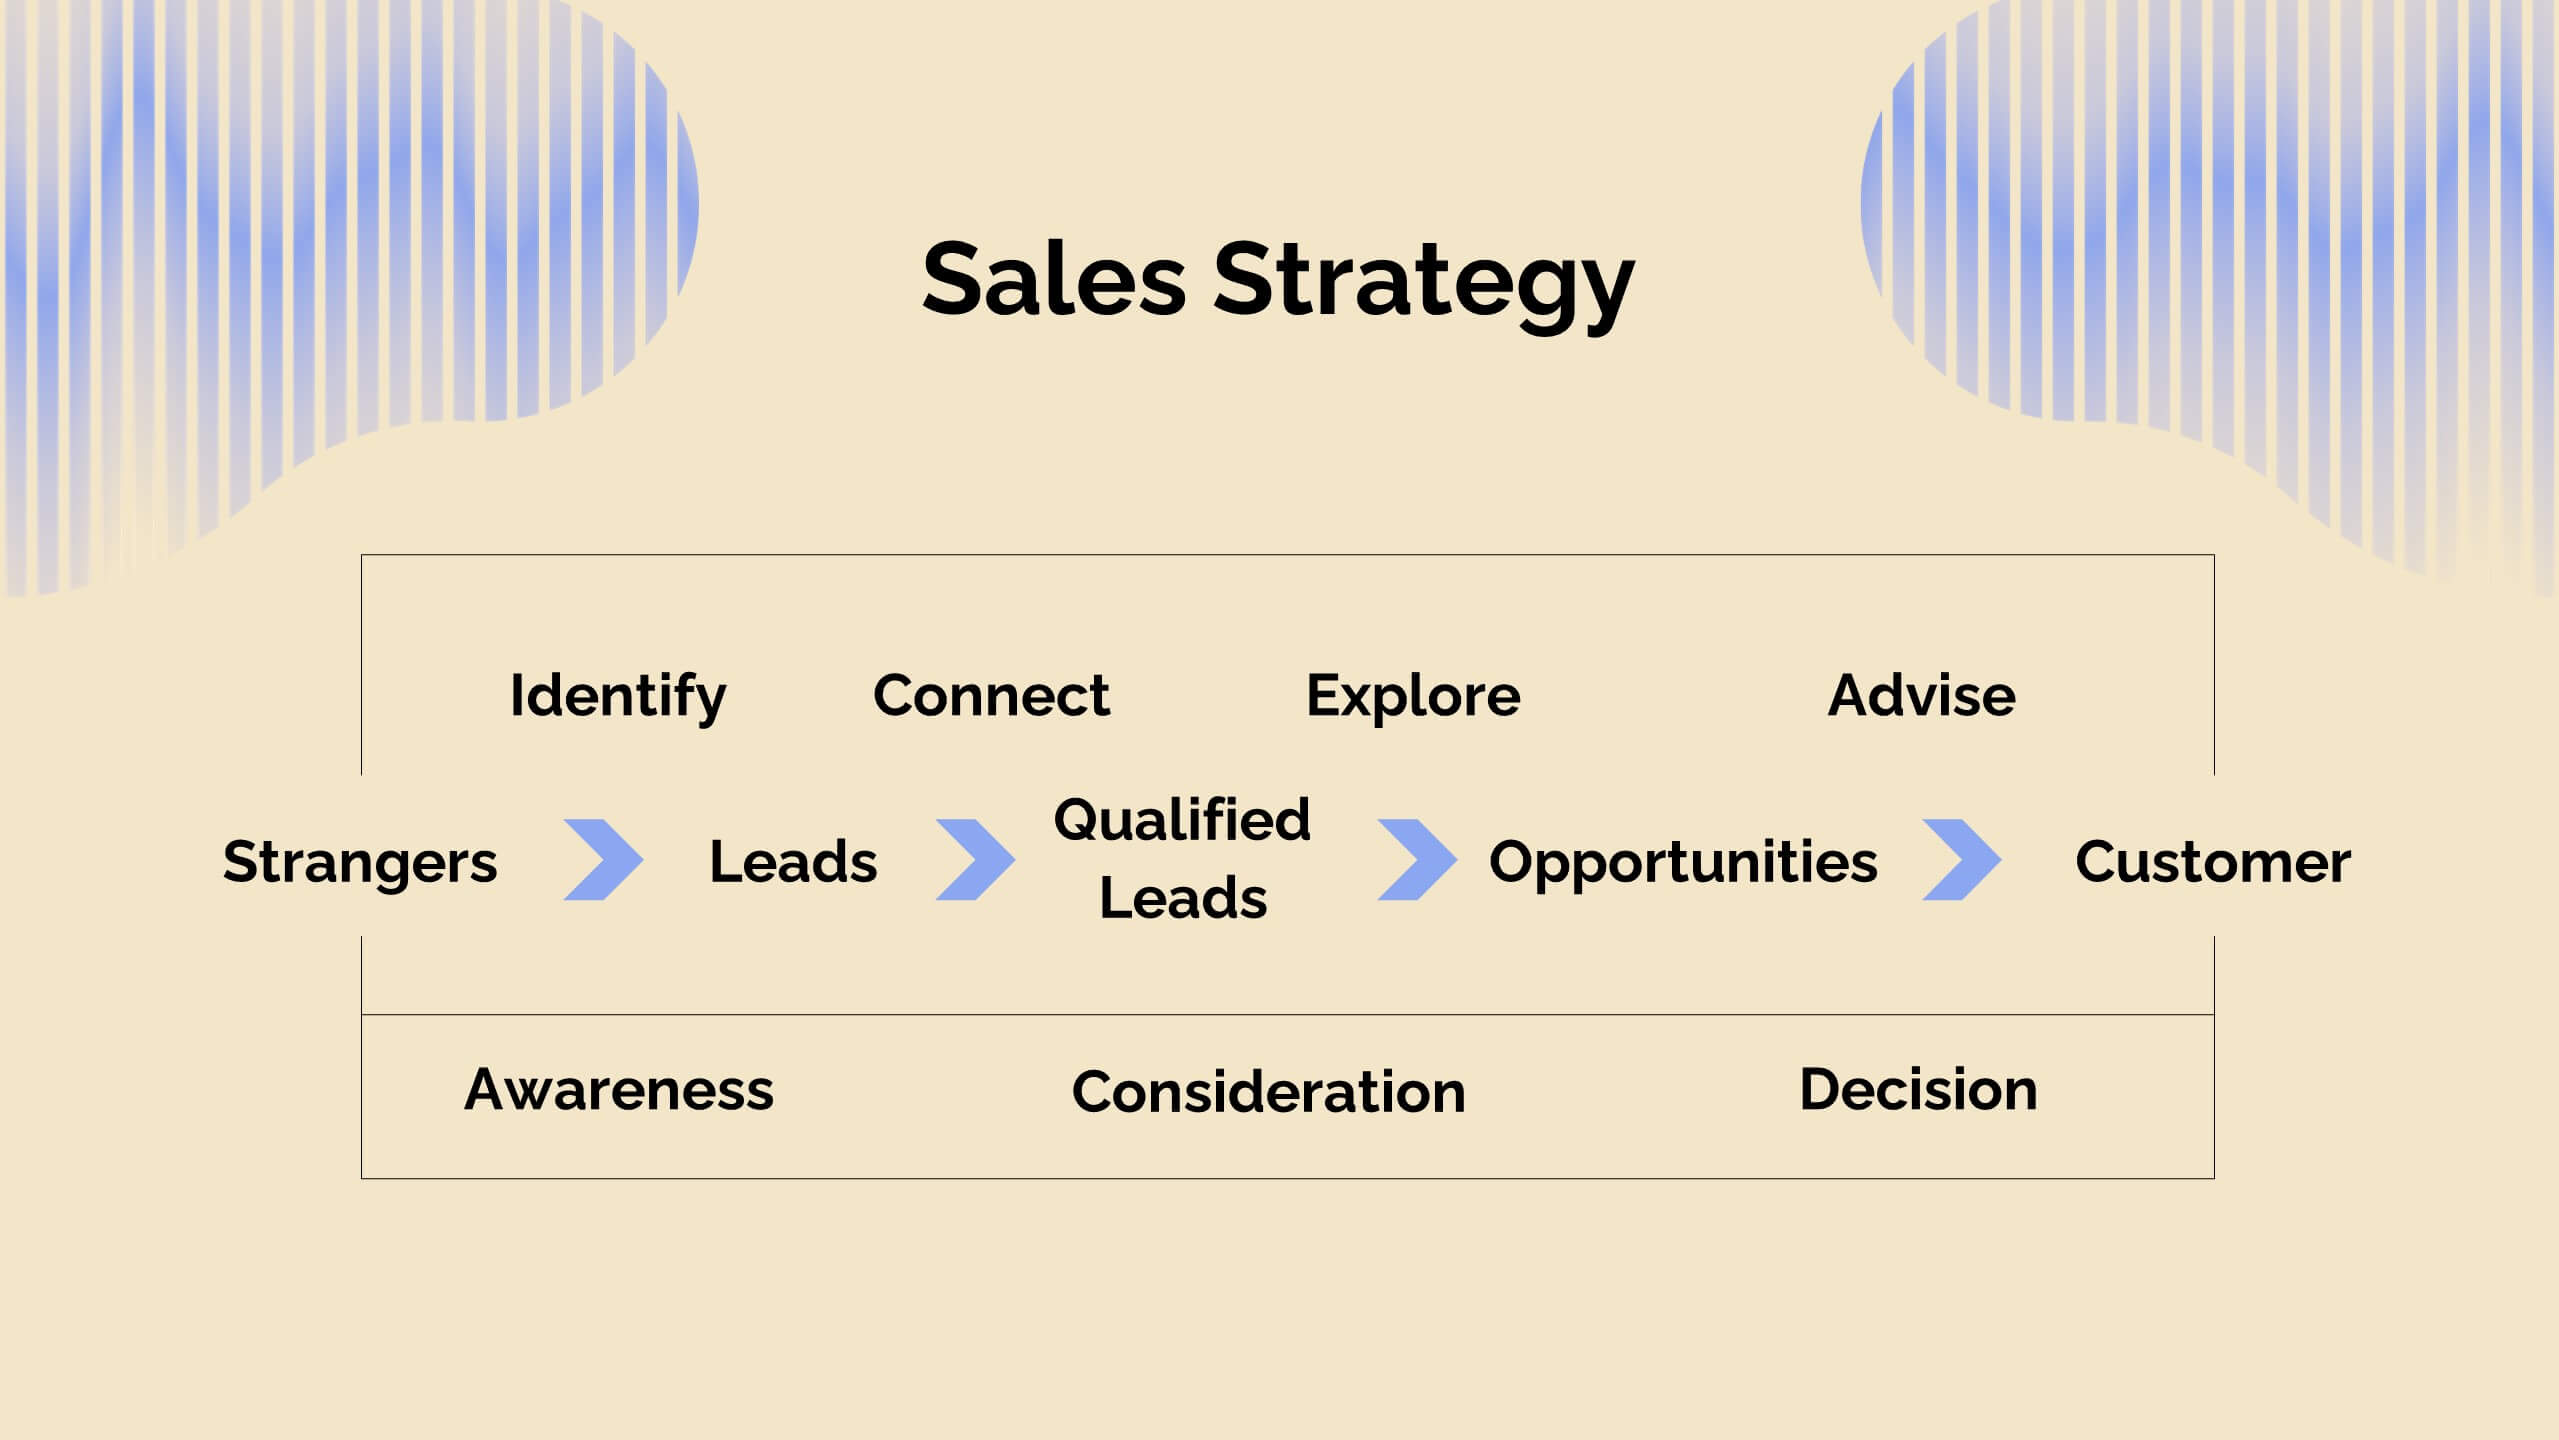
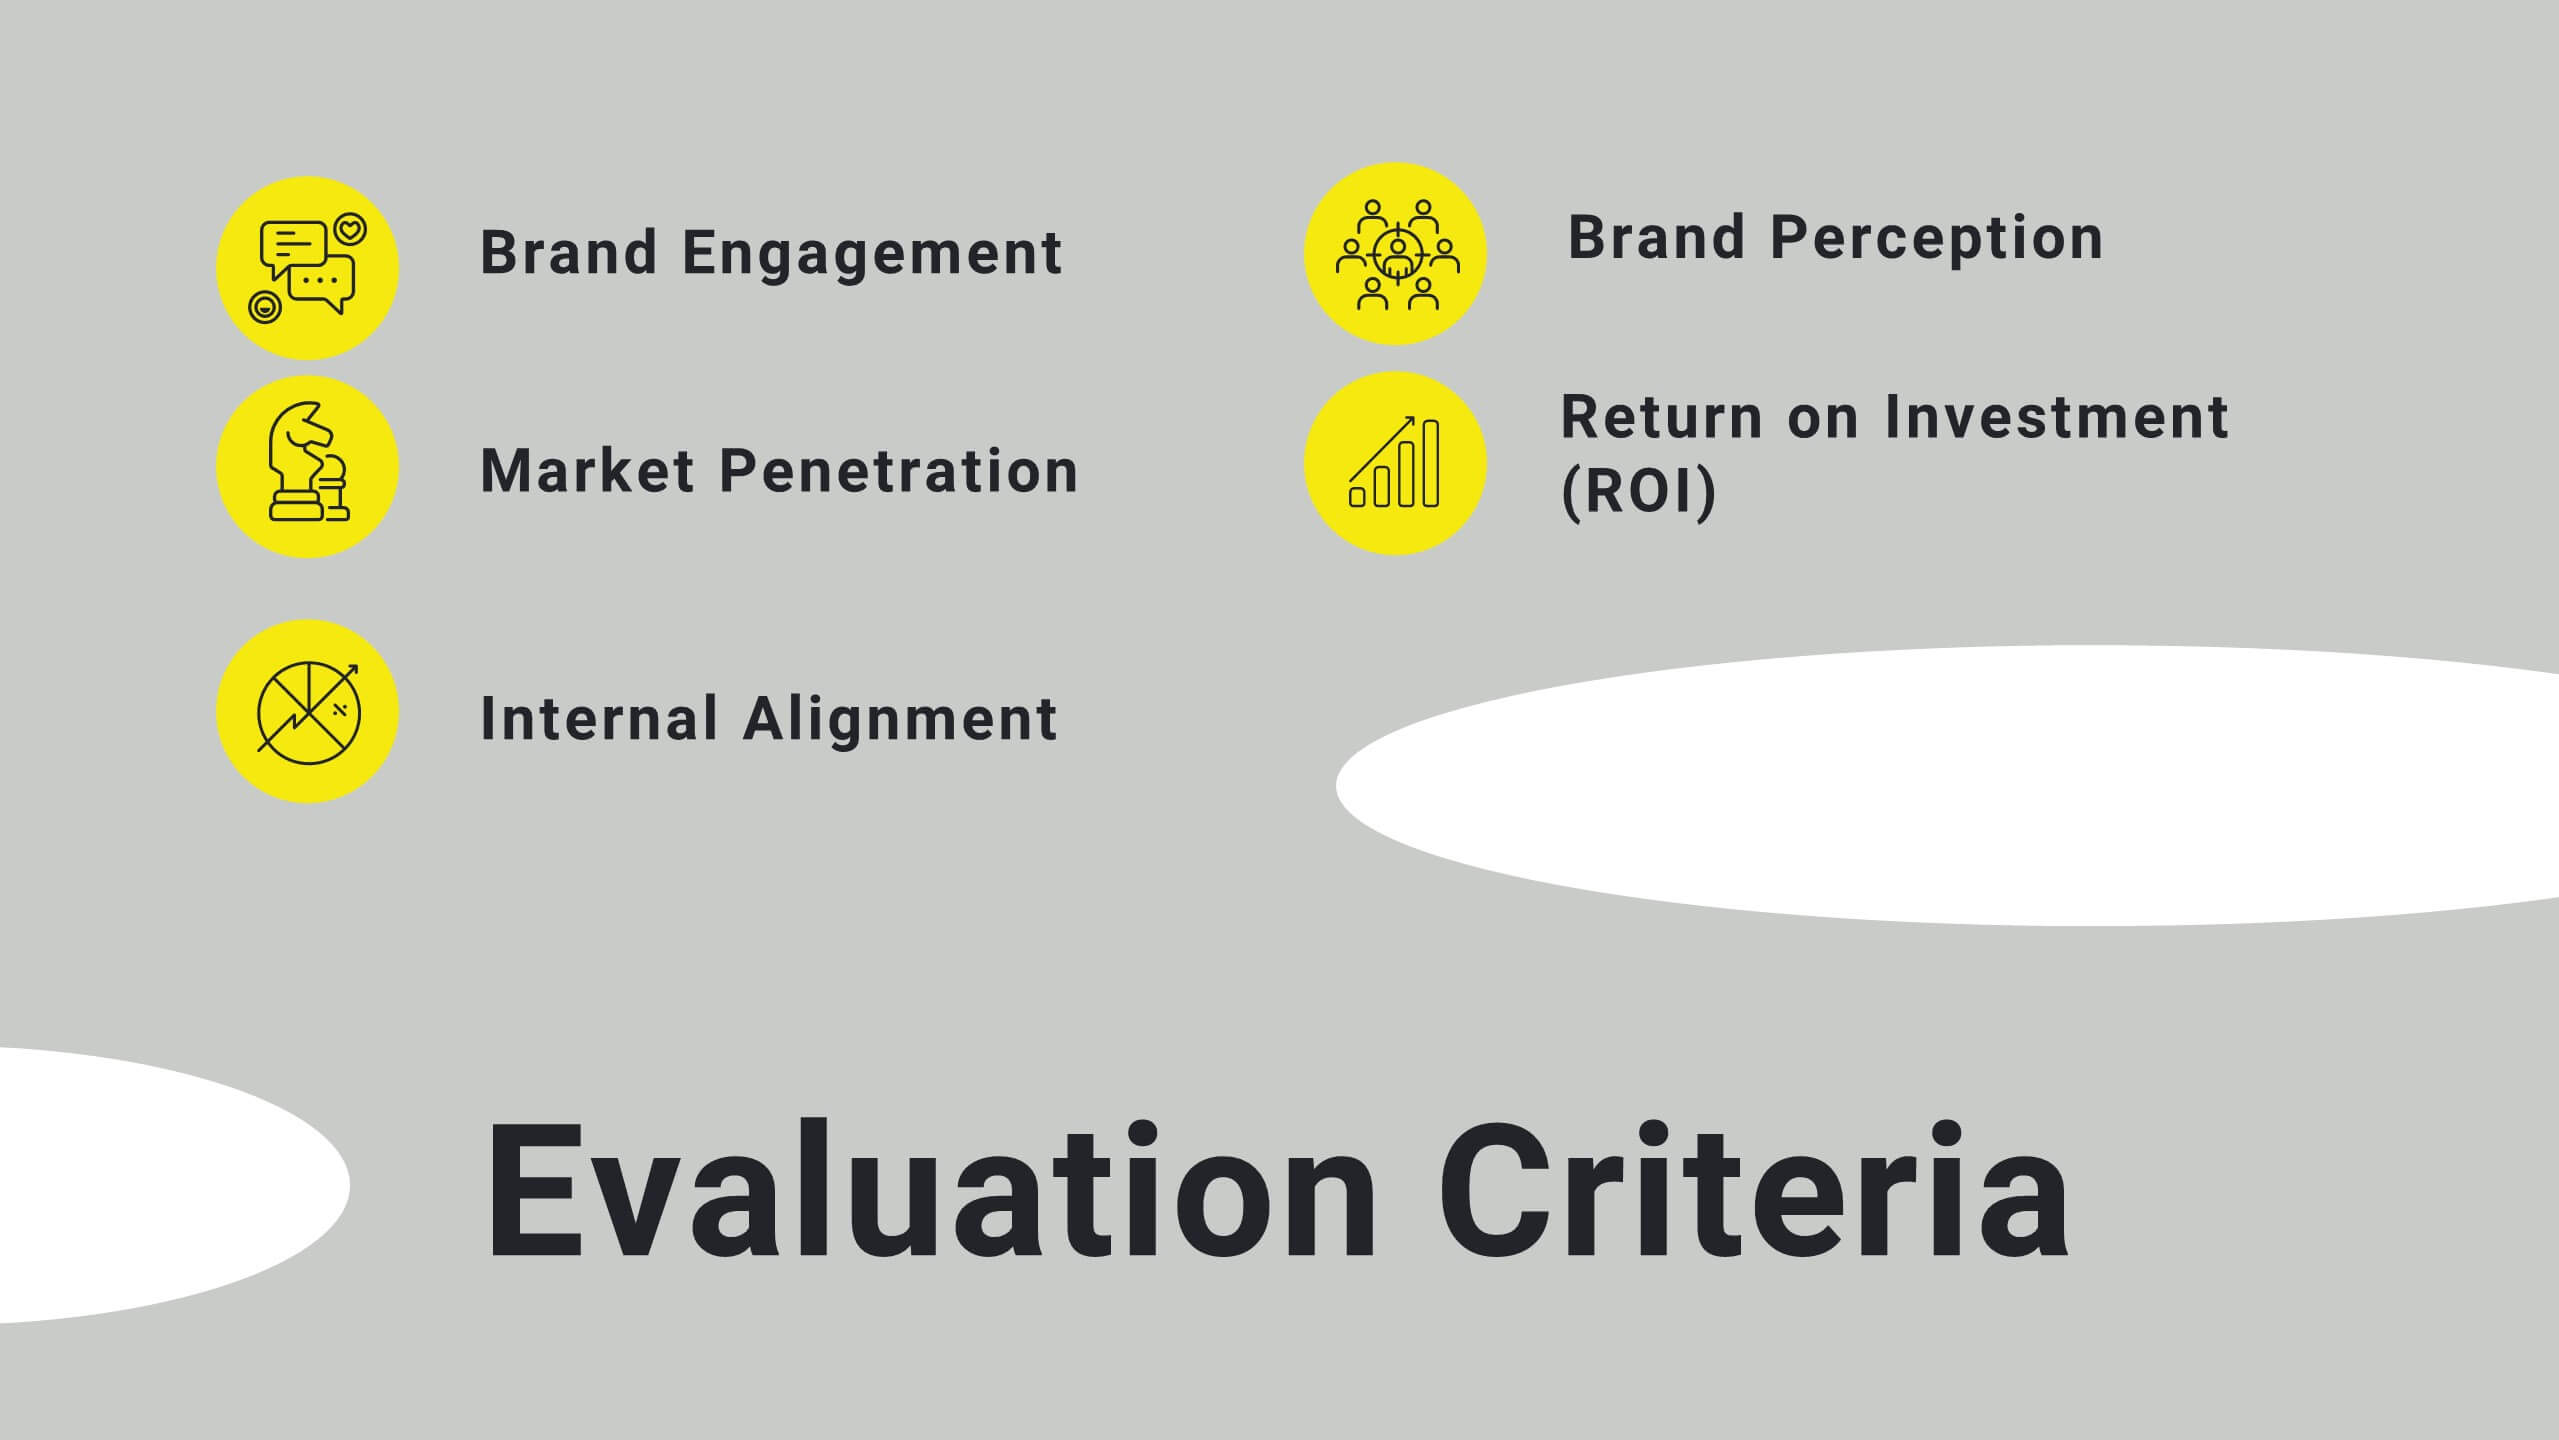
Objectives and Results Strategy Tracking Presentation
Track progress with clarity using the Objectives and Results Strategy Tracking Presentation. This sleek, minimalist layout helps visualize how each objective connects to measurable outcomes along a strategic path. Ideal for OKR reviews, quarterly goal updates, and performance check-ins. Fully customizable in PowerPoint, Canva, Keynote, and Google Slides.


6 slides
Customer Loyalty Program Strategy Presentation
Drive customer engagement and retention with the "Customer Loyalty Program Strategy" presentation template. This template helps you design and present effective loyalty strategies that increase customer lifetime value. Ideal for marketers and business strategists, it is fully compatible with PowerPoint, Keynote, and Google Slides, offering a versatile tool for any presentation need.


20 slides
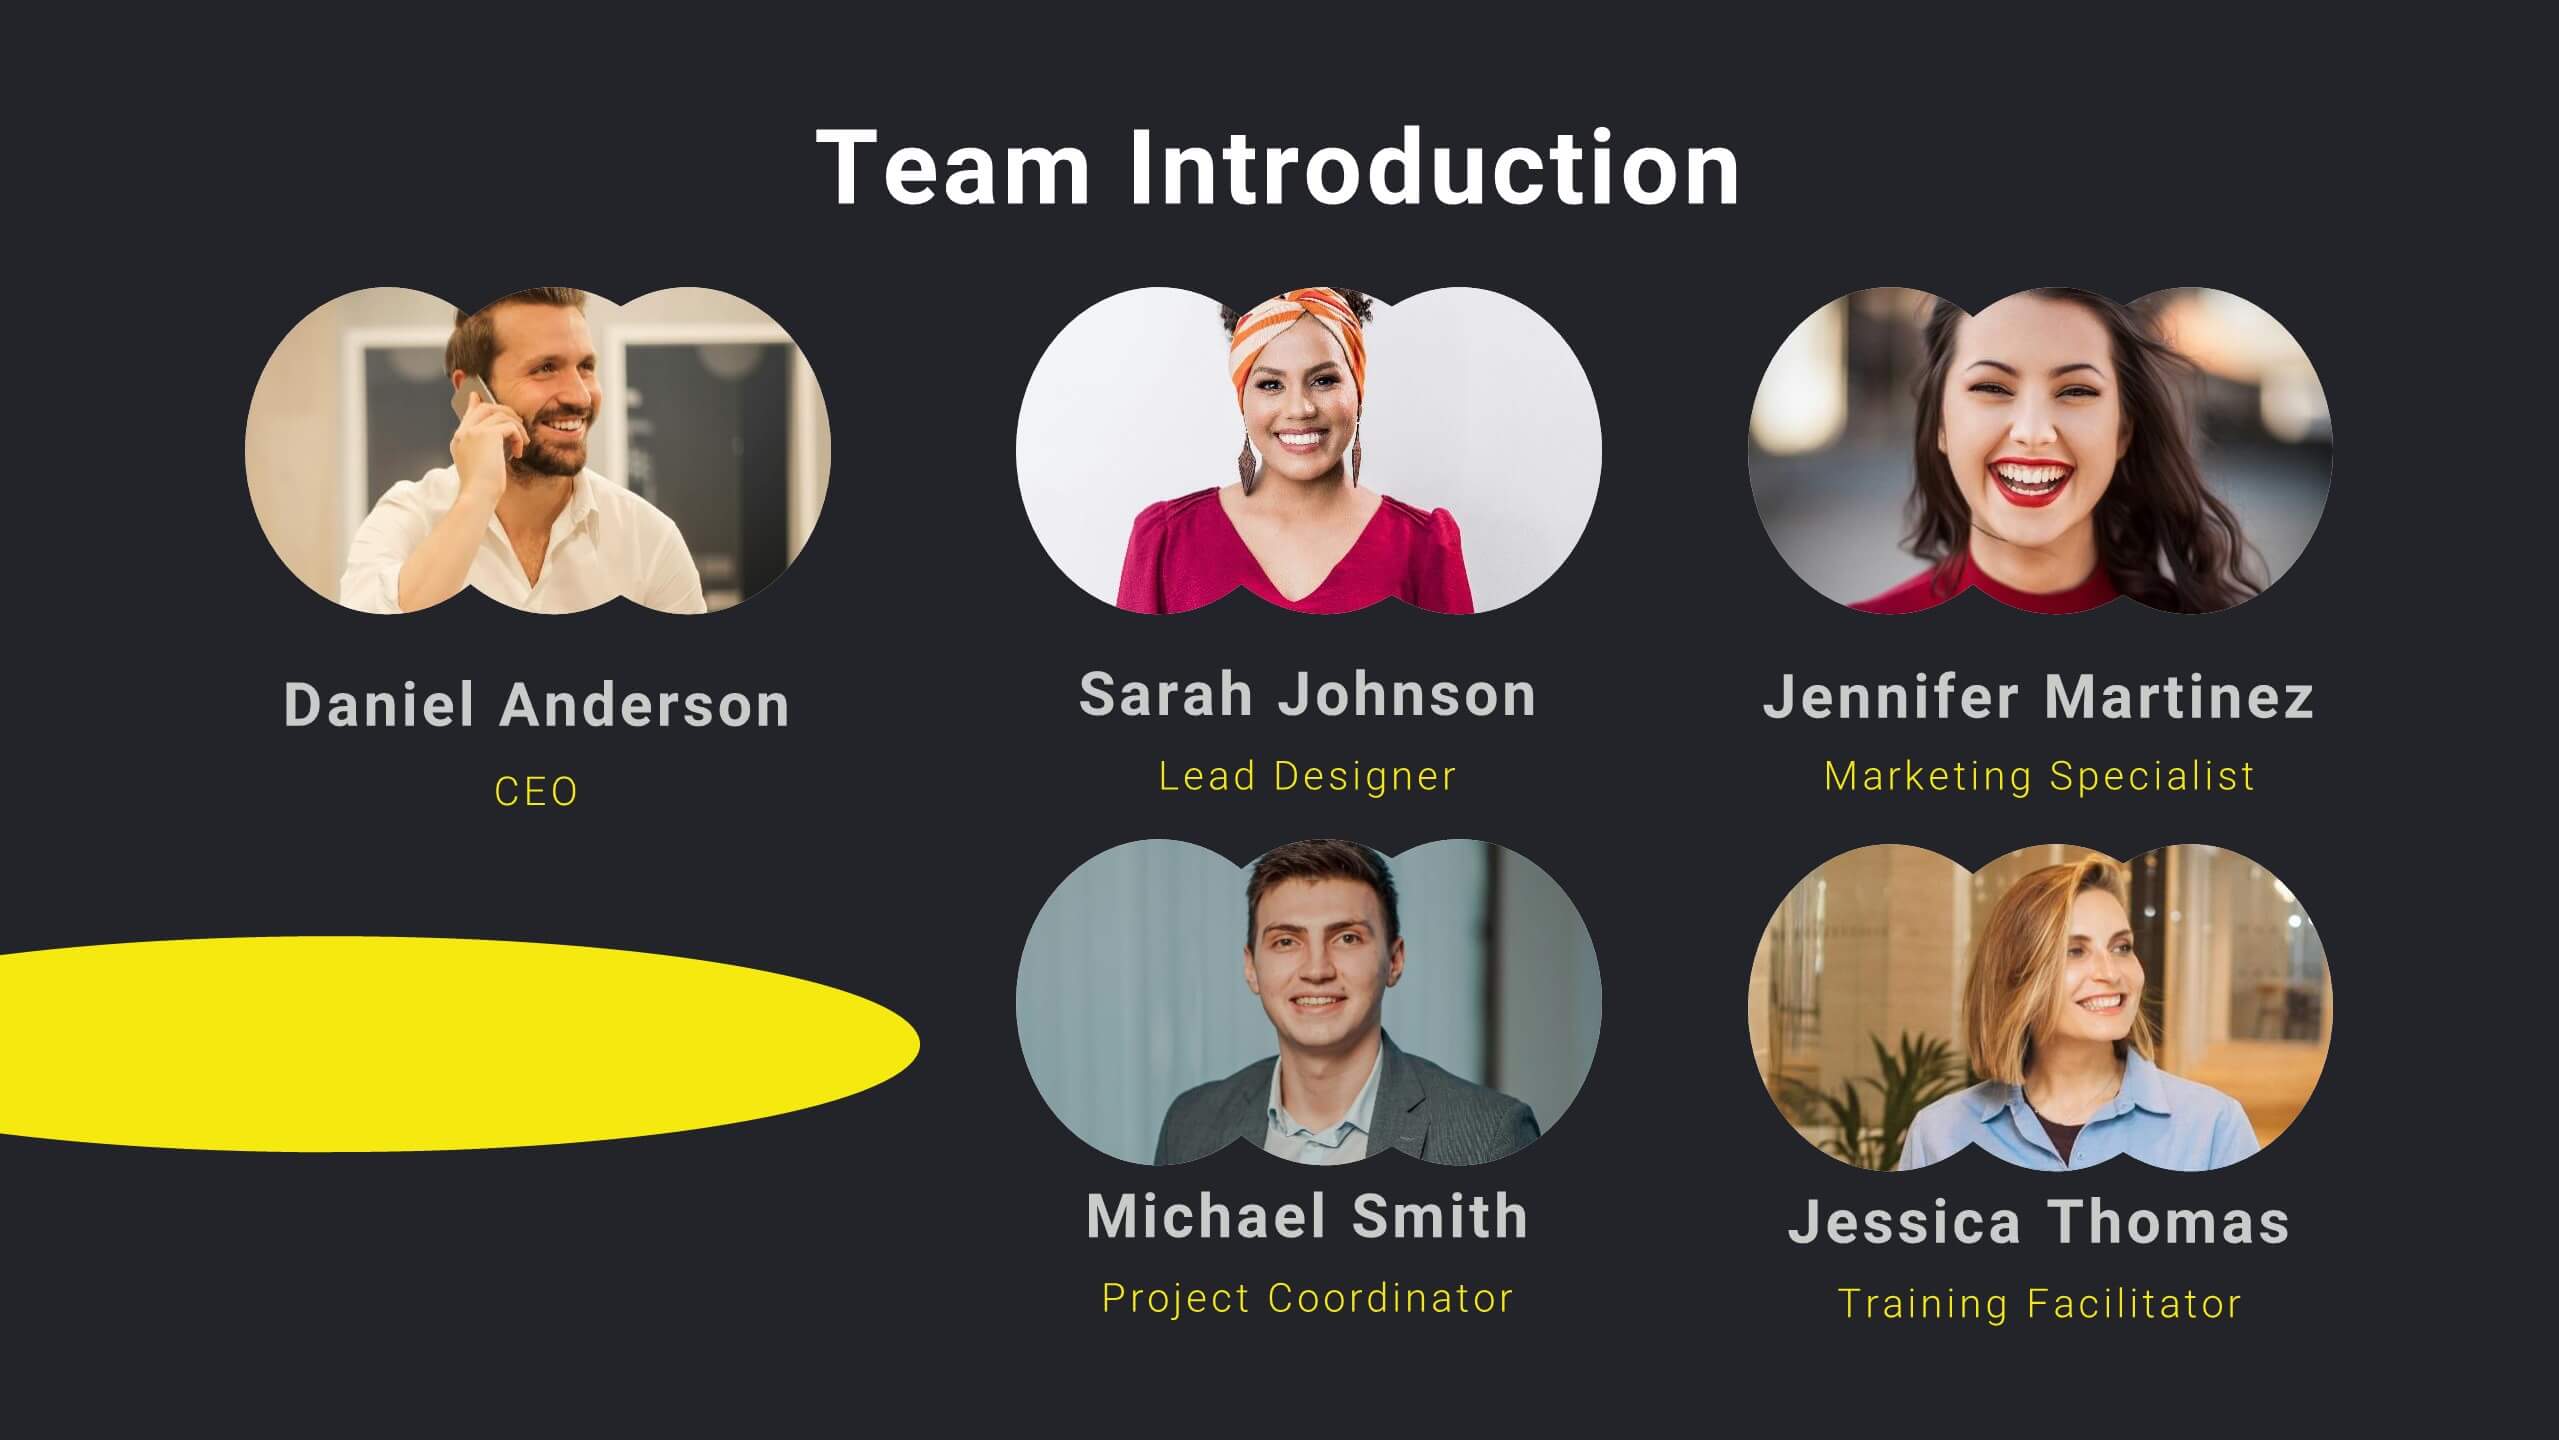
Dreamora Sales Performance Report Presentation
Deliver an impactful overview of your sales performance with this sleek and vibrant template. It features sections to highlight key aspects such as sales metrics, team introductions, and competitive analysis, ensuring a comprehensive presentation of your achievements and strategies. The template includes dedicated slides for sales objectives, customer testimonials, and pricing strategy, allowing you to showcase your results and future opportunities with clarity. Use the feedback and closing summary slides to leave a lasting impression on your audience. Fully customizable and compatible with PowerPoint, Google Slides, and Keynote, this template is ideal for sales teams, business leaders, and marketers who want to present performance metrics with professionalism and style.


23 slides
Nightspire Strategic Planning Report Presentation
Streamline your strategic planning process with this professionally designed presentation template. Covering key areas such as market analysis, SWOT assessment, milestones, and resource allocation, this template is ideal for businesses and project teams. Fully editable and compatible with PowerPoint, Keynote, and Google Slides.


4 slides
Project Development Progress Report Presentation
Track milestones with precision using this clean, data-driven slide designed for showcasing project completion percentages. Circular progress visuals paired with text blocks allow you to highlight achievements, issues, or next steps at a glance. Perfect for project managers, teams, and stakeholders. Fully editable in PowerPoint, Keynote, and Google Slides.


5 slides
Scientific Research Presentation
Break down complex processes with clarity using this Scientific Research Presentation Template. Featuring a modern lab flask visual segmented into four stages, it’s perfect for illustrating experimental phases, research progress, or scientific data. Ideal for educators, researchers, and science-based companies. Fully compatible with PowerPoint, Keynote, and Google Slides for effortless editing.


19 slides
Philosium Design Strategy Proposal Presentation
Bring your creative vision to life with this sleek and structured design strategy proposal presentation. Covering key elements like concept development, wireframes, typography, and user research, this template helps you communicate a compelling design approach. Fully customizable and compatible with PowerPoint, Keynote, and Google Slides for a seamless and professional presentation experience.


19 slides
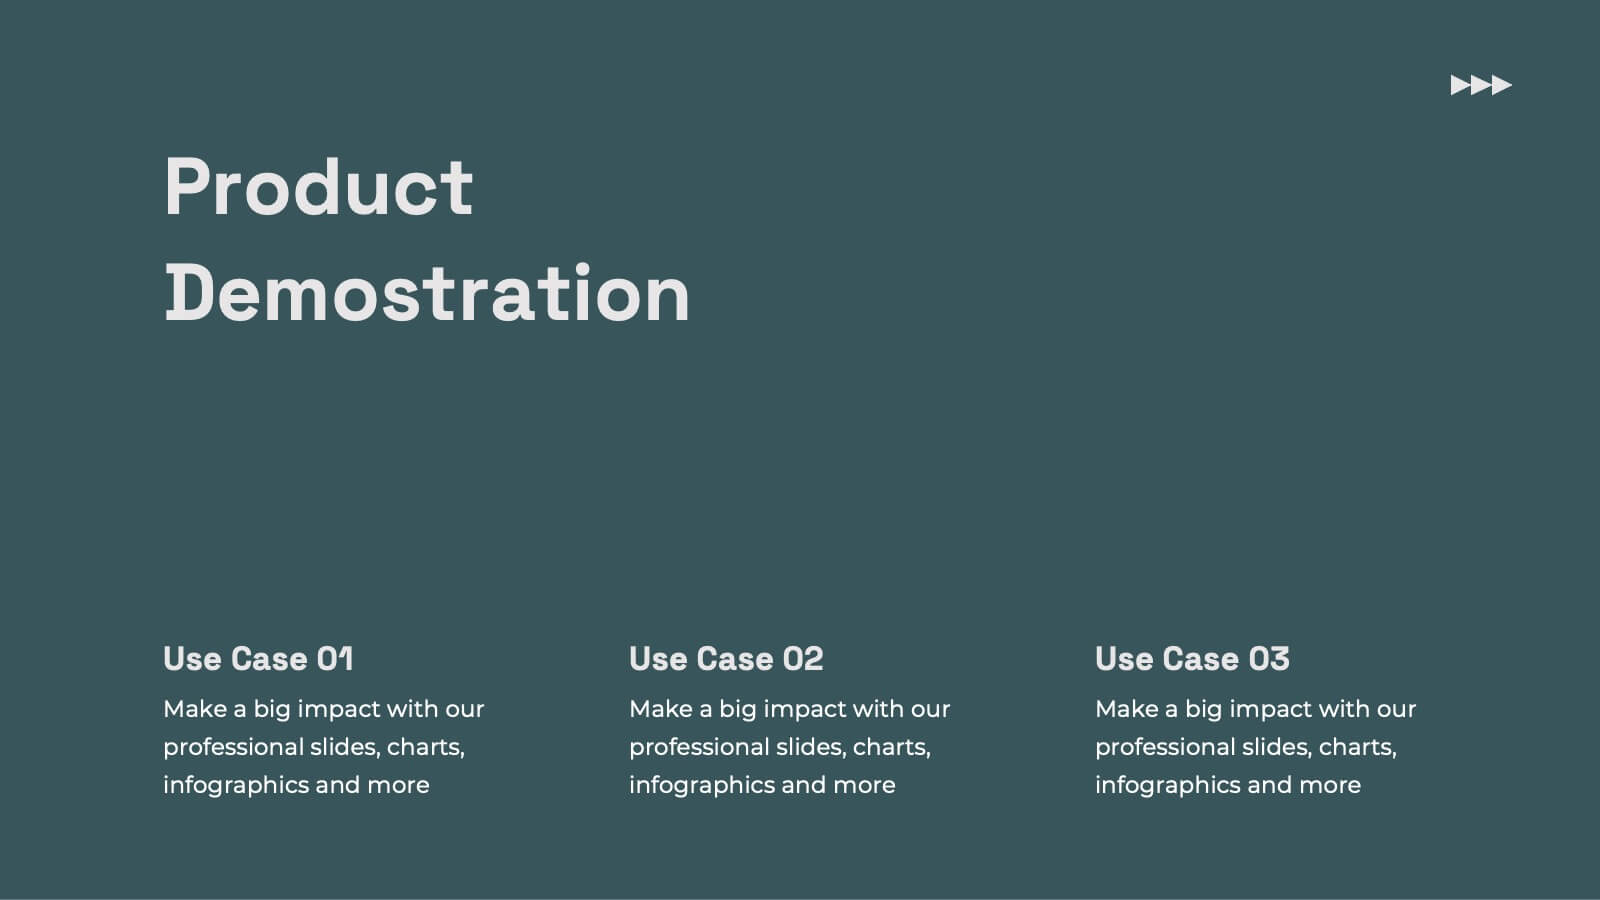
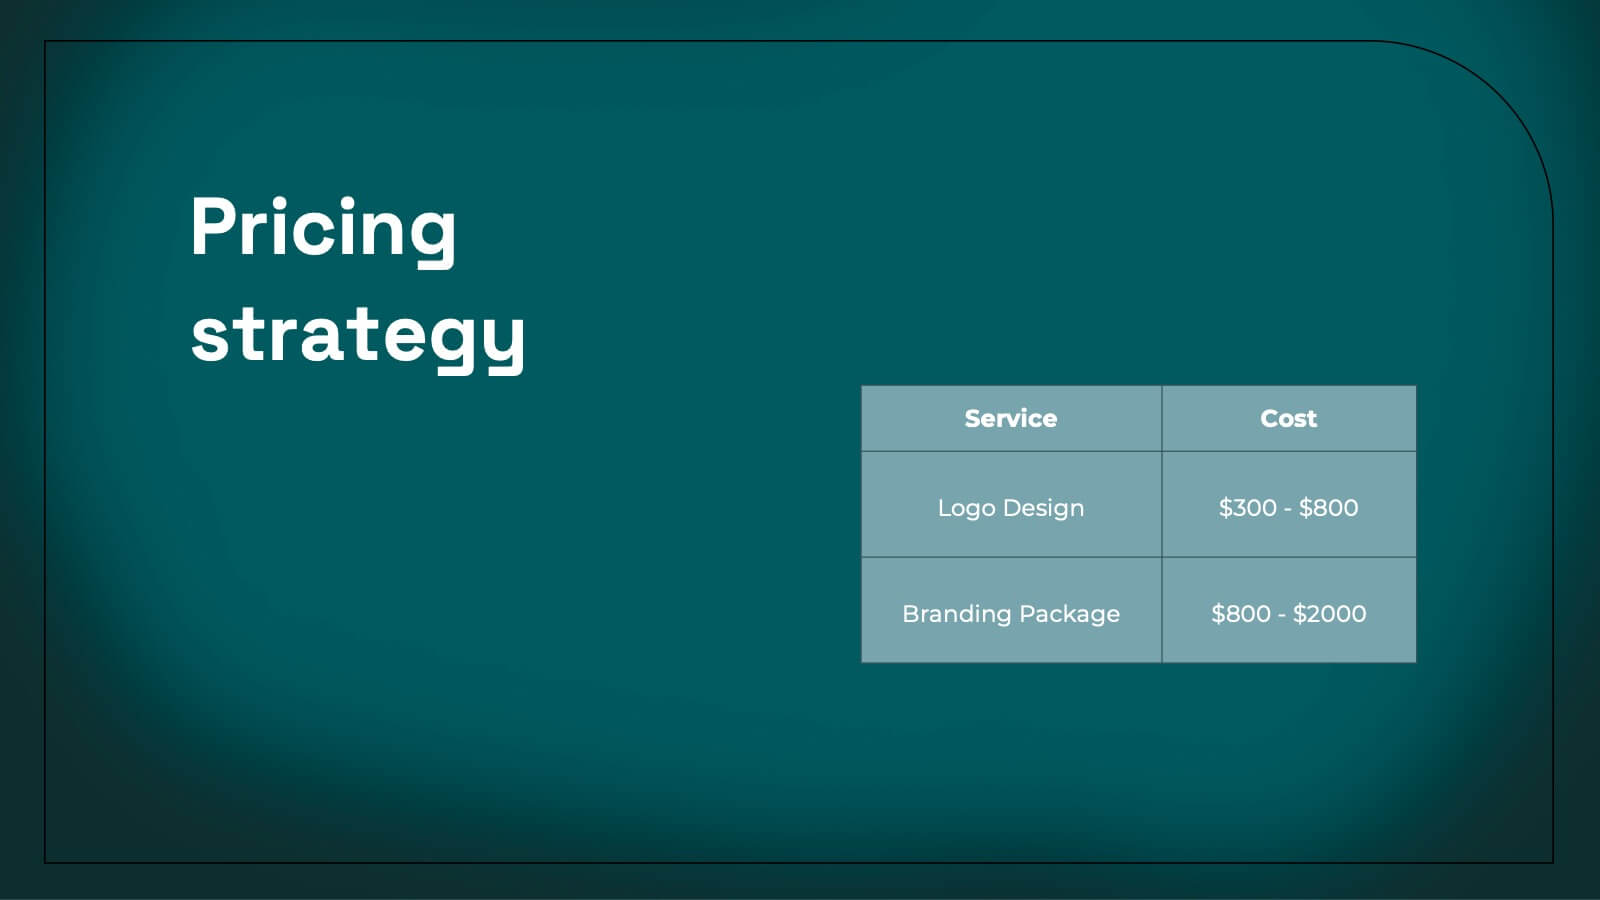
Kale Product Strategy Report Presentation
Unleash the power of your product with this bold and dynamic product strategy report template! Elevate your presentation with eye-catching designs that showcase product features, competitive analysis, and pricing strategies like never before. Captivate your audience from start to finish and leave a lasting impression. Fully compatible with PowerPoint, Keynote, and Google Slides!


26 slides
HIIT Workout Pink Presentation
Unleash the energy with our vibrant HIIT gym workout presentation template, a dynamic blend of pink, red, orange, and yellow, designed to bring your fitness regime to life. This energetic palette is perfect for gym owners, fitness influencers, and personal trainers aiming to showcase the high-intensity intervals that promise fast results. The template offers various graphics, icons, and image placeholders that add a visual punch to your information. Dive into creating an engaging, motivational fitness journey that highlights the benefits, routines, and transformative power of HIIT workouts, ensuring your audience is pumped and ready to go!


6 slides
Creative Solutions for Business Challenges Presentation
Present your strategy with impact using the Creative Solutions for Business Challenges Presentation. Featuring a dynamic cloud and gear diagram, this layout helps illustrate interconnected solutions and innovative thinking. Ideal for brainstorming, strategic planning, and team problem-solving discussions. Fully editable in PowerPoint, Keynote, and Google Slides.


5 slides
Fitness Program Infographics
A fitness program is a structured plan designed to improve and maintain physical health and well-being. These vertical infographics outline the key elements and benefits of a fitness program. This template is ideal for gyms, personal trainers, and fitness enthusiasts looking to educate and inspire others to adopt a healthy and active lifestyle. The infographics offer space to include customizable workout plans tailored to different fitness levels, such as weight loss, muscle gain, or overall fitness improvement. Helpful nutrition tips are incorporated to complement the fitness program, emphasizing the importance of achieving fitness goals.


21 slides
Alchemos UX Case Study Presentation
Showcase your UX process with clarity and impact using this sleek case study presentation. Covering key aspects like user research, interaction design, prototyping, and responsive design, this template helps you tell a compelling design story. Fully customizable and compatible with PowerPoint, Keynote, and Google Slides for a seamless presentation experience.


5 slides
Collaborative Learning Techniques Overview Presentation
Highlight team-based education methods with the Collaborative Learning Techniques Overview Presentation. This layout is perfect for mapping out peer-led discussions, group projects, or cooperative learning strategies using a visual 4-step flow. The clean, screen-themed icons make it ideal for educators, trainers, or eLearning creators. Fully editable in Canva, PowerPoint, Keynote, and Google Slides.