


Features
- 20 Unique Slides
- Fully editable and easy to edit in Microsoft Powerpoint, Keynote and Google Slides
- 16:9 widescreen layout
- Clean and professional designs
- Export to JPG, PDF or send by email


Do you have any questions?
Recommend


7 slides
Smart House Concept and Design Layout Presentation
Present your smart home innovations with the Smart House Concept and Design Layout Presentation. This slide features a central house icon and six circular nodes, ideal for explaining home automation systems, IoT integrations, or security features. Fully editable in Canva, PowerPoint, Keynote, and Google Slides—perfect for tech startups, product demos, and future living pitches.


6 slides
Project Roadmap with Strategic Phases Presentation
Visually guide your team through every phase with the Project Roadmap with Strategic Phases Presentation. This template features a curved arrow layout to illustrate project milestones, making it perfect for planning, strategy, or progress updates. Fully customizable in PowerPoint, Google Slides, and Canva for seamless integration into any workflow.


2 slides
Blue Ocean Strategy Map Presentation
Make your message stand out with a clean, visual map that instantly clarifies where opportunities lie. This presentation helps you compare value factors side-by-side, reveal market gaps, and highlight strategic advantages in a simple, structured format. Fully customizable and compatible with PowerPoint, Keynote, and Google Slides.


6 slides
Detailed Case Analysis Report Presentation
Turn complex findings into a clear and engaging story with this modern, data-focused layout. Ideal for professionals presenting research, performance reviews, or audit results, it helps you organize insights with precision and clarity. Fully editable and compatible with PowerPoint, Keynote, and Google Slides for effortless customization and presentation delivery.


5 slides
Meal Plan and Nutrition Guide Presentation
Simplify your nutrition strategy with the Meal Plan and Nutrition Guide Presentation. This visually engaging circular layout lets you outline five key nutrition pillars or daily meals with icons and editable titles. Ideal for dietitians, wellness coaches, or health brands. Compatible with PowerPoint, Canva, and Google Slides for seamless customization.


10 slides
Corporate Governance Model Presentation
Bring clarity and structure to complex leadership systems with this clean, modern slide, perfect for explaining how key responsibilities flow across an organization. It helps simplify roles, decisions, and oversight for any business audience. Fully editable and easy to use in PowerPoint, Keynote, and Google Slides.


4 slides
Insurance Services Overview Presentation
Present your offerings with clarity using this Insurance Services Overview slide. Ideal for explaining coverage tiers, policy types, or service options. The clean umbrella graphic adds a strong visual metaphor for protection. Fully customizable and compatible with PowerPoint, Keynote, and Google Slides for use across any insurance or finance presentation.


26 slides
Poseidon Sales Pitch Deck Template Presentation
Unleash your persuasive power with the Poseidon Sales Pitch Deck template! This sleek and modern deck is designed to elevate your pitch, making your business the undeniable choice for potential clients or investors. With a compelling company overview and a clear problem statement, this template sets the stage for presenting your solution as the ultimate answer to your market’s challenges. The deck includes essential slides like competitive landscape analysis, revenue models, and marketing strategies to give your pitch a comprehensive edge. The visually appealing design combined with well-organized sections ensures your message is clear, concise, and impactful. Customize it to fit your brand identity and make your unique selling proposition stand out. Perfect for startups, established businesses, or anyone looking to make a powerful impression, this template is compatible with PowerPoint, Keynote, and Google Slides. Take your pitch to the next level and close those deals with confidence!


6 slides
How to Master Time Management Presentation
Make every minute count with this sleek and dynamic template built to visualize productivity, efficiency, and planning. Perfect for showcasing workflows, priorities, or time allocation, it helps communicate structure with clarity and style. Fully customizable and compatible with PowerPoint, Keynote, and Google Slides for effortless editing and presentation.


25 slides
Siren Rebranding Project Plan Presentation
This sleek brand presentation template covers essential elements like market analysis, brand guidelines, positioning, and audience insights. It's designed to showcase your brand identity and development strategies with a modern layout. Compatible with PowerPoint, Keynote, and Google Slides, it’s perfect for delivering professional and engaging brand presentations.


4 slides
Athlete Performance Metrics Presentation
Track and display key performance data with this Athlete Performance Metrics slide. Featuring a semi-circular layout with sports icons, percentages, and editable text areas, this template helps visualize stats clearly. Ideal for coaching reports or sports analysis. Compatible with PowerPoint, Keynote, and Google Slides for easy customization and use.


4 slides
Business Decision-Making Framework Presentation
Visualize your path to smarter choices with this key-themed decision-making template. Ideal for strategy sessions, executive planning, or consulting presentations, it breaks down three core steps leading to actionable results. The layout emphasizes clarity and progression, with editable text zones and sleek icons. Works with PowerPoint, Keynote, and Google Slides.


21 slides
Ceres Financial Report Presentation
This financial report template is designed to showcase performance metrics, sales analysis, project progress, and strategic insights with clarity and professionalism. Featuring slides for operational updates, competitor insights, and recommendations for improvement, it ensures a comprehensive financial overview. Compatible with PowerPoint, Keynote, and Google Slides for flexible presentations.


8 slides
Beginner's Guide to Stock Market Presentation
Turn complex financial ideas into simple, engaging visuals with this sleek, data-driven design. Perfect for explaining market basics, investment growth, and trading concepts in a way that’s easy to follow and visually appealing. Fully compatible with PowerPoint, Keynote, and Google Slides for effortless editing and presentation customization.


20 slides
Aura Digital Marketing Strategy Plan Presentation
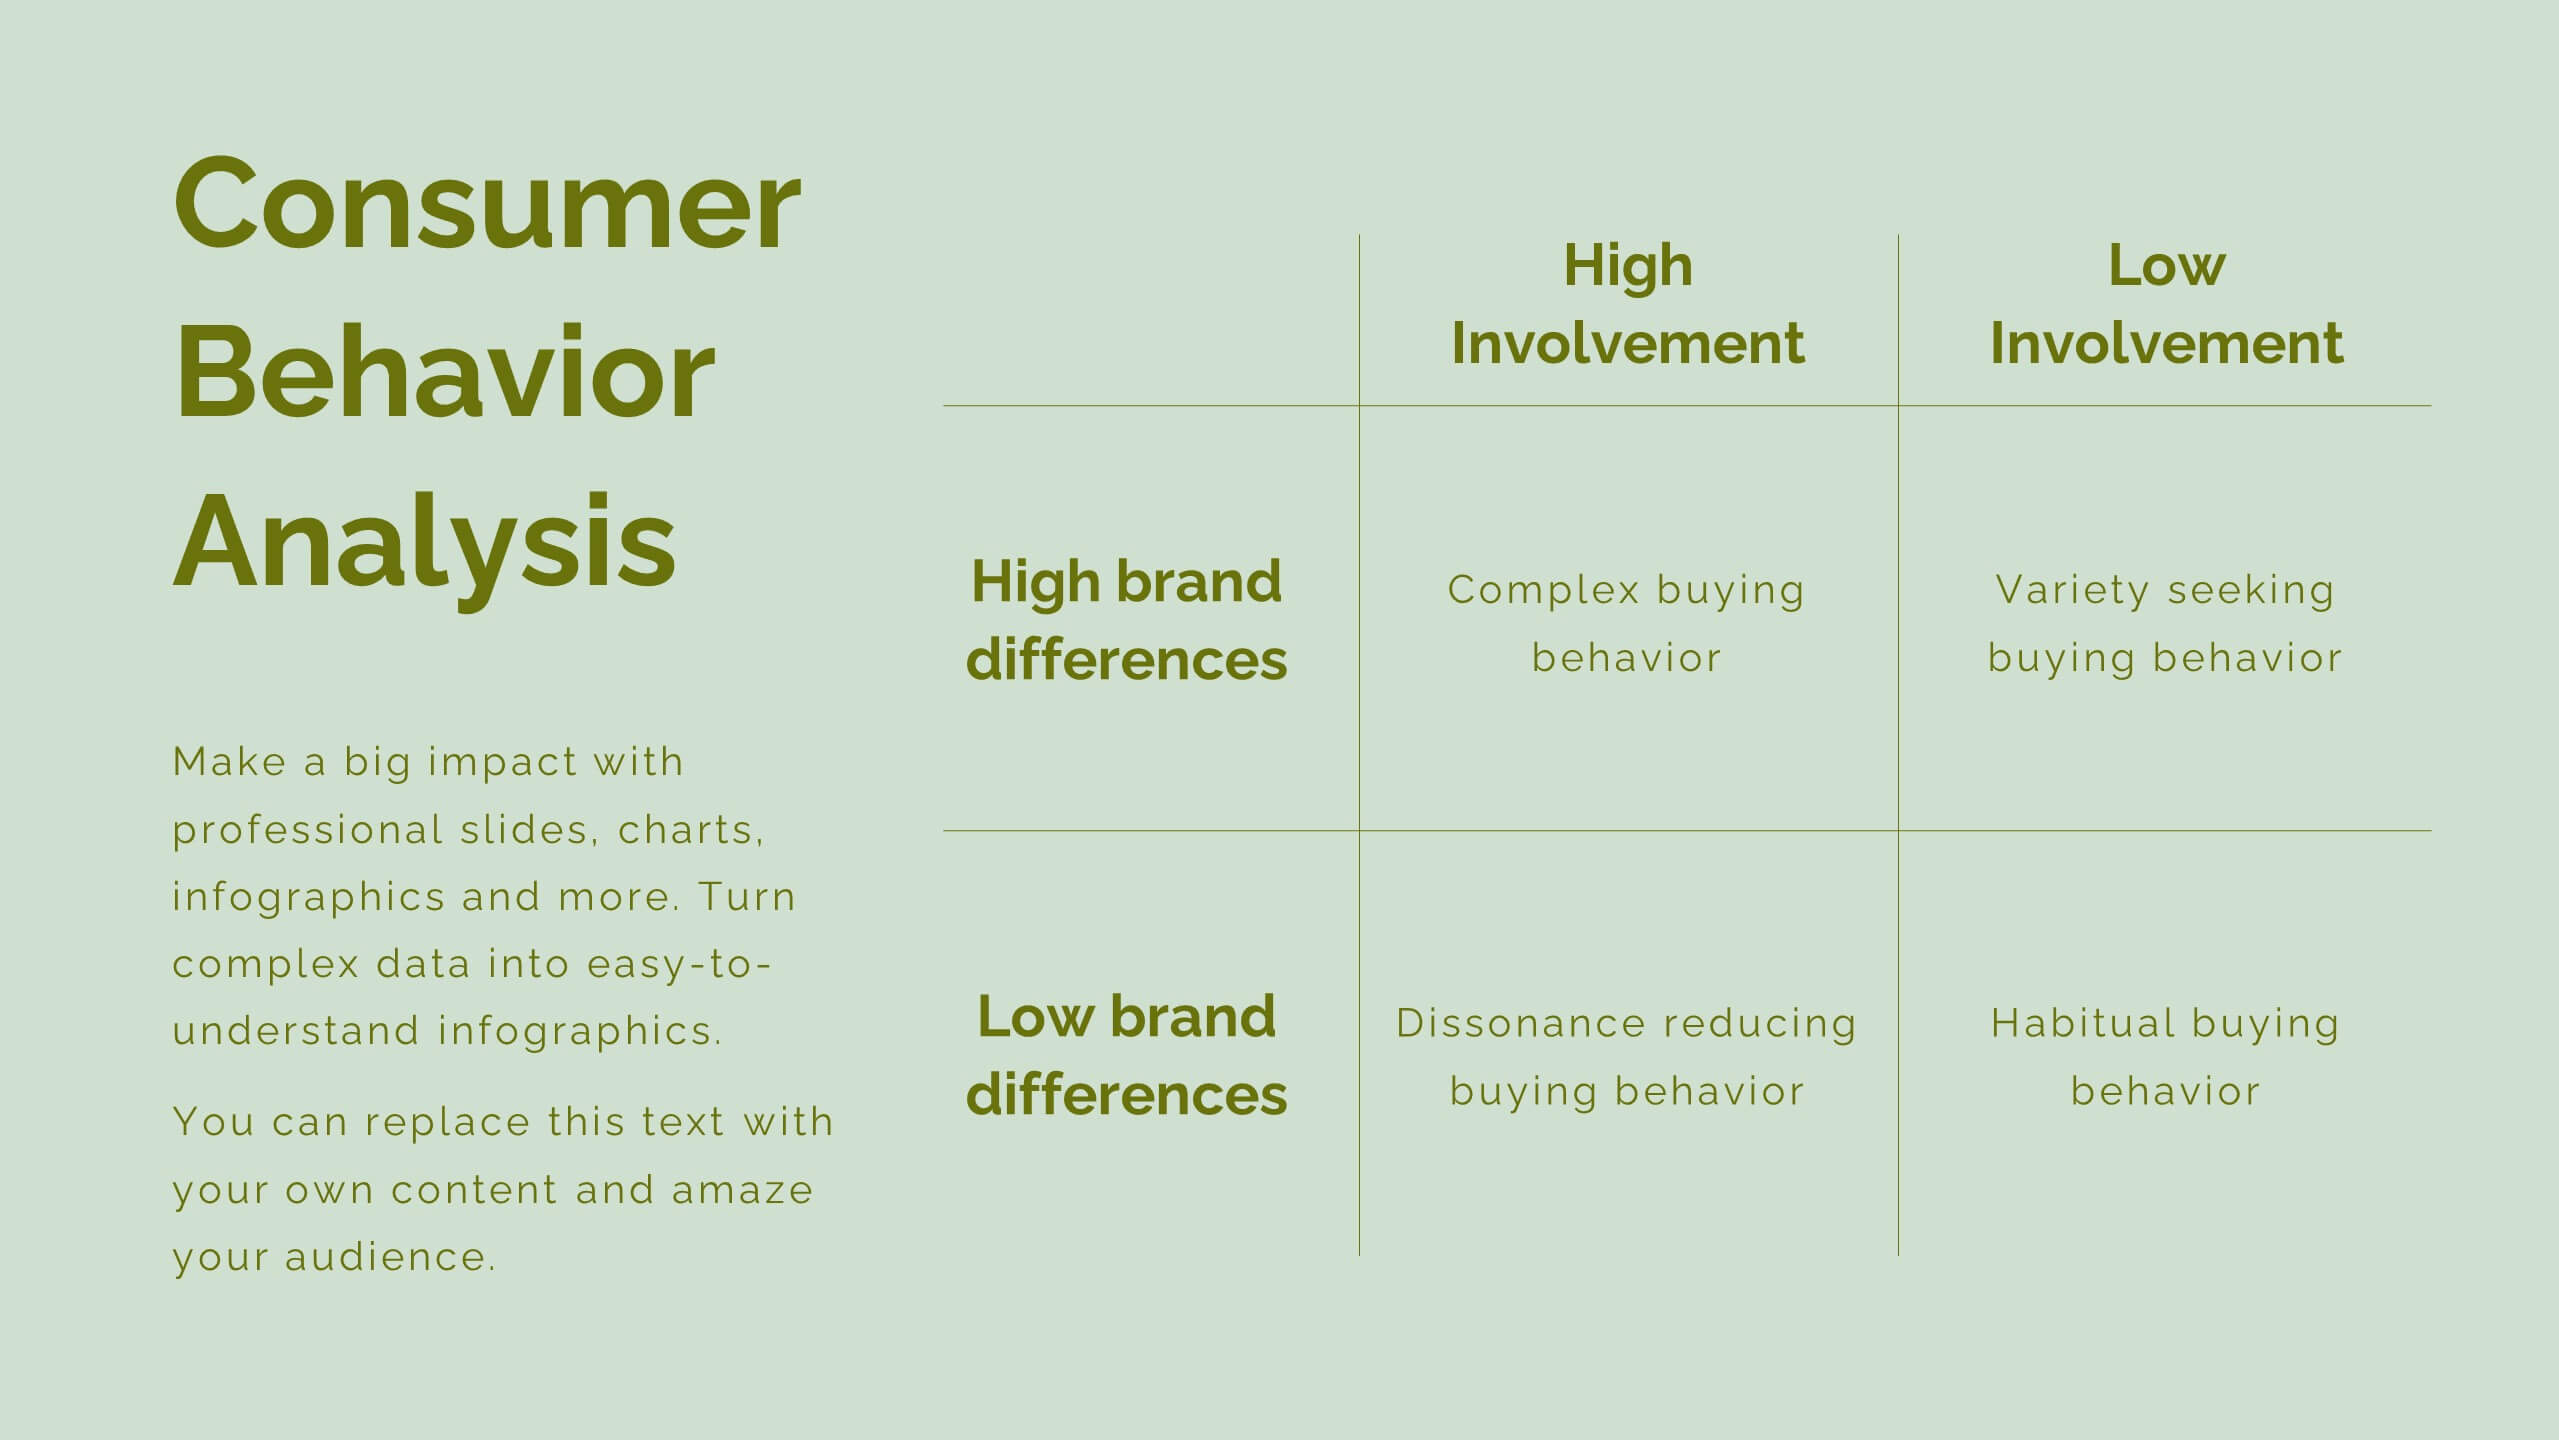
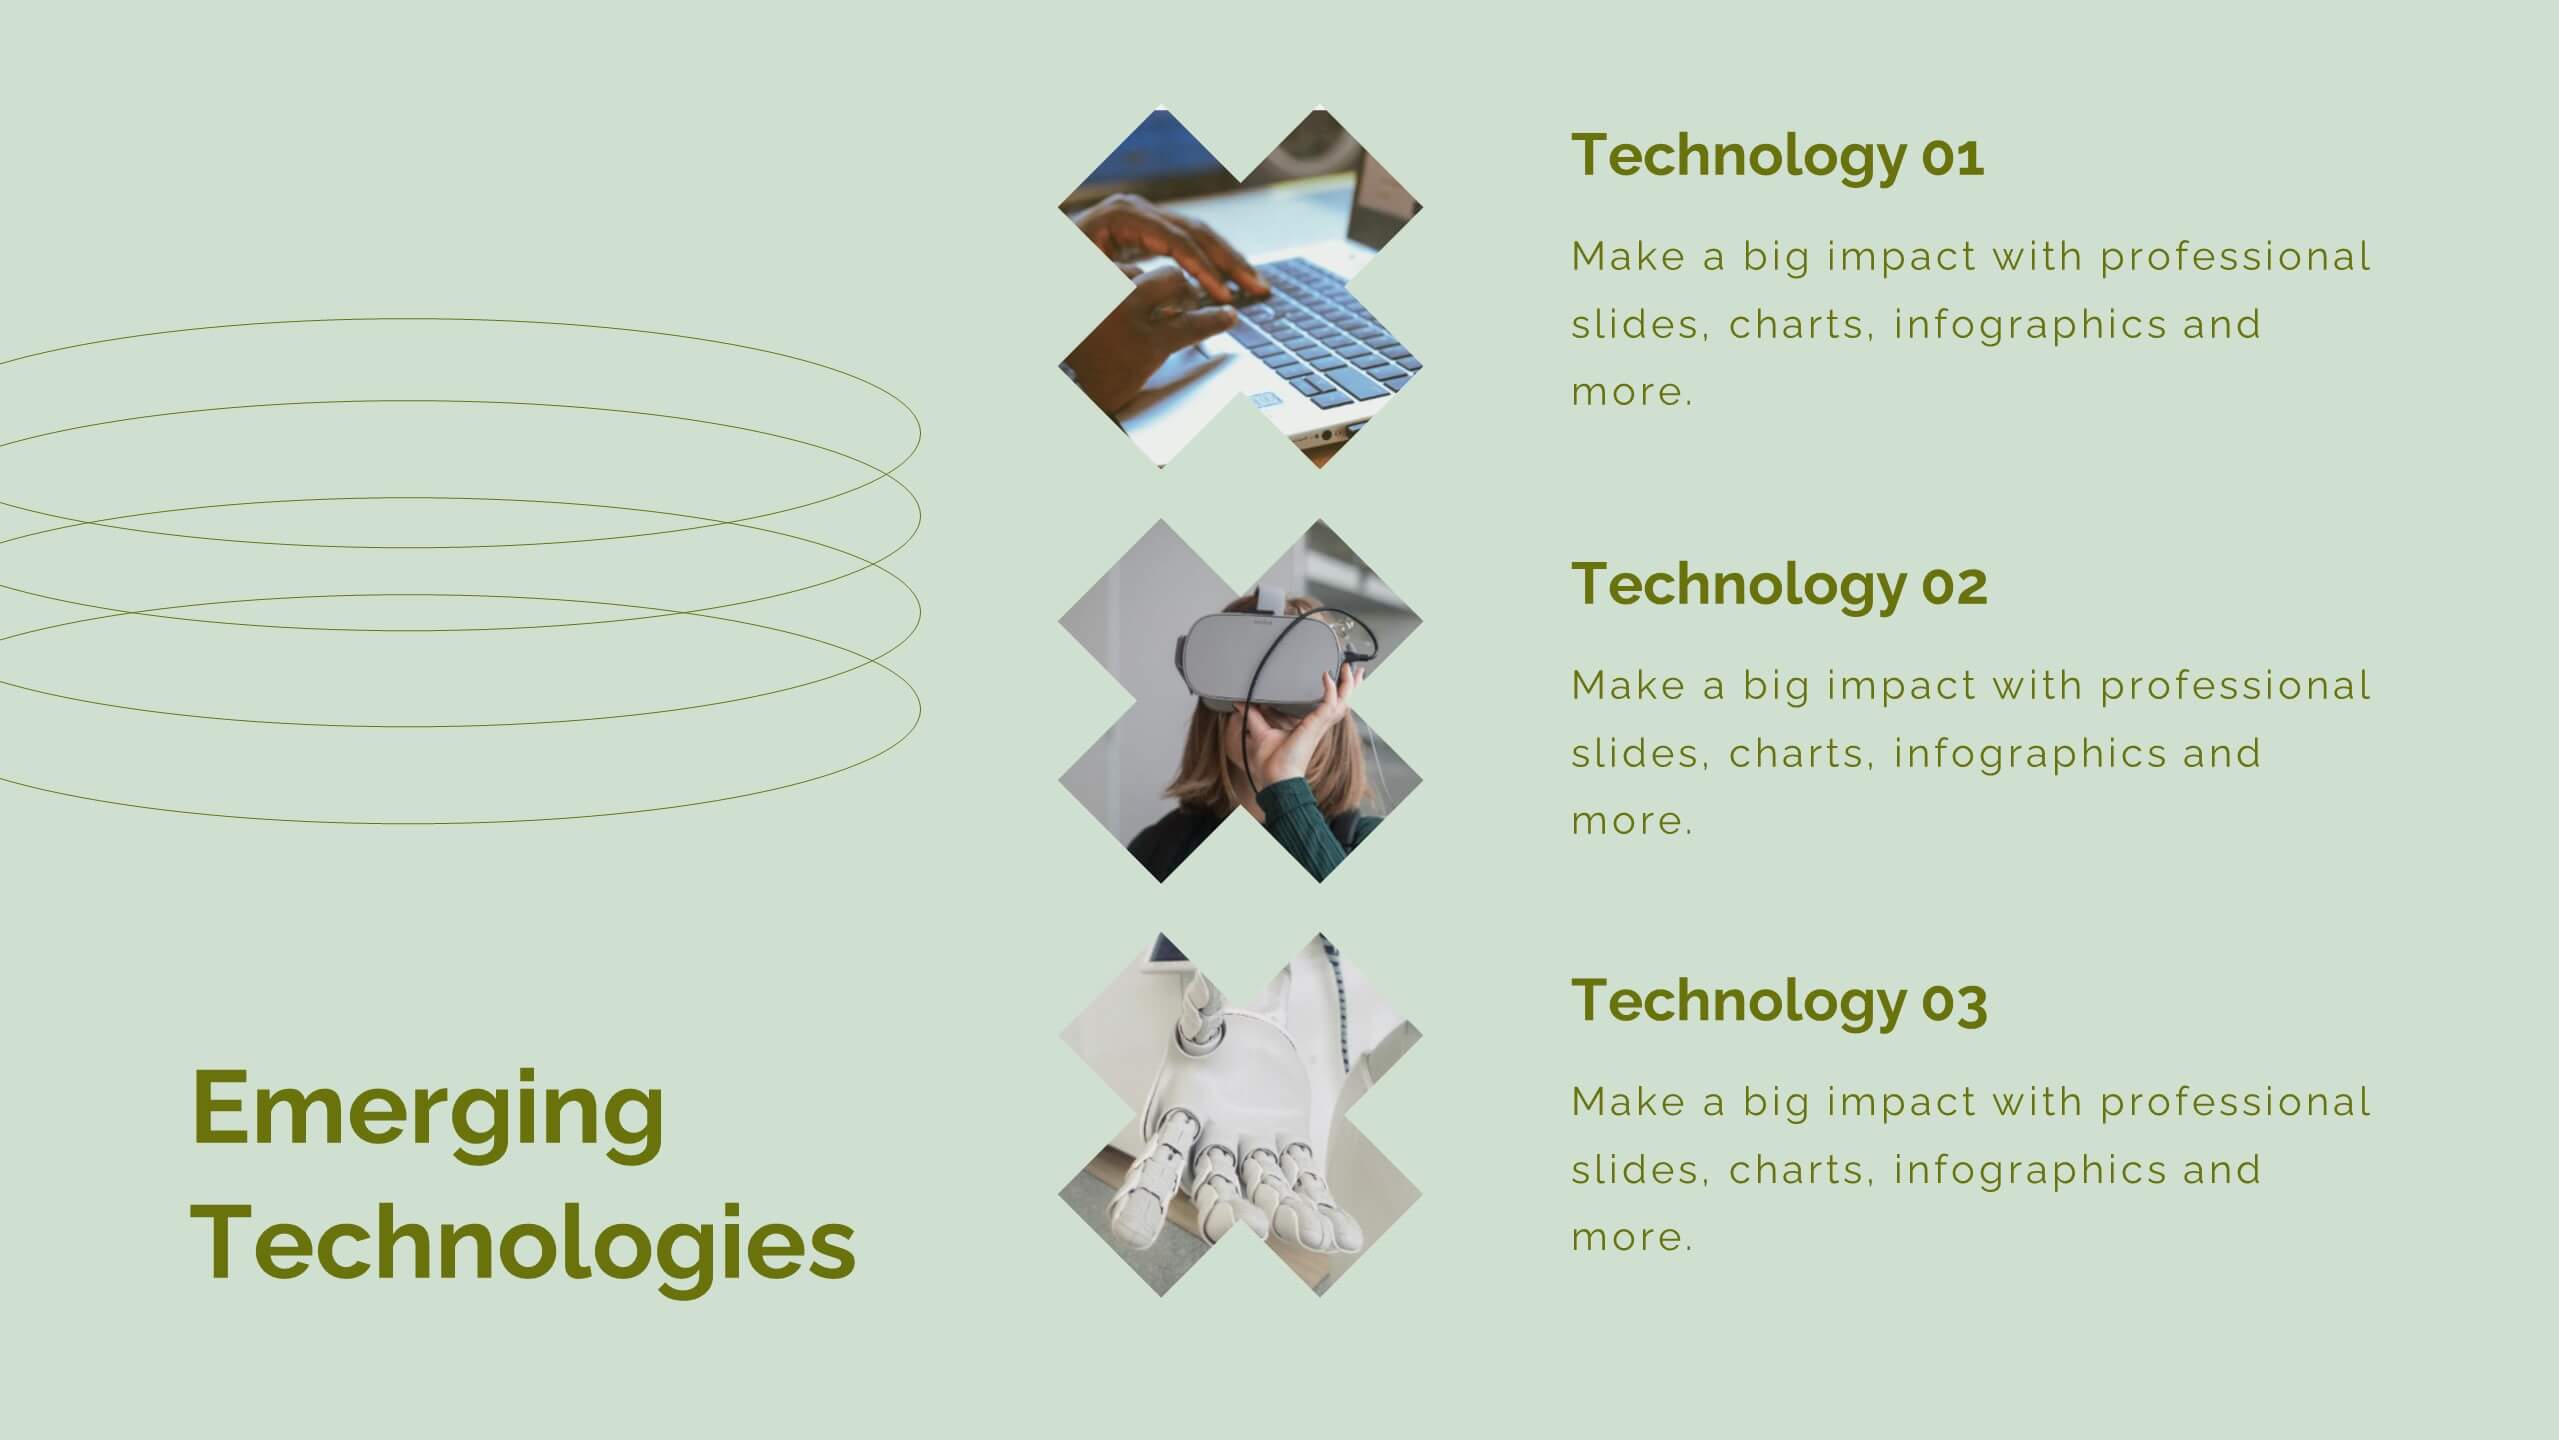
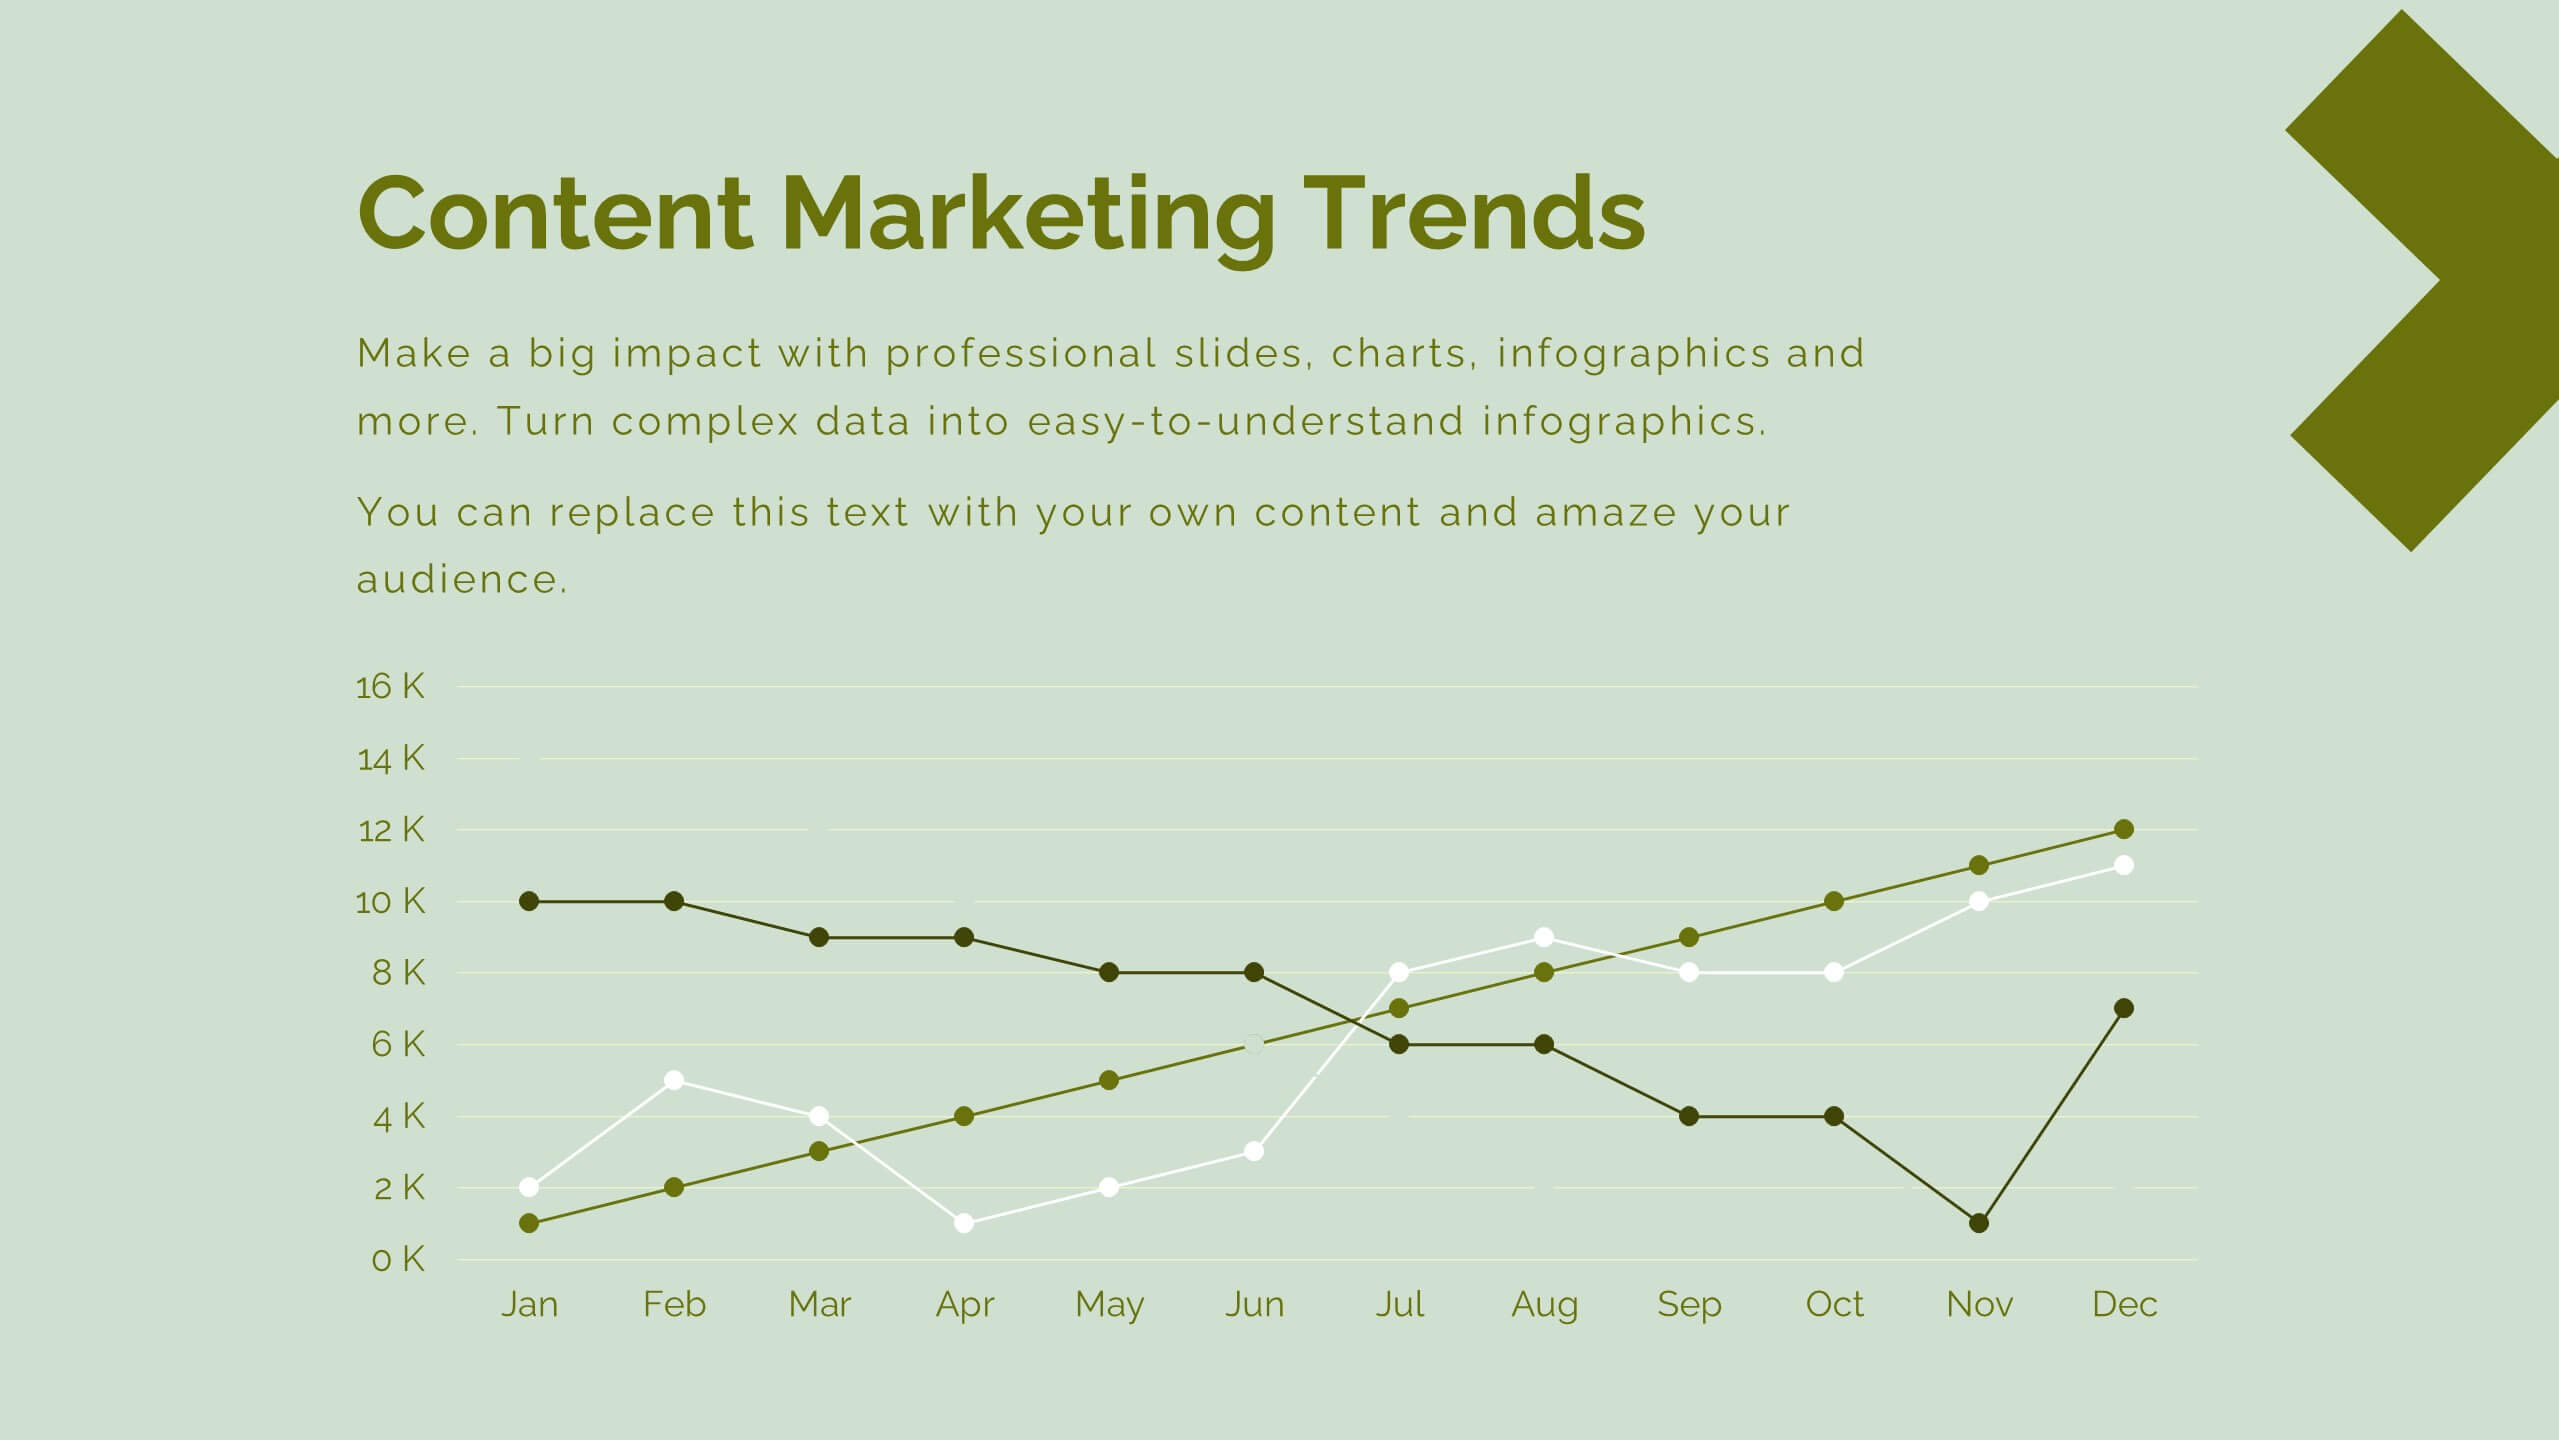
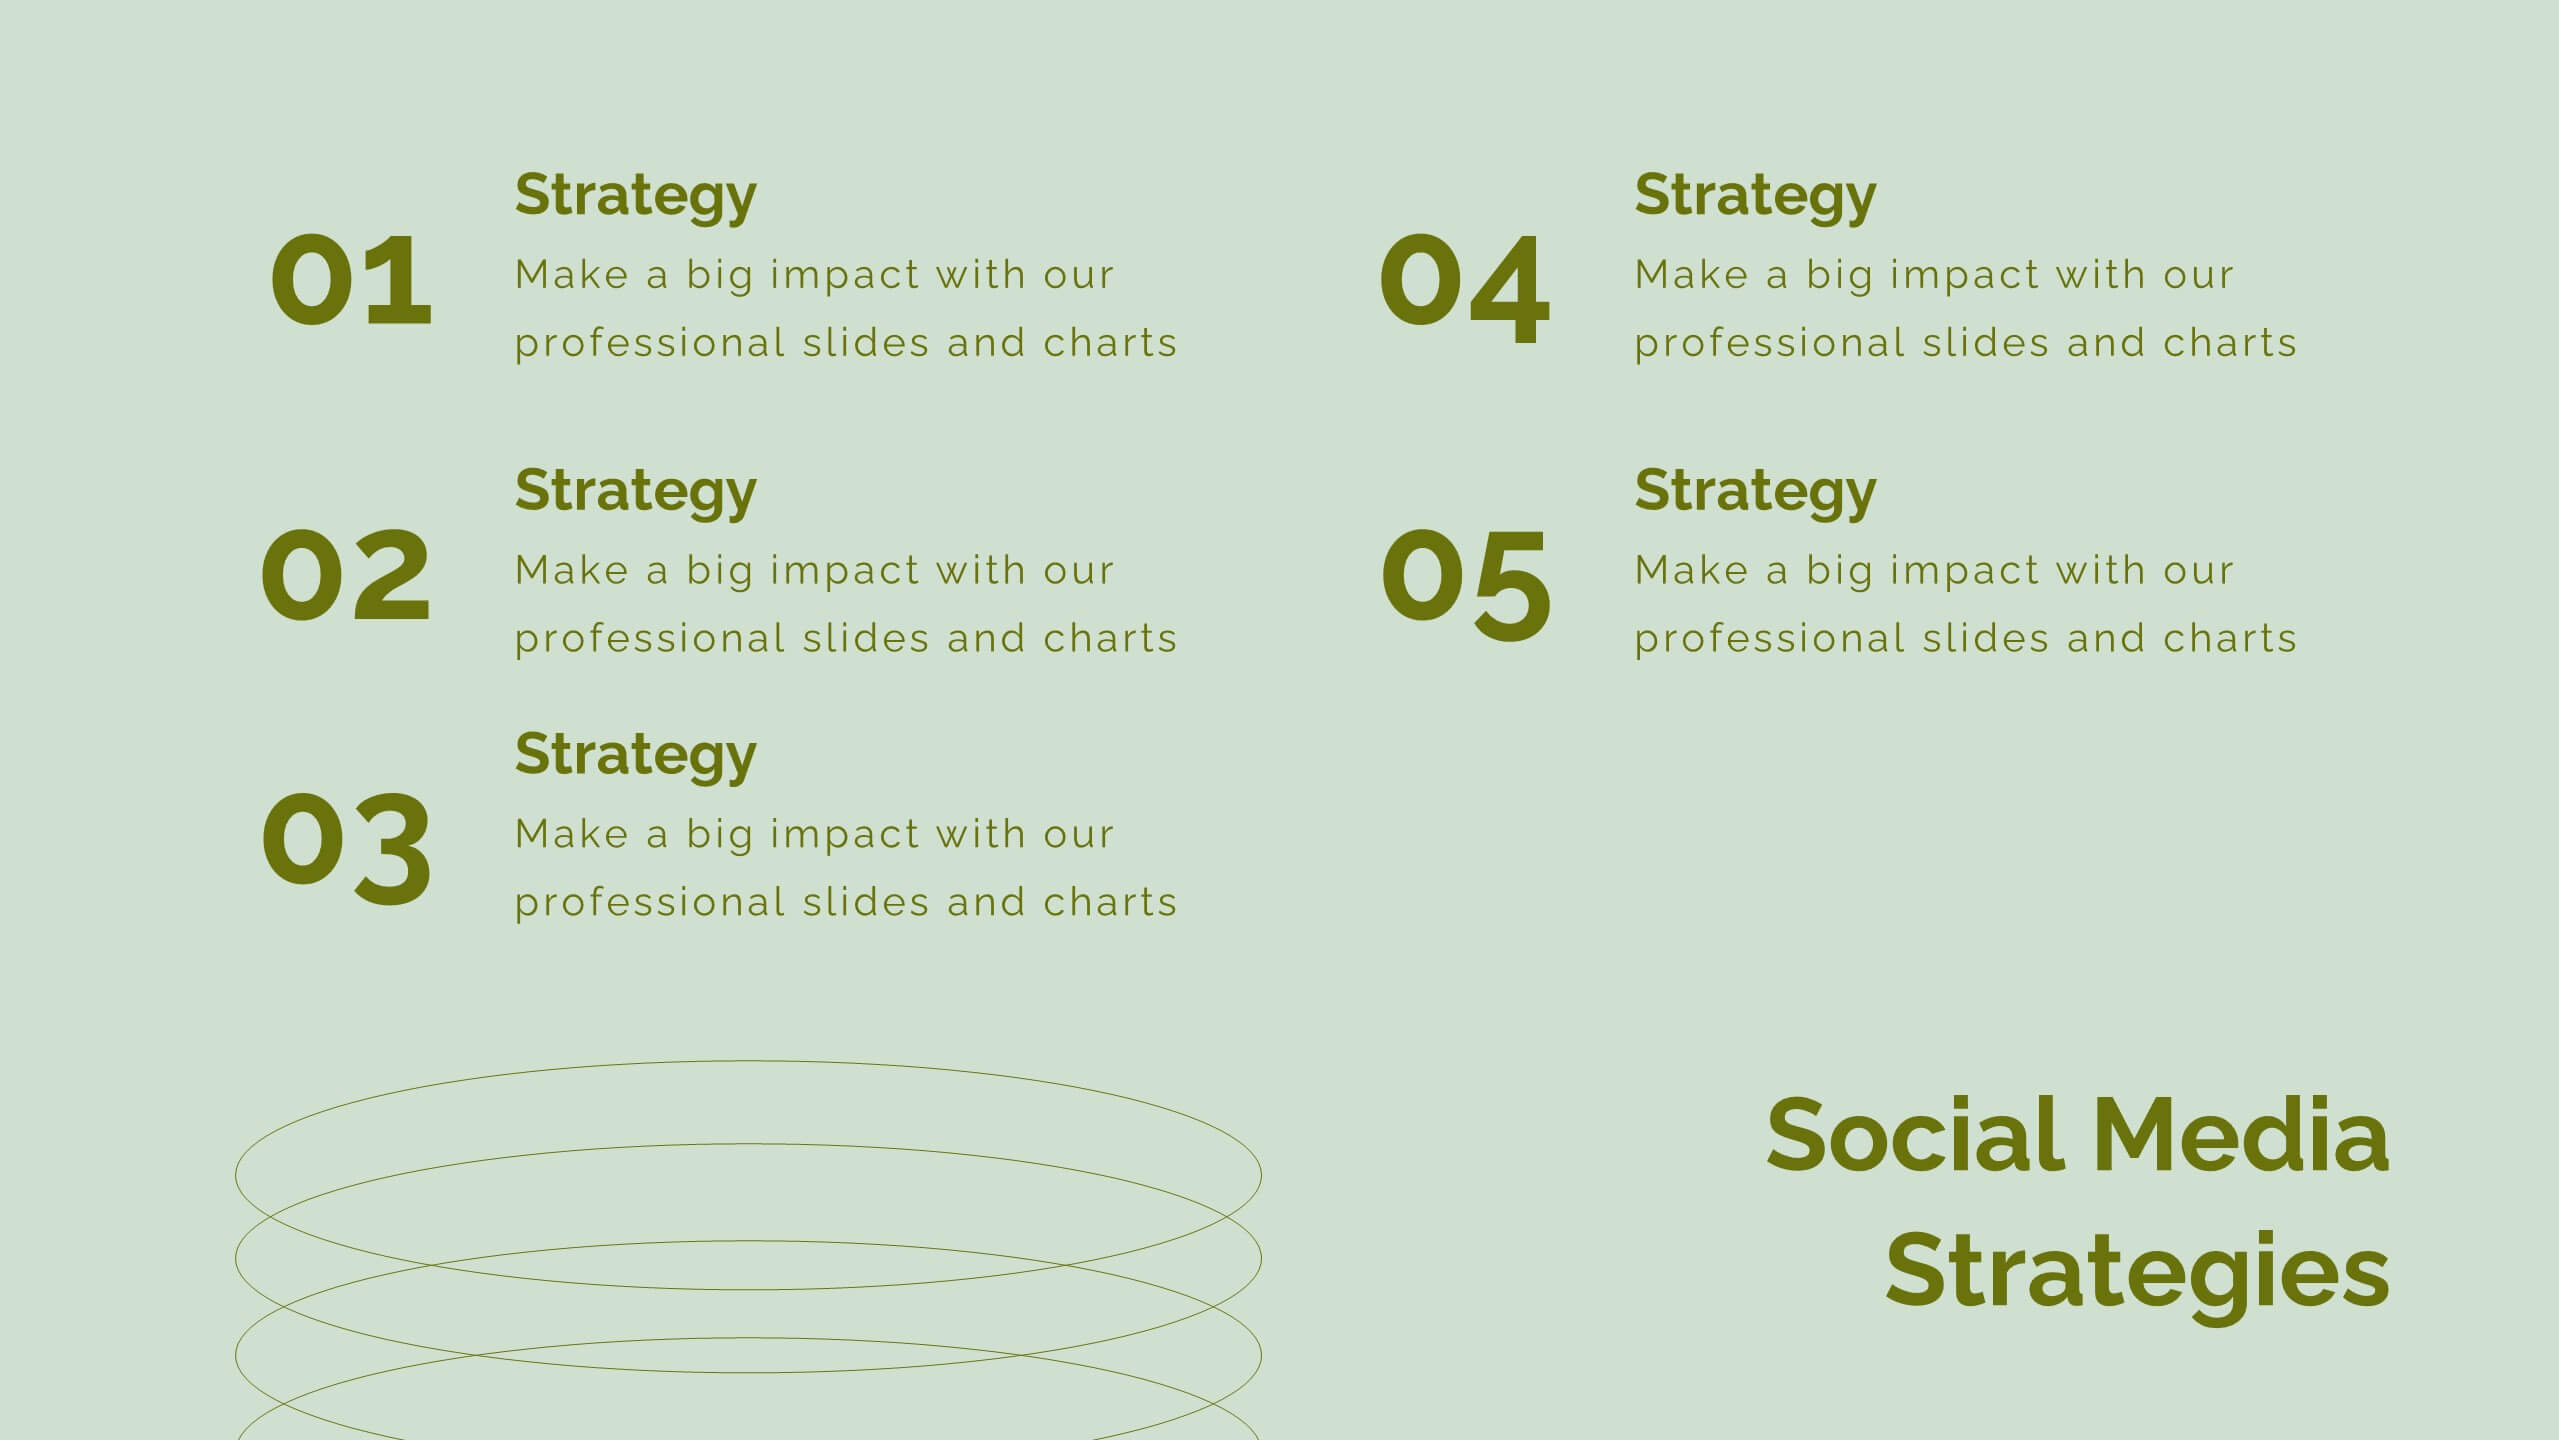
Revamp your digital marketing strategies with this dynamic template! Covering everything from industry overviews and consumer behavior analysis to emerging technologies and social media strategies, this template has it all. Perfect for creating compelling presentations that highlight data-driven marketing and brand storytelling. Compatible with PowerPoint, Keynote, and Google Slides.


5 slides
Investment and Wealth Planning Presentation
Visualize your financial strategy with this creative piggy bank diagram layout. Each quadrant highlights a different element of your investment plan—from savings and risk management to asset growth and long-term wealth goals. Perfect for financial advisors, business consultants, or educators. Fully editable in PowerPoint, Keynote, and Google Slides for easy customization


22 slides
Starlit Agency Portfolio Presentation
The Starlit Agency Portfolio template is a sophisticated way to highlight your agency's expertise, achievements, and creative vision! Perfect for presenting to potential clients or partners, this template starts with a polished introduction and an "About Us" section that clearly defines your agency's mission and vision. Showcase your team's skills and services in an organized manner, making it easy for clients to understand what you offer. With slides dedicated to client success stories, case studies, and market analysis, you can build trust by displaying your proven track record. Highlight industry trends and your agency's approach to creative processes to demonstrate your strategic thinking. The template also includes sections for strategy development, campaign execution, and measurement analytics, ensuring you cover all aspects of your services. Close with client testimonials, partnership opportunities, and a future outlook, leaving your audience impressed. This template is fully compatible with PowerPoint, Keynote, and Google Slides, making it versatile and easy to use for any presentation.