


Features
- 3 Unique slides
- Fully editable and easy to edit in Microsoft Powerpoint, Keynote and Google Slides
- 16:9 widescreen layout
- Clean and professional designs
- Export to JPG, PDF or send by email


Do you have any questions?
Recommend


26 slides
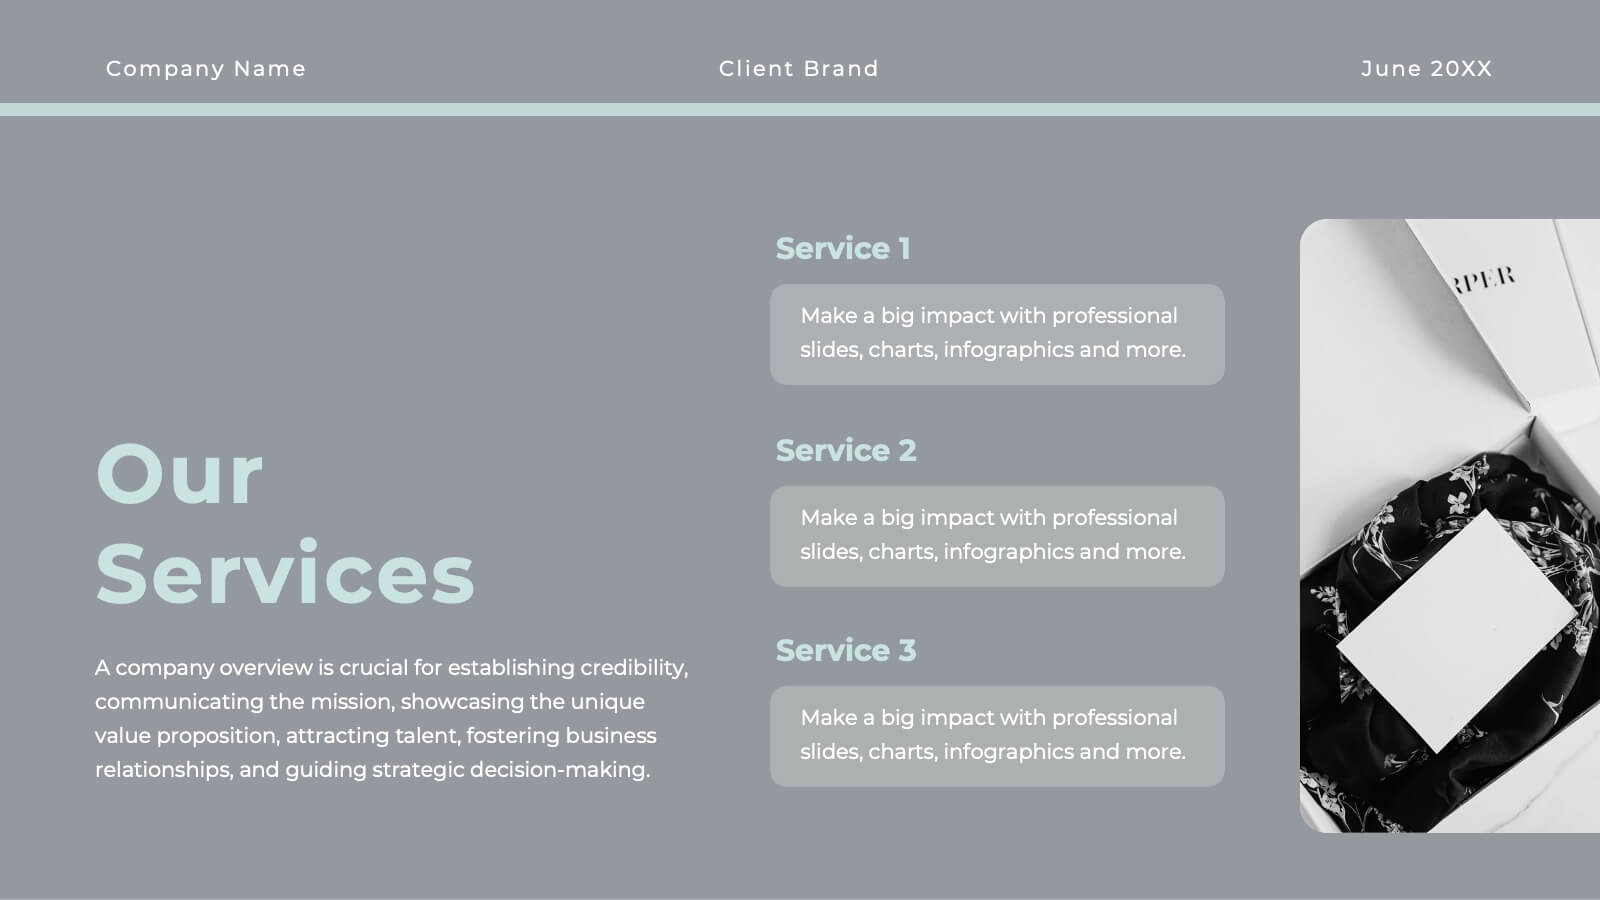
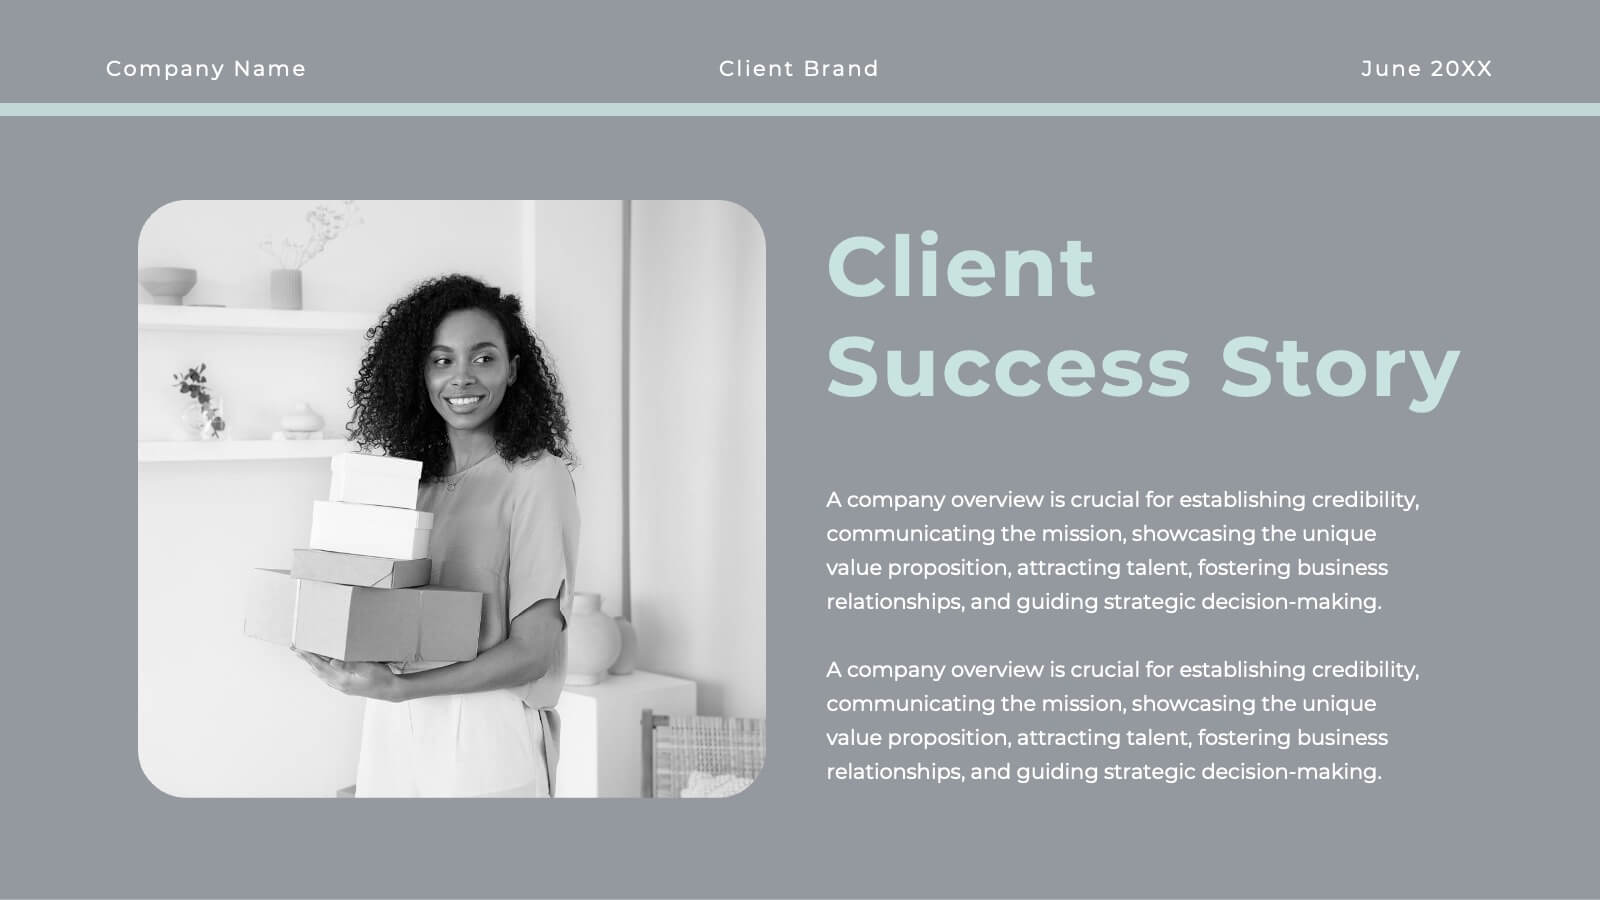
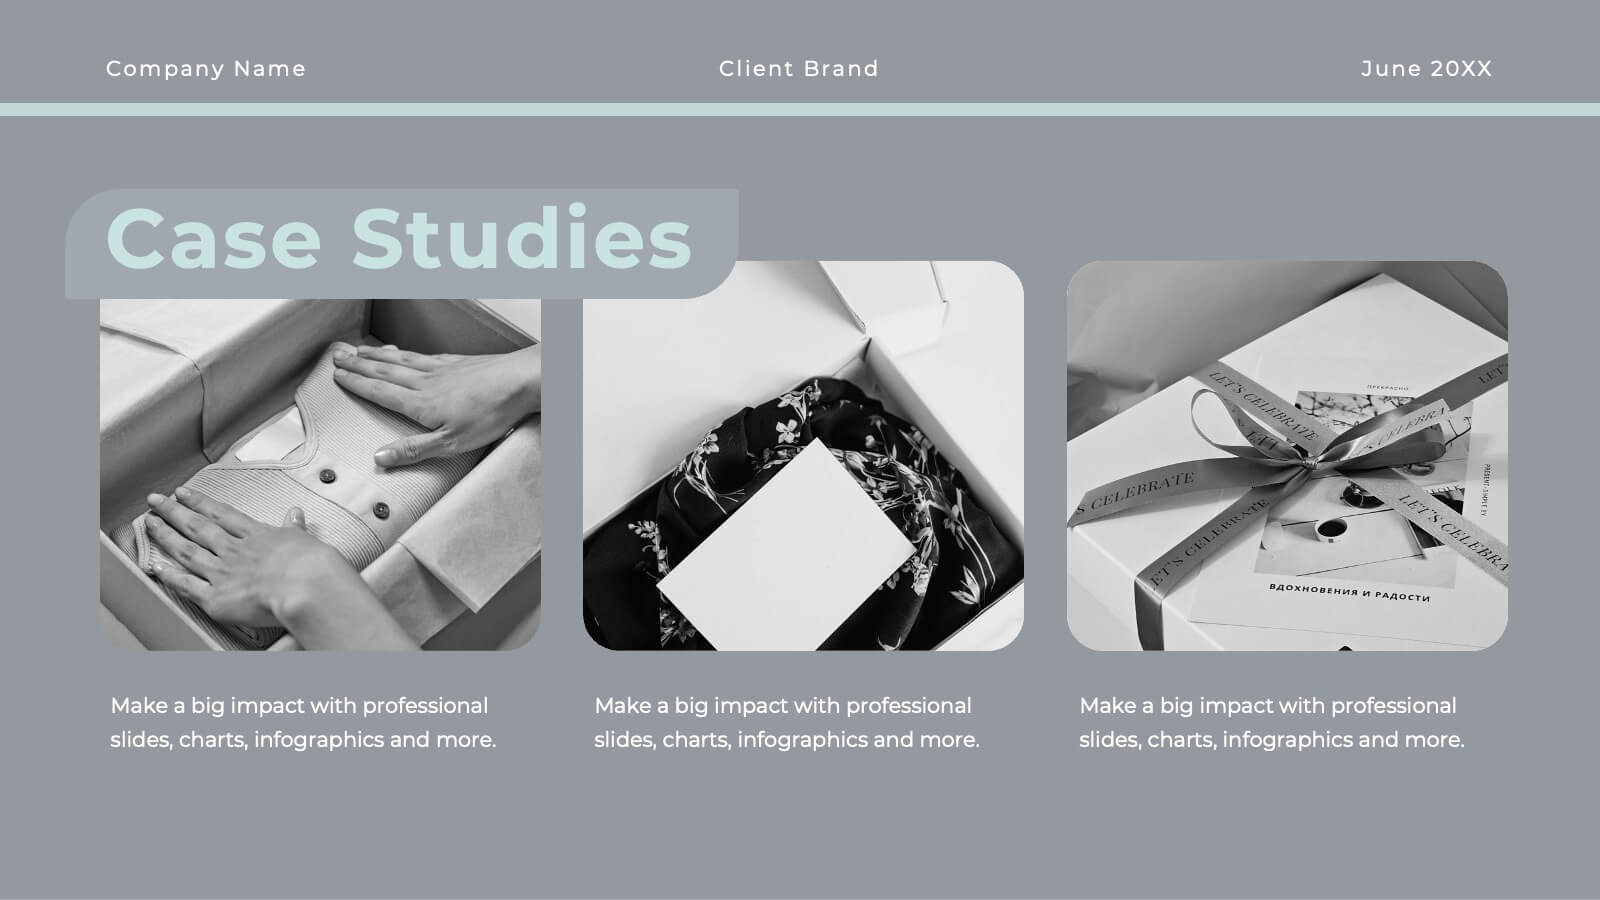
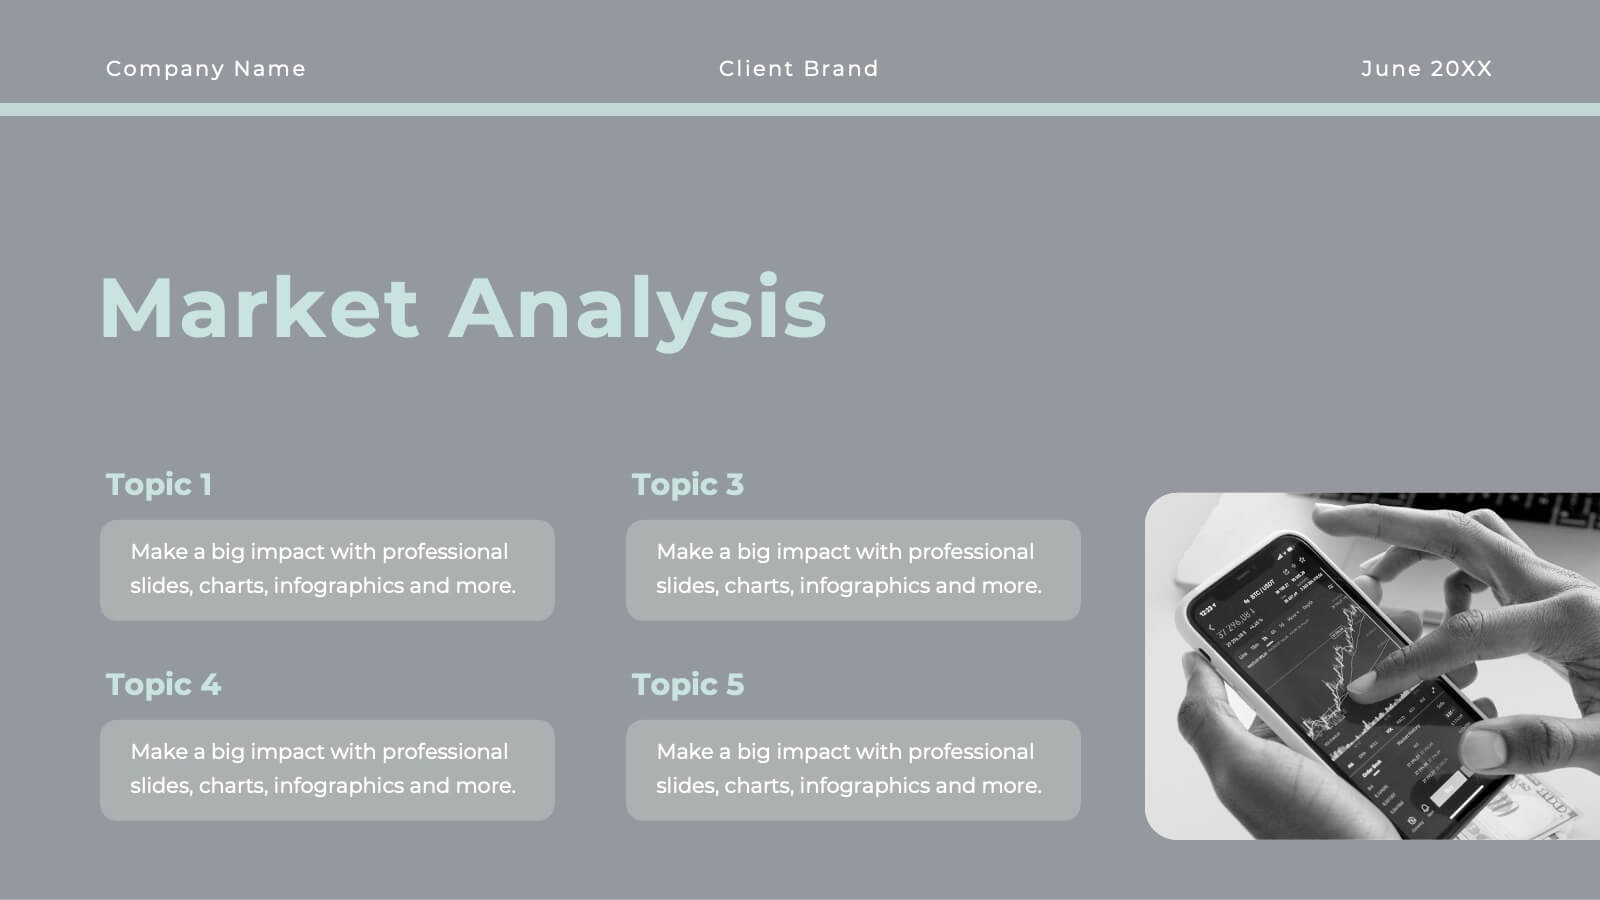
Branding Agency Company Profile Presentation
Branding for a digital agency is essential for creating a strong and memorable identity that sets it apart from competitors and resonates with its target audience. This presentation is a professional template, designed to showcase the expertise and capabilities of a branding agency. With its modern and sleek design, this presentation is perfect for introducing the agency's services, achievements, and client success stories to potential clients, partners, or investors. This template is perfect to showcase successful branding projects and campaigns, emphasizing the challenges faced, the creative solutions employed, and the results achieved for clients.


5 slides
Banking Security Service Infographics
Navigate the complexities of financial safety with our banking security services infographics template. Dressed in calming pastel tones of cream, blue, purple, and yellow, this invaluable tool is tailored for banking professionals, financial consultants, and cybersecurity experts. Its vertical, creative, and informative design is dense with up-to-date graphics and icons, simplifying intricate data into engaging content. Whether it's for client presentations, or internal communications, this template translates banking security concepts into visually striking, easily understandable infographics, bolstering confidence and comprehension.


8 slides
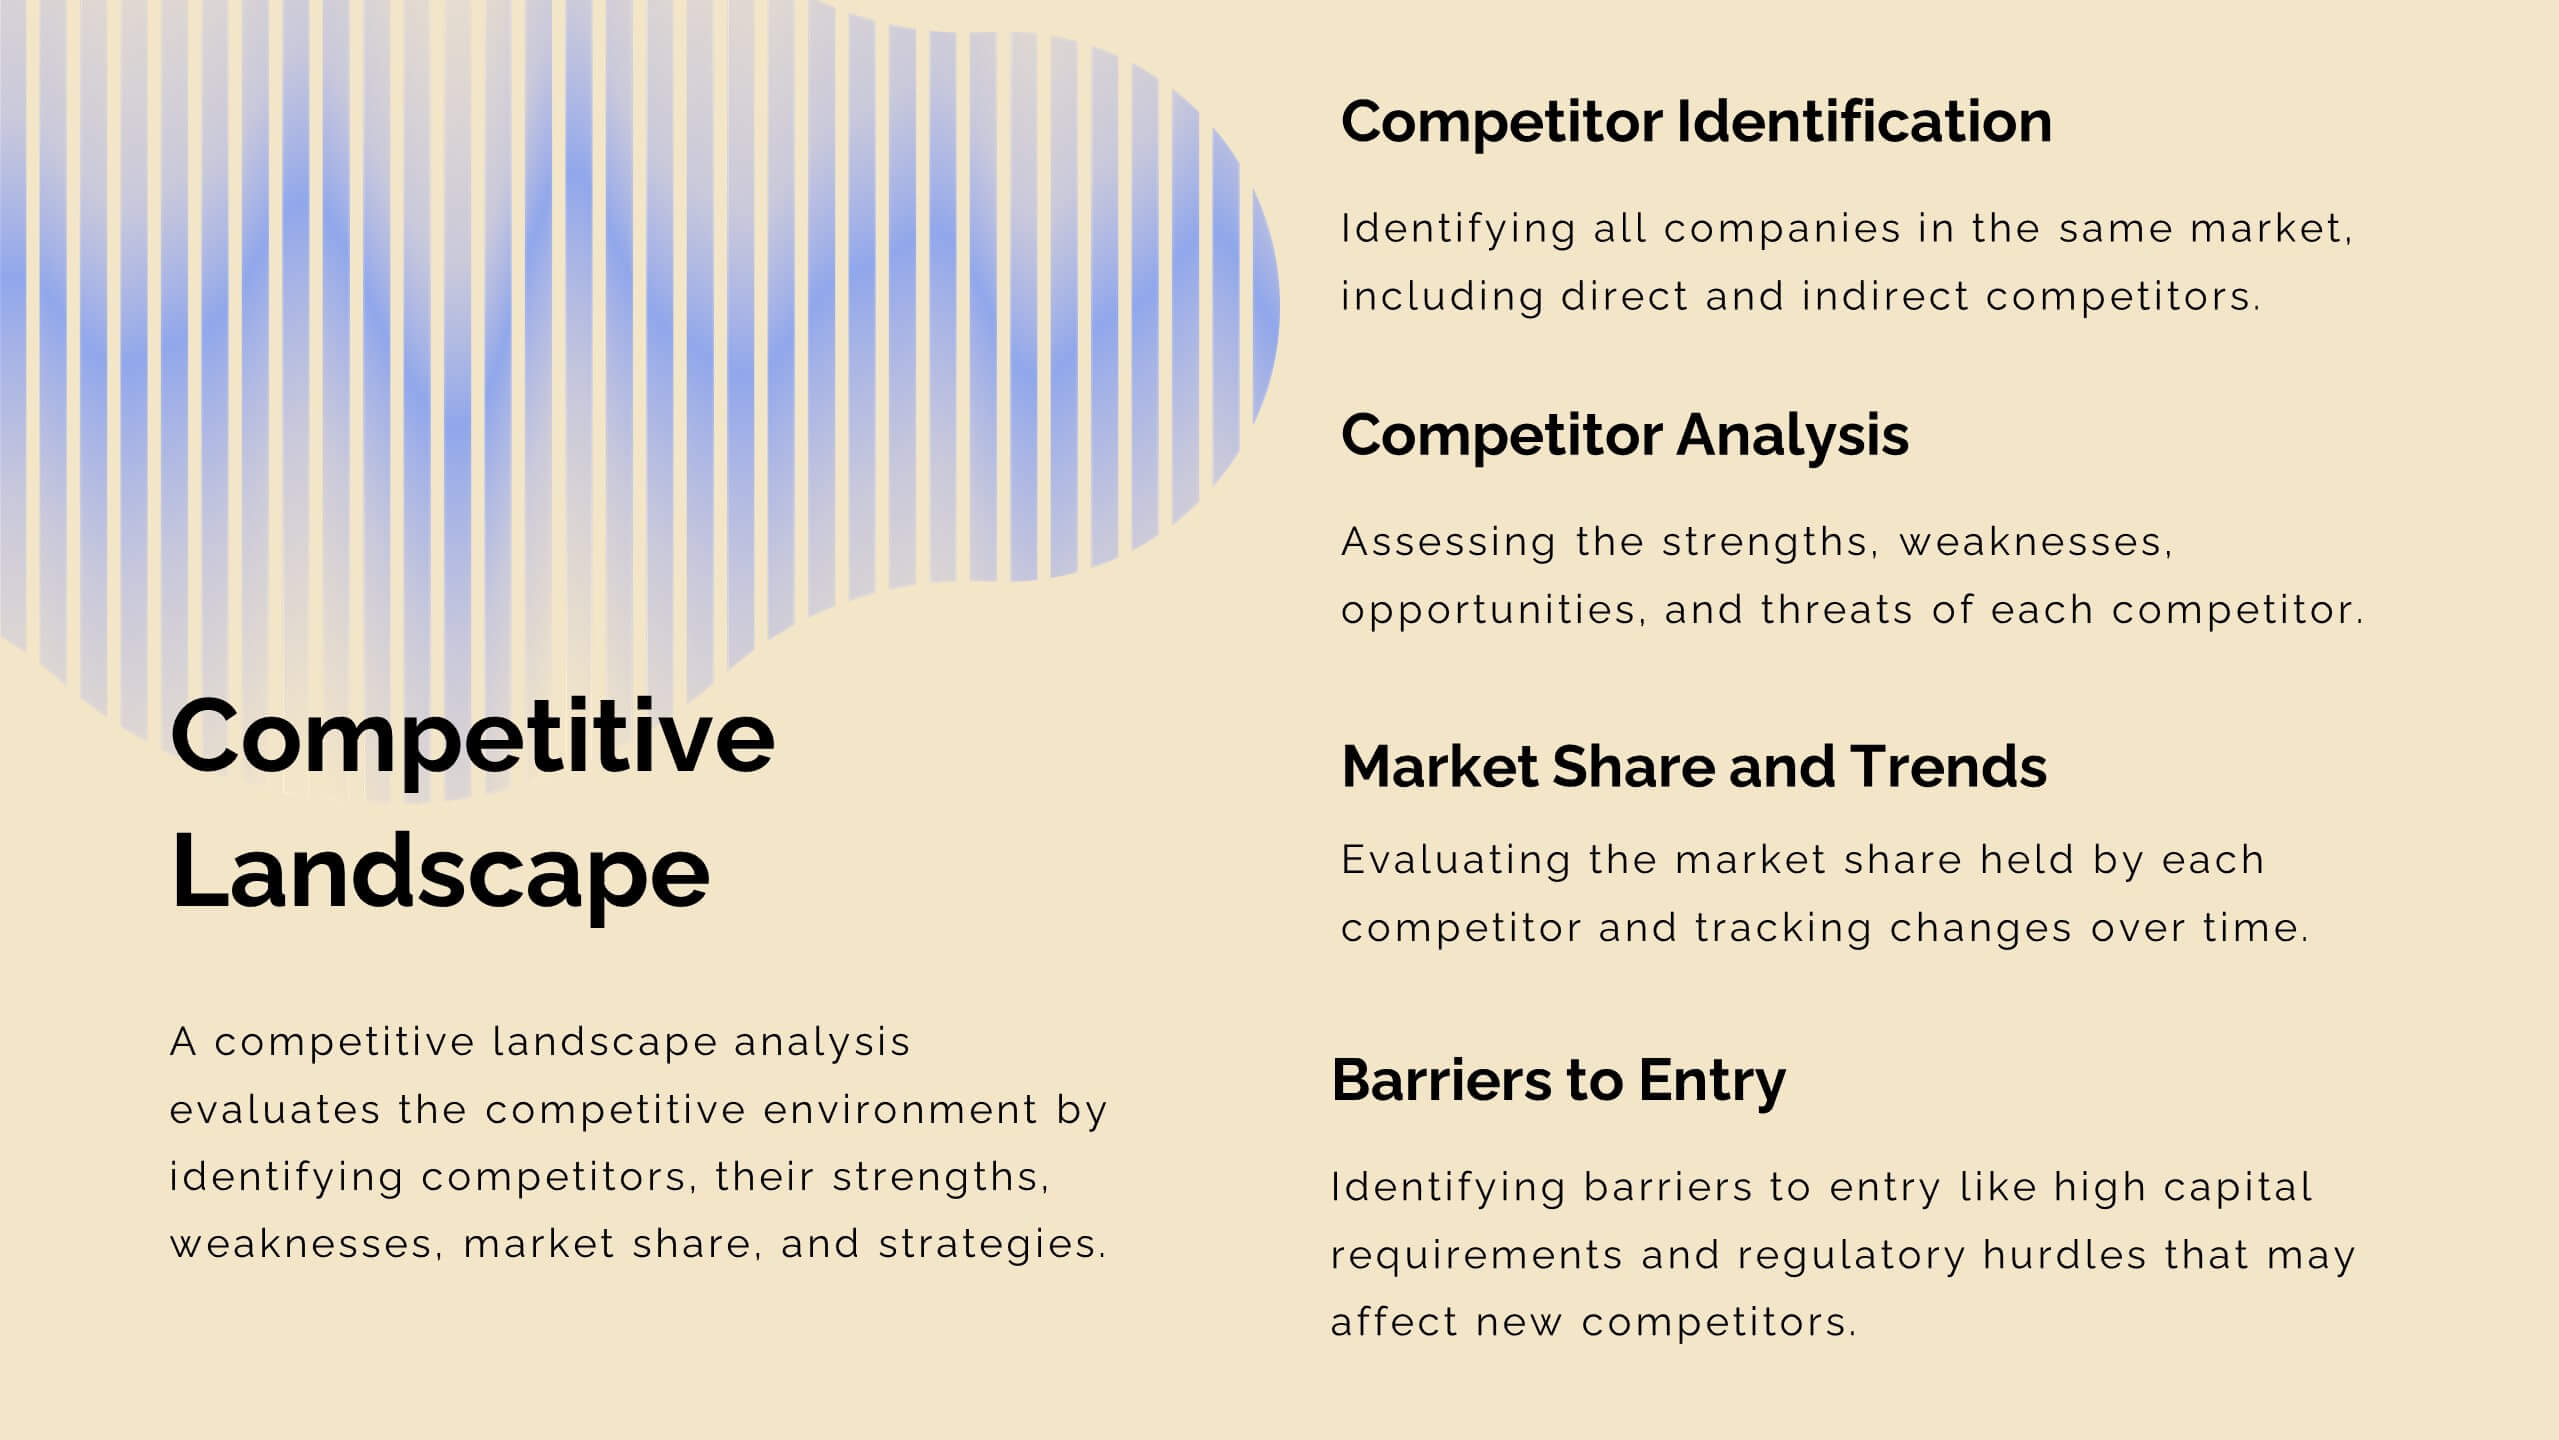
SWOT-Based Competitive Analysis
Clearly map your organization’s strengths, weaknesses, opportunities, and threats with this dynamic infographic layout. Ideal for strategic planning sessions, this template uses a continuous loop to show interconnection between internal and external factors. Fully editable in PowerPoint, Keynote, and Google Slides.

20 slides
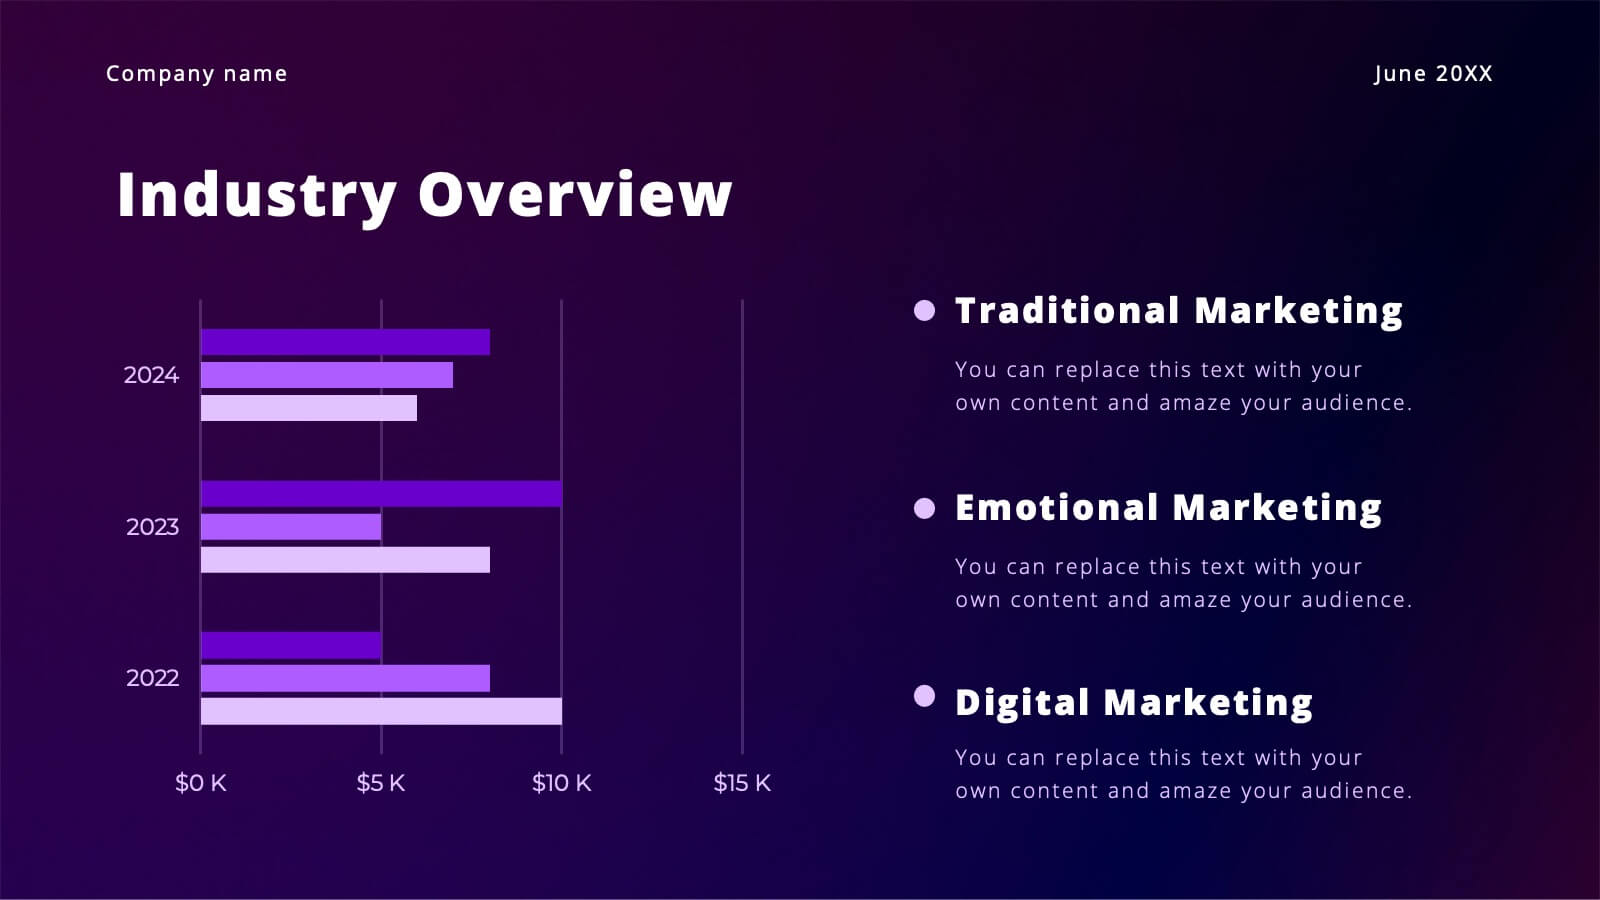
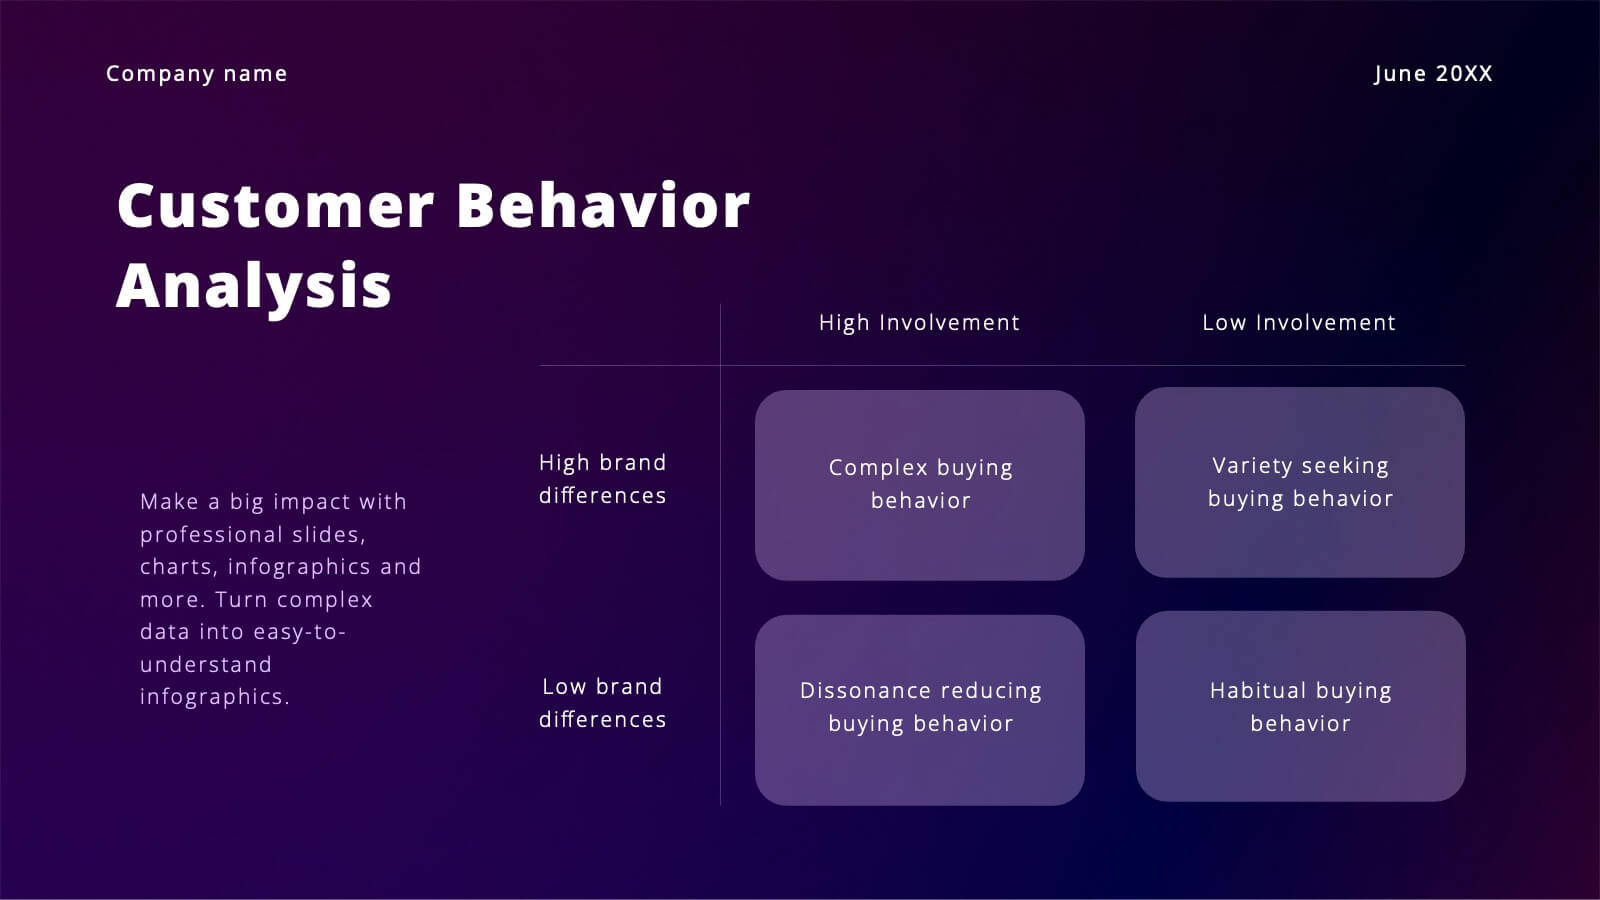
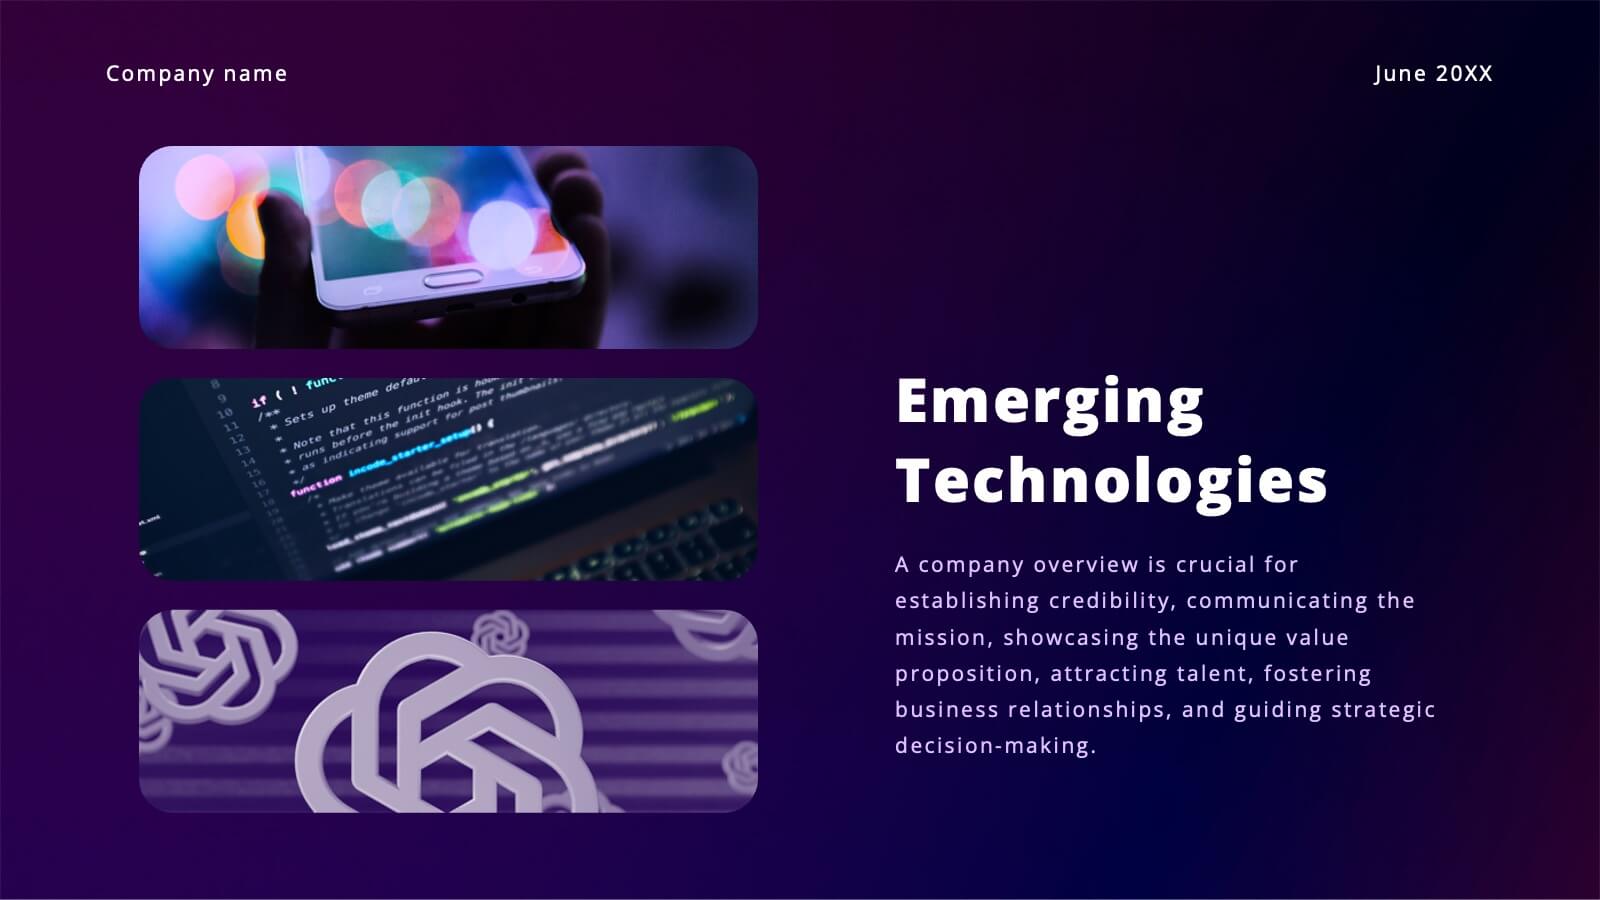
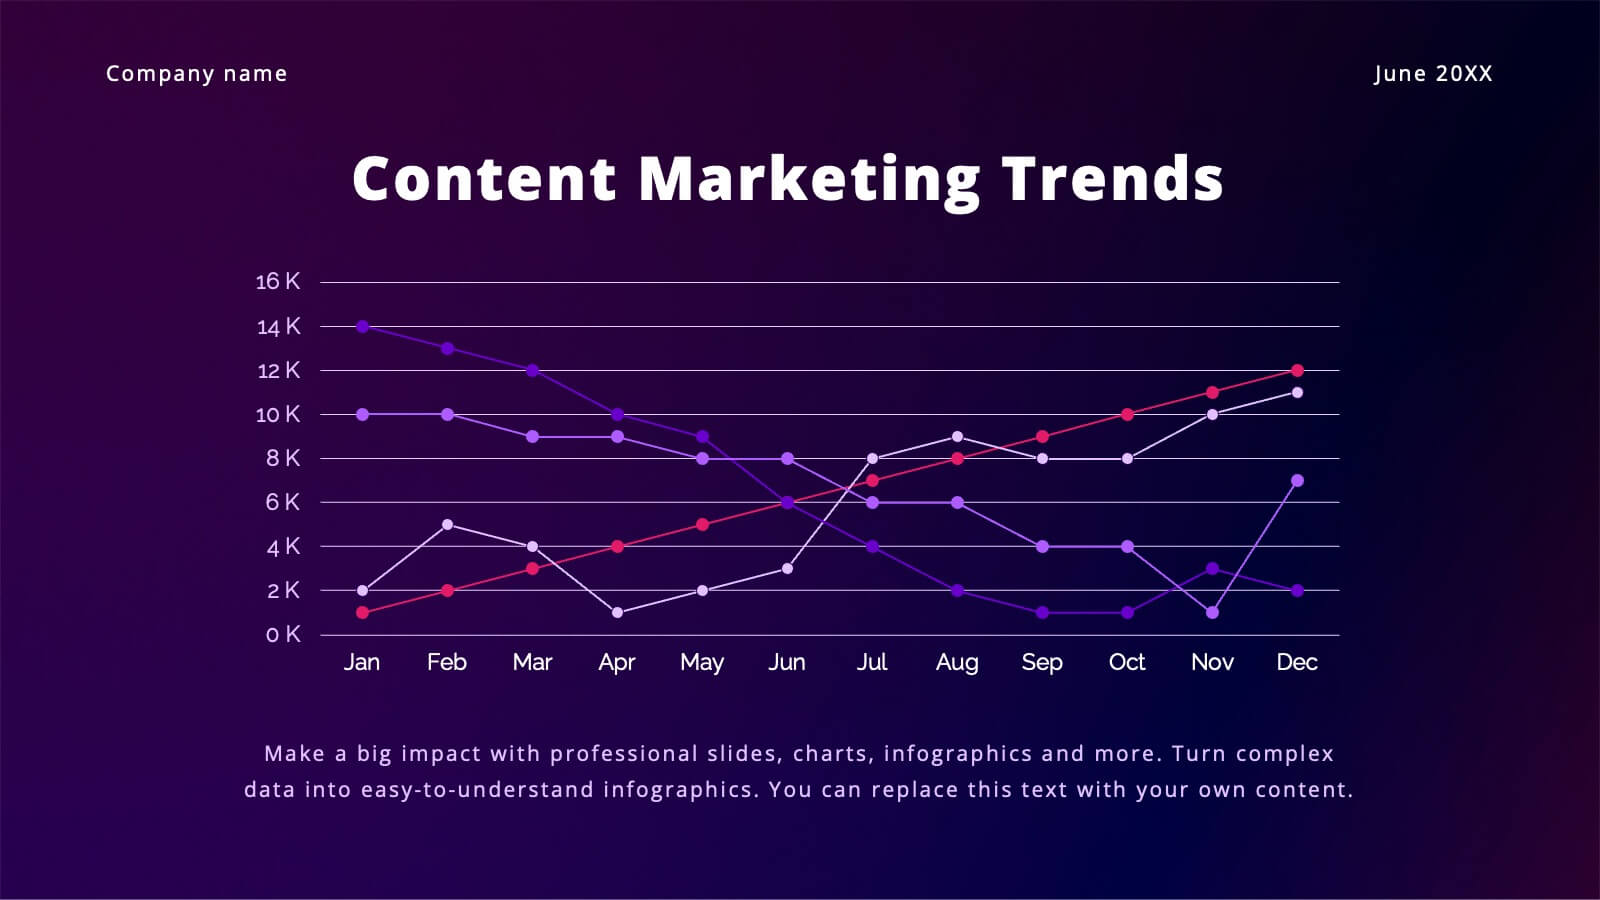
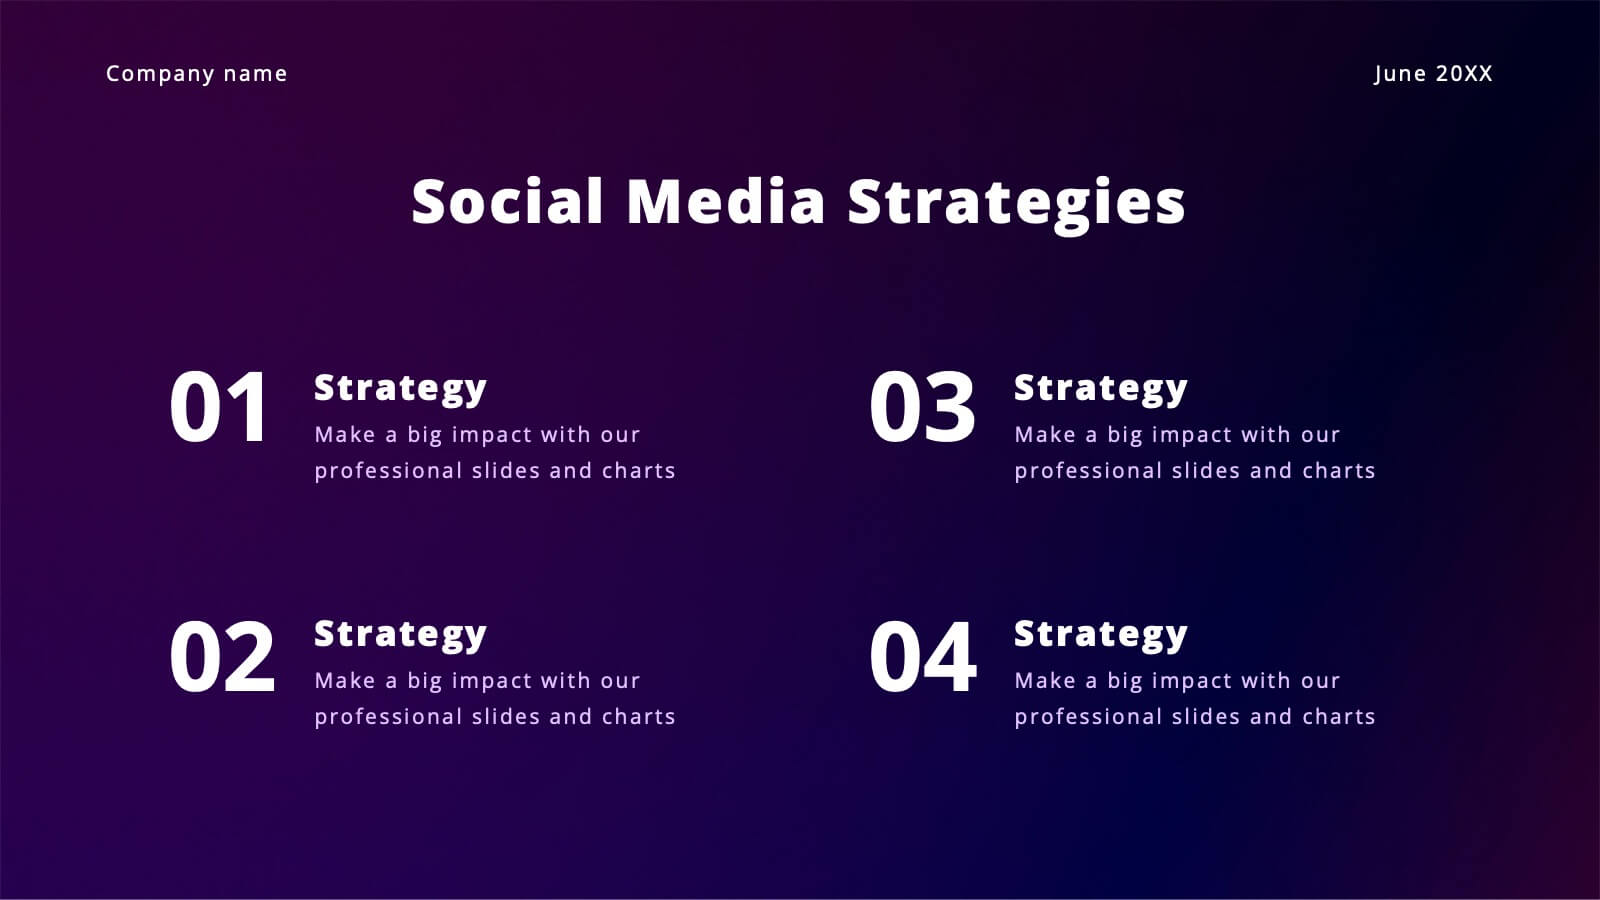
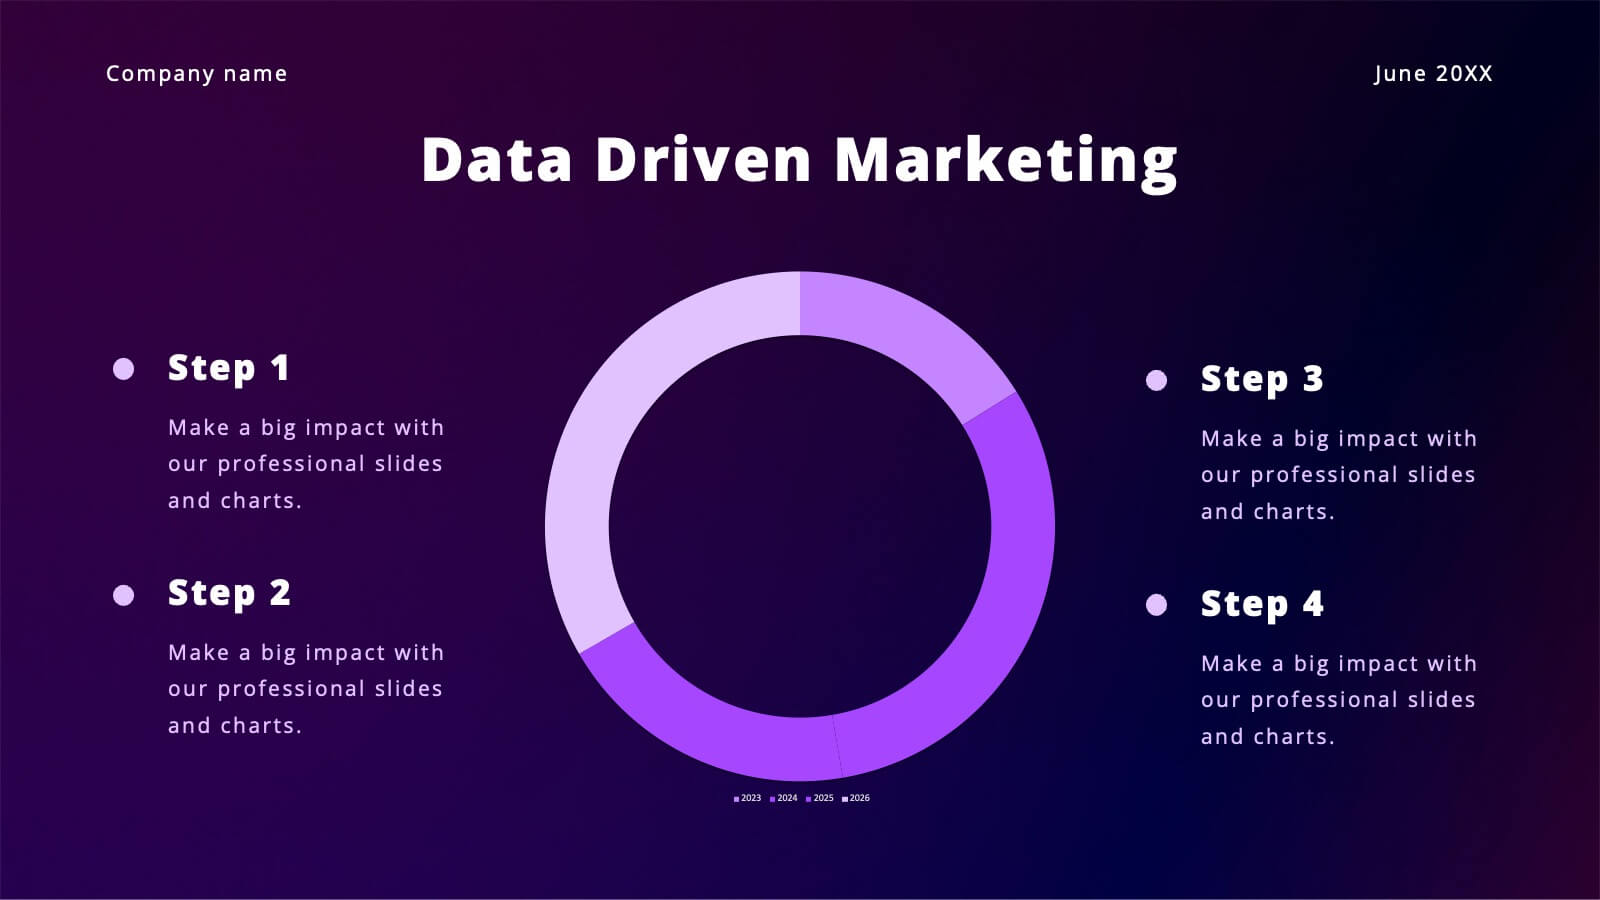
Vibrant Content Marketing Pitch Deck Presentation
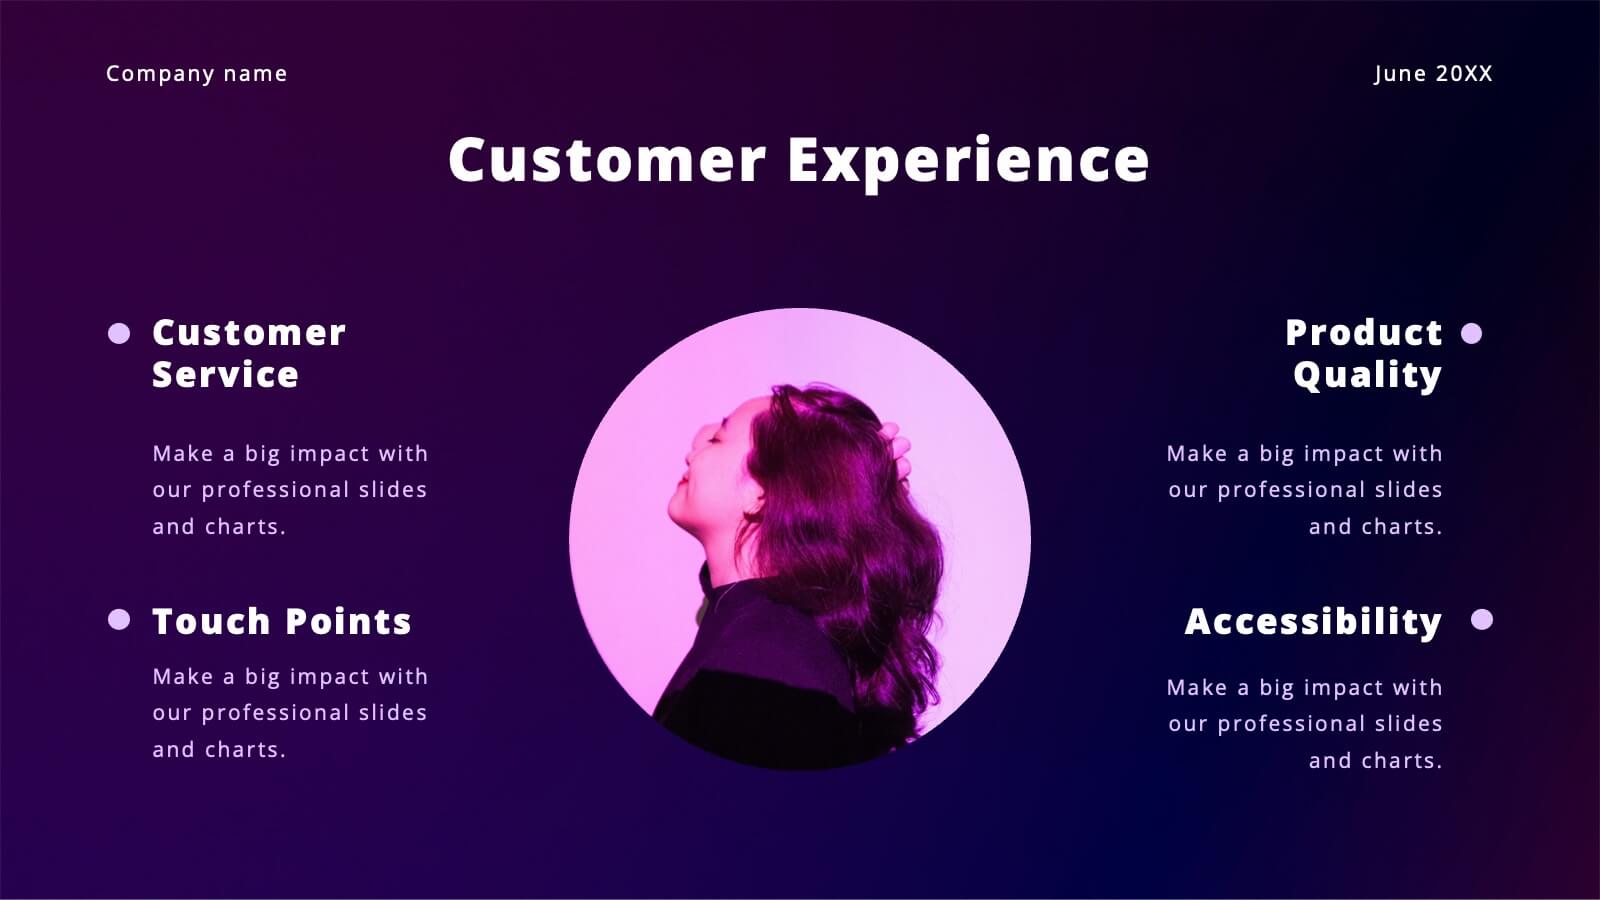
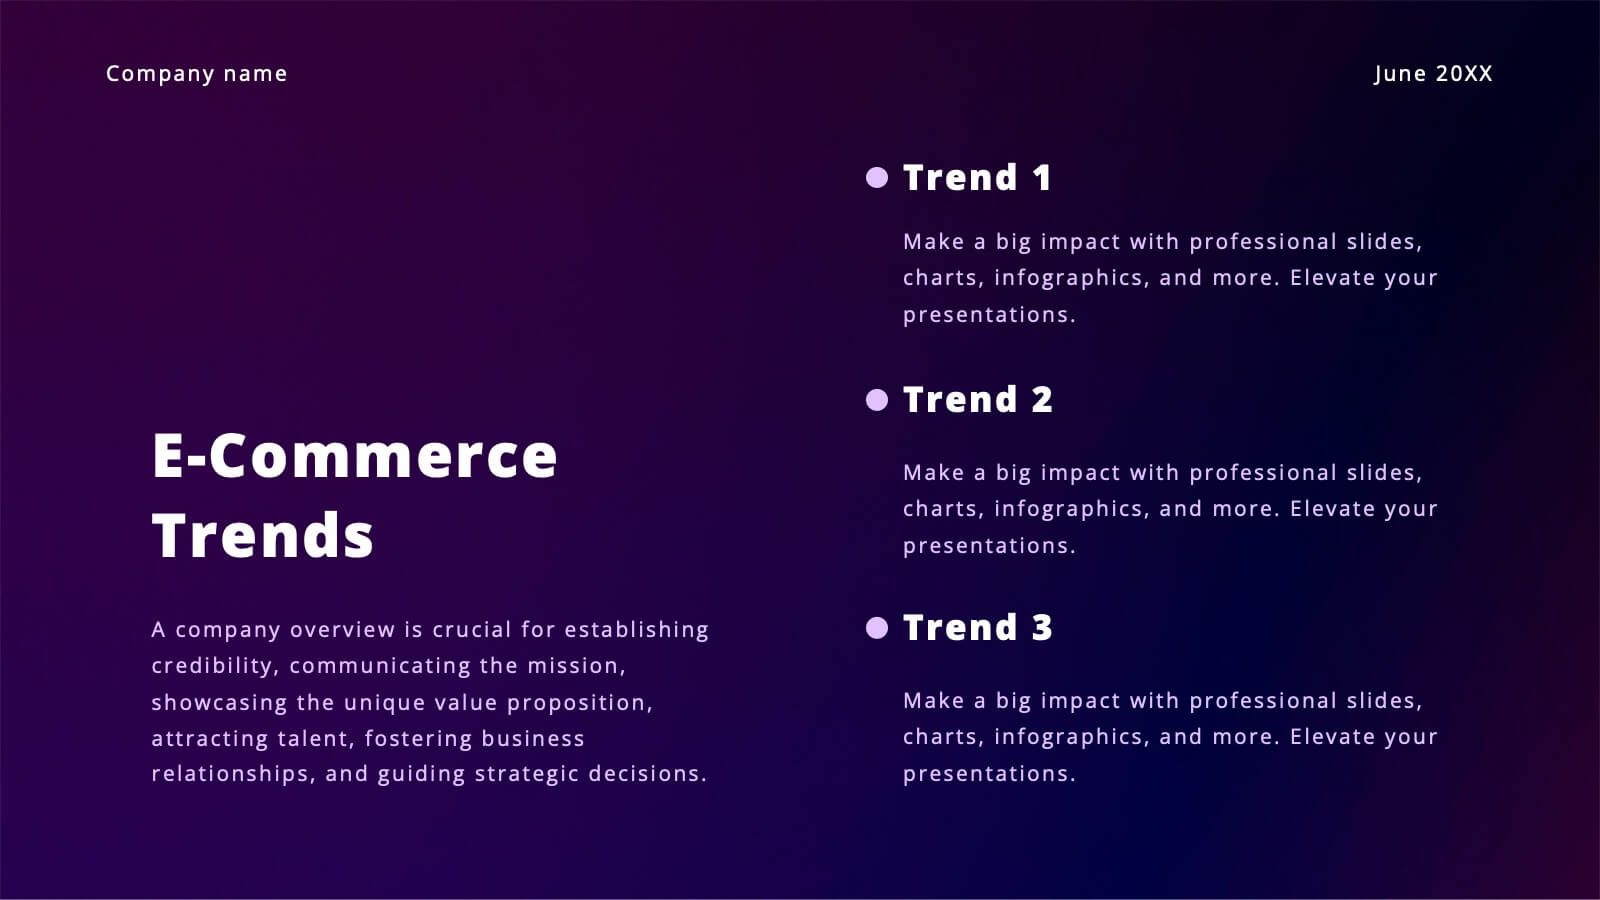
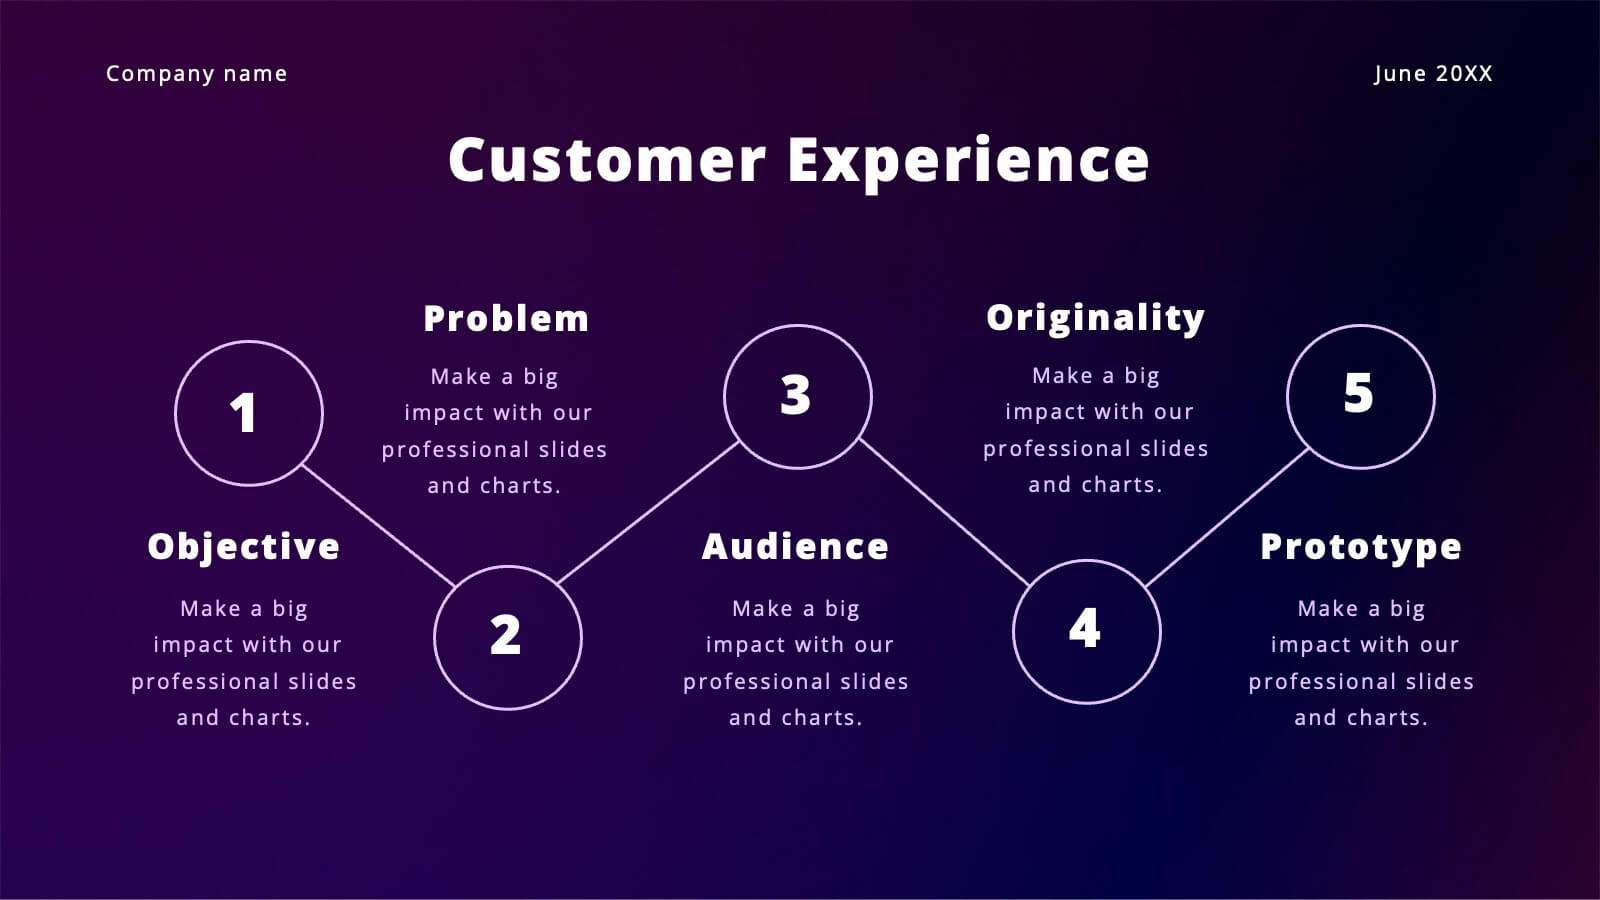
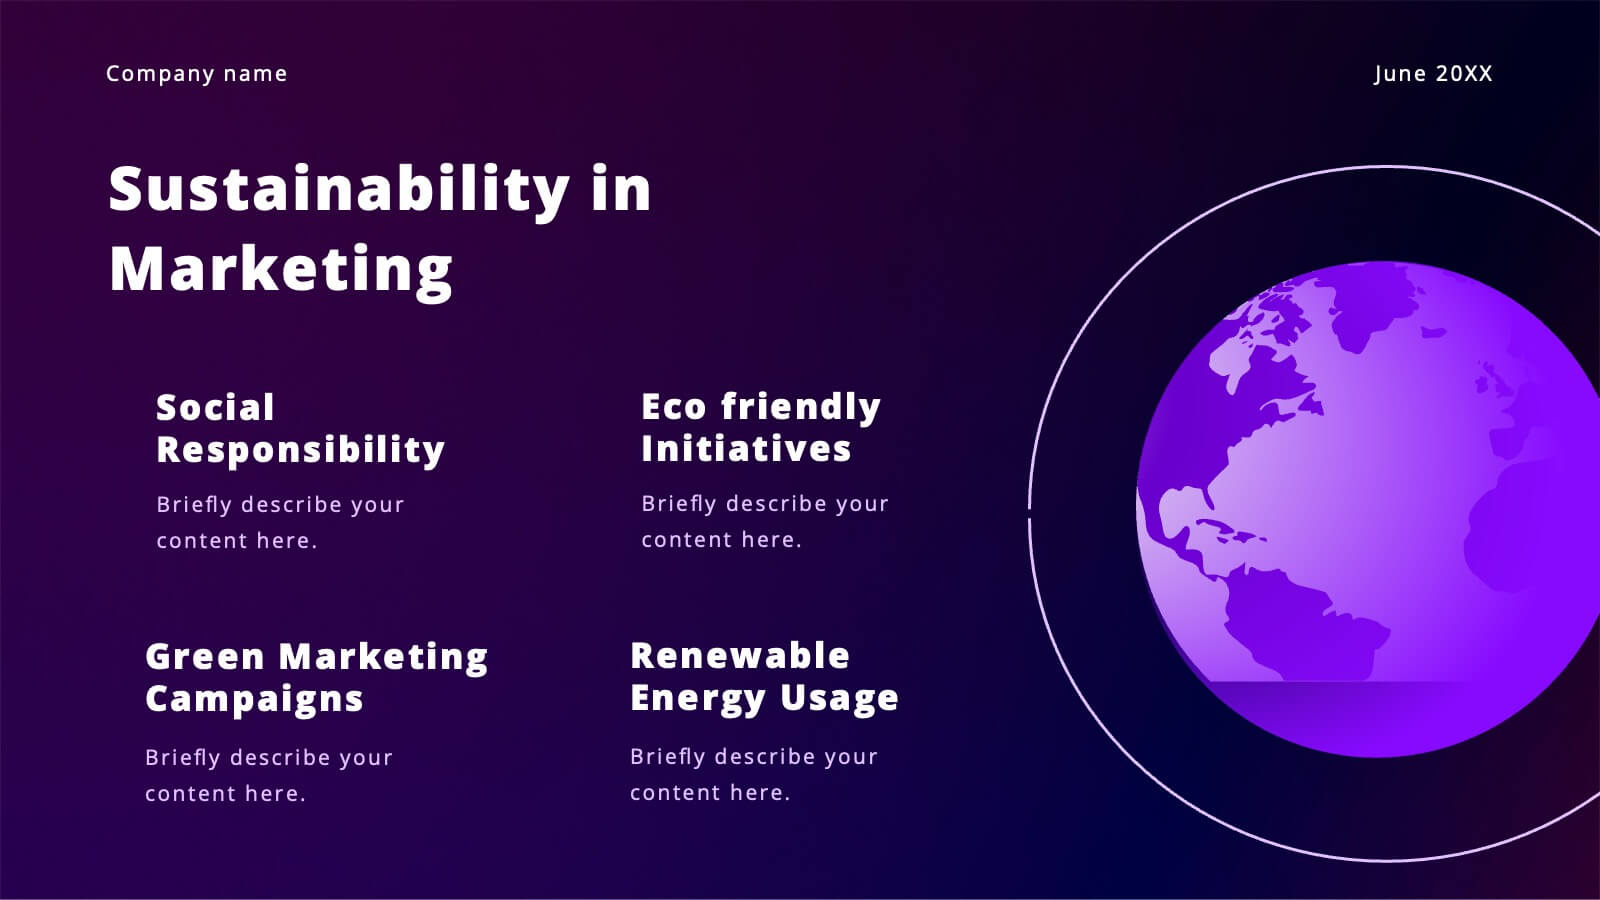
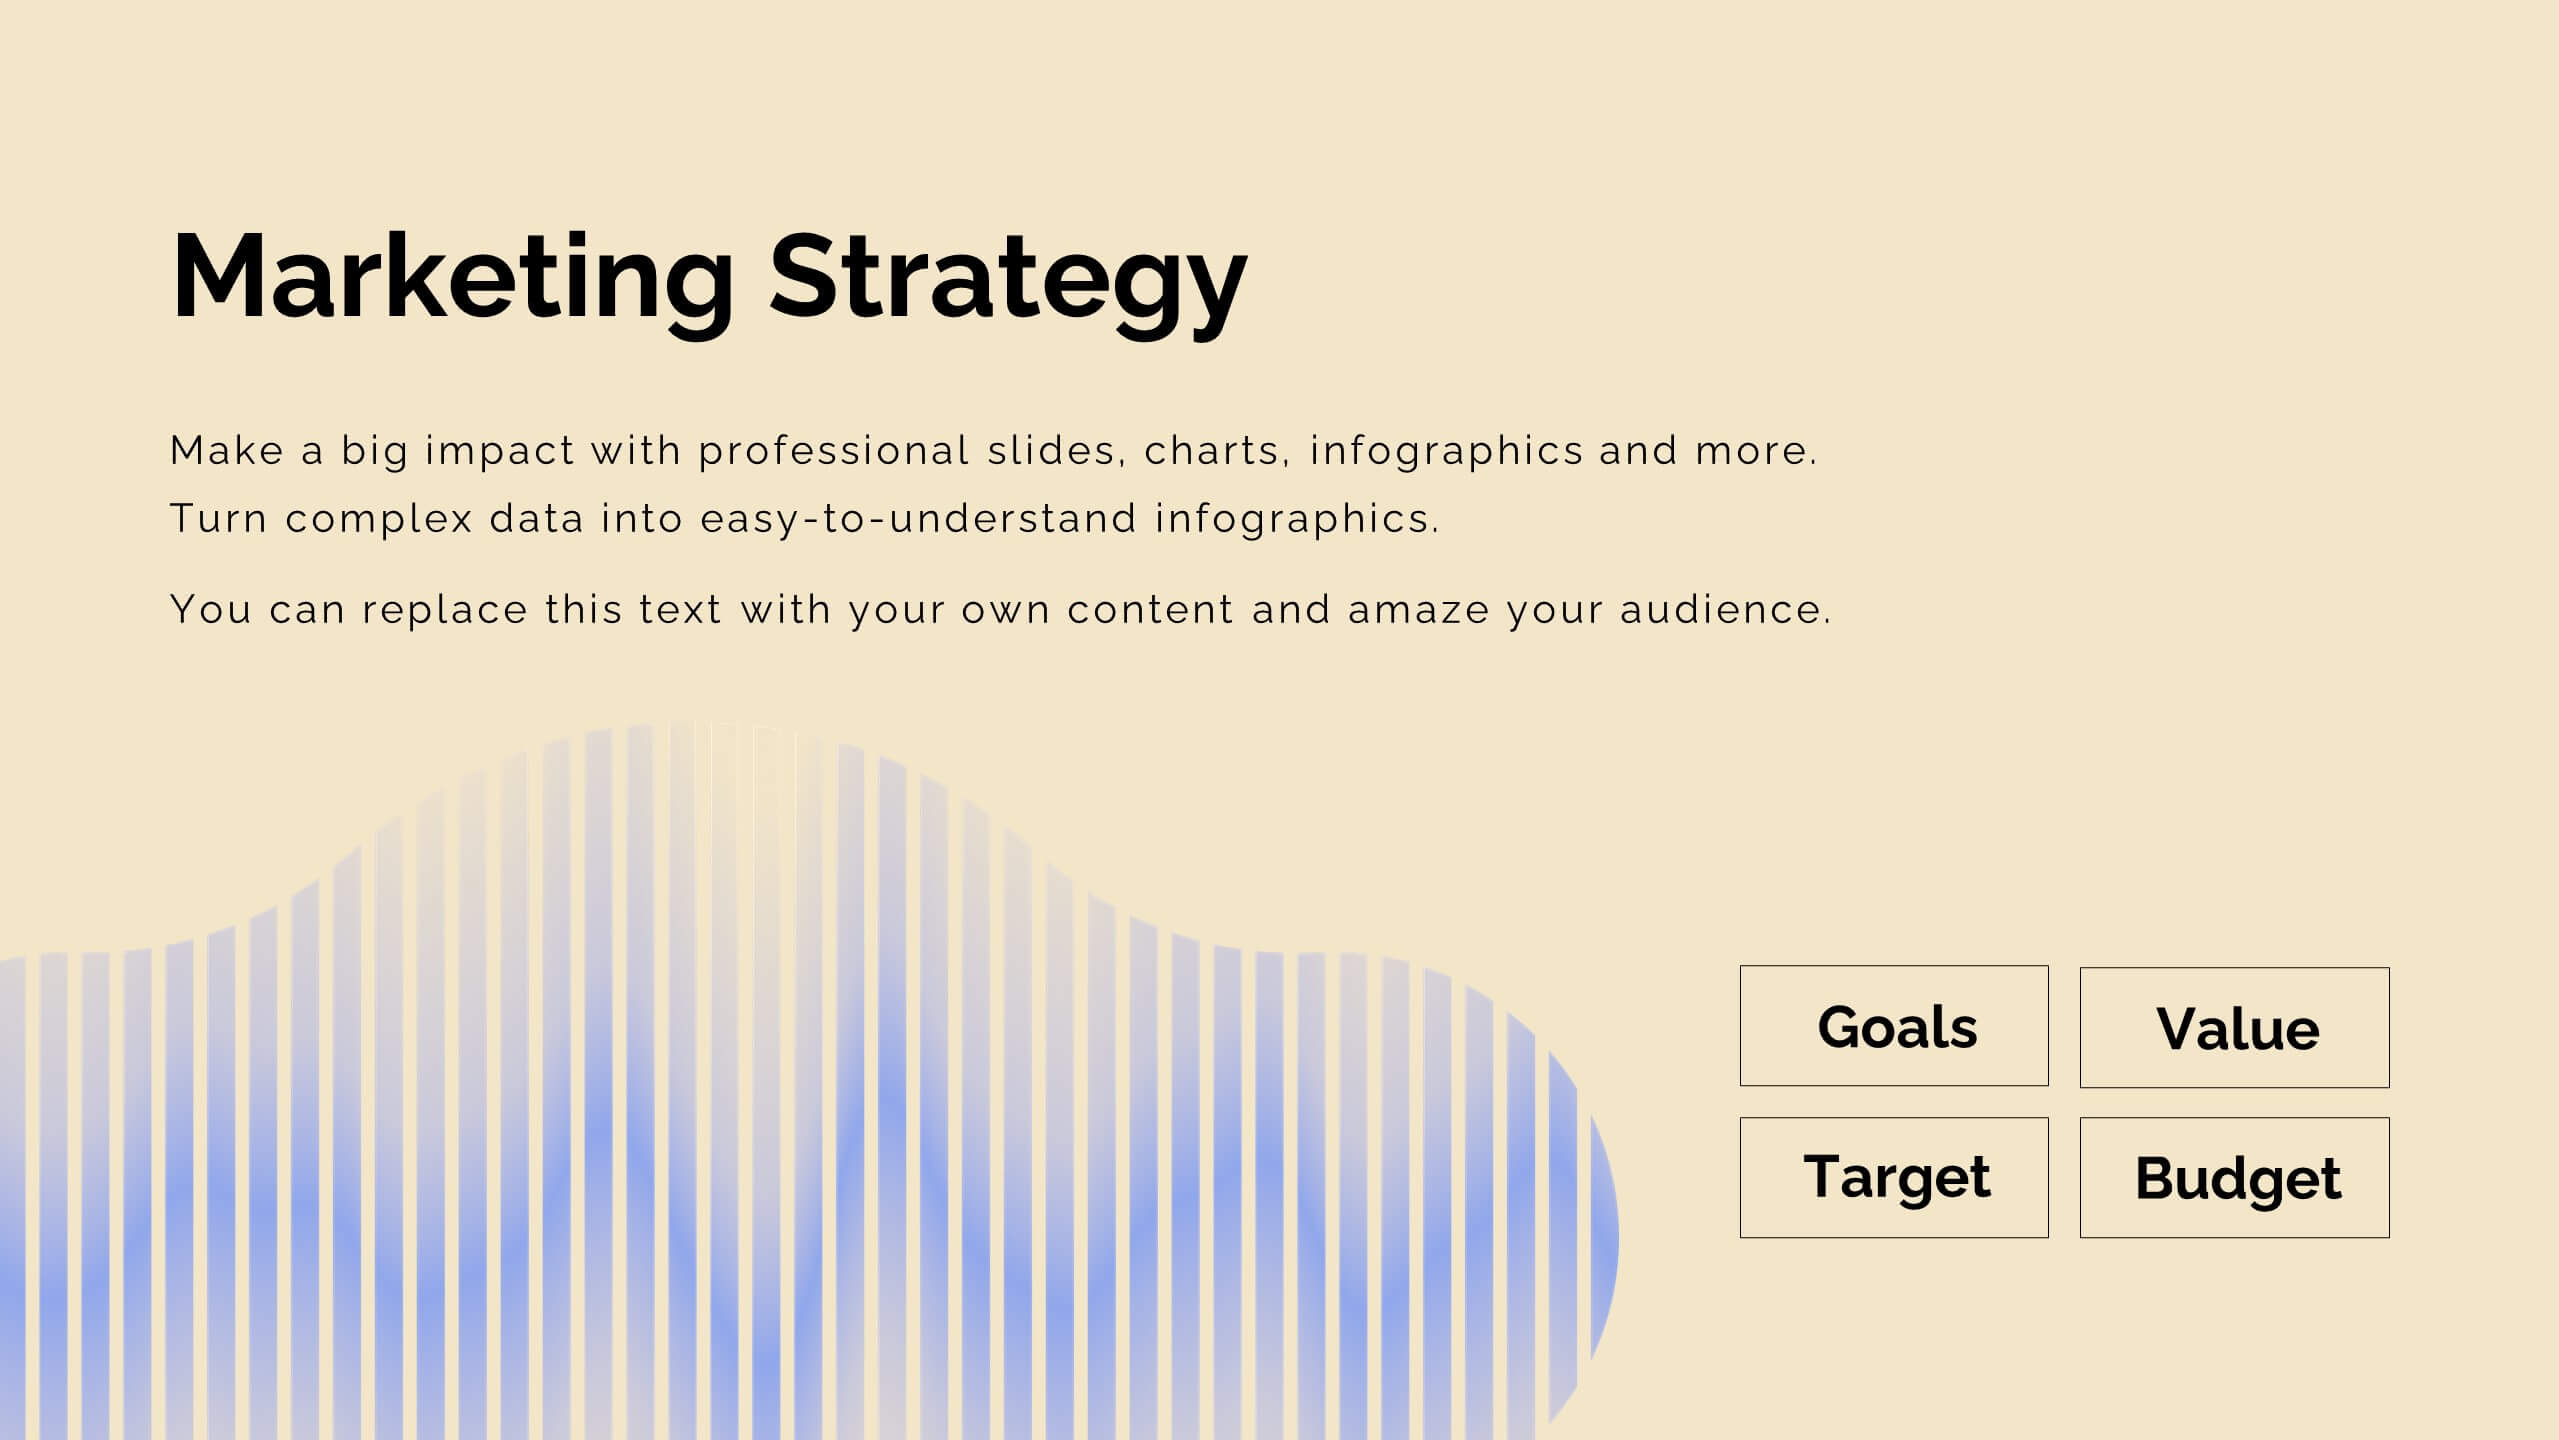
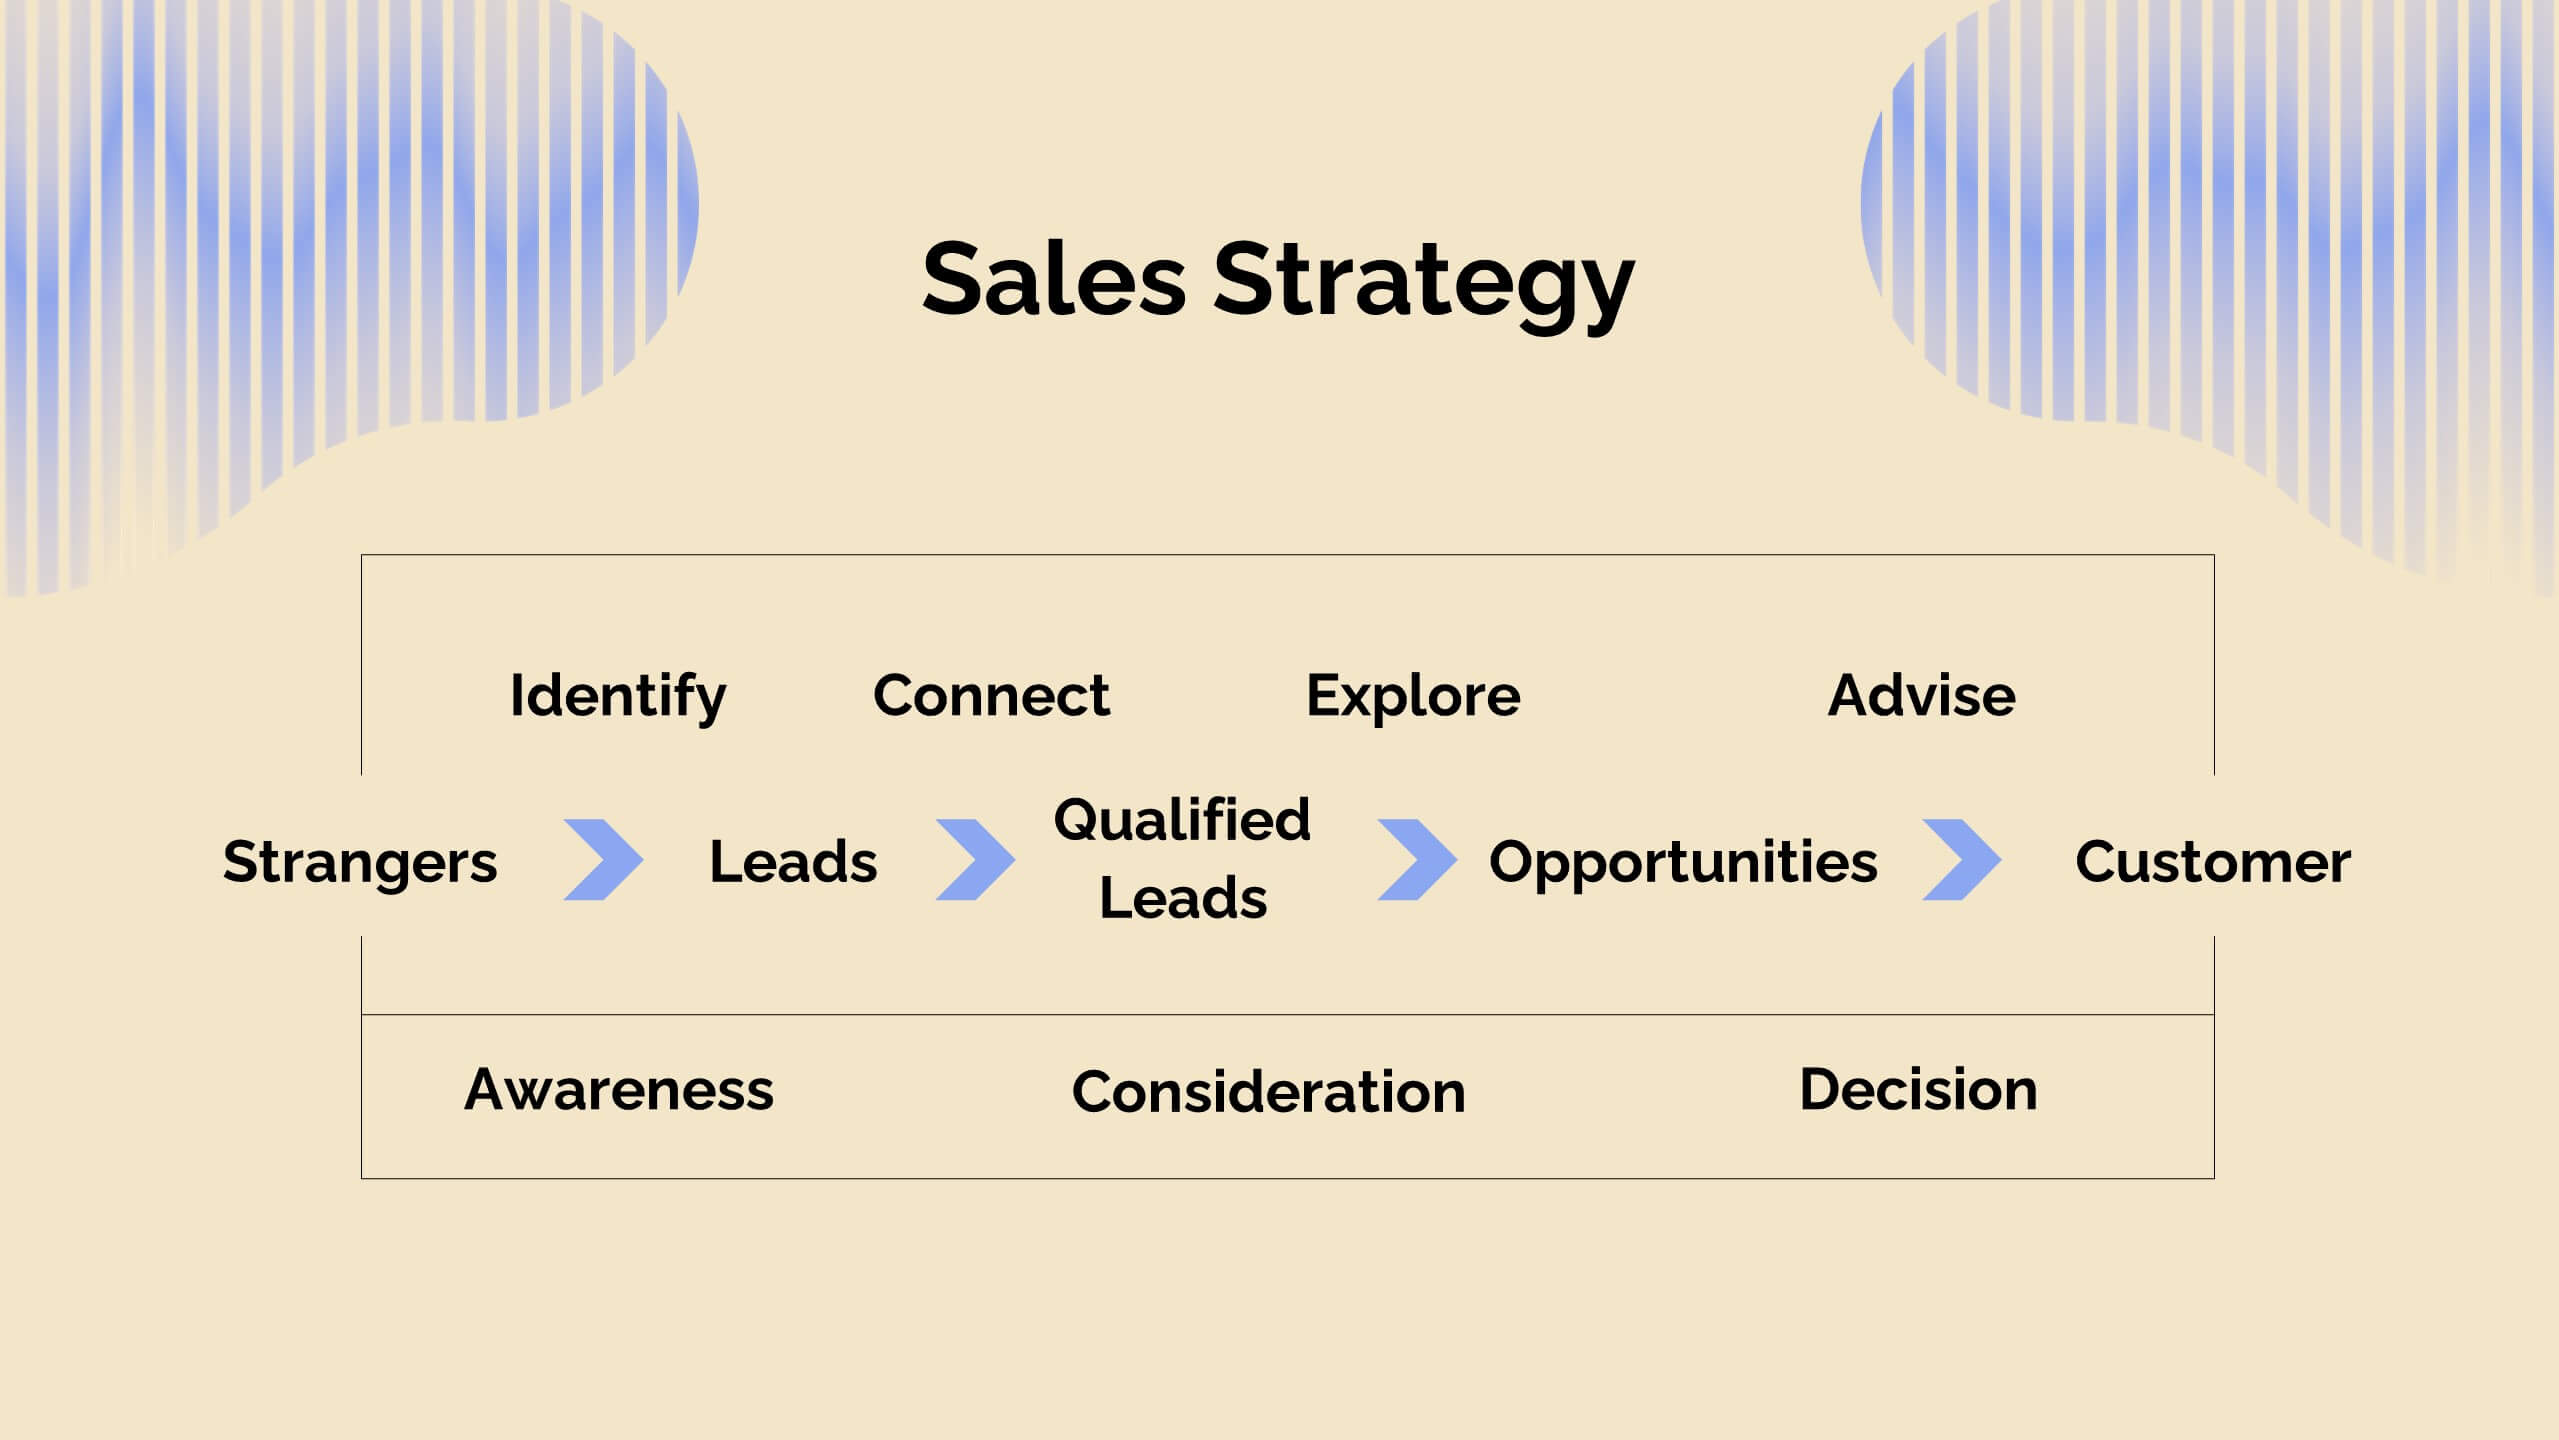
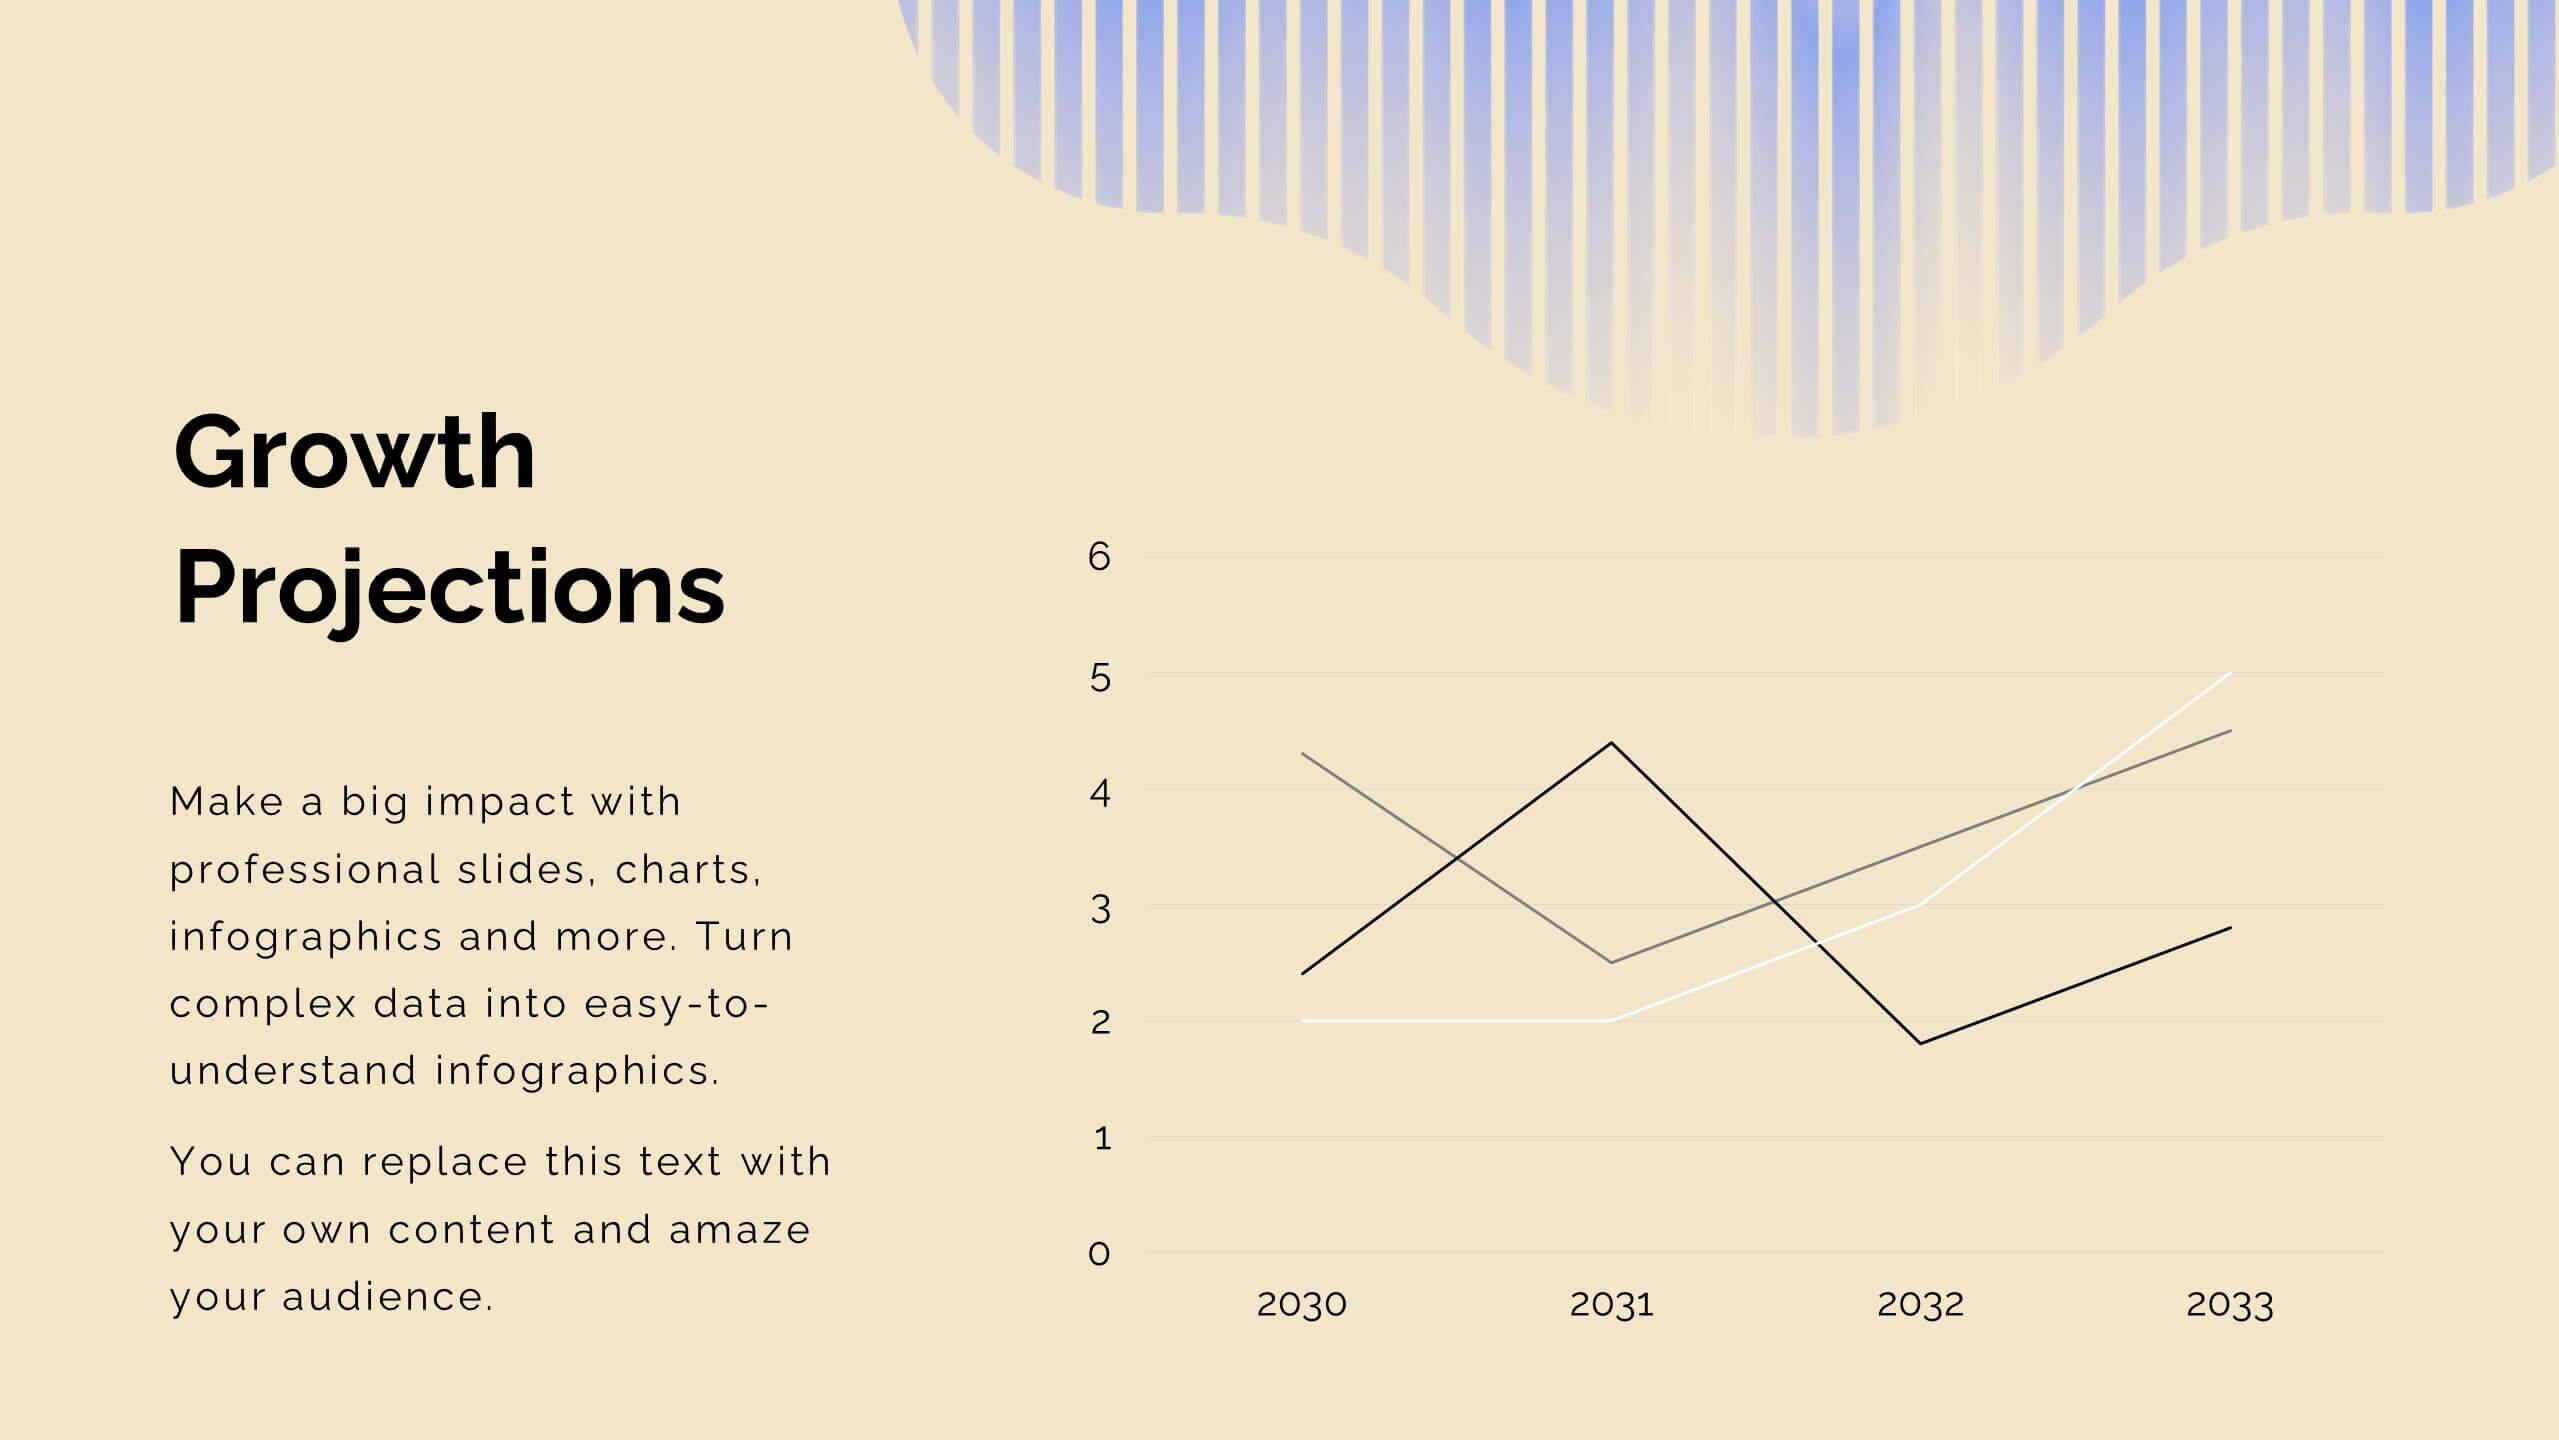
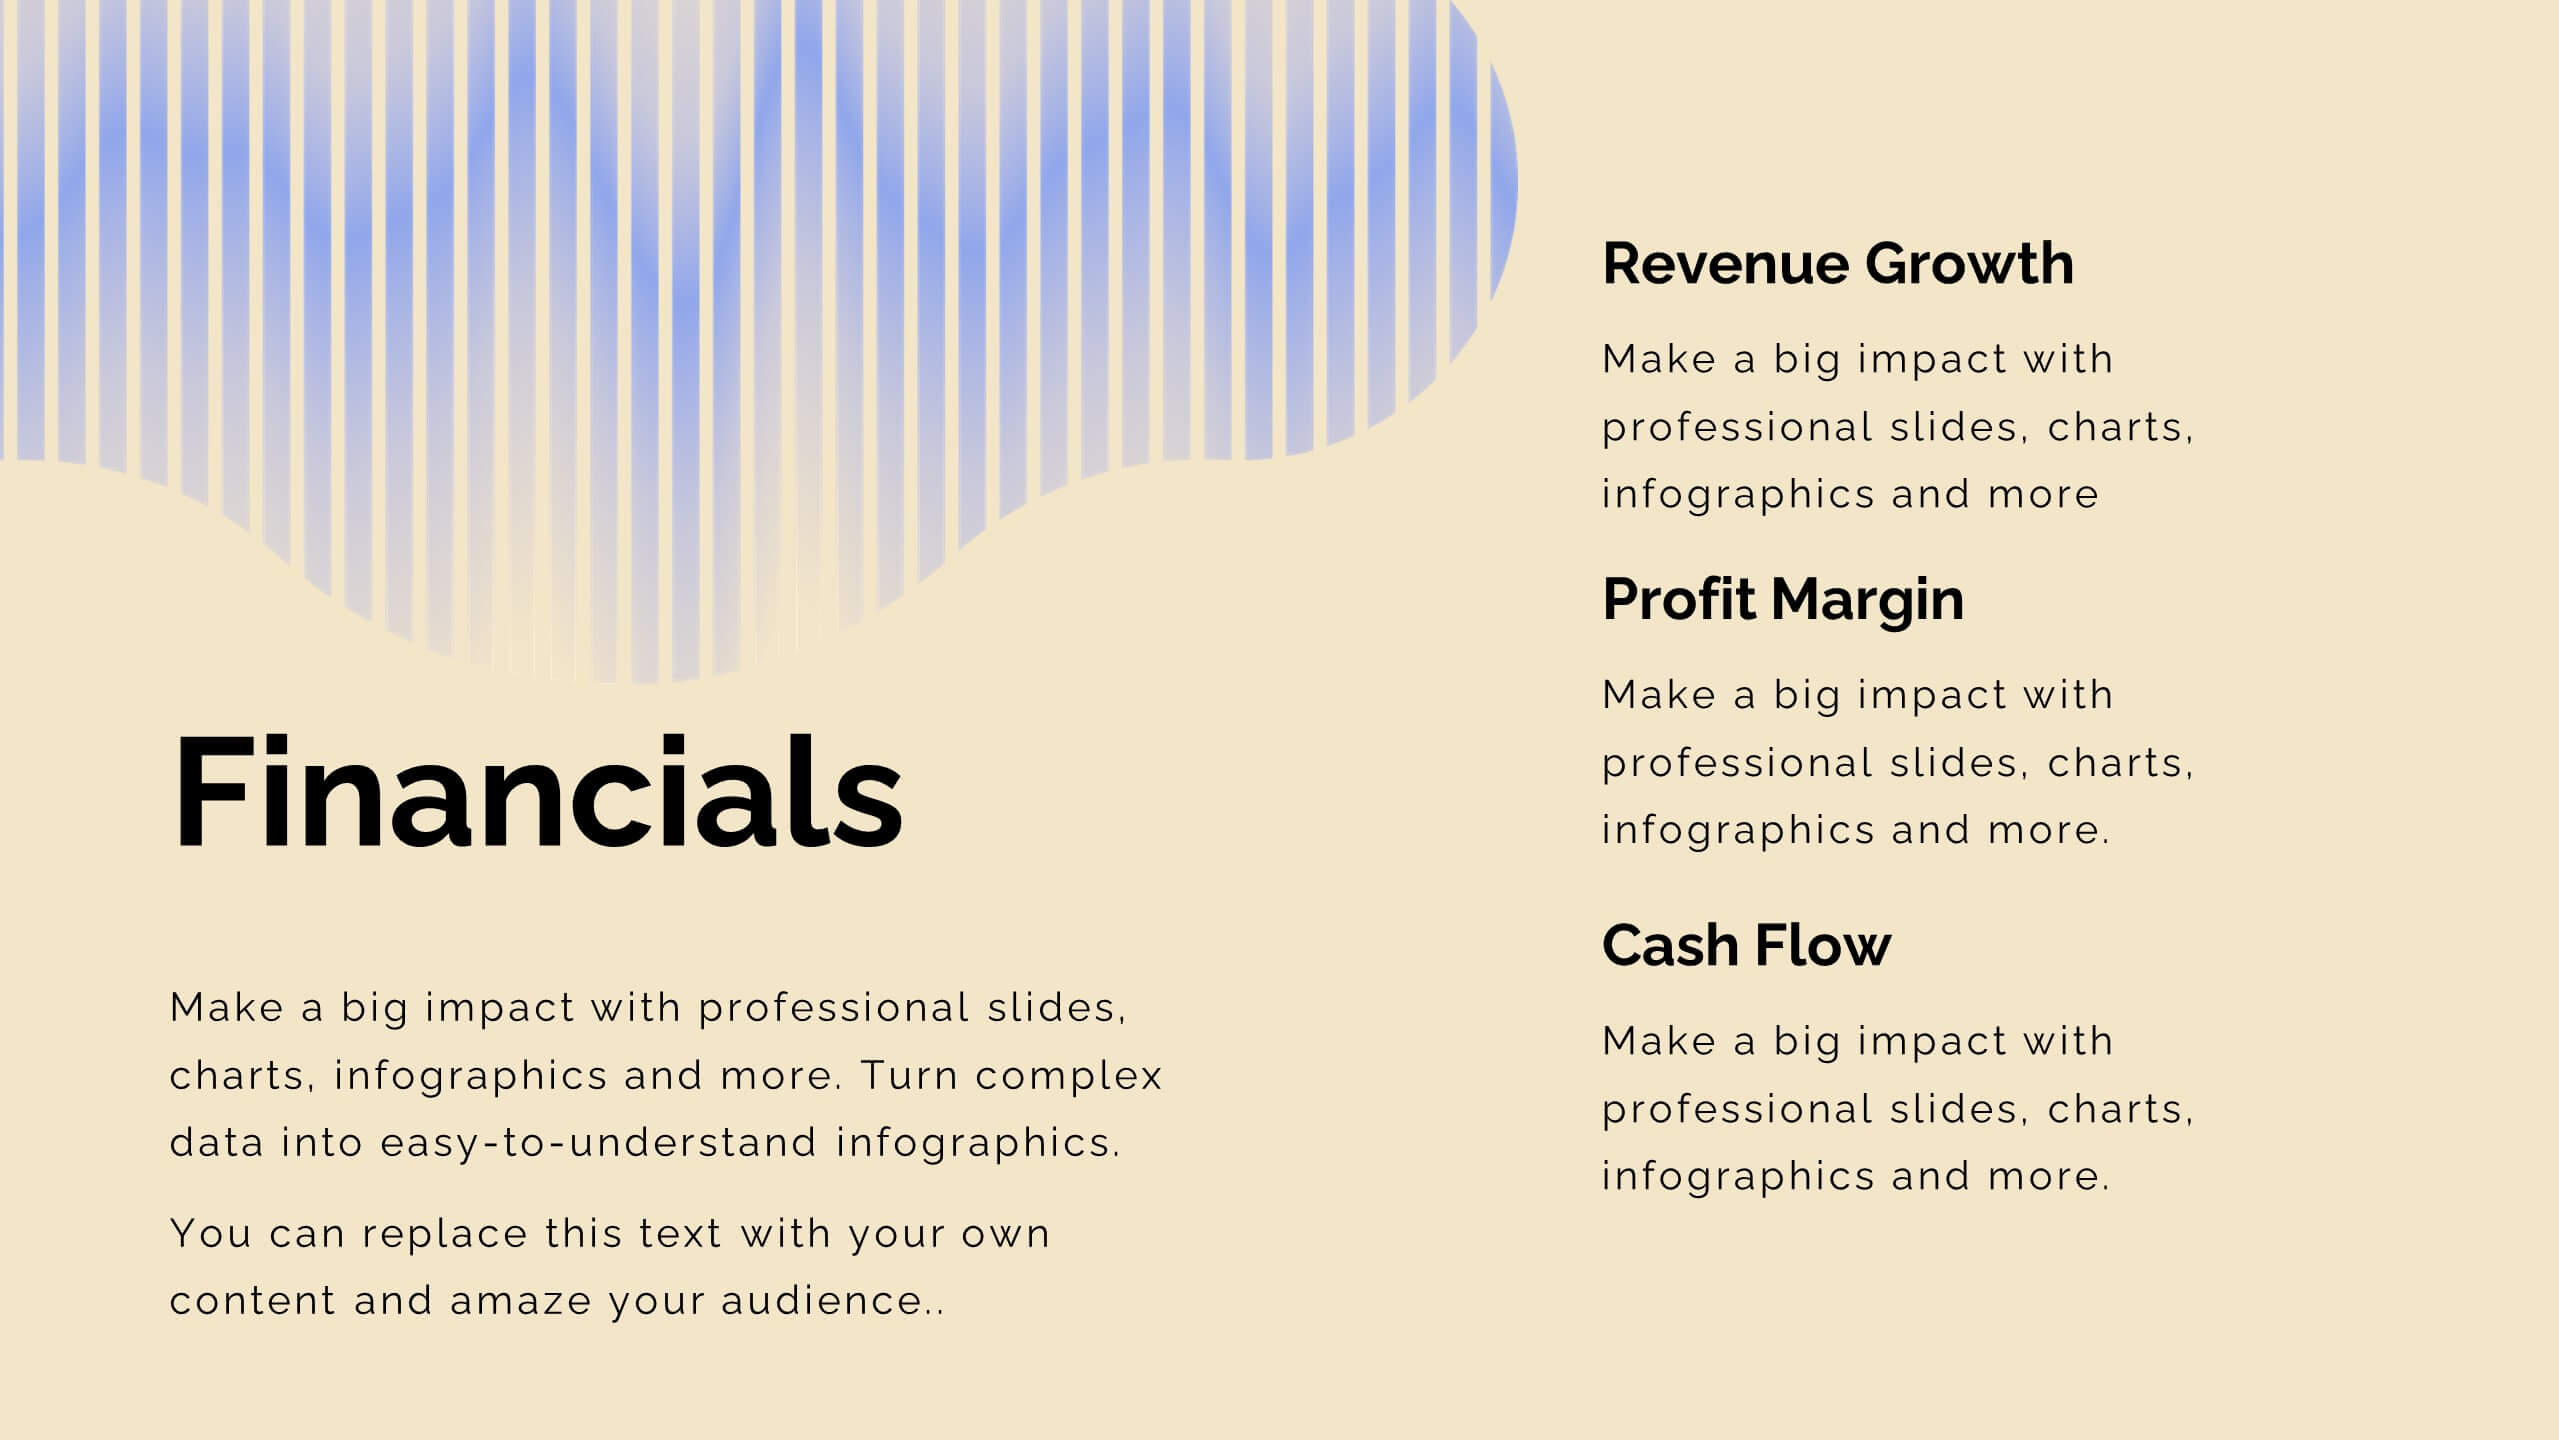
Boost your marketing pitch with this vibrant deck! Covering industry overviews, customer behavior analysis, and emerging technologies, it’s designed to captivate your audience. Highlight social media strategies, data-driven marketing, and e-commerce trends effortlessly. Perfect for presenting a comprehensive marketing plan. Compatible with PowerPoint, Keynote, and Google Slides. Make your next pitch stand out!


6 slides
Governance Tools Infographics
Enhance your understanding of Governance Tools with our customizable infographic template. This template is fully compatible with popular presentation software like PowerPoint, Keynote, and Google Slides, allowing you to easily customize it to illustrate and communicate various governance tools and practices. The Governance Tools infographic template offers a visually engaging platform to explore and explain the tools, frameworks, and strategies used to facilitate effective governance within organizations. Whether you're a governance professional, business leader, or interested in corporate governance, this template provides a user-friendly canvas to create informative presentations and educational materials. Deepen your knowledge of Governance Tools with this SEO-optimized infographic template, thoughtfully designed for clarity and ease of use. Customize it to showcase governance frameworks, compliance mechanisms, risk management tools, and best practices, ensuring that your audience gains valuable insights into this critical field. Start crafting your personalized infographic today to delve into the world of Governance Tools.


5 slides
Yoga Poses Infographics
Yoga Poses, also known as asanas, are physical postures practiced in the discipline of yoga. They are designed to promote strength, flexibility, balance, and mindfulness. These infographic templates focuses on illustrating various yoga poses and their benefits. It is designed to help individuals understand and practice different yoga poses effectively. This template features beautifully designed infographics with icons and illustrations that showcase different yoga poses. These covers a wide range of yoga, including balancing poses, Chakra yoga, standing poses, and yoga for pregnancy.


5 slides
Wedding Itinerary Infographics
A Wedding Itinerary is a detailed schedule or timeline that outlines the events and activities planned for a wedding day. These infographic templates aim to assist couples in creating a visually appealing and informative itinerary for their wedding events. These infographics are perfect for preparing a presentation for guests, sharing details with the wedding party, or showcasing wedding planning services, this template will help you create a memorable and well-organized wedding experience. This is compatible with PowerPoint, Keynote, and Google Slides making it easily editable to personalize the template with your information.


6 slides
RAPID Decision Infographic
The RAPID matrix is a decision-making framework used to clarify roles and responsibilities within a project or organization, especially when it comes to decision-making processes. The RAPID acronym stands for Responsible, Accountable, Consulted, Informed, and Decider. This infographic template is a visual tool that helps clarify roles and responsibilities within a project or process. This template is designed to define who is involved in each step of a task, who has decision-making authority, and who needs to be informed or consulted. Compatible with Powerpoint, Keynote, and Google Slides. Apply a color-coding scheme to visually distinguish different roles.


8 slides
Identifying and Addressing Business Problems Presentation
Break down challenges with clarity using this structured 4-step business problem-solving slide. Highlight each issue with its own icon, number, and explanation, making it easy to communicate obstacles and outline solutions. Ideal for team strategy meetings, leadership briefings, or client reports. Fully customizable in PowerPoint, Keynote, and Google Slides.


21 slides
Design Creative Concept Presentation
Enhance your creative presentations with this Creative Concept template. It features slides for objectives, color palettes, typography options, and prototyping steps. Ideal for designers and creative teams, this template supports PowerPoint, Keynote, and Google Slides, facilitating a comprehensive and engaging presentation of creative projects.


4 slides
Risk vs Impact Matrix Layout Presentation
Visualize risk levels clearly with the Risk vs Impact Matrix Layout Presentation. This customizable template helps you assess and categorize potential risks based on their likelihood and impact, using a clear 3x3 color-coded grid. Ideal for project managers, risk analysts, and strategy teams. Compatible with PowerPoint, Keynote, Google Slides, and Canva.


4 slides
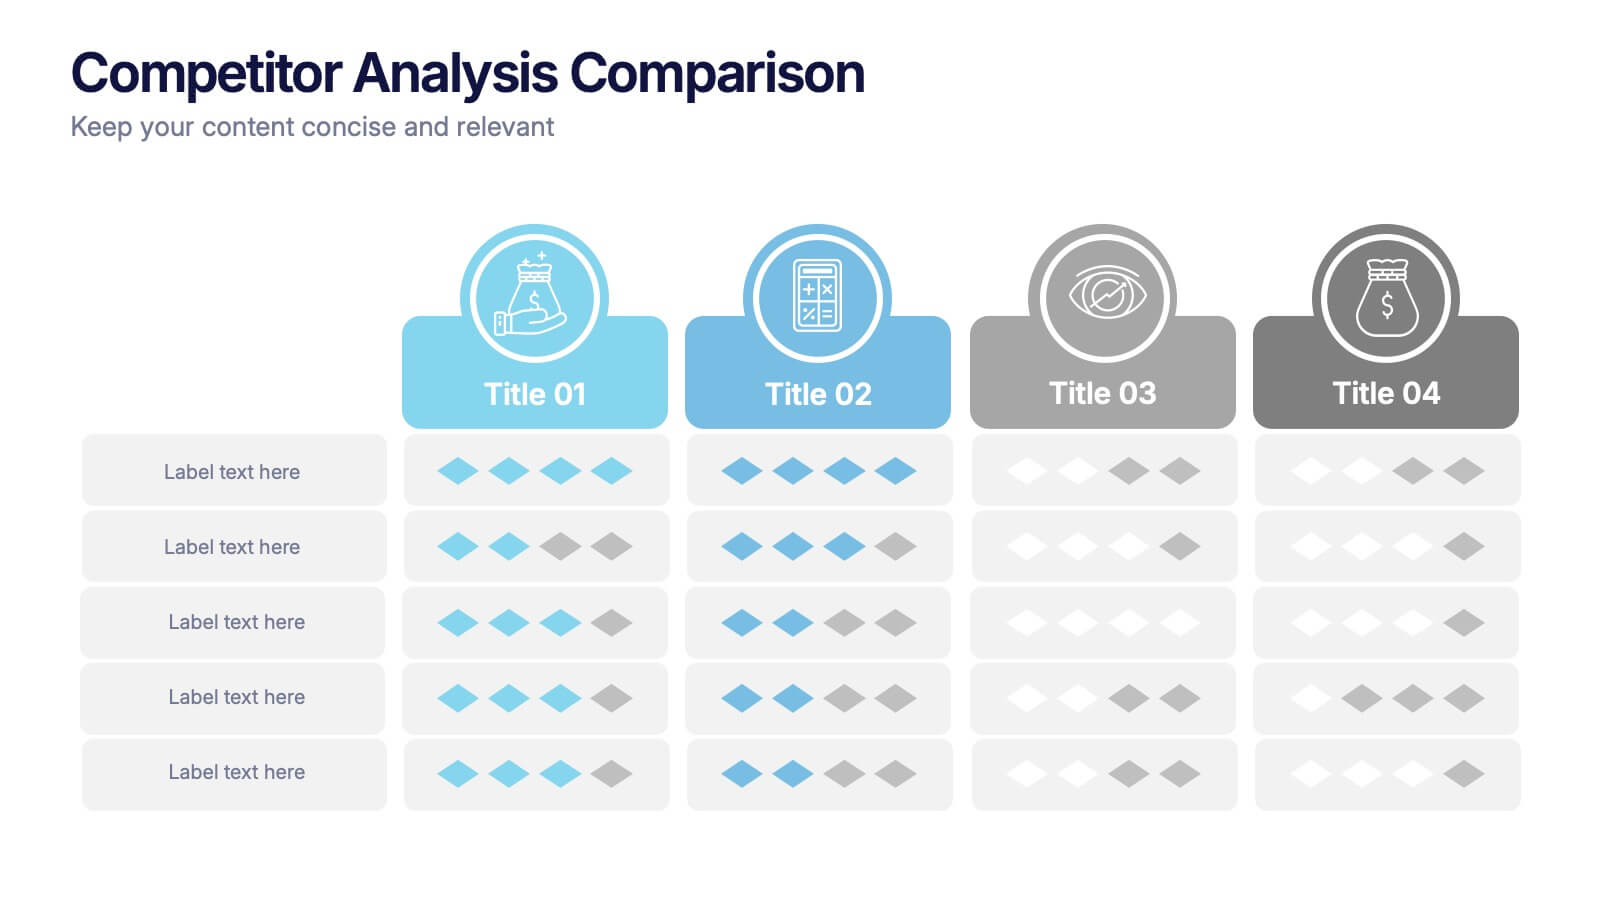
Competitor Analysis Comparison Presentation
Quickly evaluate strengths and weaknesses across your market landscape with this Competitor Analysis Comparison Presentation. Featuring clean tables, icons, and rating visuals, it's ideal for highlighting where your brand stands out. Fully editable in PowerPoint, Keynote, and Google Slides.


22 slides
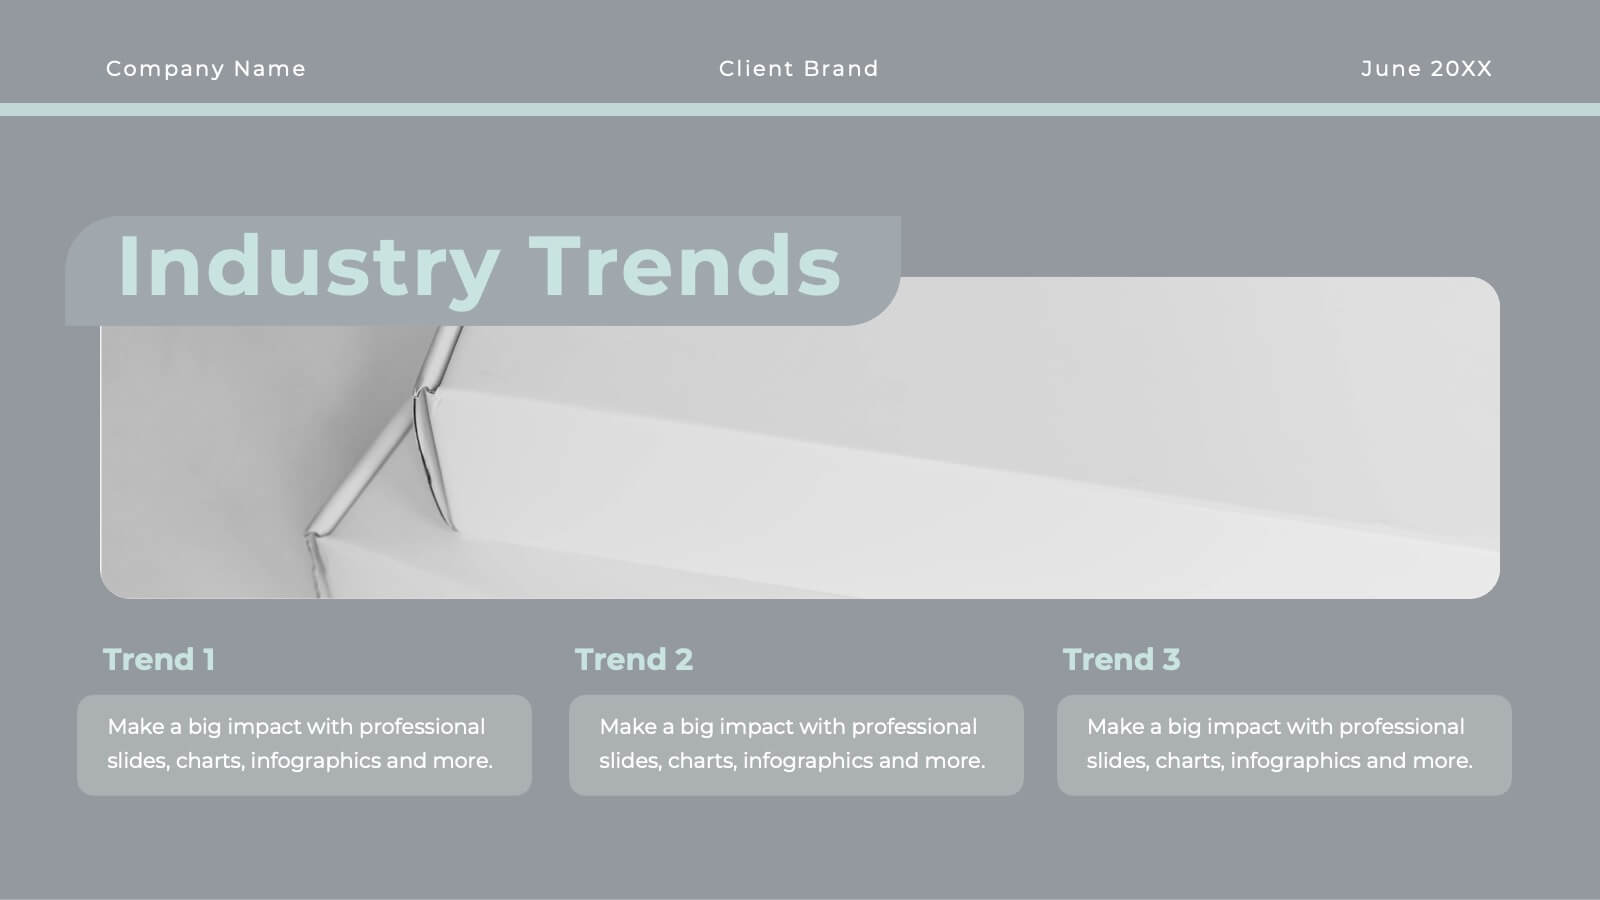
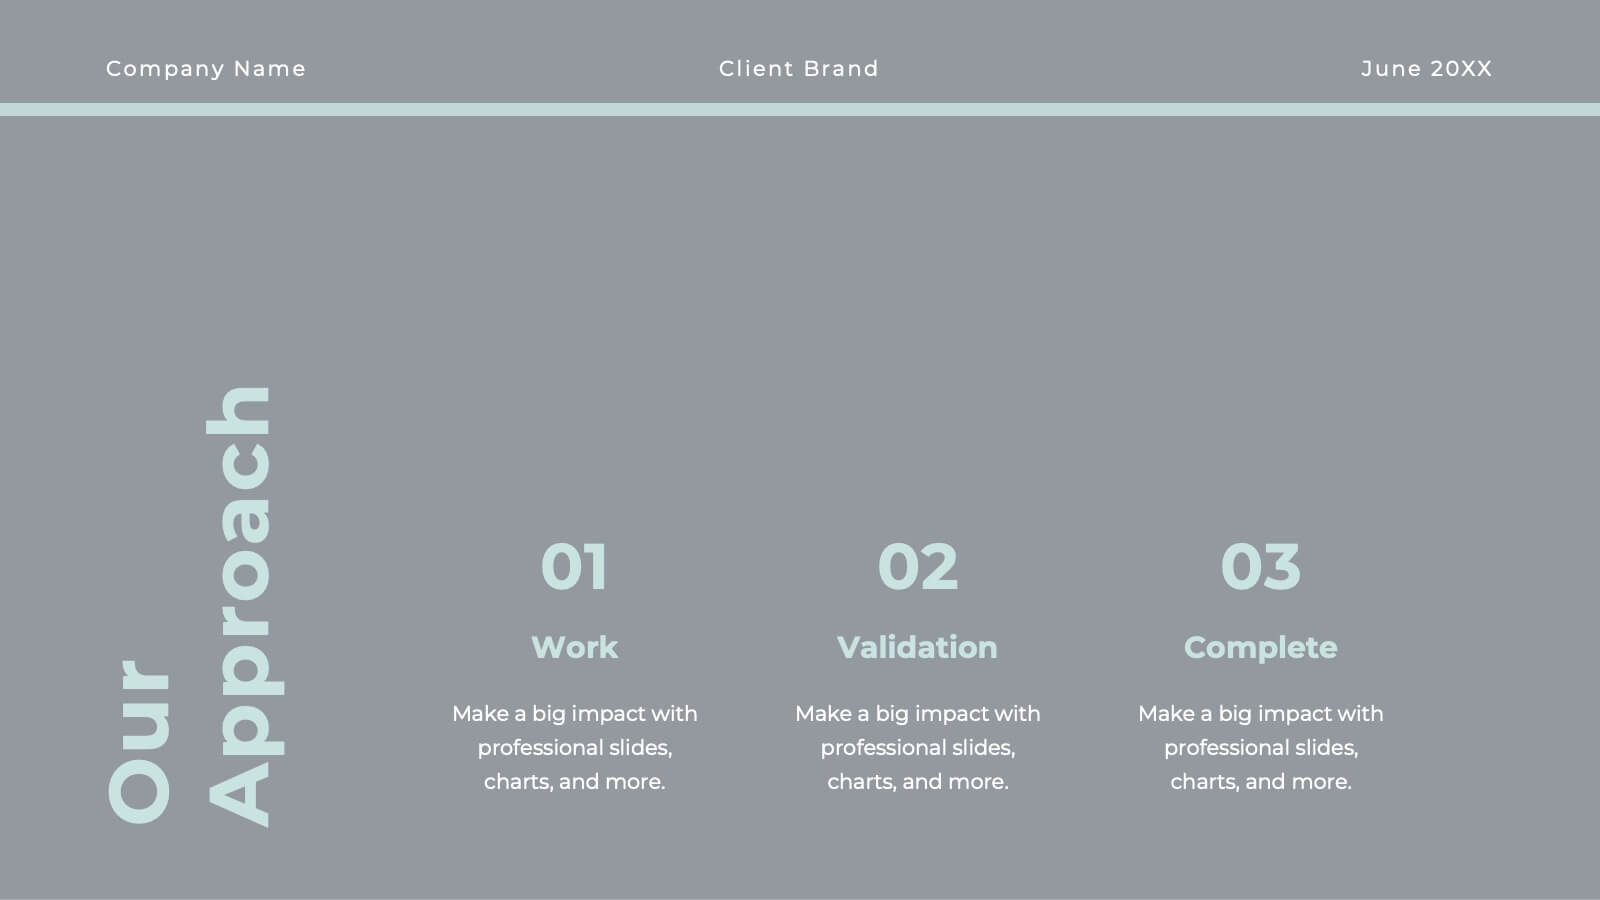
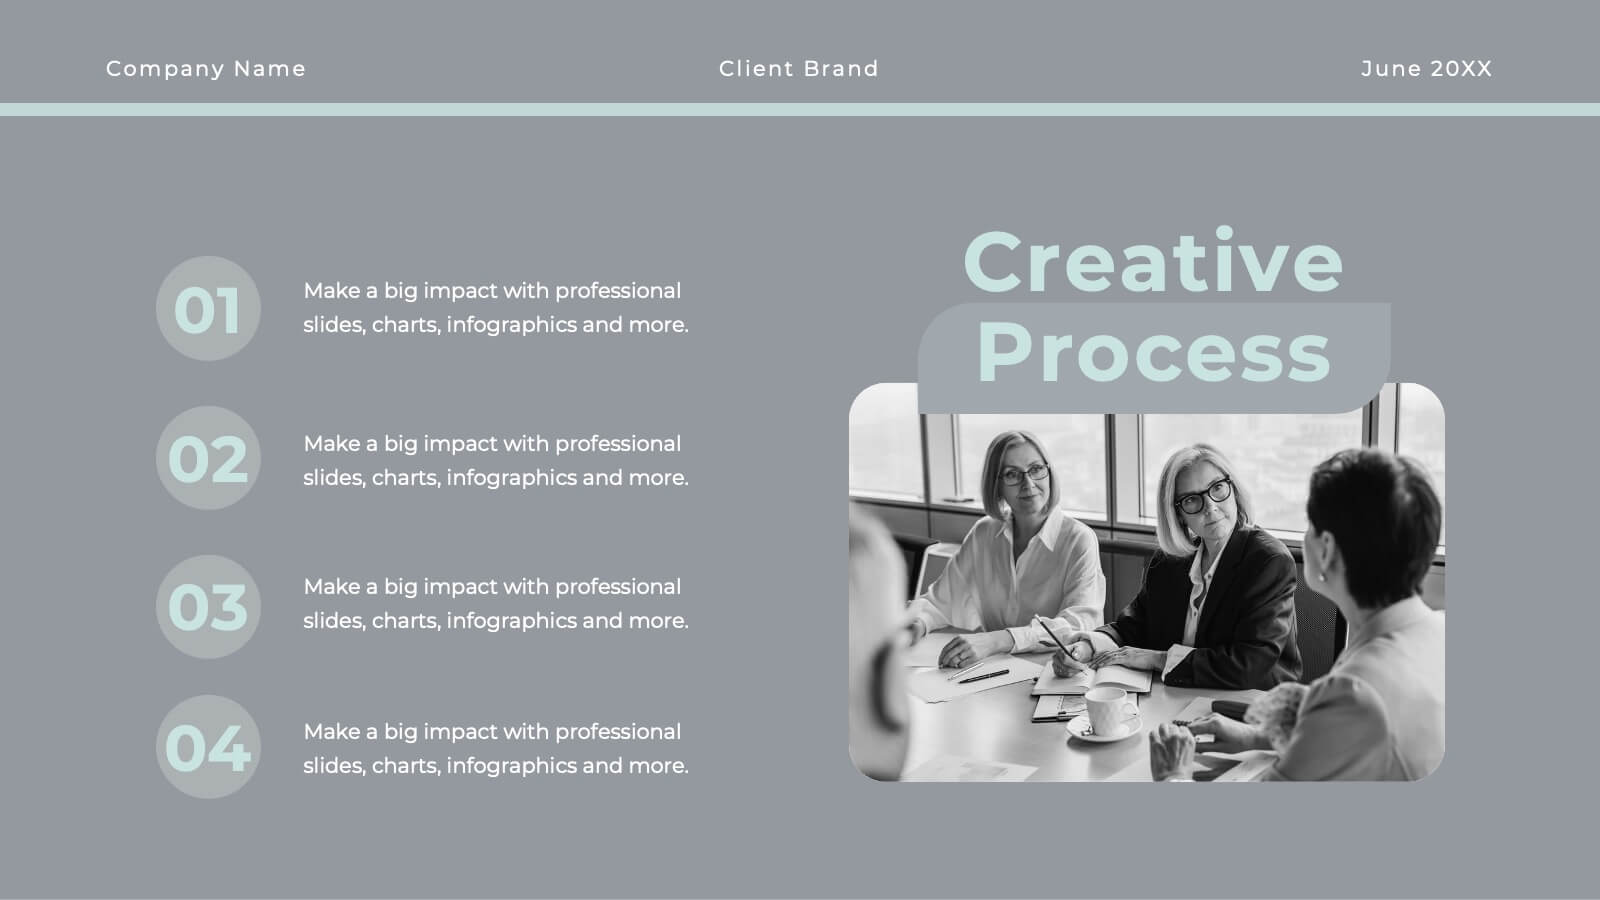
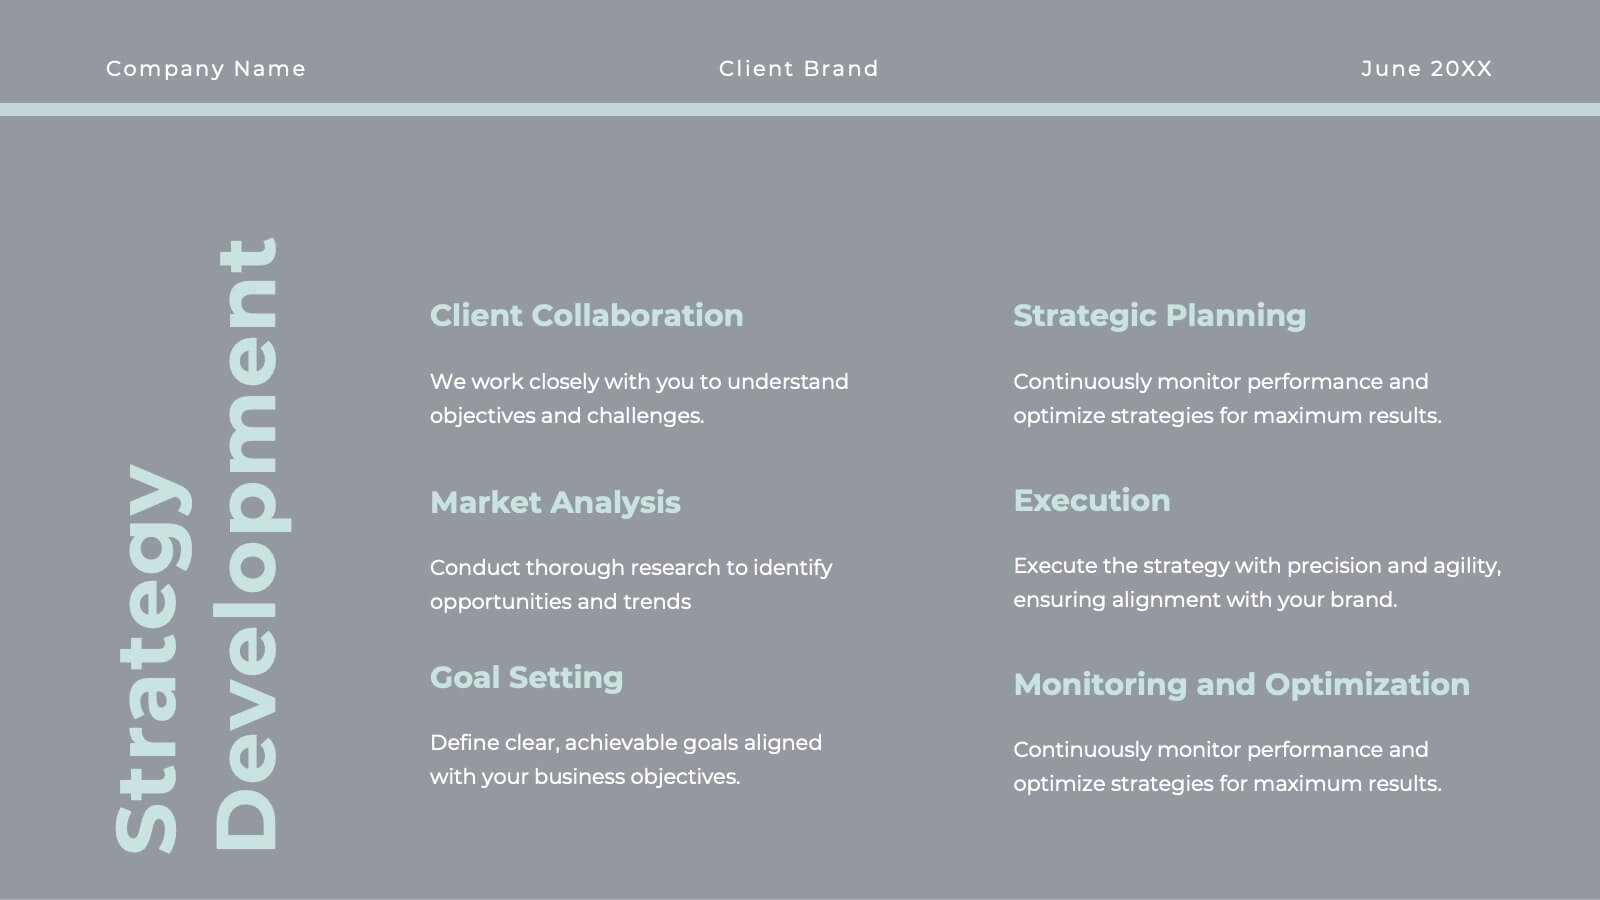
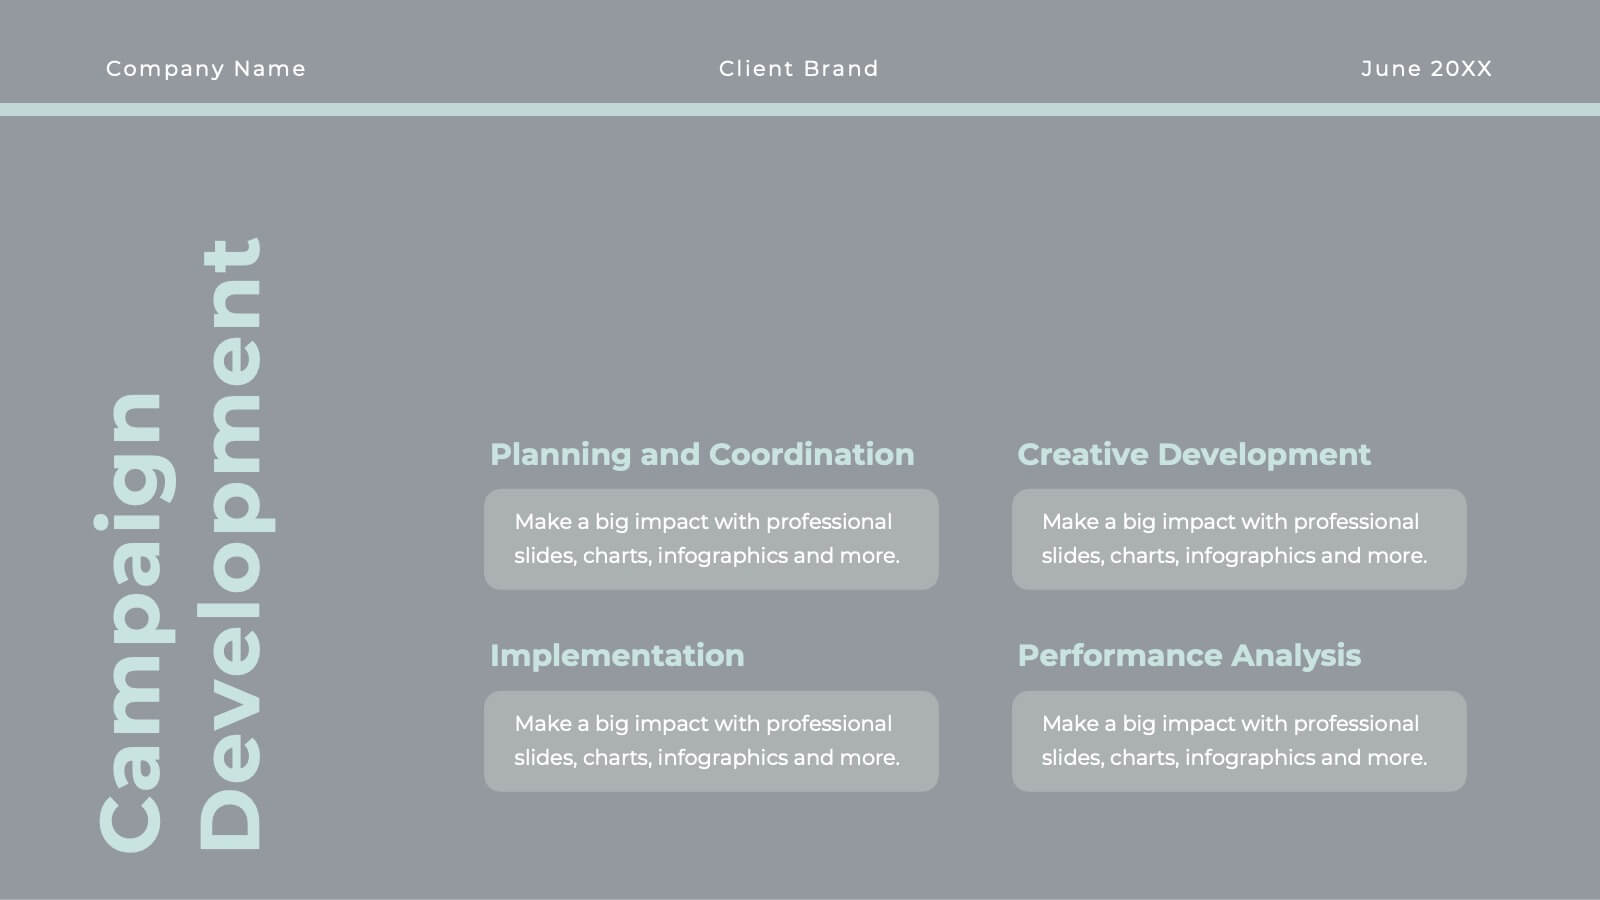
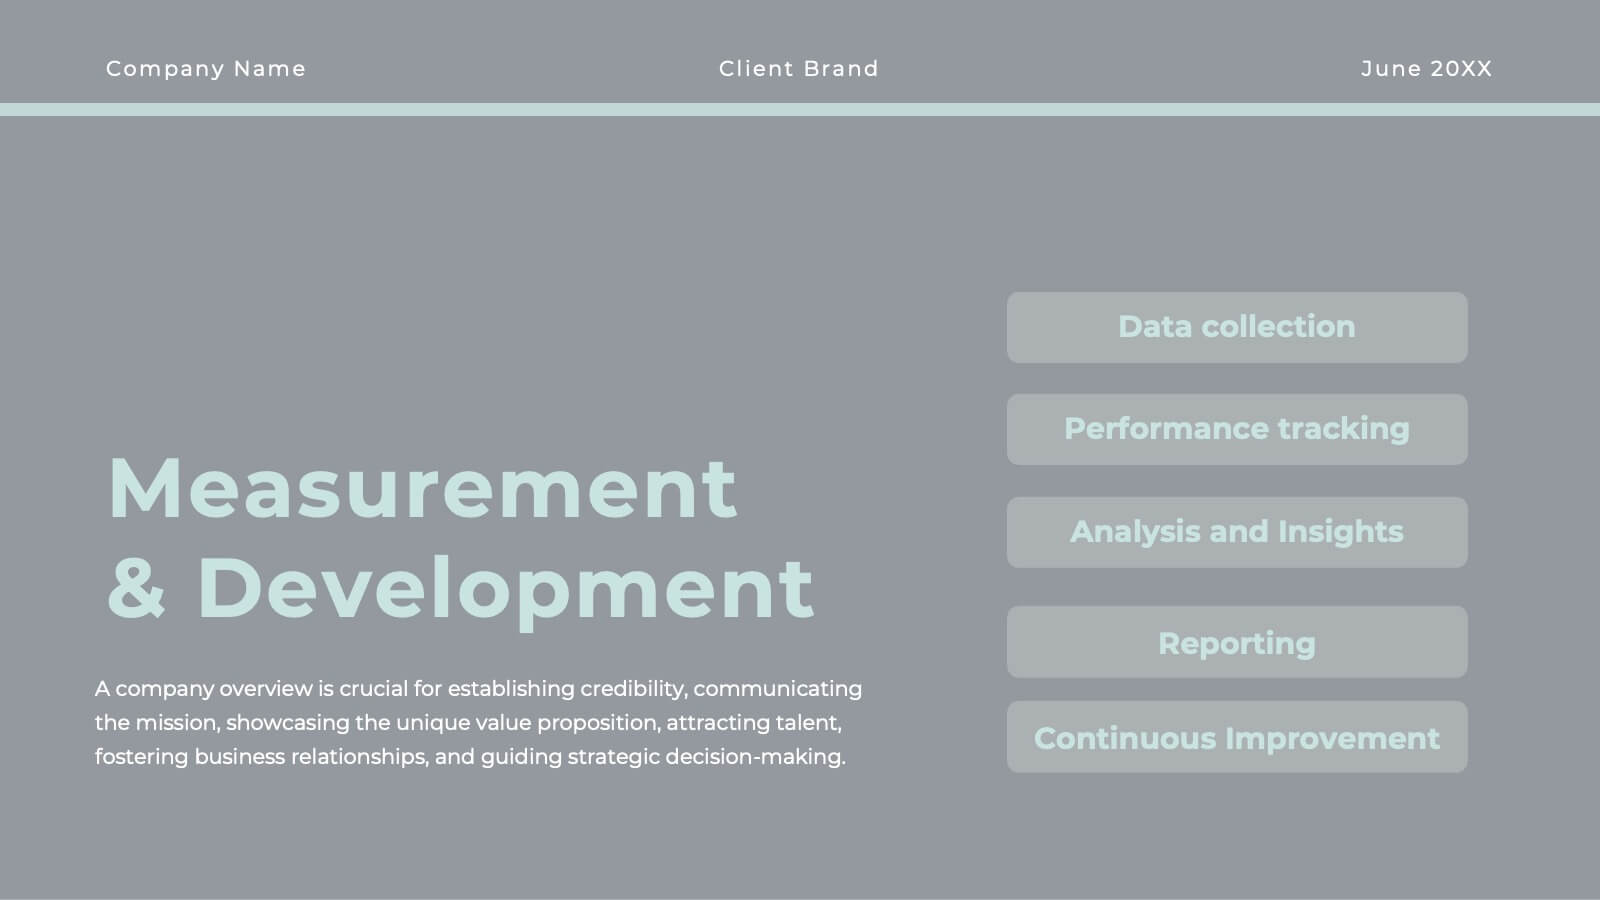
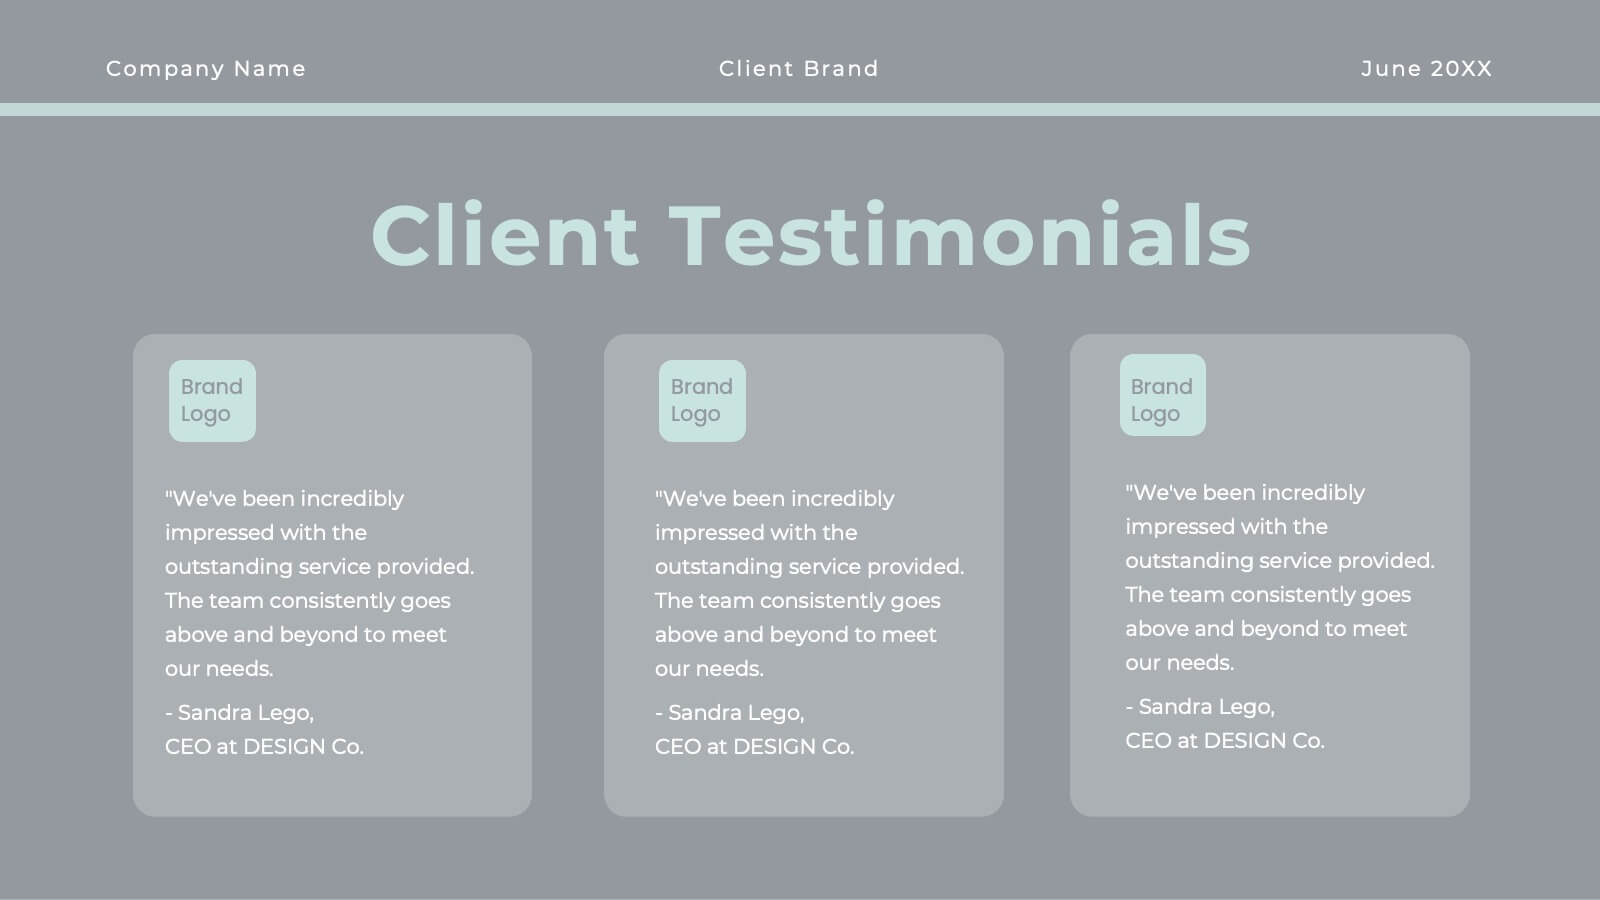
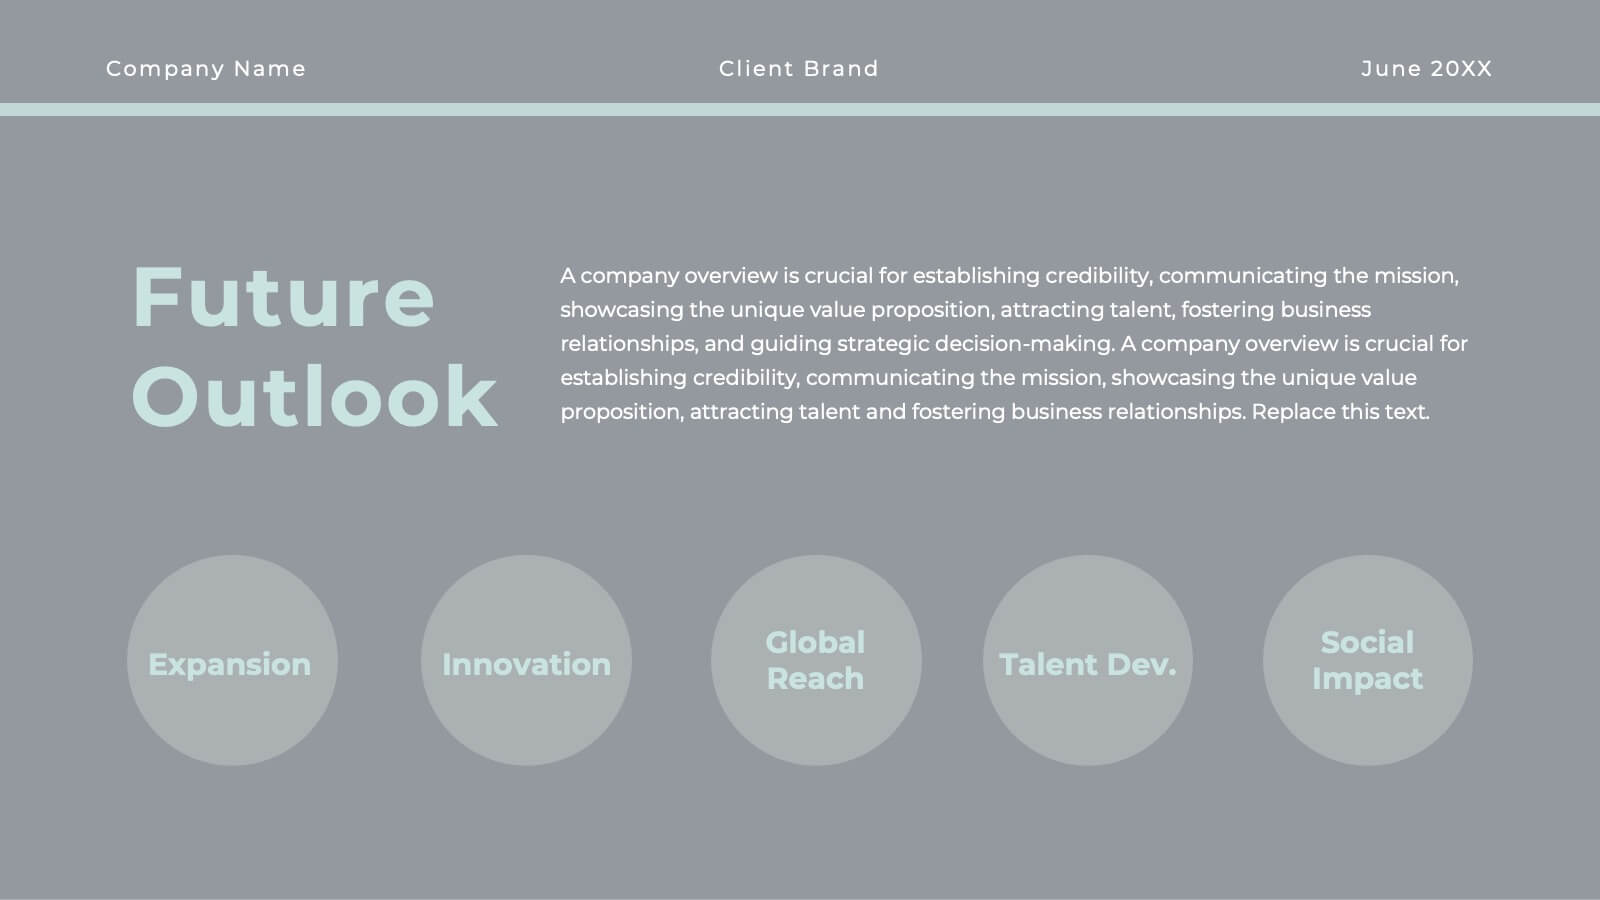
Whirlwind Advertising Agency Proposal Presentation
Get ready to elevate your agency’s game with a proposal template that’s as polished as your services! This sleek and sophisticated design is crafted to make a lasting impression on your clients and partners. From introducing your team’s expertise to showcasing successful case studies, every slide is meticulously designed to reflect professionalism and creativity. The clean, modern layout helps you present your market analysis, industry trends, and strategic approach with clarity and impact. With dedicated sections for client testimonials, campaign development, and partnership opportunities, this template ensures your agency’s value proposition is communicated with confidence and style. Perfectly adaptable to PowerPoint, Keynote, and Google Slides, this proposal template is your go-to tool for sealing deals and building lasting relationships. Your agency’s vision and mission will shine through in a presentation that’s both powerful and persuasive, making your proposals truly unforgettable!


10 slides
Business Strategy Puzzle Presentation
Build a strong foundation with the Business Strategy Puzzle. This visually compelling design helps you break down key strategic components, business planning, and operational workflows into digestible segments. Perfect for corporate strategies, project management, and executive decision-making. Fully editable and compatible with PowerPoint, Keynote, and Google Slides.


23 slides
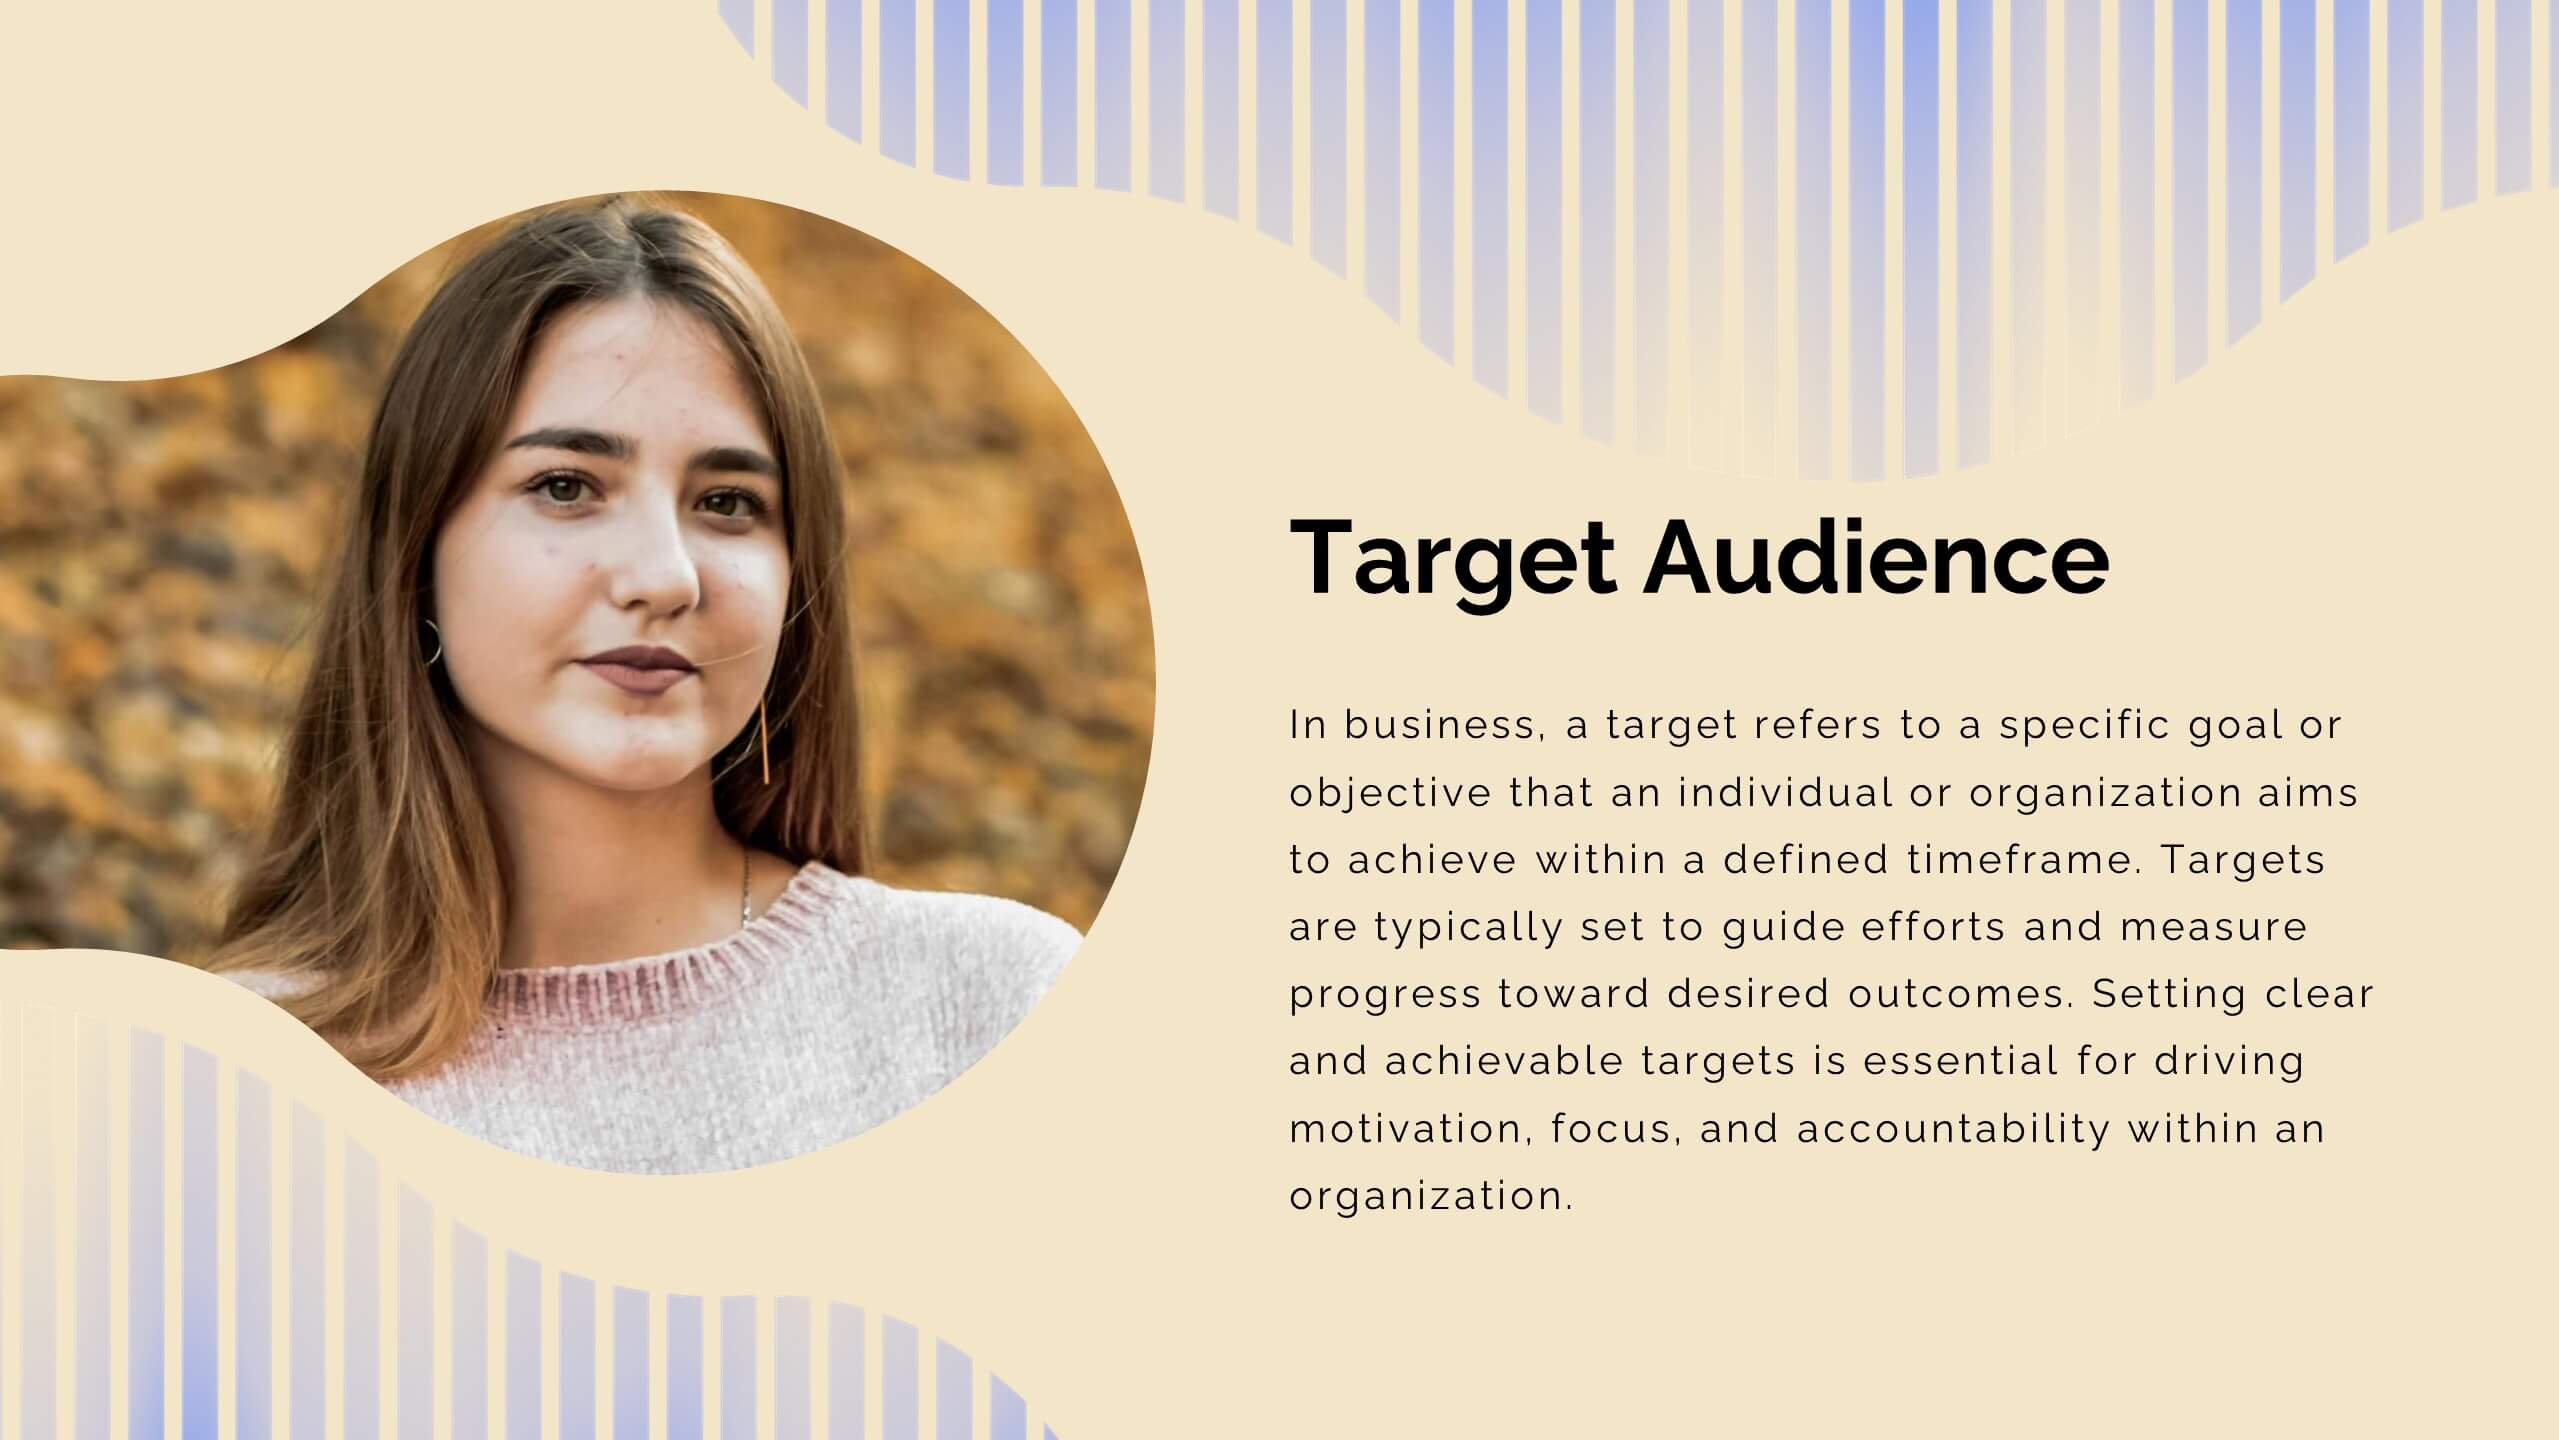
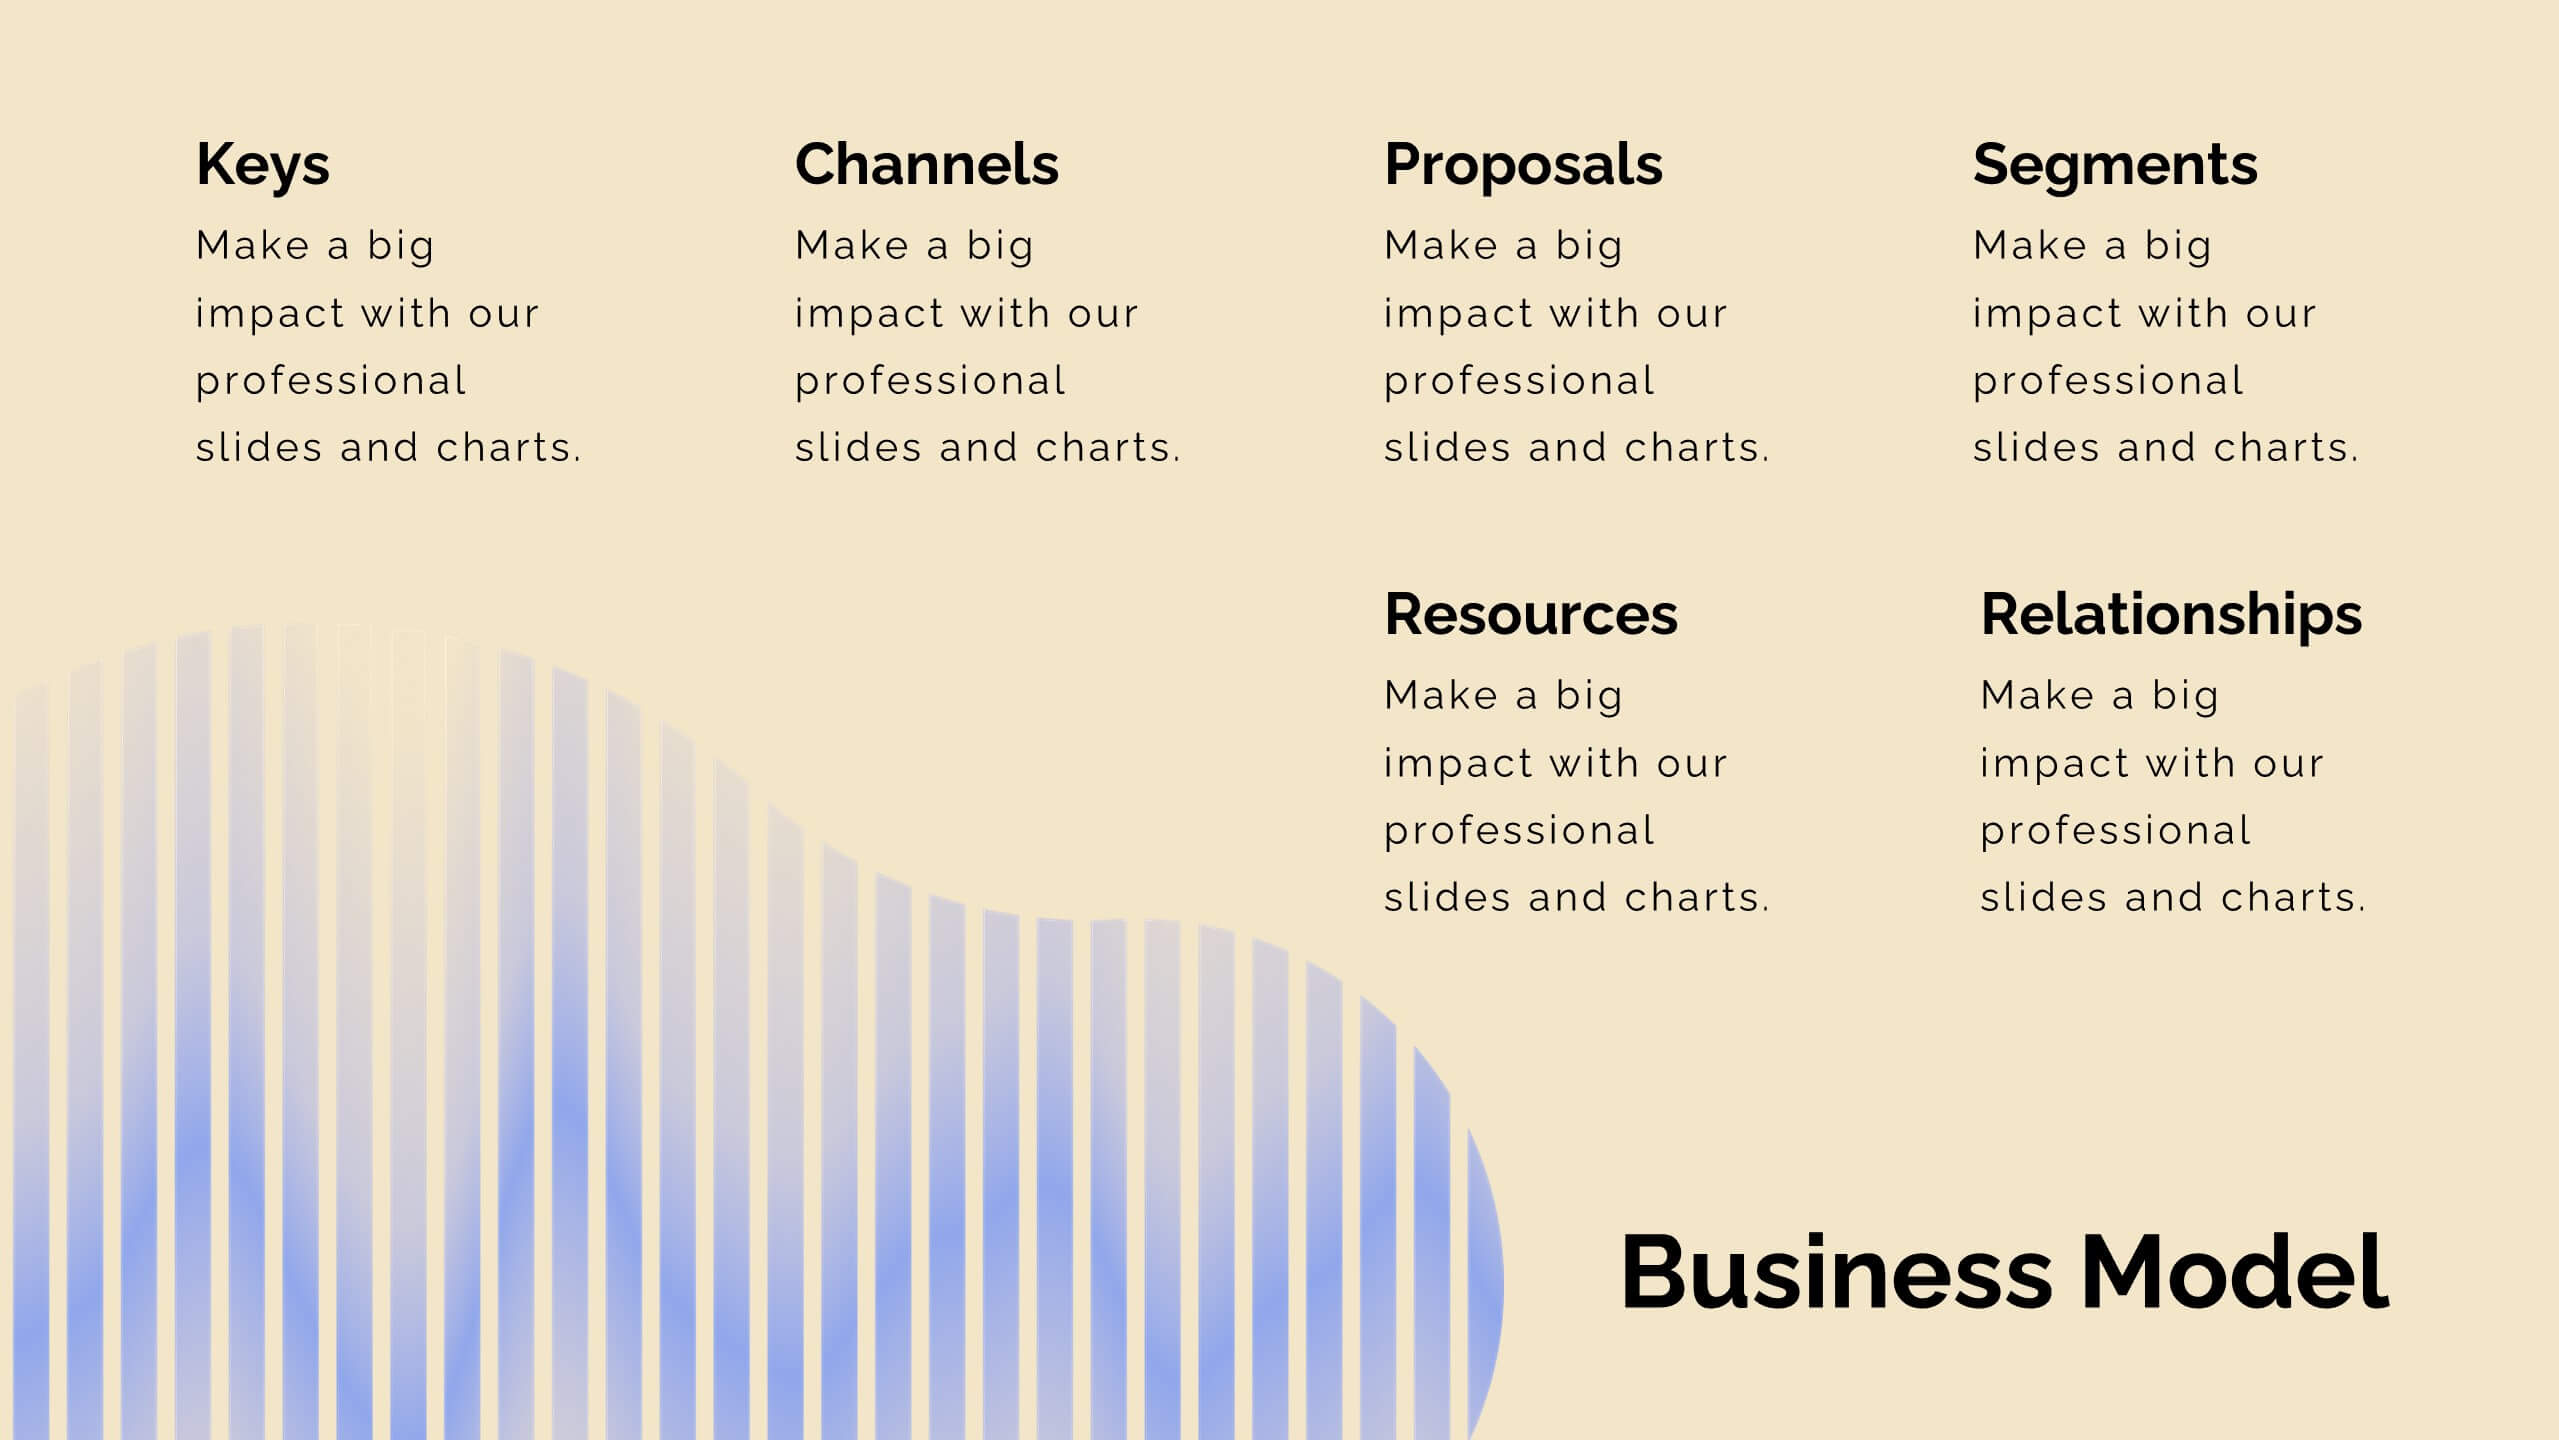
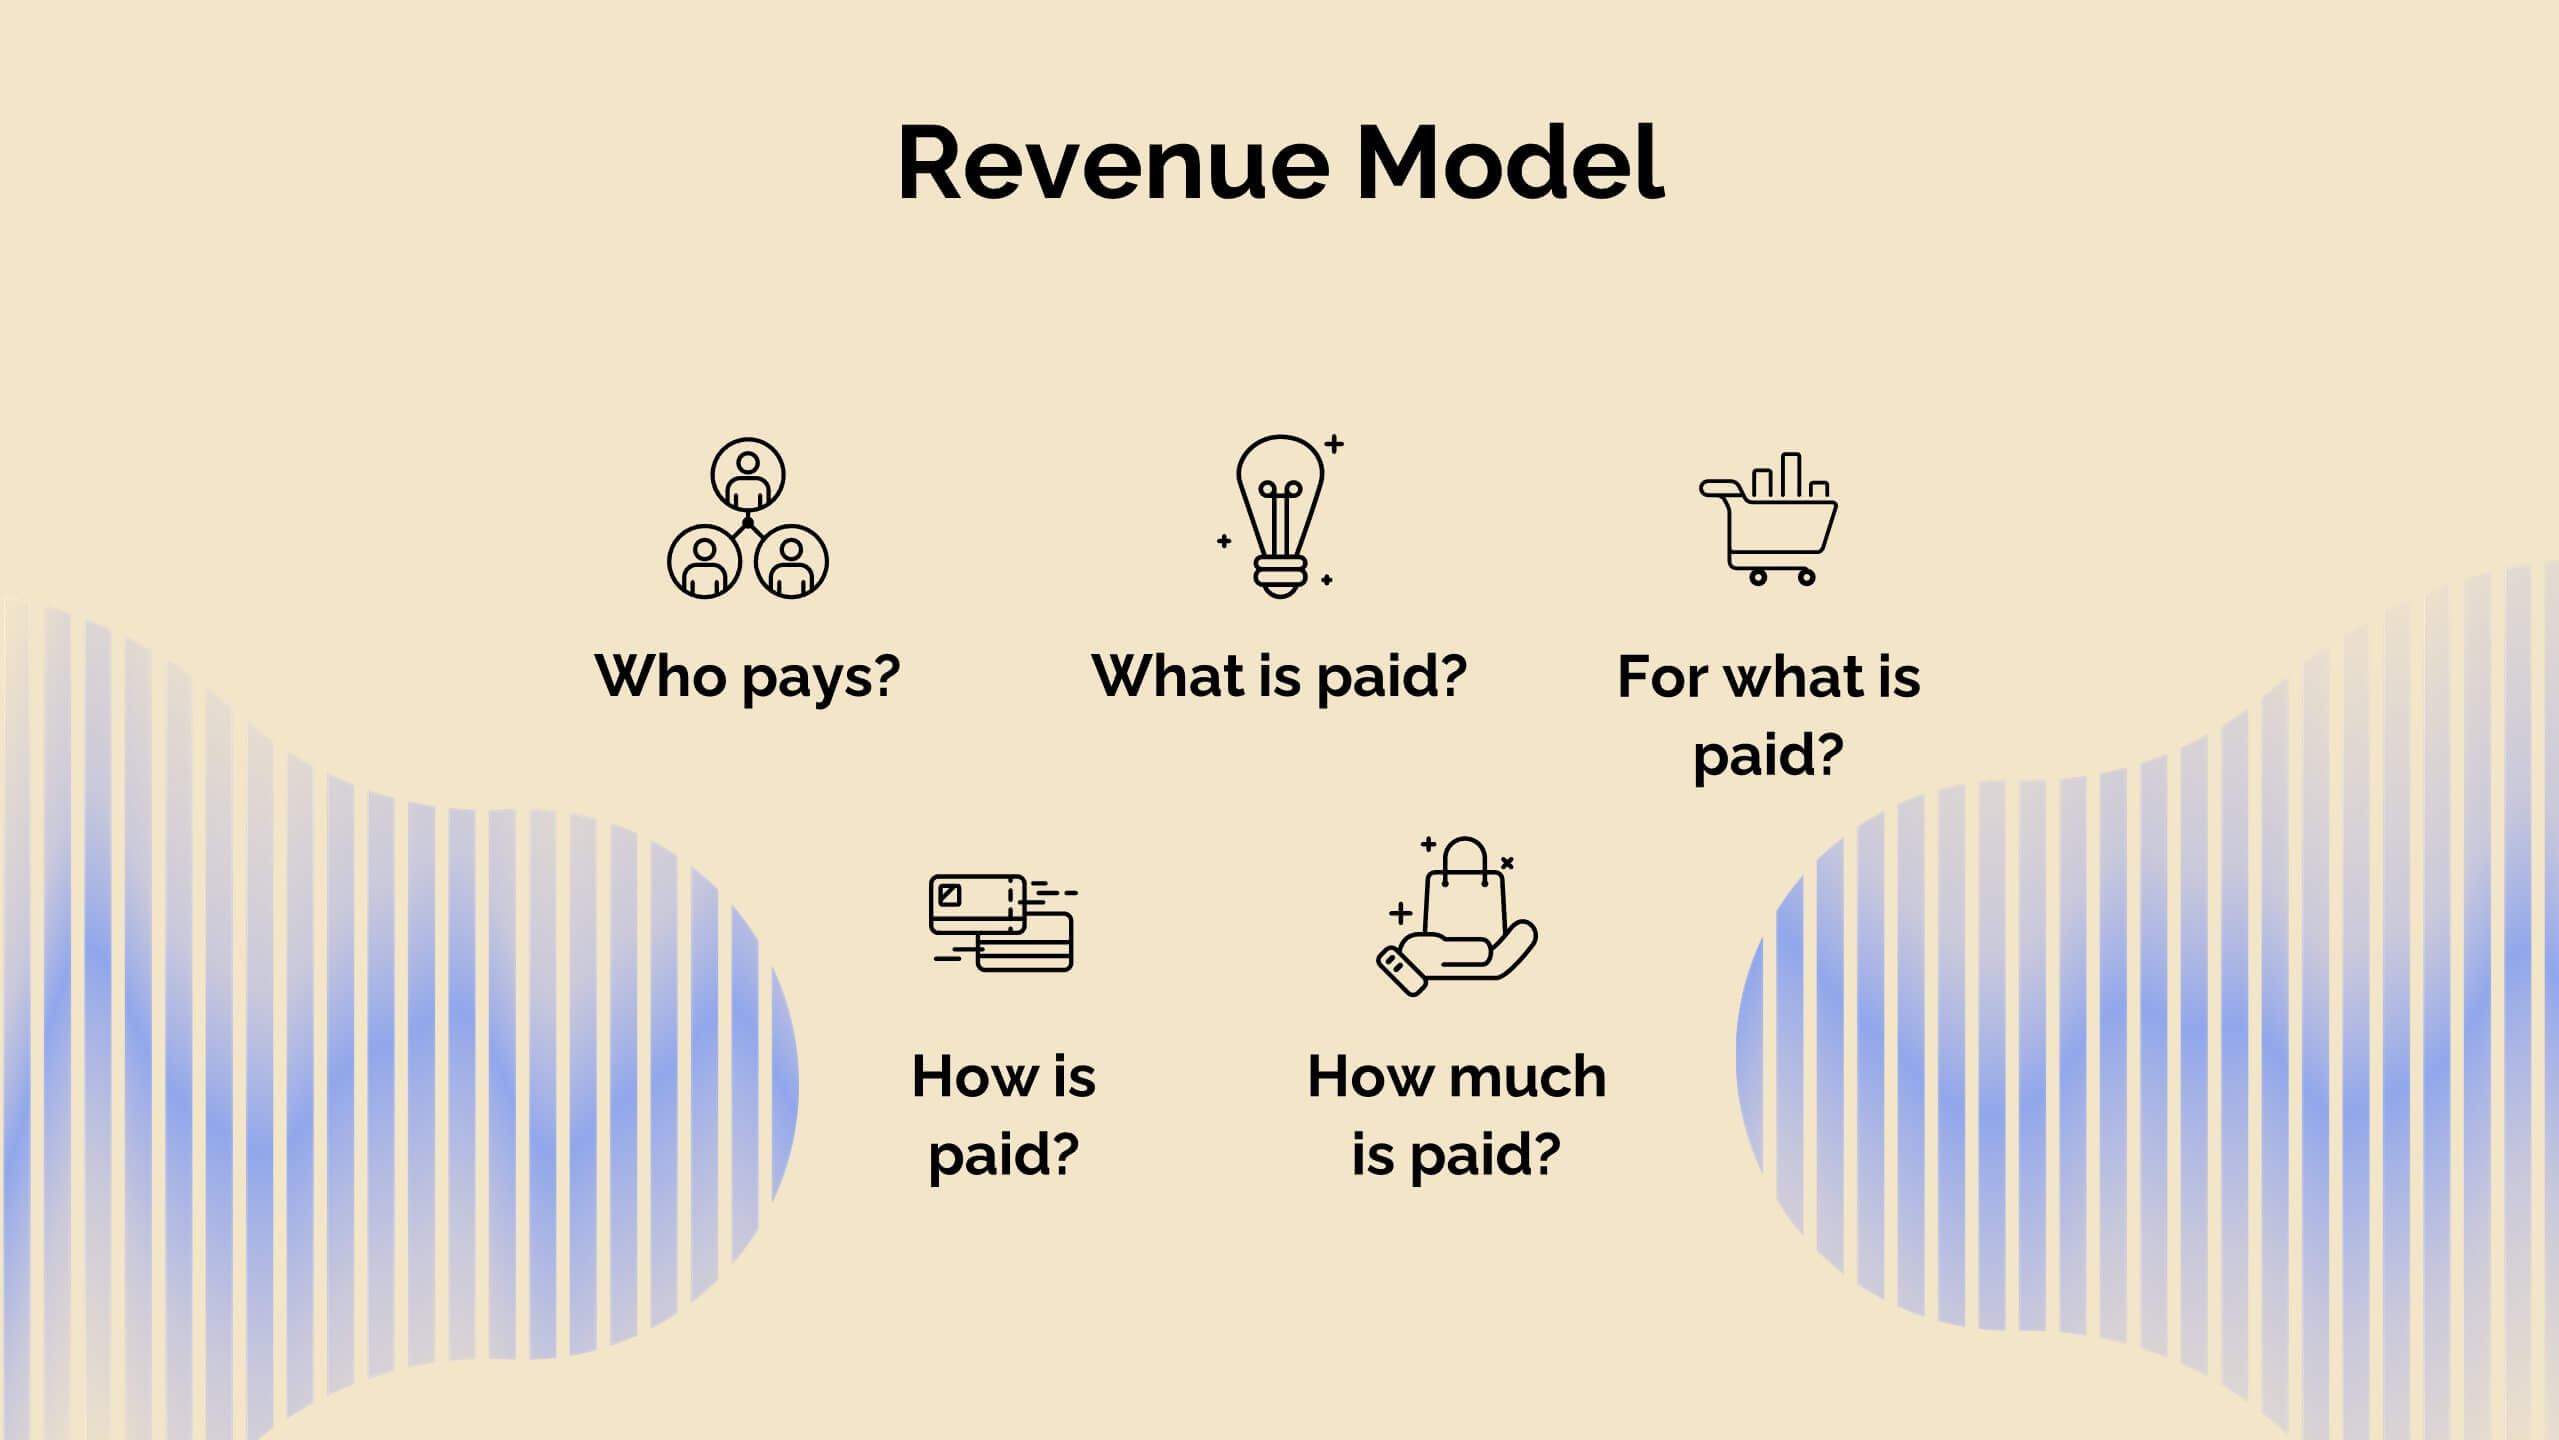
Journey Product Roadmap Presentation
Embark on a seamless journey through your product’s lifecycle with this comprehensive roadmap template! Perfect for illustrating key milestones, business models, and market opportunities, it’s your go-to for clear and engaging presentations. Dive into competitive analysis, showcase your unique selling proposition, and outline your growth projections with style. Compatible with PowerPoint, Keynote, and Google Slides.


6 slides
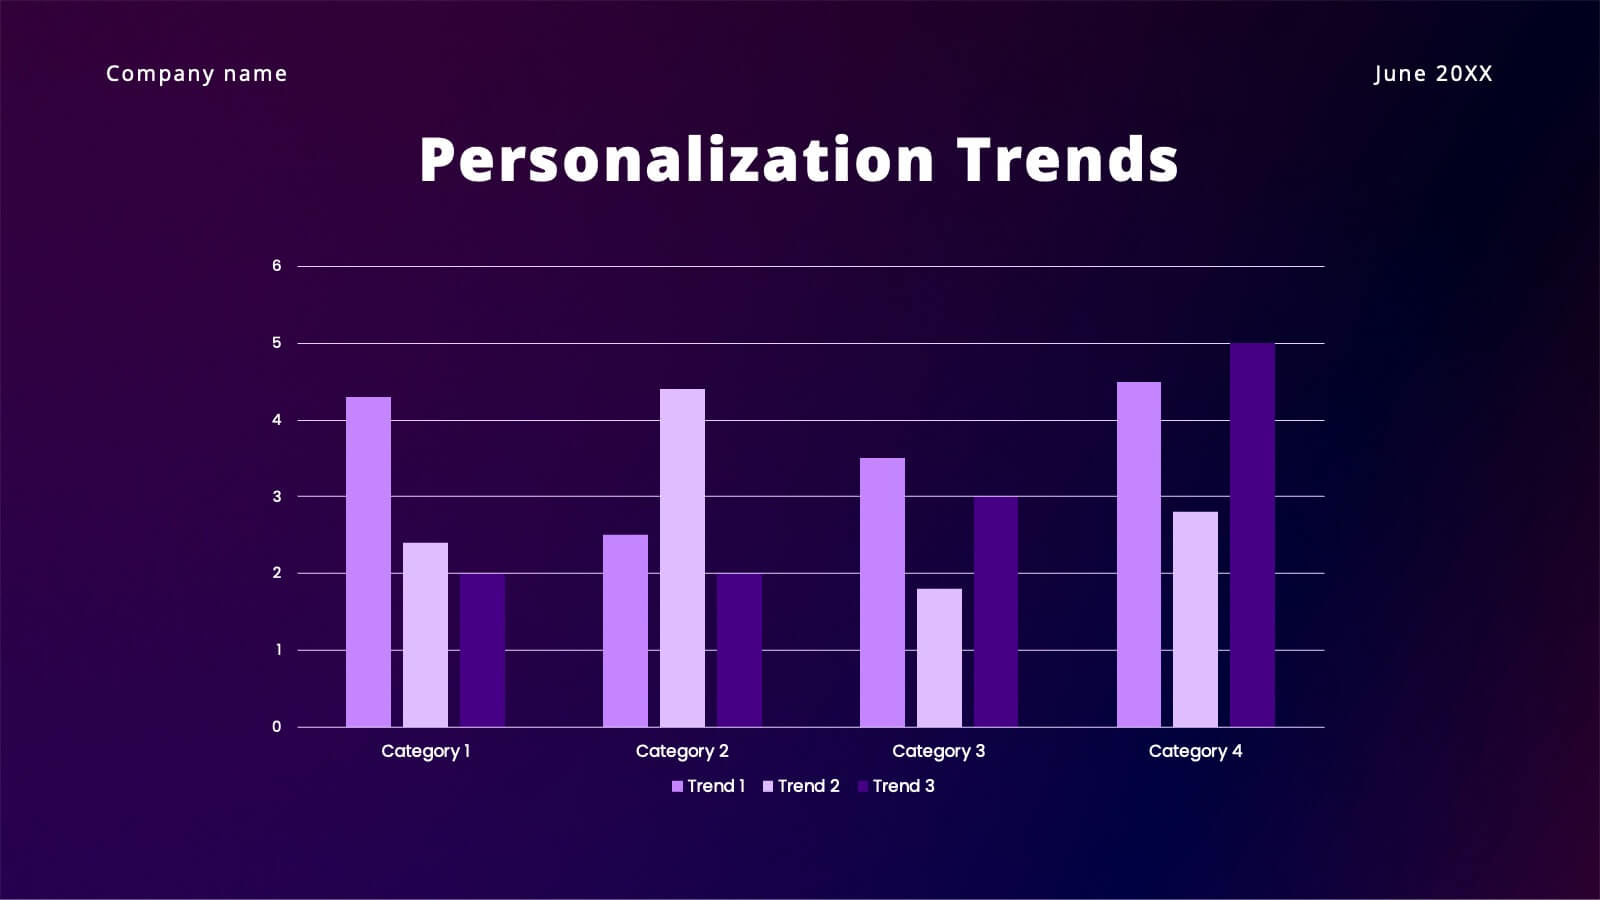
Revenue Projection and Expense Planning
Bring your numbers to life with this clear, visually-driven layout that helps you compare revenue projections and expense plans with ease. This presentation template uses dynamic bar charts to illustrate financial trends over time, making complex data easy to interpret for stakeholders. Fully compatible with PowerPoint, Keynote, and Google Slides.


7 slides
Executive Summary Business Infographic
Elevate your executive insights with our meticulously crafted executive summary infographic. Drenched in the professionalism of blue tones and accented by the prestige of gold, our template encapsulates key findings and top-tier decisions in a comprehensive yet concise manner. Enriched with pinpoint infographics, emblematic icons, and relevant image placeholders, it conveys essential details with precision. Perfectly honed for Powerpoint, Keynote, or Google Slides. An indispensable resource for business leaders, managers, and analysts seeking to distill complex information into actionable insights. Present with authority; let every slide underscore pivotal decisions.