


Features
- 12 Unique Slides
- Fully editable and easy to edit in Microsoft Powerpoint, Keynote and Google Slides
- 16:9 widescreen layout
- Clean and professional designs
- Export to JPG, PDF or send by email


Do you have any questions?
Recommend


7 slides
Performance Cycle Infographic Presentation
A Cycle Infographic is a process-oriented model that describes an ongoing activity or a repeating task. The cycle diagrams are used to show the flow of a process as a series of steps and decisions, each with its own terminations and branches. This template is perfect for motivating, organizing and presenting tasks and projects. It can be used to highlight processes, collaboration, statistics and more. This is a colorful, creative template design for explaining key business ideas, processes or theories in a dynamic and easily digestible way. It's perfect for teaching, students and businesses.


12 slides
Effective Decision-Making with RAPID Presentation
Unlock streamlined decision-making with the Effective Decision-Making with RAPID template, a comprehensive guide designed to help organizations enhance and clarify their decision-making processes. Covering the key phases: Recommend, Agree, Perform, Input, and Decide, this template is essential for teams looking to optimize operational efficiency. Ideal for a variety of business environments, it is compatible with PowerPoint, Keynote, and Google Slides, offering versatility and ease of use for professionals.


6 slides
5G Technology Rollout and Future Vision Presentation
From 1G to 5G, tell the story of progress with this visually engaging infographic slide. Perfect for showcasing mobile network evolution, telecom innovation, or digital transformation strategies, each stage is clearly marked for simple, informative storytelling. Fully compatible with PowerPoint, Keynote, and Google Slides for easy editing and seamless presentation.


5 slides
Professional Relationship Network Presentation
Map out key business connections using this Professional Relationship Network template. Ideal for showcasing client relationships, internal team dynamics, or communication hierarchies. This clean, modern design helps clarify roles and links across stakeholders. Fully editable and compatible with PowerPoint, Keynote, and Google Slides for flexible use in any setting.


5 slides
Project Boundaries and Deliverables Presentation
Visualize key checkpoints with the Project Boundaries and Deliverables Presentation. This flag-style timeline infographic clearly marks each phase of your project journey—ideal for outlining scope, goals, and delivery milestones. Designed for clarity and progress tracking, this template works seamlessly in PowerPoint, Keynote, and Google Slides.


5 slides
Body System Overview Presentation
Visually explain key human body systems with this clean and modern slide. Each section highlights a different organ with labeled points (A–D) for easy reference. Ideal for health education, medical briefings, or anatomy lessons. Fully editable in PowerPoint, Keynote, or Google Slides to suit any professional or academic need.


6 slides
360-Degree Feedback System Overview
Clearly communicate your evaluation process with the 360-Degree Feedback System Overview Presentation. Featuring a circular layout with six editable segments, this template helps visualize feedback from peers, subordinates, managers, and more. Ideal for HR reviews, performance evaluations, and leadership development programs. Fully customizable in PowerPoint, Keynote, or Google Slides.


12 slides
Corporate Sustainability Strategy Presentation
Achieve your sustainability goals with the Corporate Sustainability Strategy Presentation template. This modern, visually engaging layout helps businesses showcase their environmental, social, and governance (ESG) initiatives, sustainability roadmaps, and corporate responsibility plans. Featuring clear, structured sections, this fully customizable design is perfect for corporate leaders, consultants, and eco-conscious organizations. Compatible with PowerPoint, Keynote, and Google Slides for effortless editing and presentation.


7 slides
Supply Chain Logistic Infographics
Streamline your logistics insights with our Supply Chain Logistics Infographic, tailored for logistics managers, supply chain analysts, and operations directors. This infographic provides a visual tool to depict the intricacies and flow of your supply chain from procurement to distribution. Our infographic offers a comprehensive layout to map out each step of the supply chain, highlighting key processes such as supplier selection, manufacturing, inventory management, and logistics. It's designed to facilitate a better understanding of each segment's role in the overall efficiency and effectiveness of the supply chain. Customize this infographic with specific data points, such as lead times, turnover rates, and transportation modes, to provide a detailed view of your logistics operations. This SEO-optimized infographic is crafted to make your supply chain data accessible and actionable. Implement our infographic to communicate the complexities of supply chain logistics succinctly, ensuring that stakeholders grasp the full scope of your supply chain dynamics.


30 slides
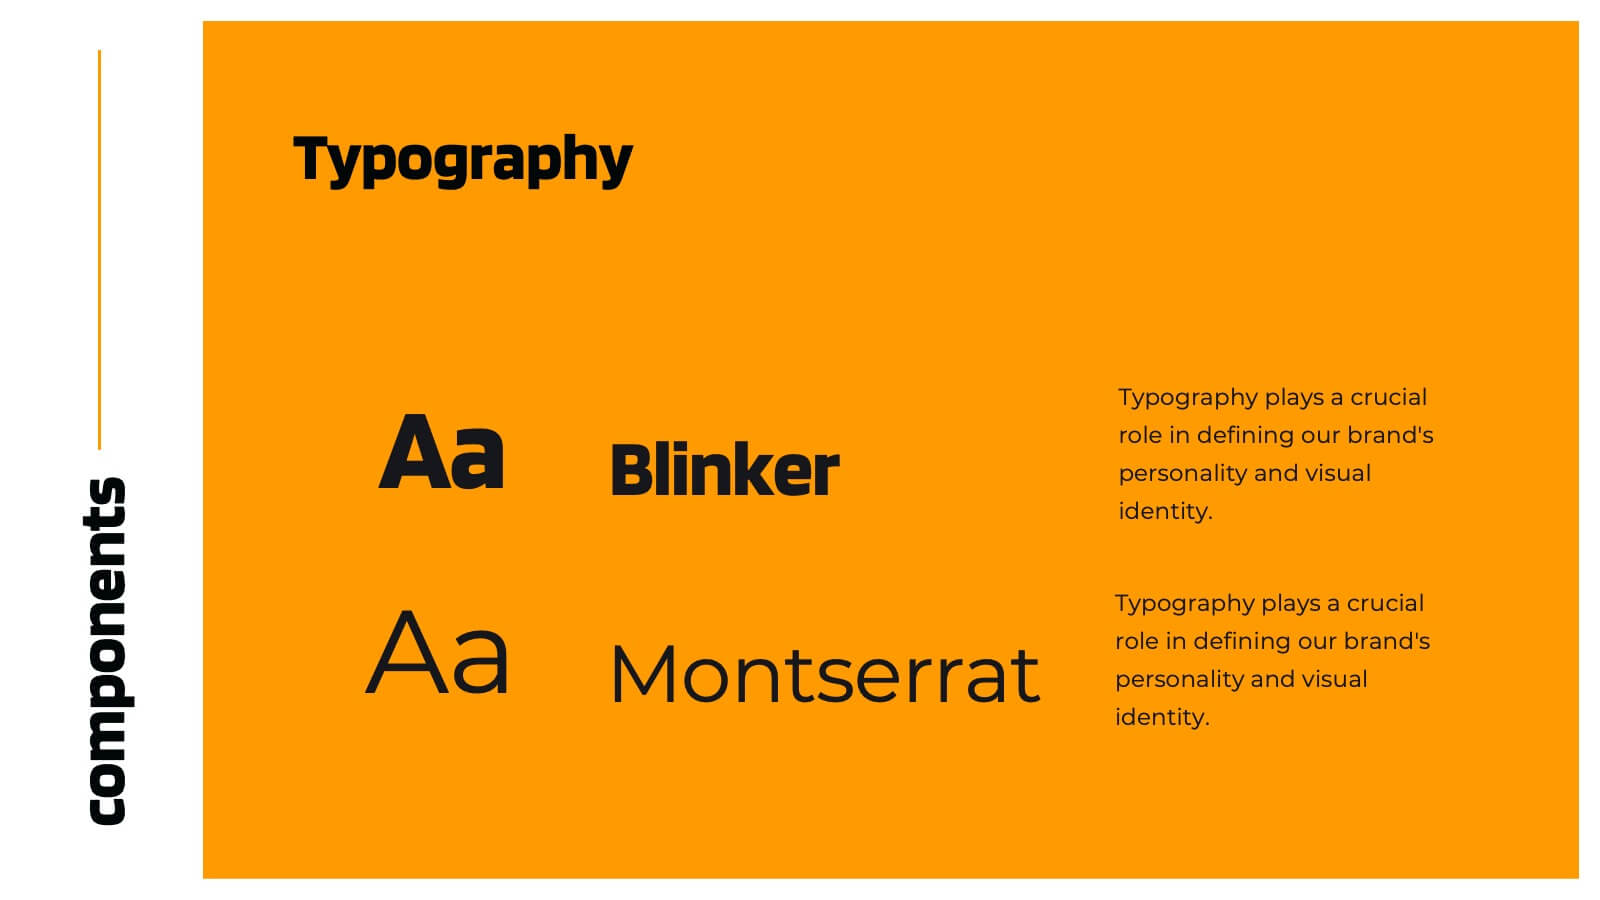
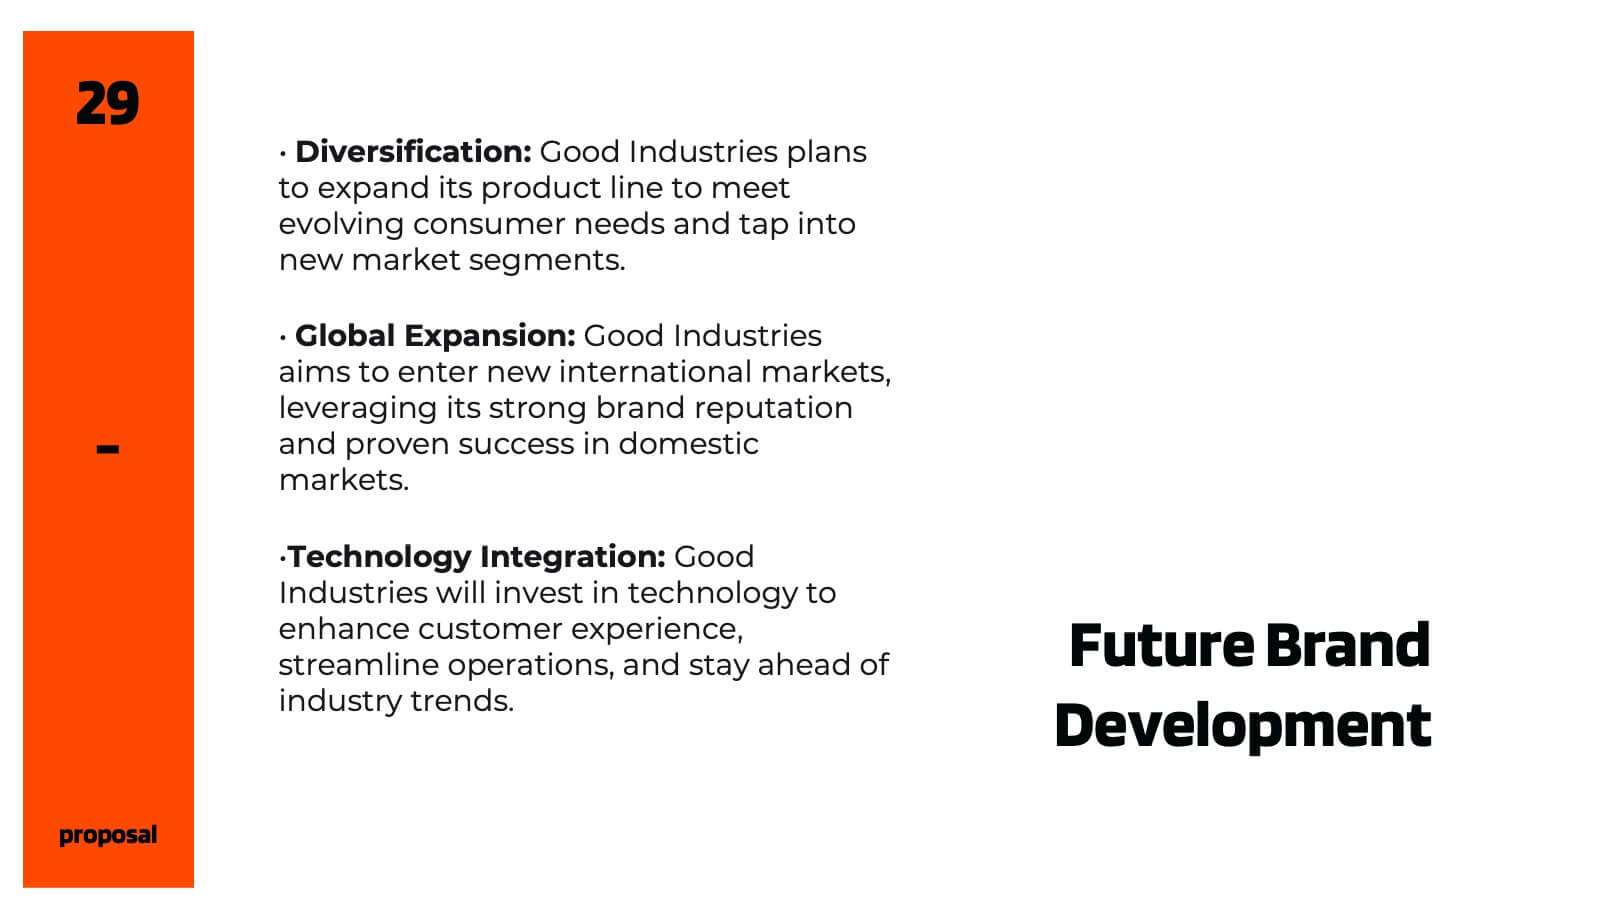
Chromalight Brand Guidelines Proposal Presentation
Elevate your brand's story with this visually engaging presentation template that embodies modern, professional aesthetics. From mission and vision statements to brand identity and market positioning, each slide is crafted to showcase your brand's core essence. Ideal for brand strategists and marketers, this template is compatible with PowerPoint, Keynote, and Google Slides.


6 slides
Editable Weekly Calendar Slide Presentation
Bring your week into focus with a vibrant layout that turns daily planning into something you actually look forward to. This presentation helps you outline tasks, deadlines, and priorities in a clear, color-coded structure perfect for productivity. Fully editable and compatible with PowerPoint, Keynote, and Google Slides.


7 slides
Personal SWOT Infographic
Evaluate your individual potential with our personal SWOT infographic. Set against a clean white backdrop, and punctuated with optimistic yellow, intuitive blue, and assertive red, this template meticulously breaks down strengths, weaknesses, opportunities, and threats on a personal level. Adorned with concise infographics, suggestive icons, and adaptable image placeholders, it offers a panoramic introspection into personal growth avenues. Flawlessly designed for Powerpoint, Keynote, or Google Slides. An invaluable asset for career counselors, personal coaches, individuals looking for self-improvement, or anyone aiming for personal development.


6 slides
Informational Data Table Overview Presentation
Present your tasks with clarity using this Informational Data Table Overview presentation. Perfect for team planning, status updates, or project management, this slide helps you organize tasks by name, due date, priority, and assignment. Visual indicators make it easy to track progress at a glance. Fully editable in PowerPoint, Canva, and Google Slides.


7 slides
Competitive Advantage Through Value Chain
Make your value chain comparison stand out with this bold, visual slide that maps two sides head-to-head. Perfect for highlighting competitive advantages, strategic differences, and operational gaps. This template is clear, customizable, and ready to plug into PowerPoint, Keynote, or Google Slides.


7 slides
Decision Tree Diagram Infographics
A Decision Tree Diagram is a visual representation of a decision-making process that uses a tree-like structure to map out various possible outcomes and their associated probabilities. This template can be used in fields such as business, economics, and data science to model complex decision-making scenarios. This infographic starts with a single node, representing the initial decision that needs to be taken. From this node, paths extend to other nodes representing possible outcomes that could occur as a result of the initial decision. The final nodes of the diagram represent the end results.


5 slides
Benefits of Insurance Infographics
The purpose of insurance is to mitigate the financial impact of unexpected events or circumstances that may result in financial loss. These infographic templates are versatile and effective tools to convey the value of insurance to your audience. These are perfect to highlight the various advantages and importance of having insurance coverage. This serves as an engaging tool to educate and inform your audience about the benefits of different types of insurance policies. This makes it easy for viewers to understand the benefits and importance of insurance in various aspects of life. Compatible with Powerpoint, Keynote, and Google Slides.


5 slides
Live Sports Infographics
Immerse in the dynamic realm of athletics with our live sports infographics. Crafted in a medley of energetic blue, spirited yellow, and various vivid hues, this template radiates the inherent in the world of sports. Its creative and vertical layout, optimized for impact, is perfect for sports journalists. Compatible with Powerpoint, Keynote, and Google Slides. The compelling graphics, icons, and dedicated image placeholders are specifically tailored to encapsulate the pulse-pounding moments and diverse statistics of live sports events. This visually striking, data-centric tool is indispensable for those seeking to convey complex sports information.