


Features
- 8 Unique Slides
- Fully editable and easy to edit in Microsoft Powerpoint, Keynote and Google Slides
- 16:9 widescreen layout
- Clean and professional designs
- Export to JPG, PDF or send by email


Do you have any questions?
Recommend


5 slides
Pandemic Prevention and Treatment Options Infographics
Pandemic Prevention is the proactive measures taken to reduce the risk of the spread and impact of infectious diseases on a global scale. These infographic templates are designed to communicate the essential information about pandemic prevention and treatment options. It provides a visually appealing and easy-to-understand overview of key concepts, preventive measures, and treatment options. Use this template to educate and empower your audience with the knowledge needed to navigate pandemics effectively and contribute to public health and safety. This template is perfect for healthcare professionals, educators, and organizations looking to share valuable information.


6 slides
Customer Support Team Infographic
The set of slides presented is meticulously designed to encapsulate the essence of customer support team operations, highlighting various key aspects such as teamwork, communication channels, customer interaction points, and support strategies. Each slide utilizes a clean and professional design, integrating soft color palettes and structured layouts to clearly convey complex information in an accessible way. These slides are particularly useful for customer support teams looking to present or revamp their strategy, showcasing how they handle customer queries and feedback across different platforms. The visual elements such as graphs, hierarchical diagrams, and process flows are strategically used to illustrate the team’s structure, response processes, and efficiency metrics, making it easier for stakeholders to grasp the effectiveness of customer support initiatives. Such a collection is indispensable for training new team members, demonstrating the team's impact on customer satisfaction, and internal reviews to improve service delivery. By using these slides, teams can ensure a consistent understanding of goals, roles, and procedures, which is crucial for maintaining high standards of customer service and team alignment.


20 slides
Pulsebeat Sales Proposal Presentation
Seal the deal with this compelling sales proposal template, crafted to showcase your offerings, customer value, and competitive edge with clarity. Including slides for sales objectives, process, pricing strategy, and performance metrics, it’s perfect for sales teams aiming to impress. Compatible with PowerPoint, Keynote, and Google Slides for effortless presentation.


8 slides
Airline Business Strategy Presentation
Leverage key insights into the aviation sector with the "Aviation Industry Market Analysis" presentation template. This design allows professionals in the aviation industry to effectively communicate market trends and forecasts. Its compatibility with PowerPoint, Keynote, and Google Slides ensures a versatile use across different platforms, making it ideal for industry analyses, investor meetings, or internal strategy discussions.


22 slides
Diana Digital Agency Strategy Plan Presentation
Set your agency’s strategy in motion with this sleek and professional presentation! Featuring essential sections like market analysis, service offerings, campaign execution, and client success stories, it’s built to align your vision and goals. Ideal for client pitches or internal meetings, it’s fully compatible with PowerPoint, Keynote, and Google Slides.


5 slides
User Insights Based on Demographics Presentation
Showcase key demographic segments with this visually engaging user insights slide. Featuring icon-based representations with circular percentage indicators, it’s ideal for displaying gender, age, behavior, or regional breakdowns. Perfect for marketing reports, audience research, or strategic planning presentations, it clearly highlights trends and helps guide data-driven decisions.


10 slides
Post-Pandemic Business Strategy Presentation
Help your team adapt to the new normal with this sleek and professional slide layout. Featuring a sanitizer bottle graphic as a central metaphor, the design visually supports your content on strategic recovery, operational safety, or workflow changes. Includes four editable text sections, each with modern icons. Ideal for HR, leadership updates, or business continuity plans. Compatible with PowerPoint, Keynote, and Google Slides.


6 slides
Six-Sided Strategy with Hexagon Infographic Presentation
Present your six-point plan with clarity using the Six-Sided Strategy with Hexagon Infographic Presentation. This geometric layout highlights each core element in a balanced, easy-to-follow format—ideal for frameworks, business models, or strategy steps. Fully customizable in Canva, PowerPoint, Keynote, and Google Slides for seamless integration.


6 slides
Six Sigma Certification Infographics
Explore the world of Six Sigma Certification with our customizable infographic template. This template is fully compatible with popular presentation software like PowerPoint, Keynote, and Google Slides, allowing you to easily customize it to illustrate and communicate various aspects of Six Sigma certification and its benefits. The Six Sigma Certification infographic template offers a visually engaging platform to outline the different levels of certification, the DMAIC methodology, and the impact of Six Sigma on quality improvement within organizations. Whether you're a quality professional, project manager, or someone looking to enhance your process improvement skills, this template provides a user-friendly canvas to create informative presentations and educational materials. Deepen your knowledge of Six Sigma Certification with this SEO-optimized infographic template, thoughtfully designed for clarity and ease of use. Customize it to showcase the certification requirements, training options, project success stories, and the potential for career advancement, ensuring that your audience gains valuable insights into the world of Six Sigma. Start crafting your personalized infographic today to explore the realm of Six Sigma Certification.


5 slides
5G Use Cases and Industry Applications Presentation
Unlock the possibilities of next-generation connectivity with a clear, visual explainer designed to showcase how different industries benefit from faster, smarter networks. This presentation breaks down key applications, technology shifts, and real-world 5G impact in an easy, engaging format. Fully compatible with PowerPoint, Keynote, and Google Slides.


4 slides
Simple RACI Matrix Overview Presentation
Bring instant clarity to every role with a clean, puzzle-style layout designed to map responsibilities without confusion. This presentation helps teams outline who leads, supports, approves, and stays informed in any project, turning tasks into a simple visual grid. Fully editable and compatible with PowerPoint, Keynote, and Google Slides.


4 slides
3-Circle Venn Diagrams Presentation
Unlock clarity with a bold visual that highlights how ideas, data, or teams connect at key intersection points. This presentation makes complex relationships easy to explain with clean circles, labels, and structured insights. Fully editable and compatible with PowerPoint, Keynote, and Google Slides.


7 slides
E-Learning Solutions Infographic
Elevate the e-learning experience with our E-Learning infographic. Featuring a harmonious blend of serene purple and crisp white, this infographic encapsulates the transformative world of digital learning. Tailored for educators, e-learning consultants, and instructional designers, it vividly illustrates the nuances of online education. Incorporated within are ingenious graphics, relevant icons, and dedicated image placeholders, all set to anchor your content and enhance comprehension. Regardless of your preferred platform – PowerPoint, Keynote, or Google Slides – this template is your tool to effectively convey the dynamism of e-learning.


7 slides
Iceberg Model Infographic Presentation
Iceberg diagrams are versatile, multi-purpose infographics that can be used to show all the factors that will affect your company. It is a great way to visualize information and organize it into one place. With this template, you’ll have the perfect way to analyze your vision and drive growth. The iceberg is used to divide and give detailed information that can be valuable in planning your strategy. Analyze, evaluate and provide data on a specific product or service. This eye-catching template is compatible with PowerPoint, Keynote and Google Slides and includes customizable photo layouts.


21 slides
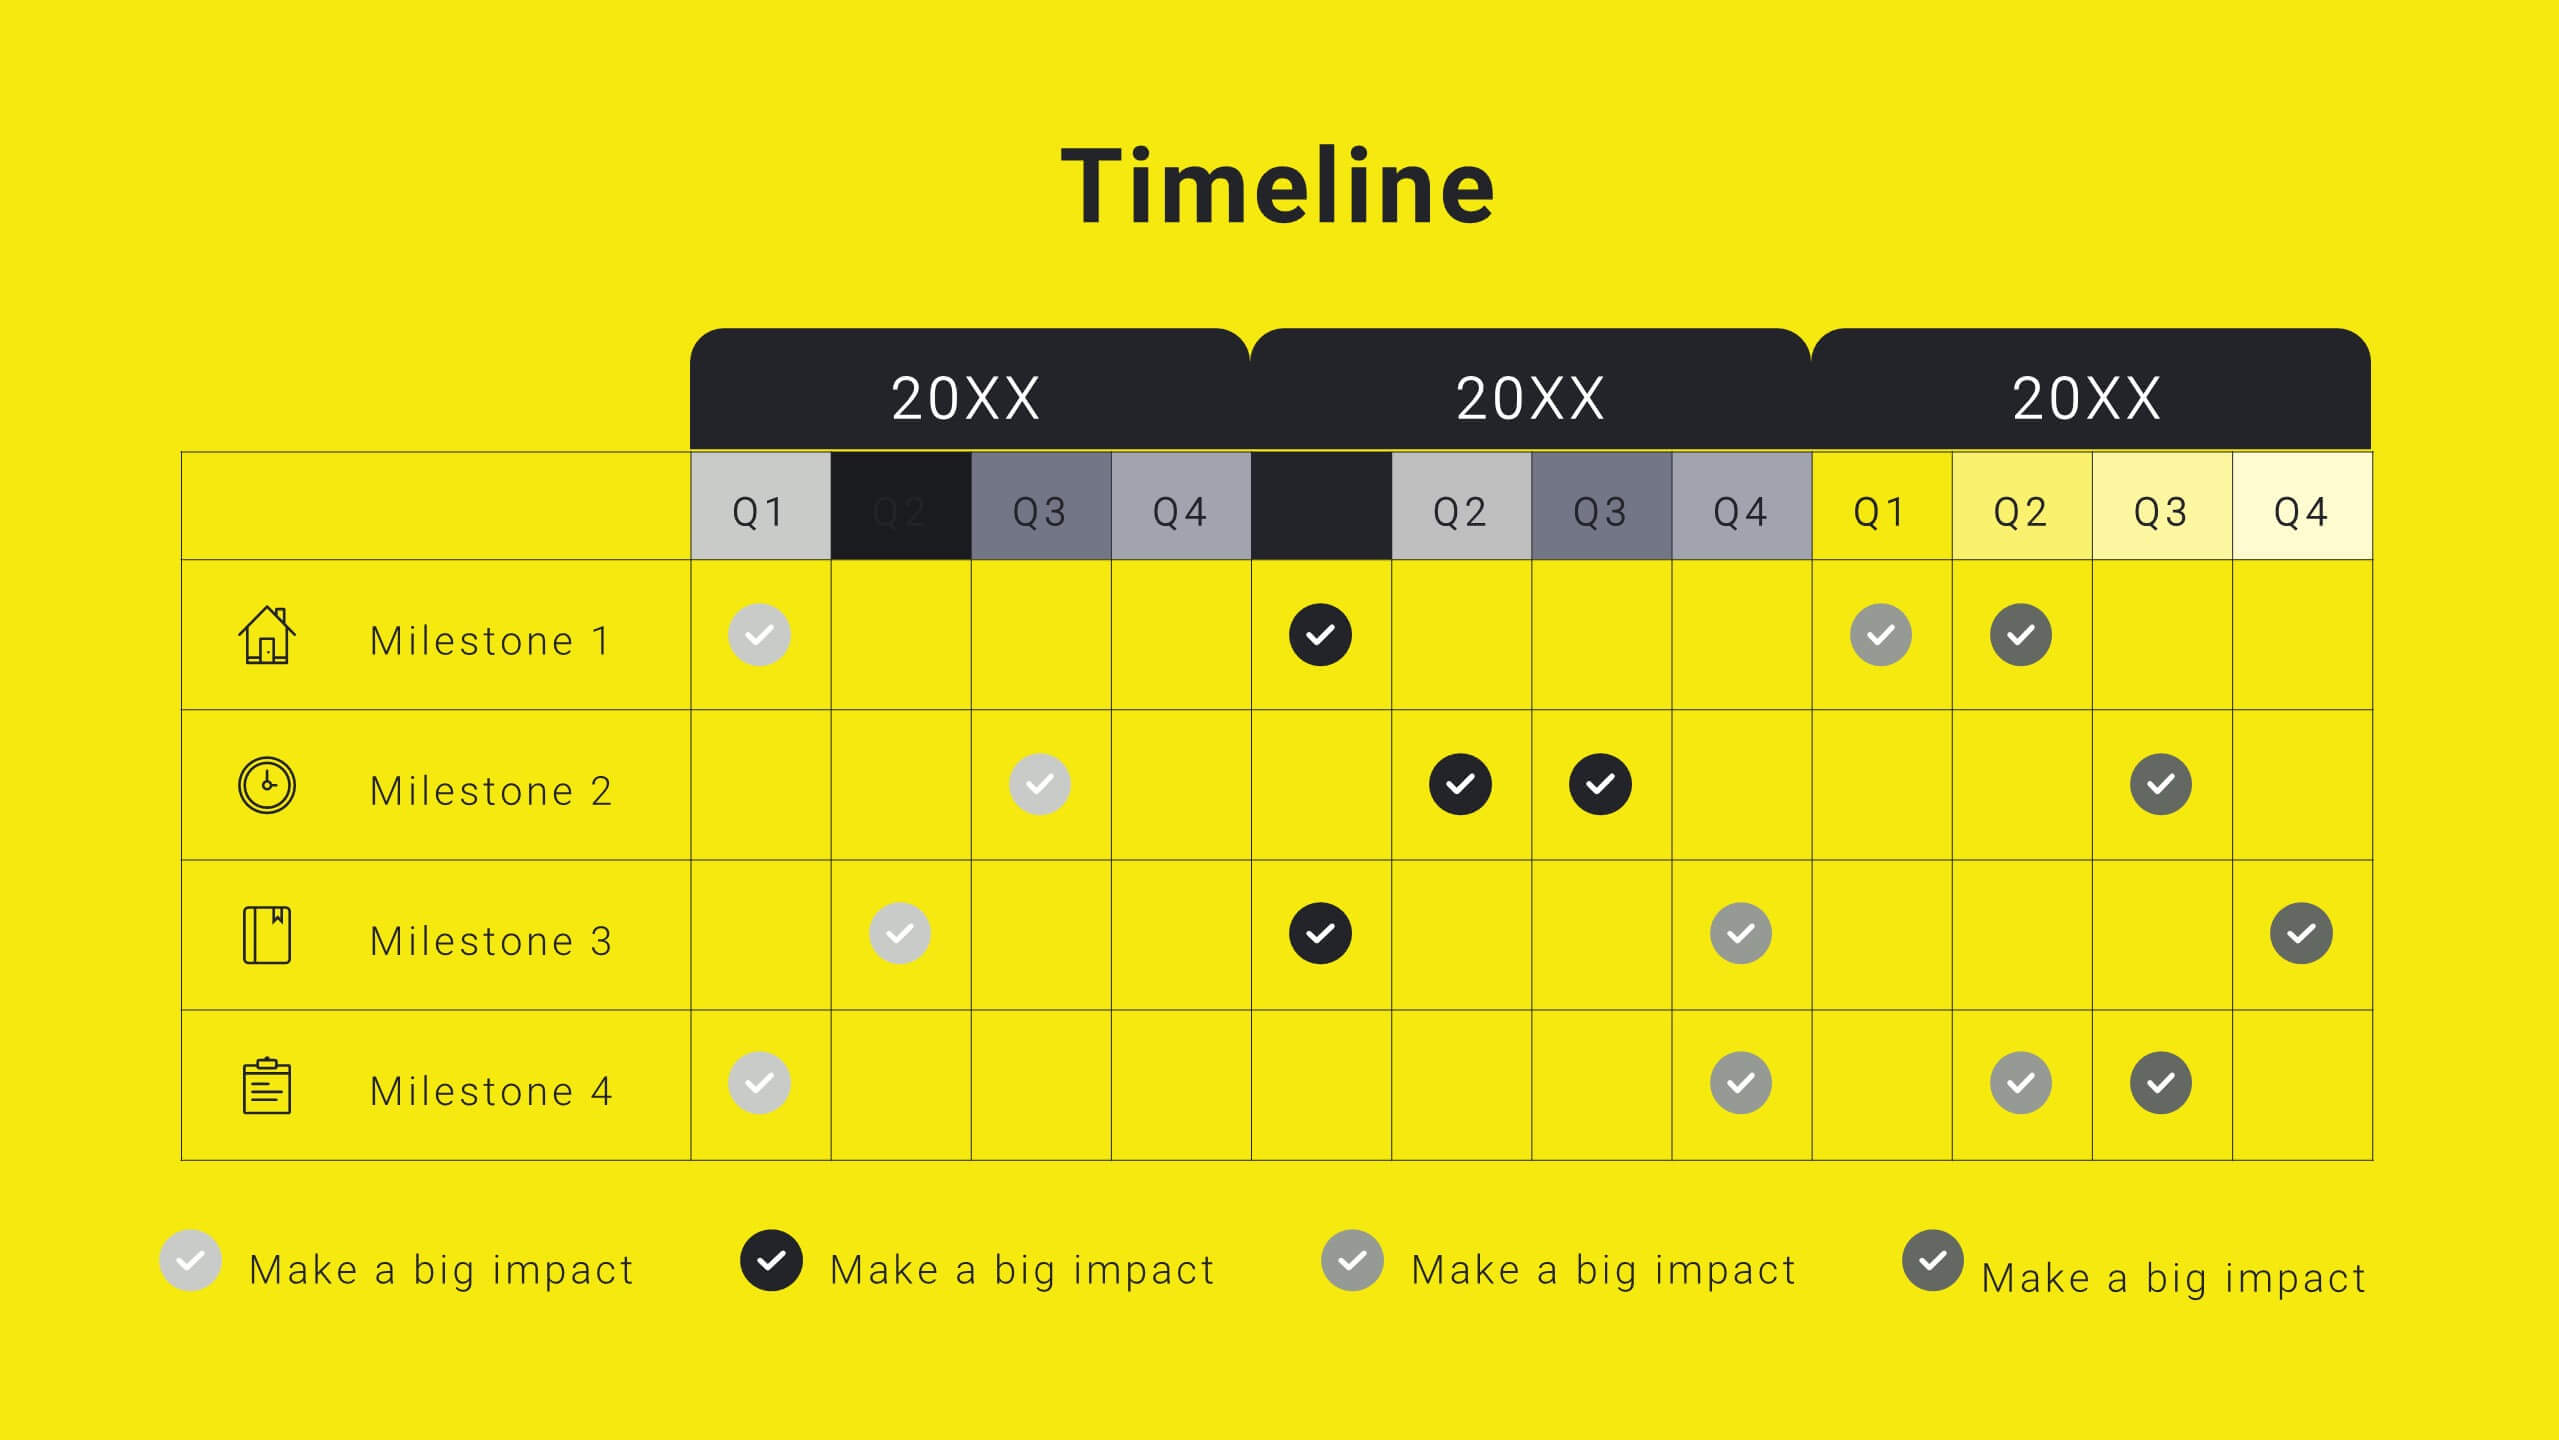
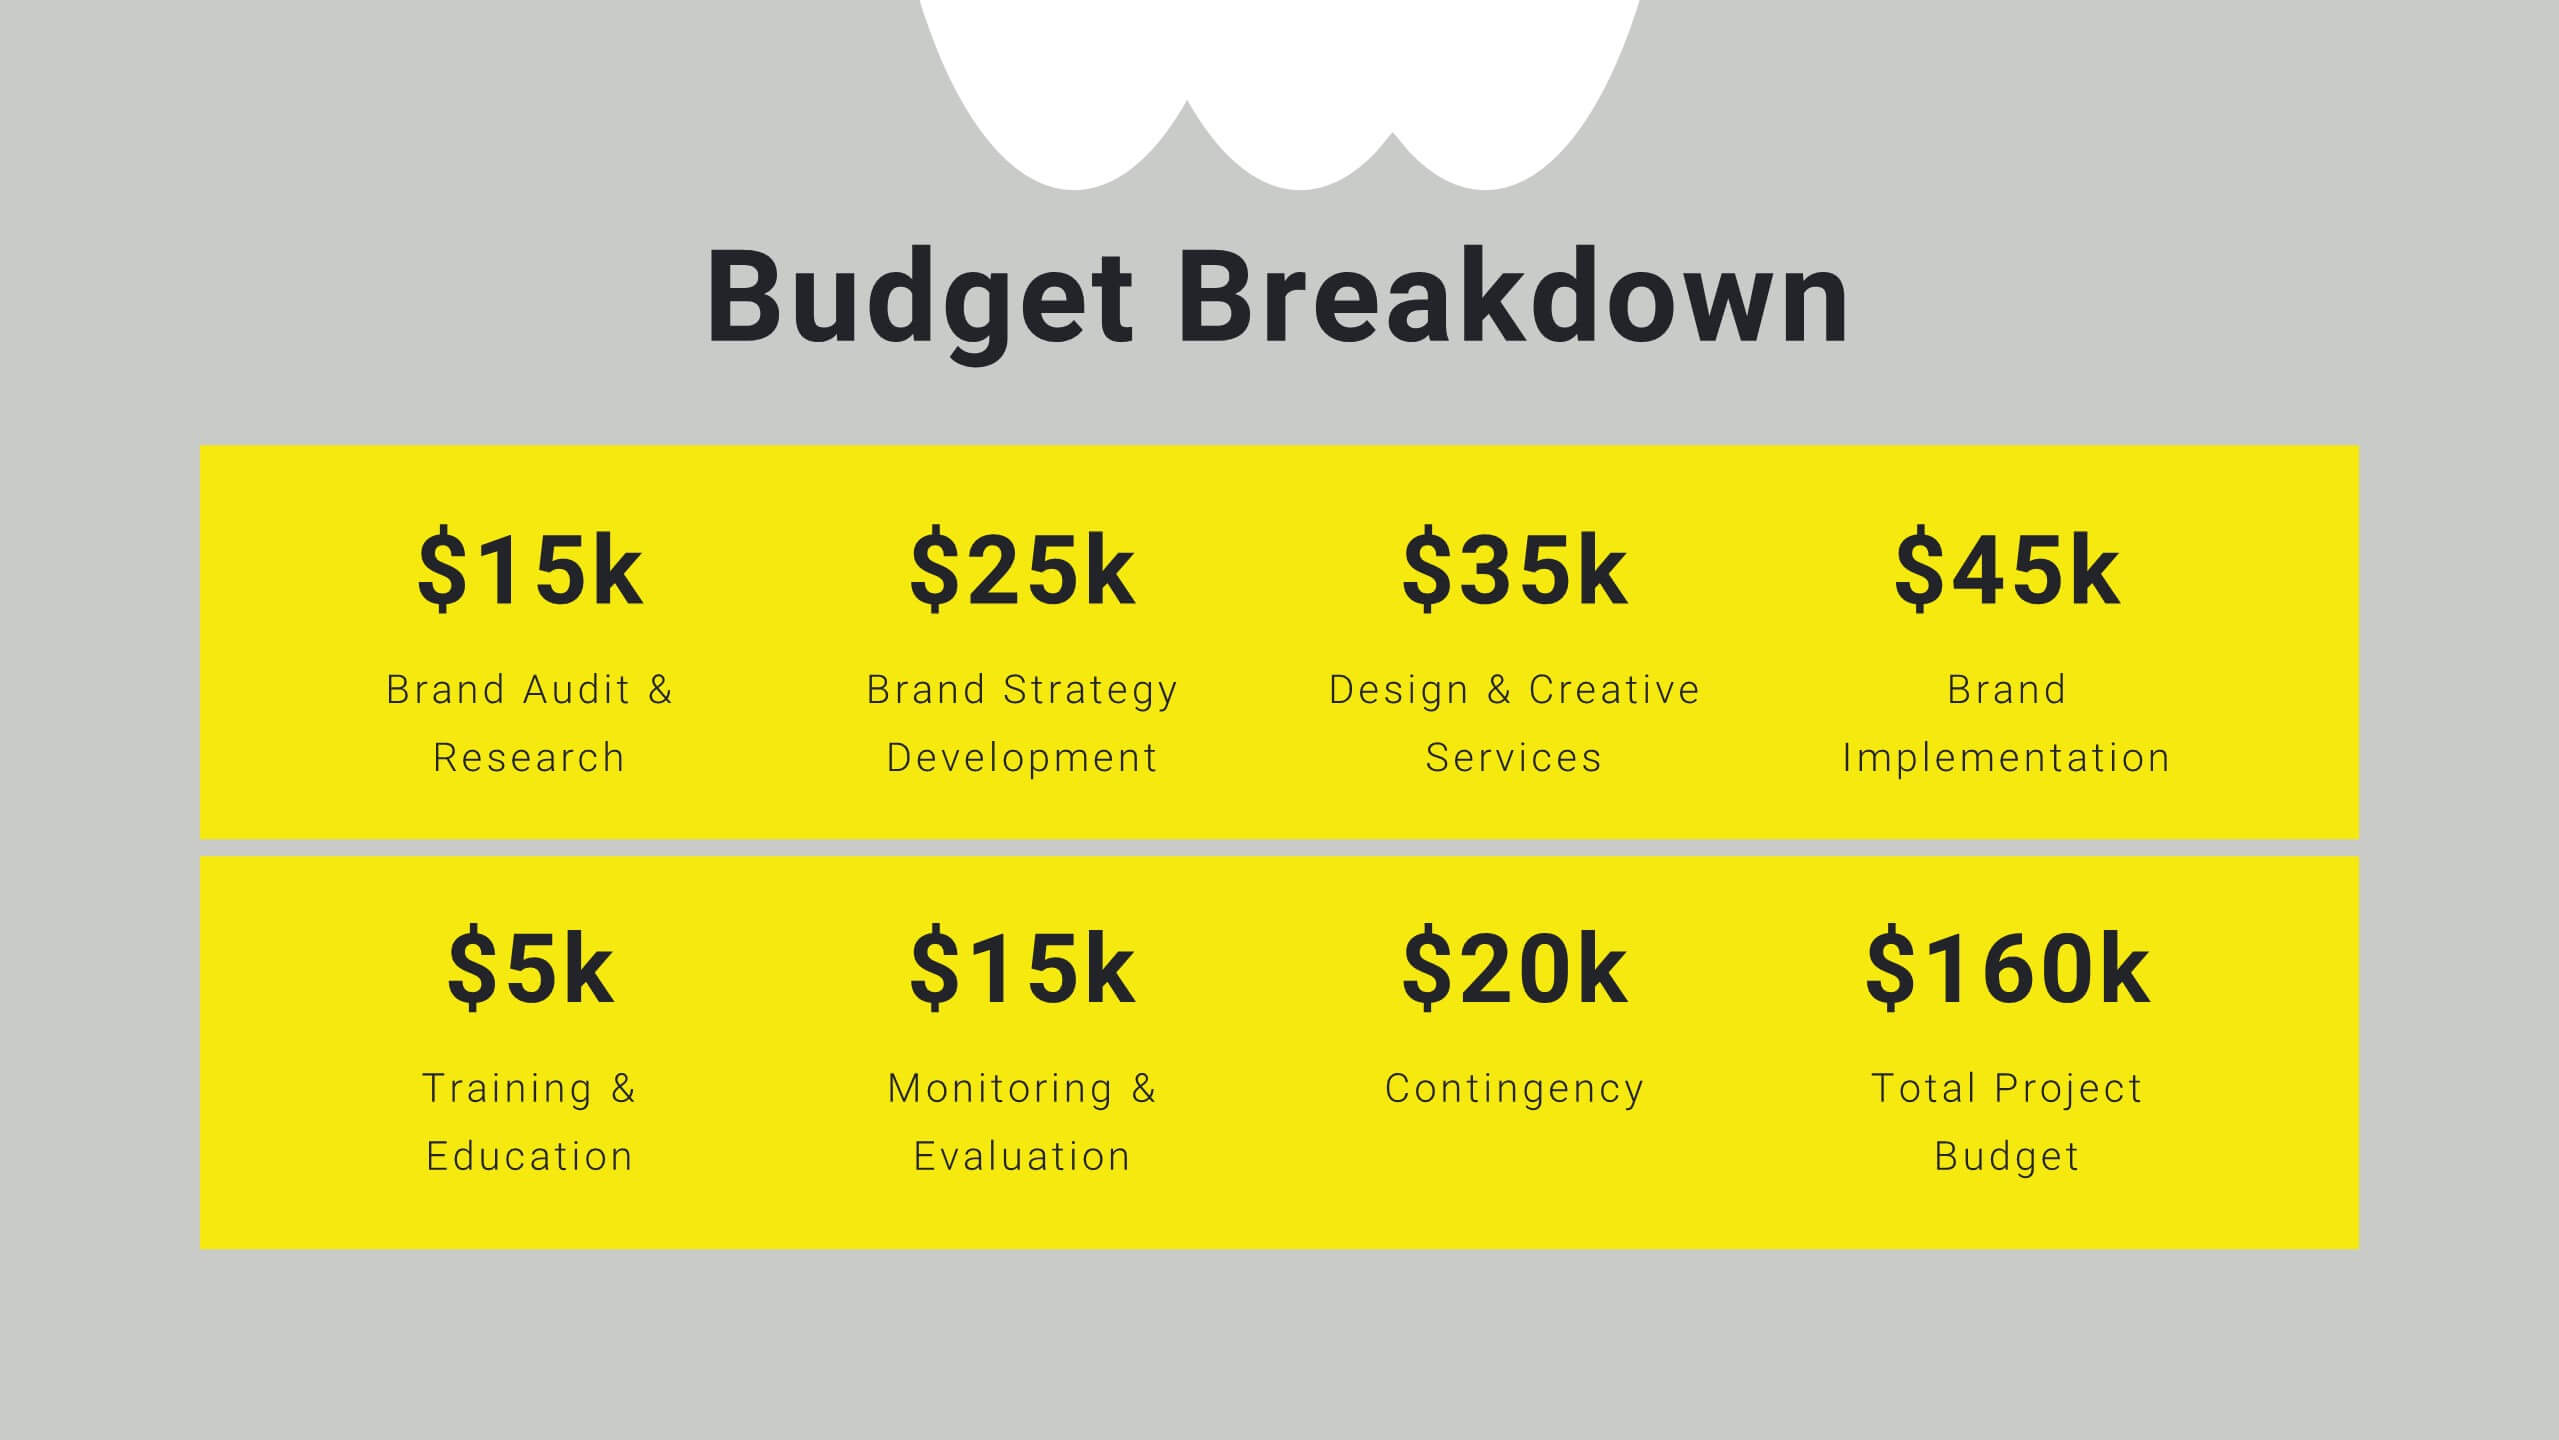
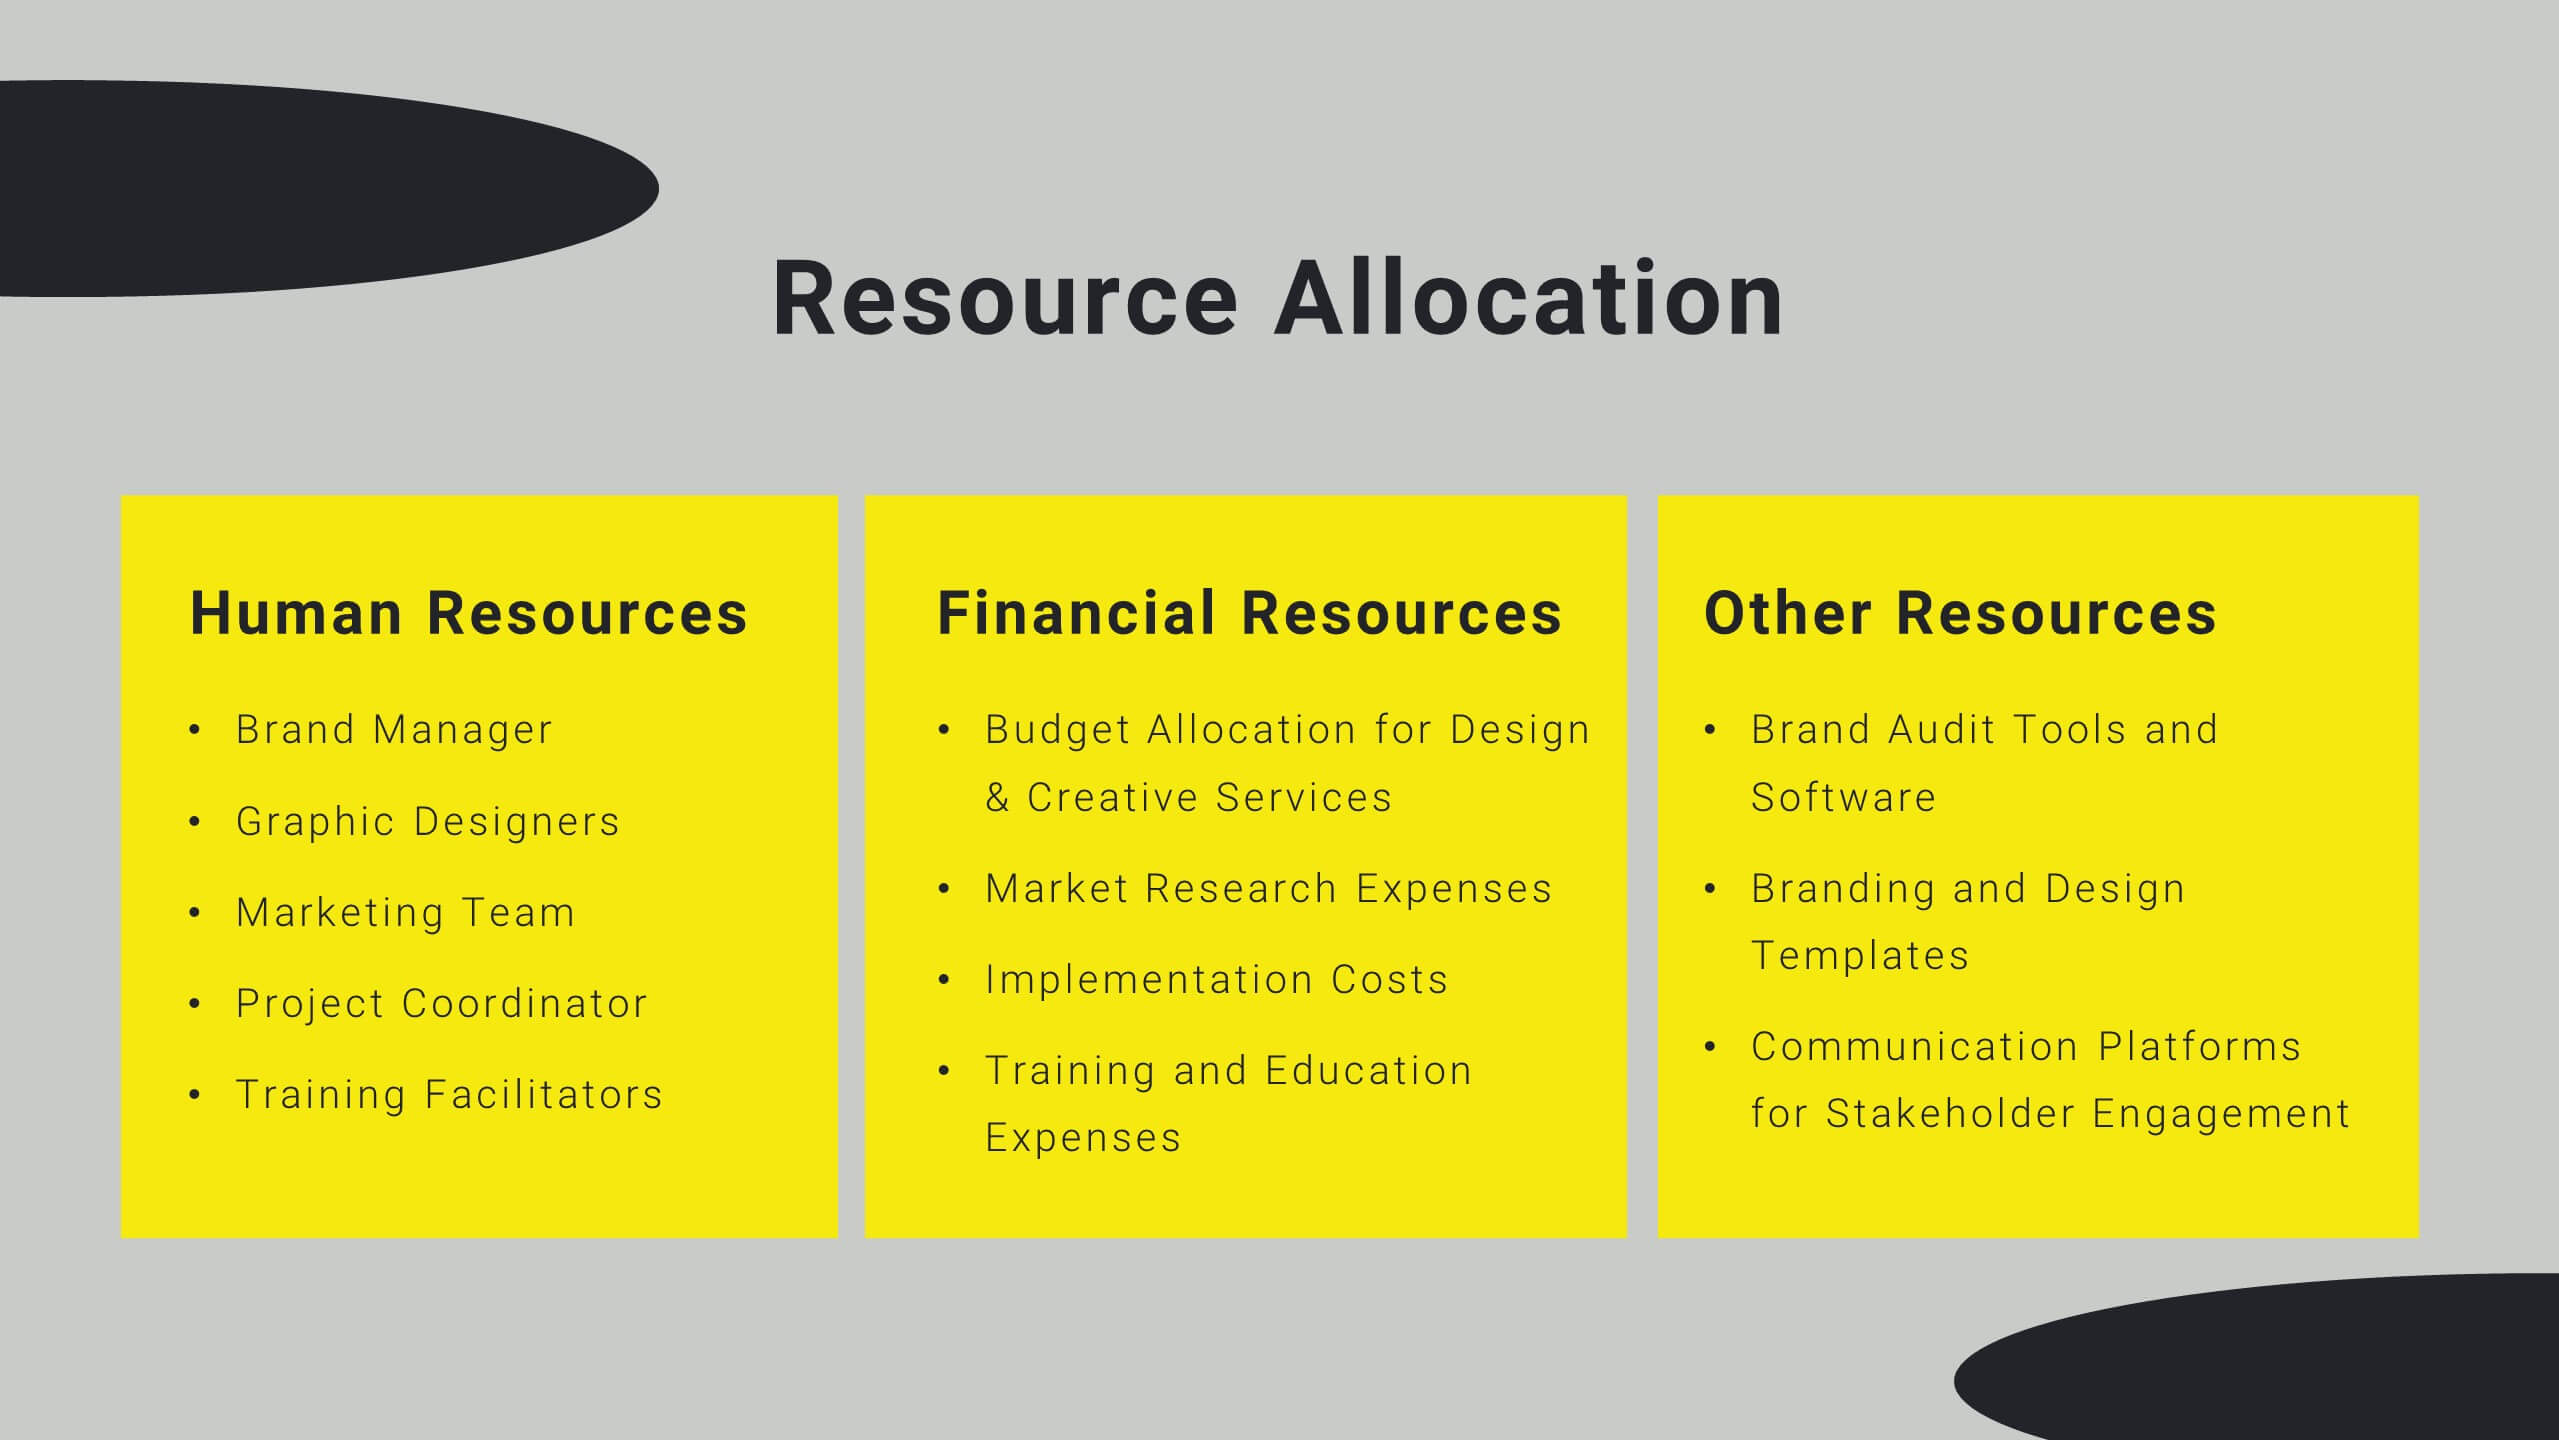
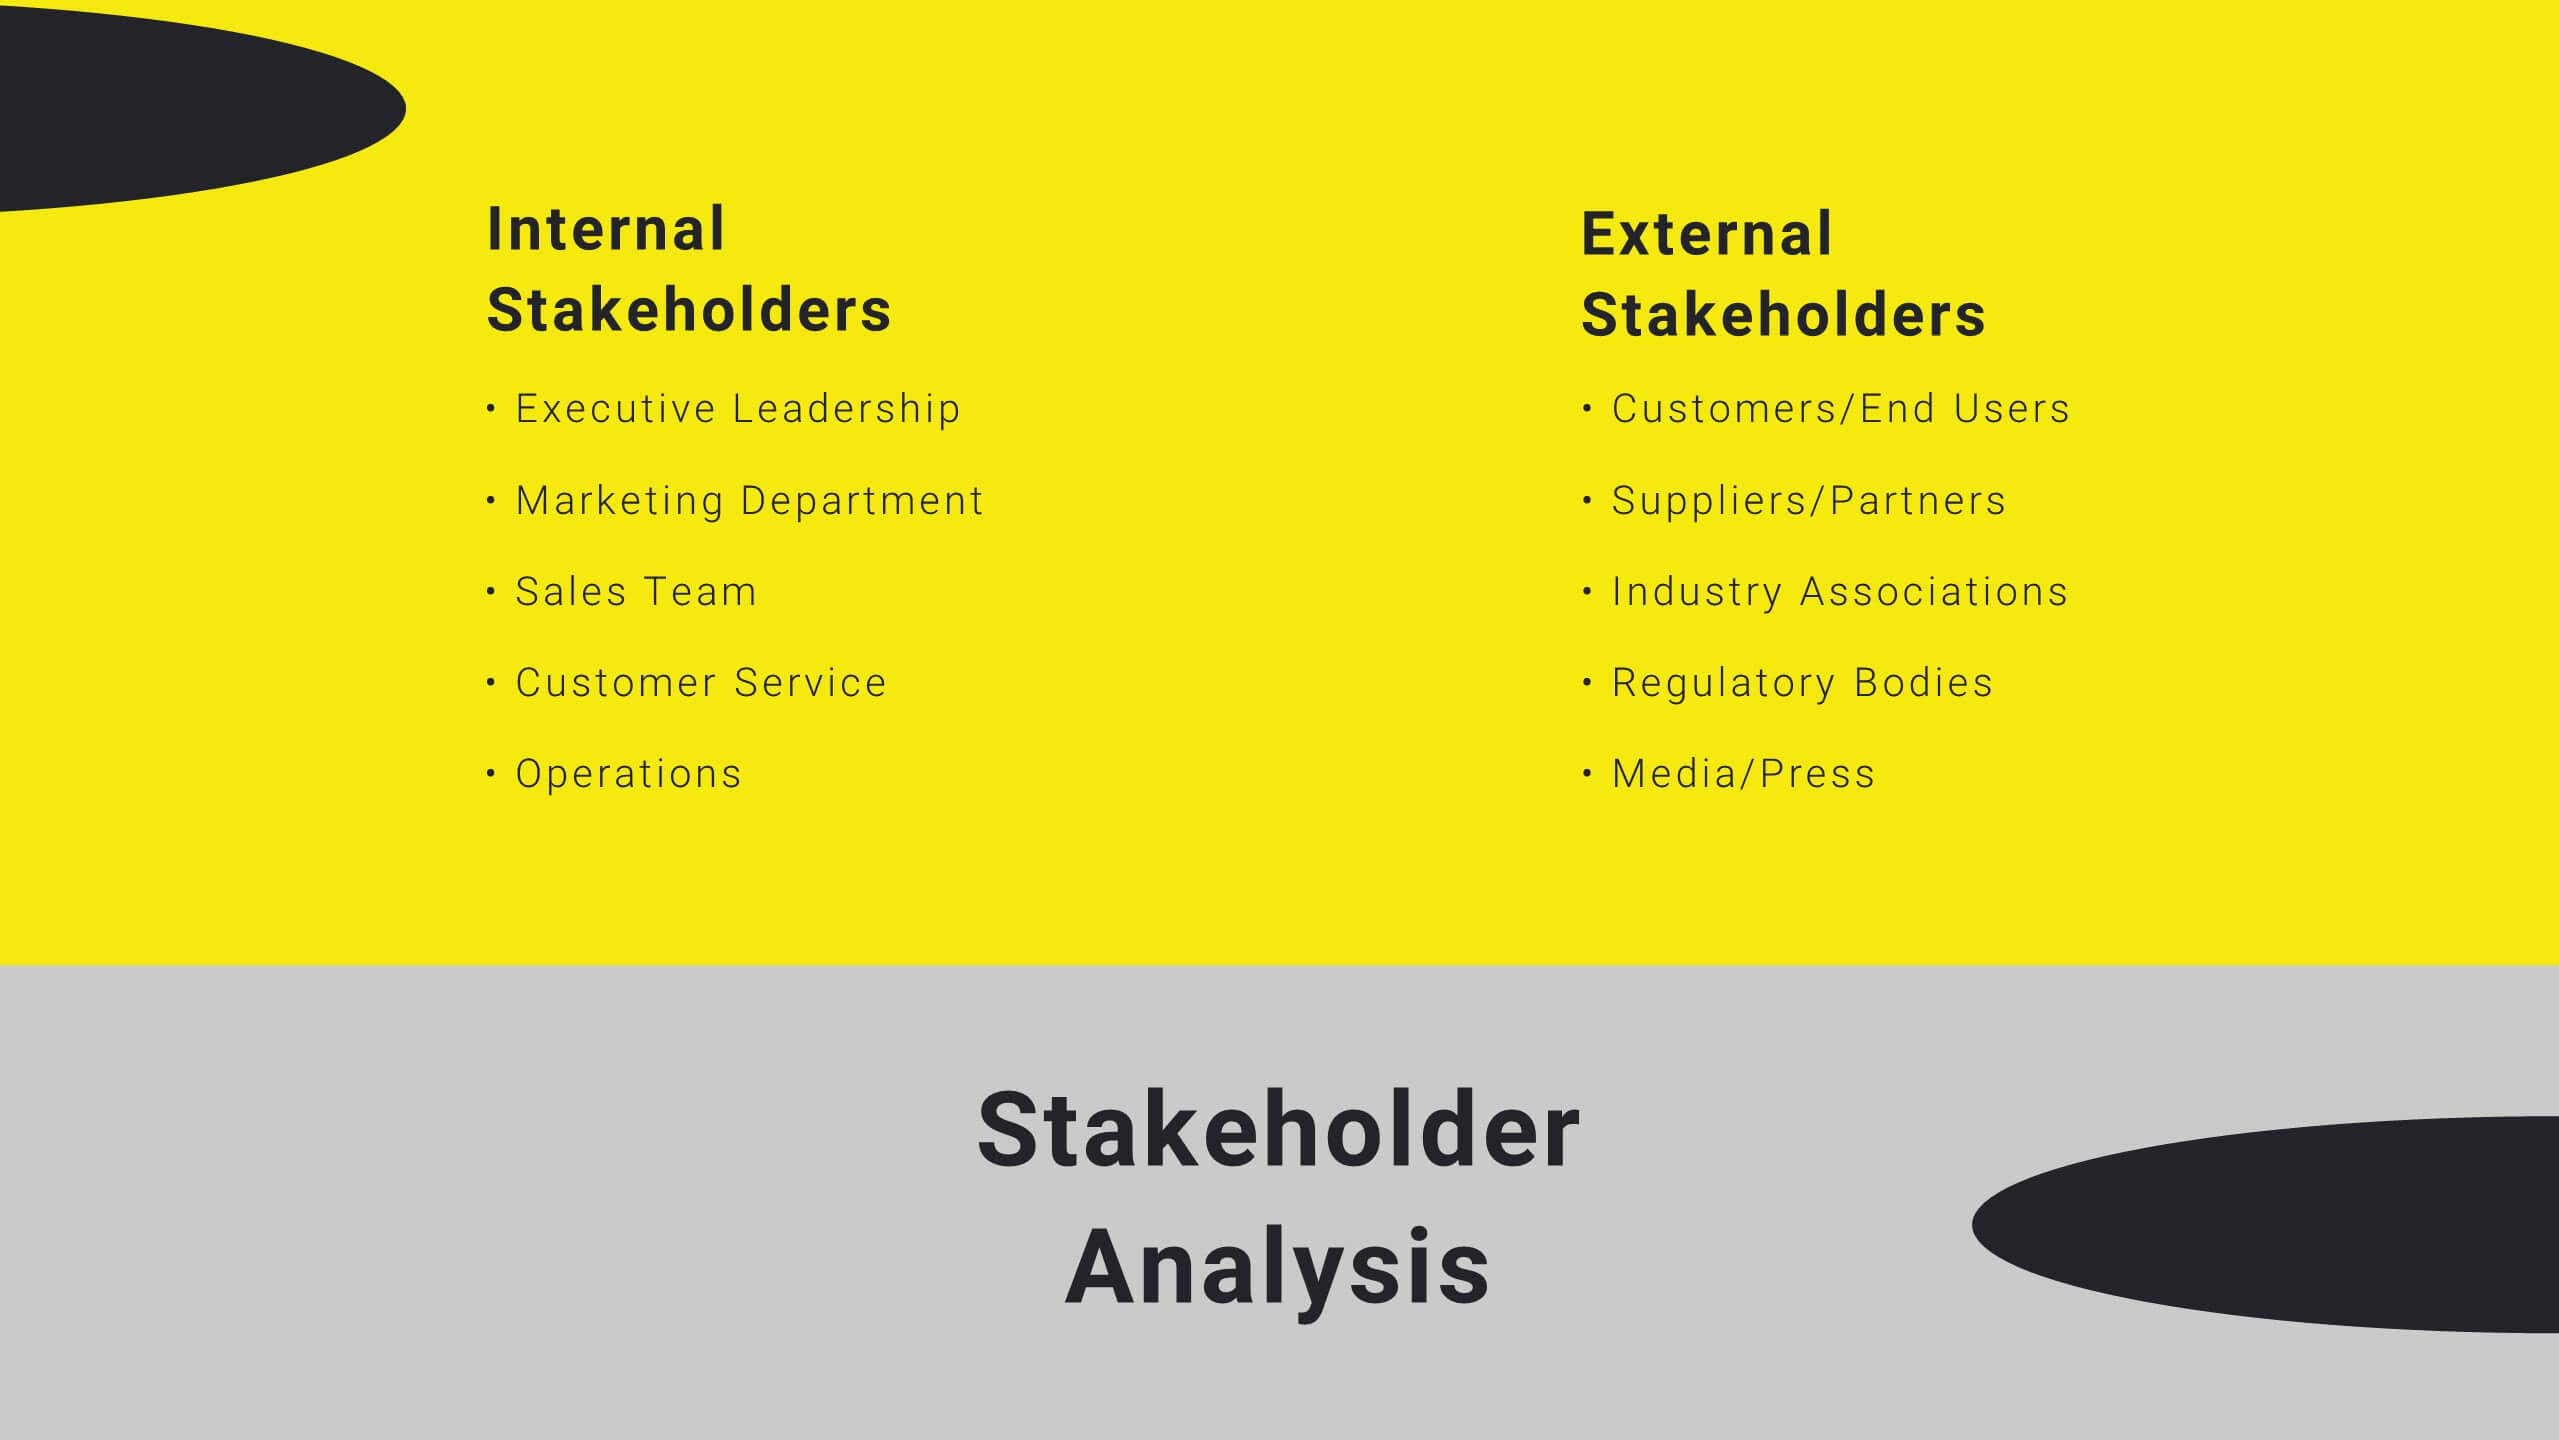
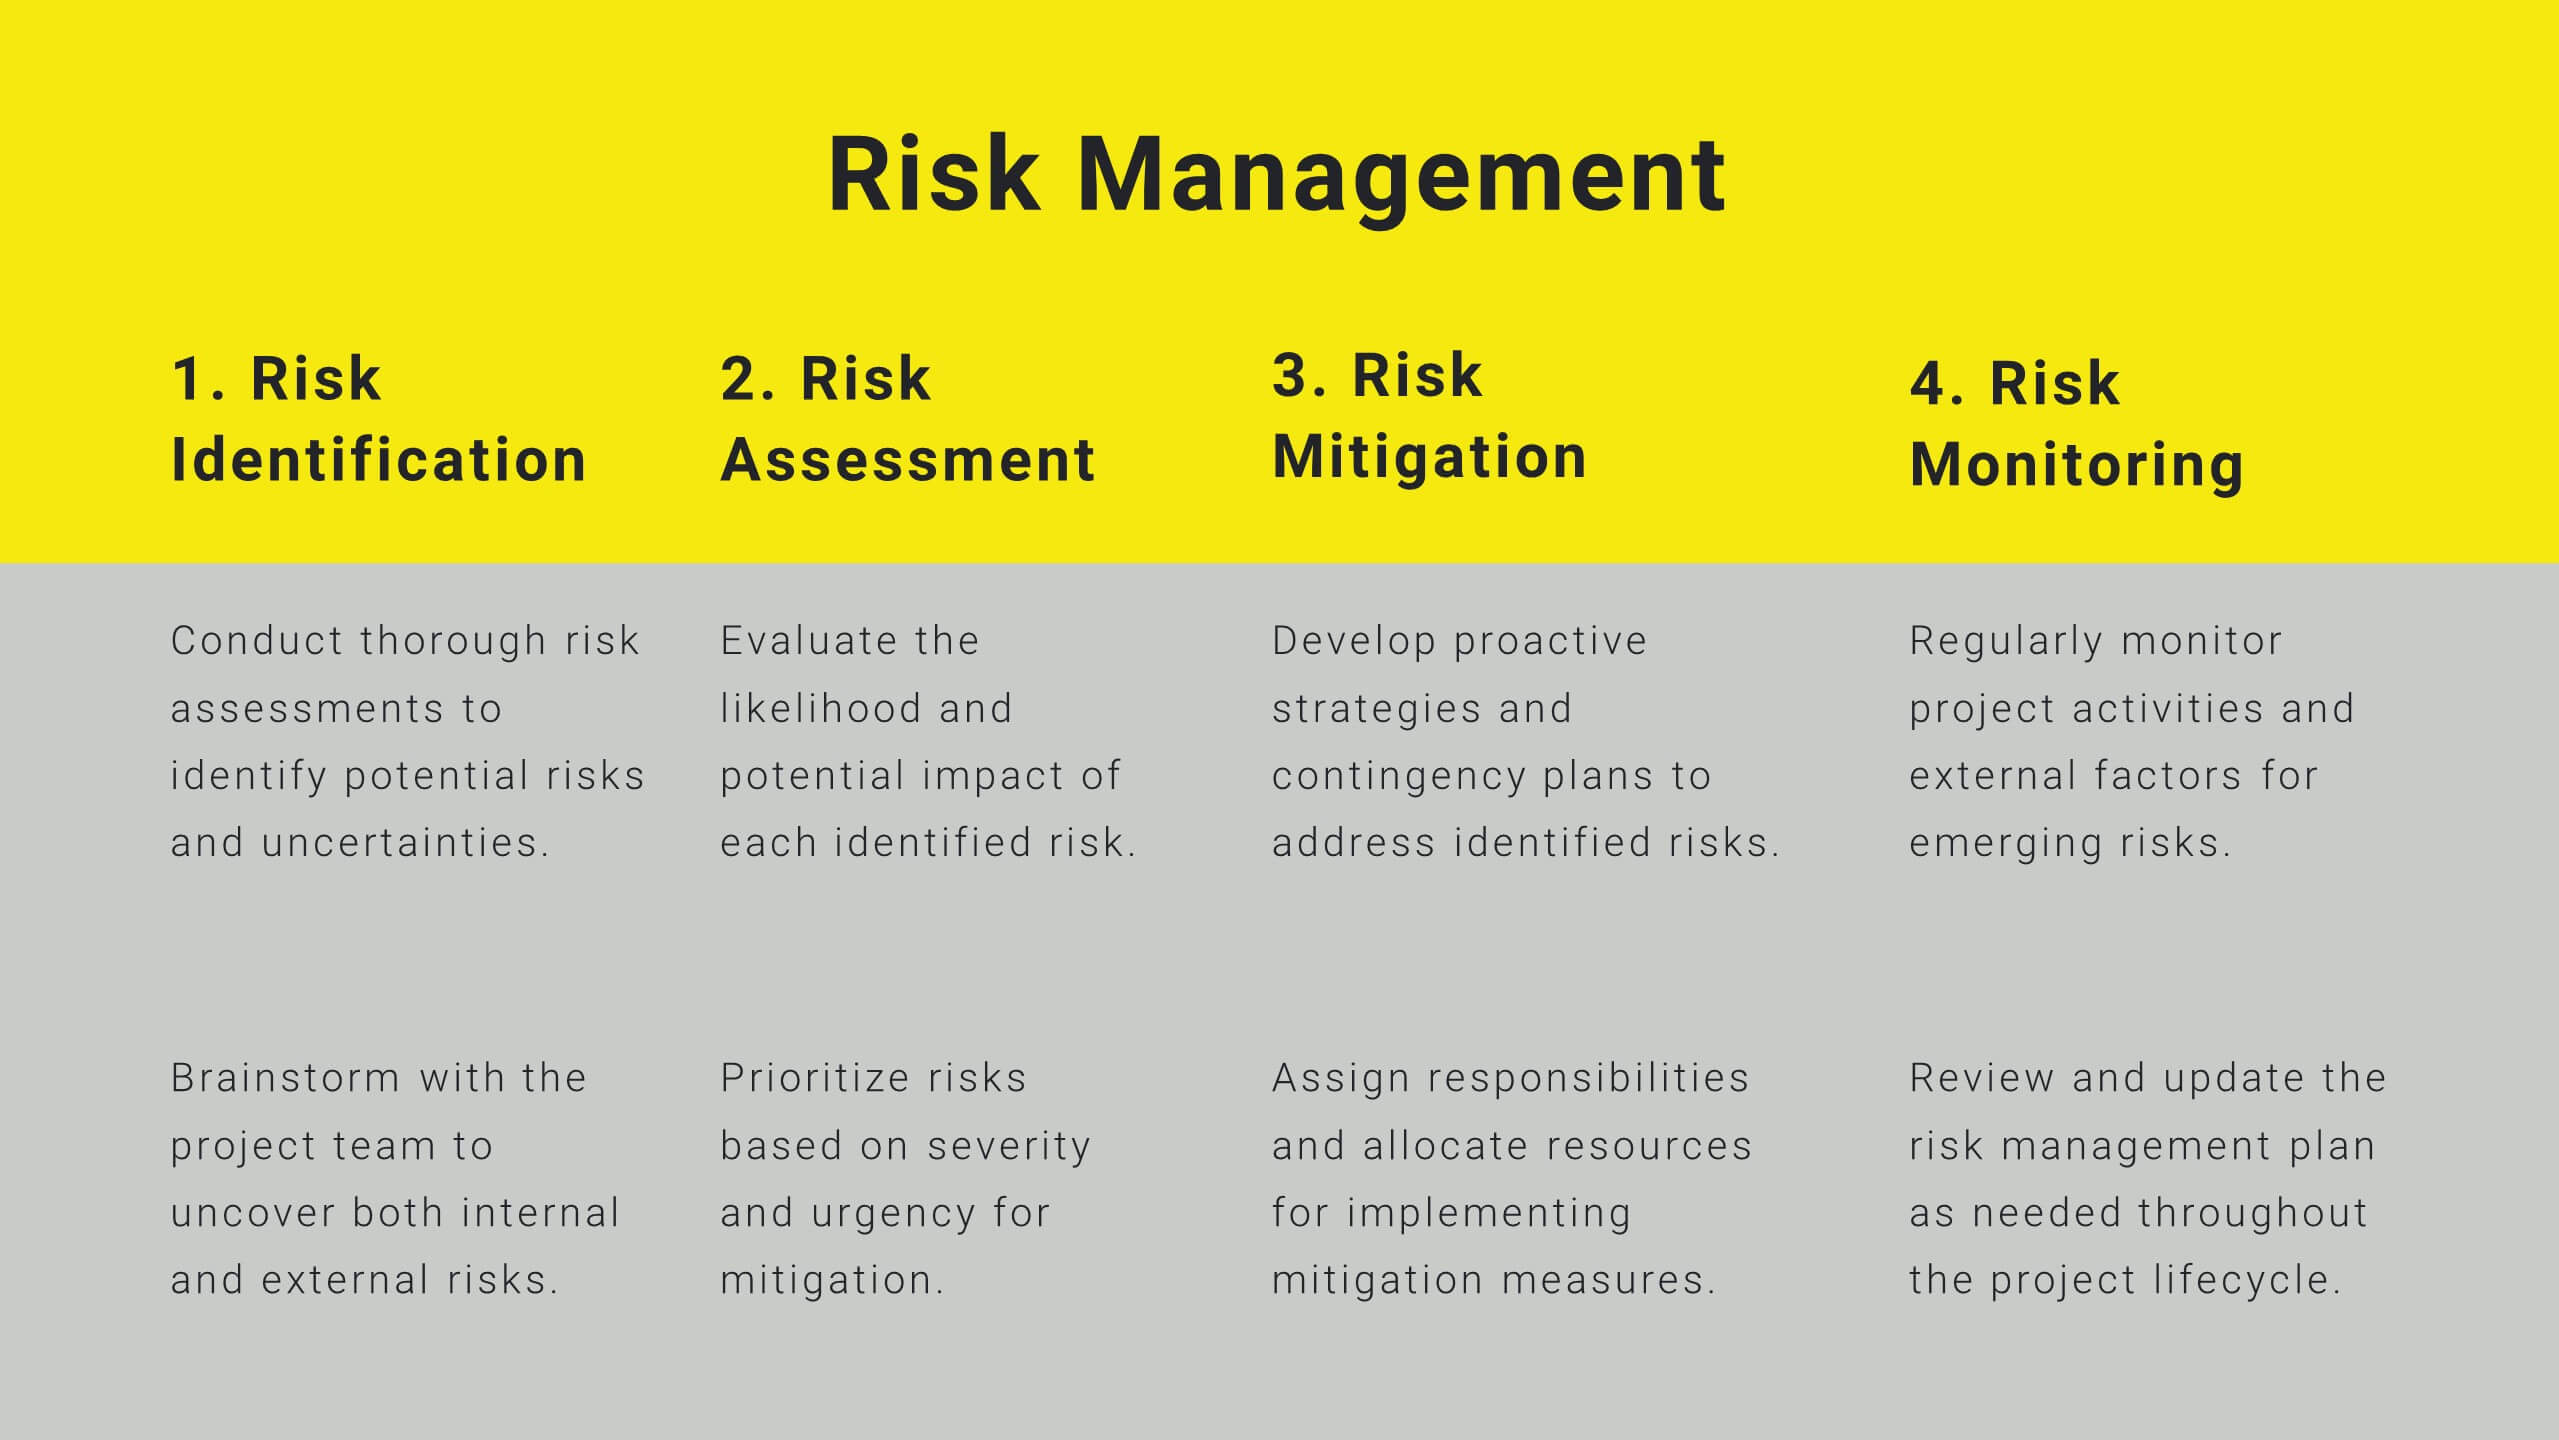
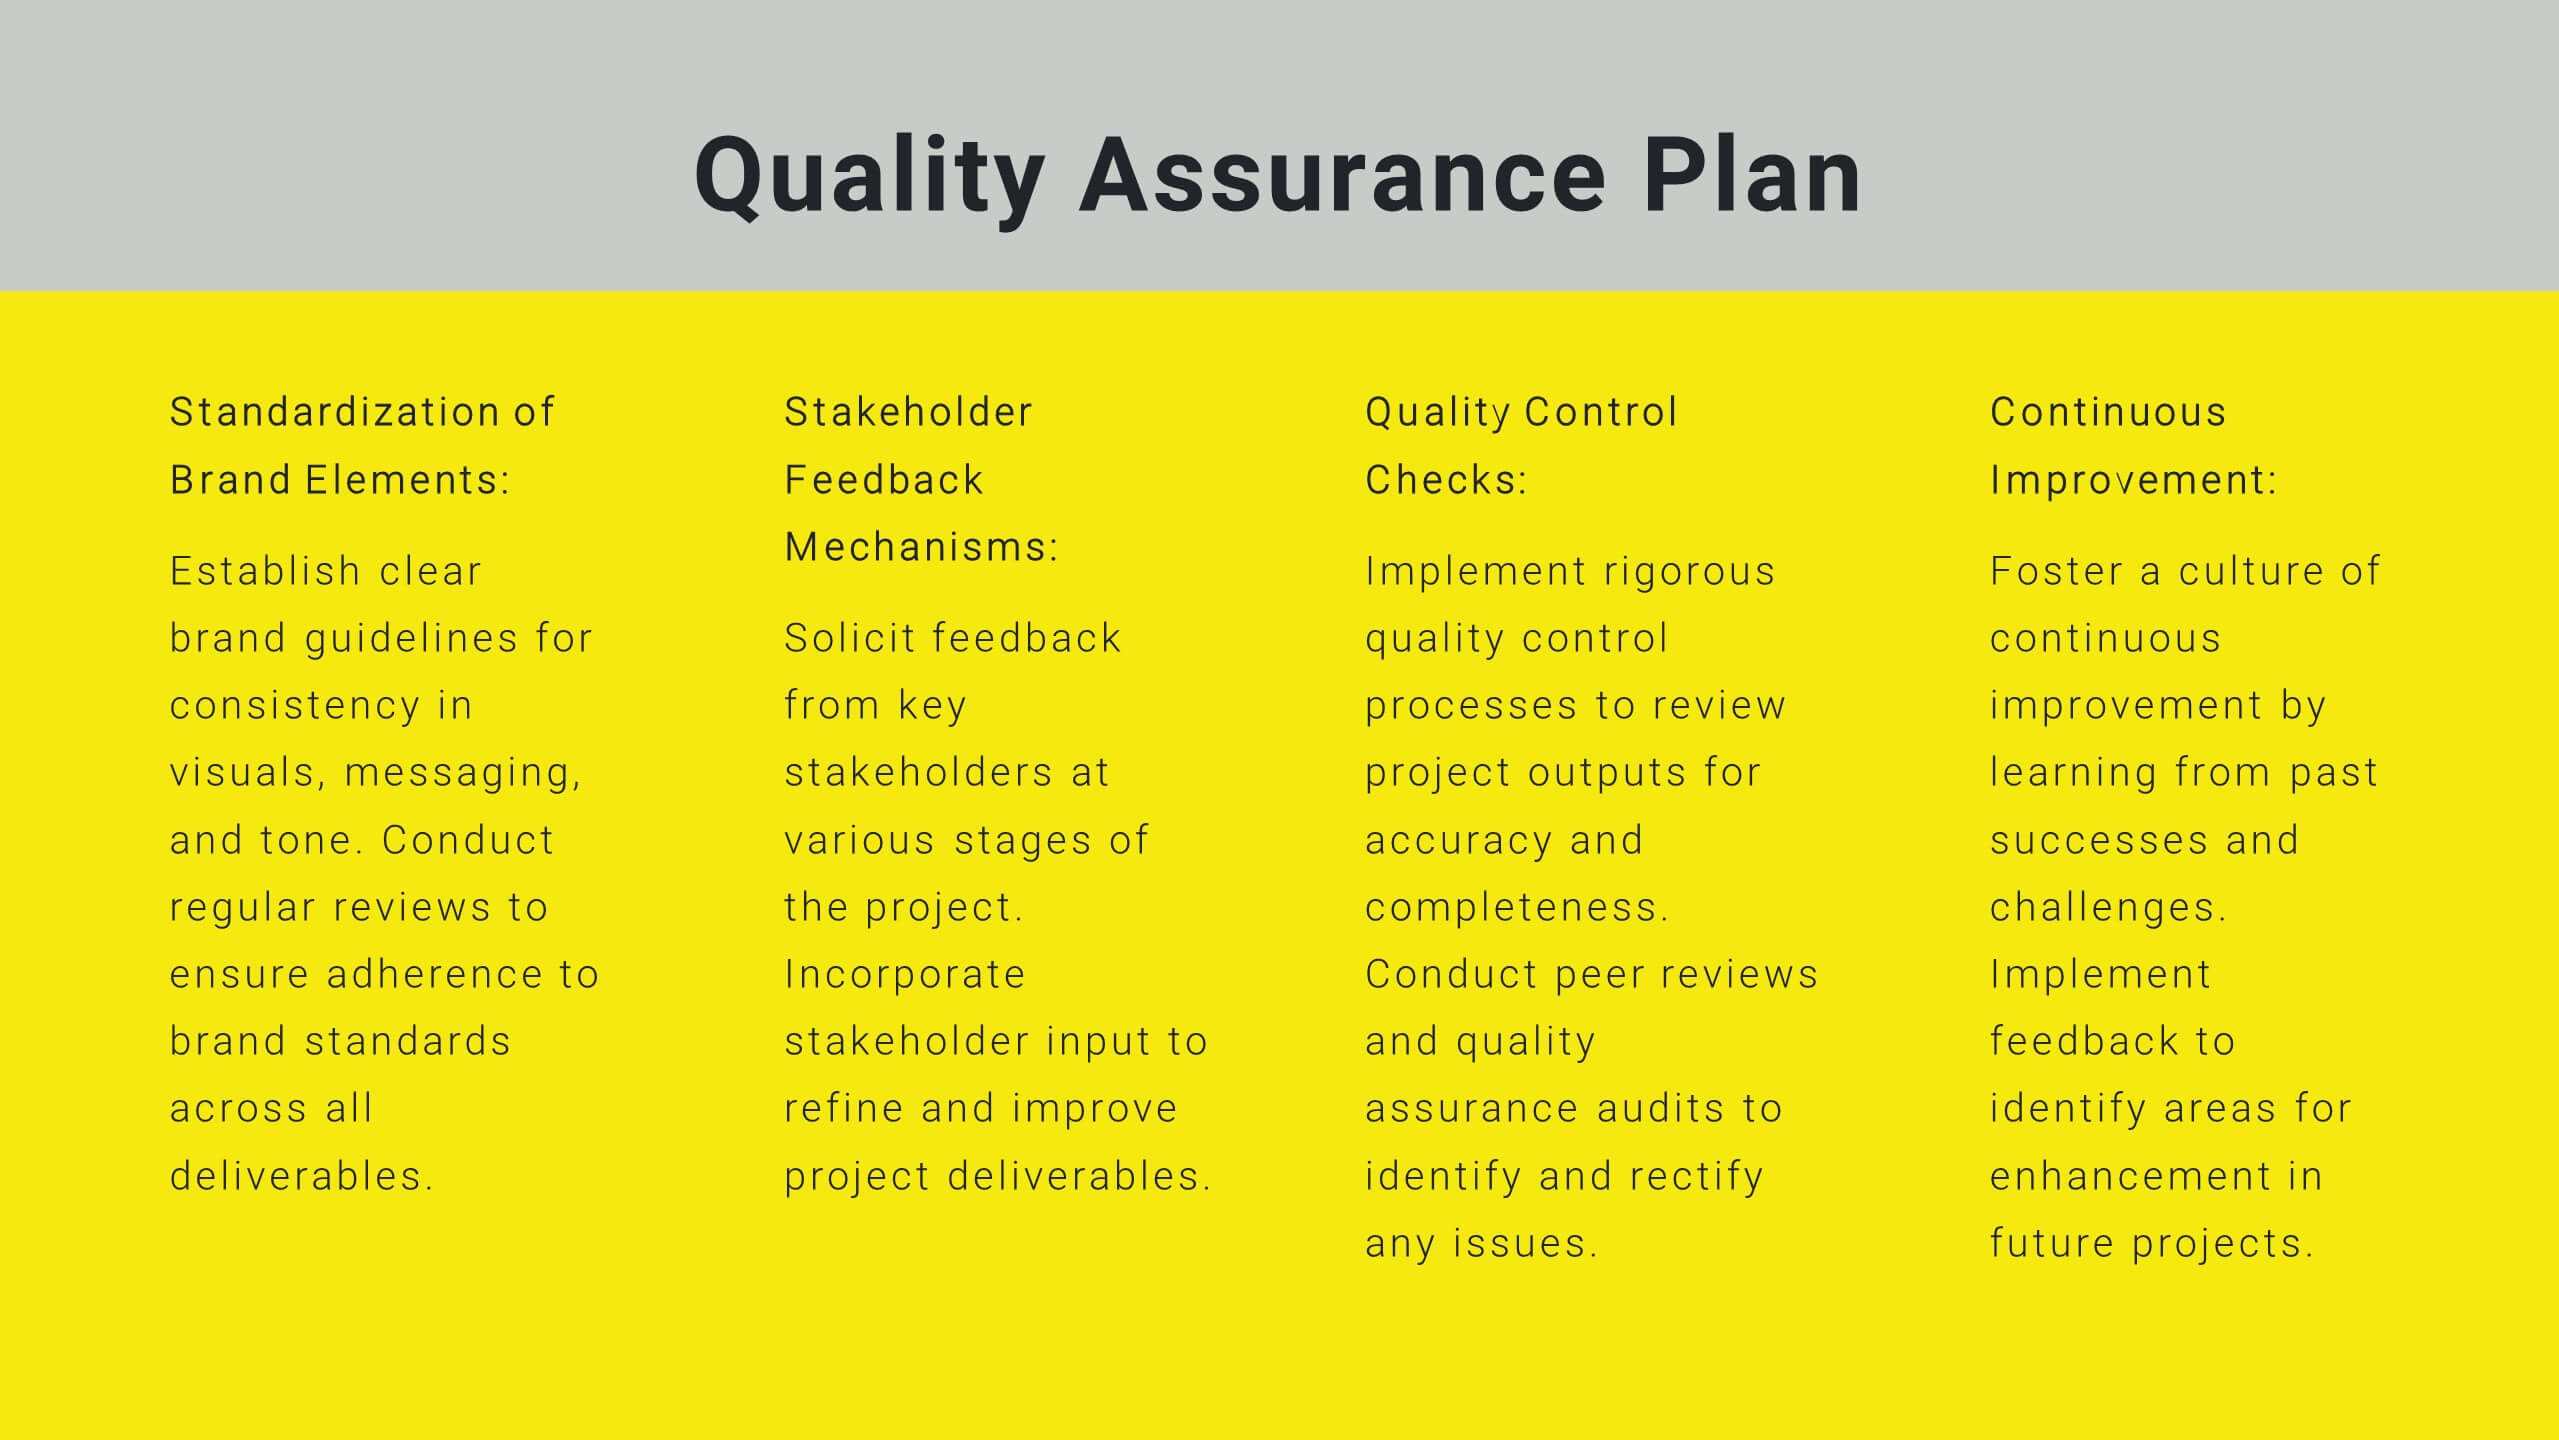
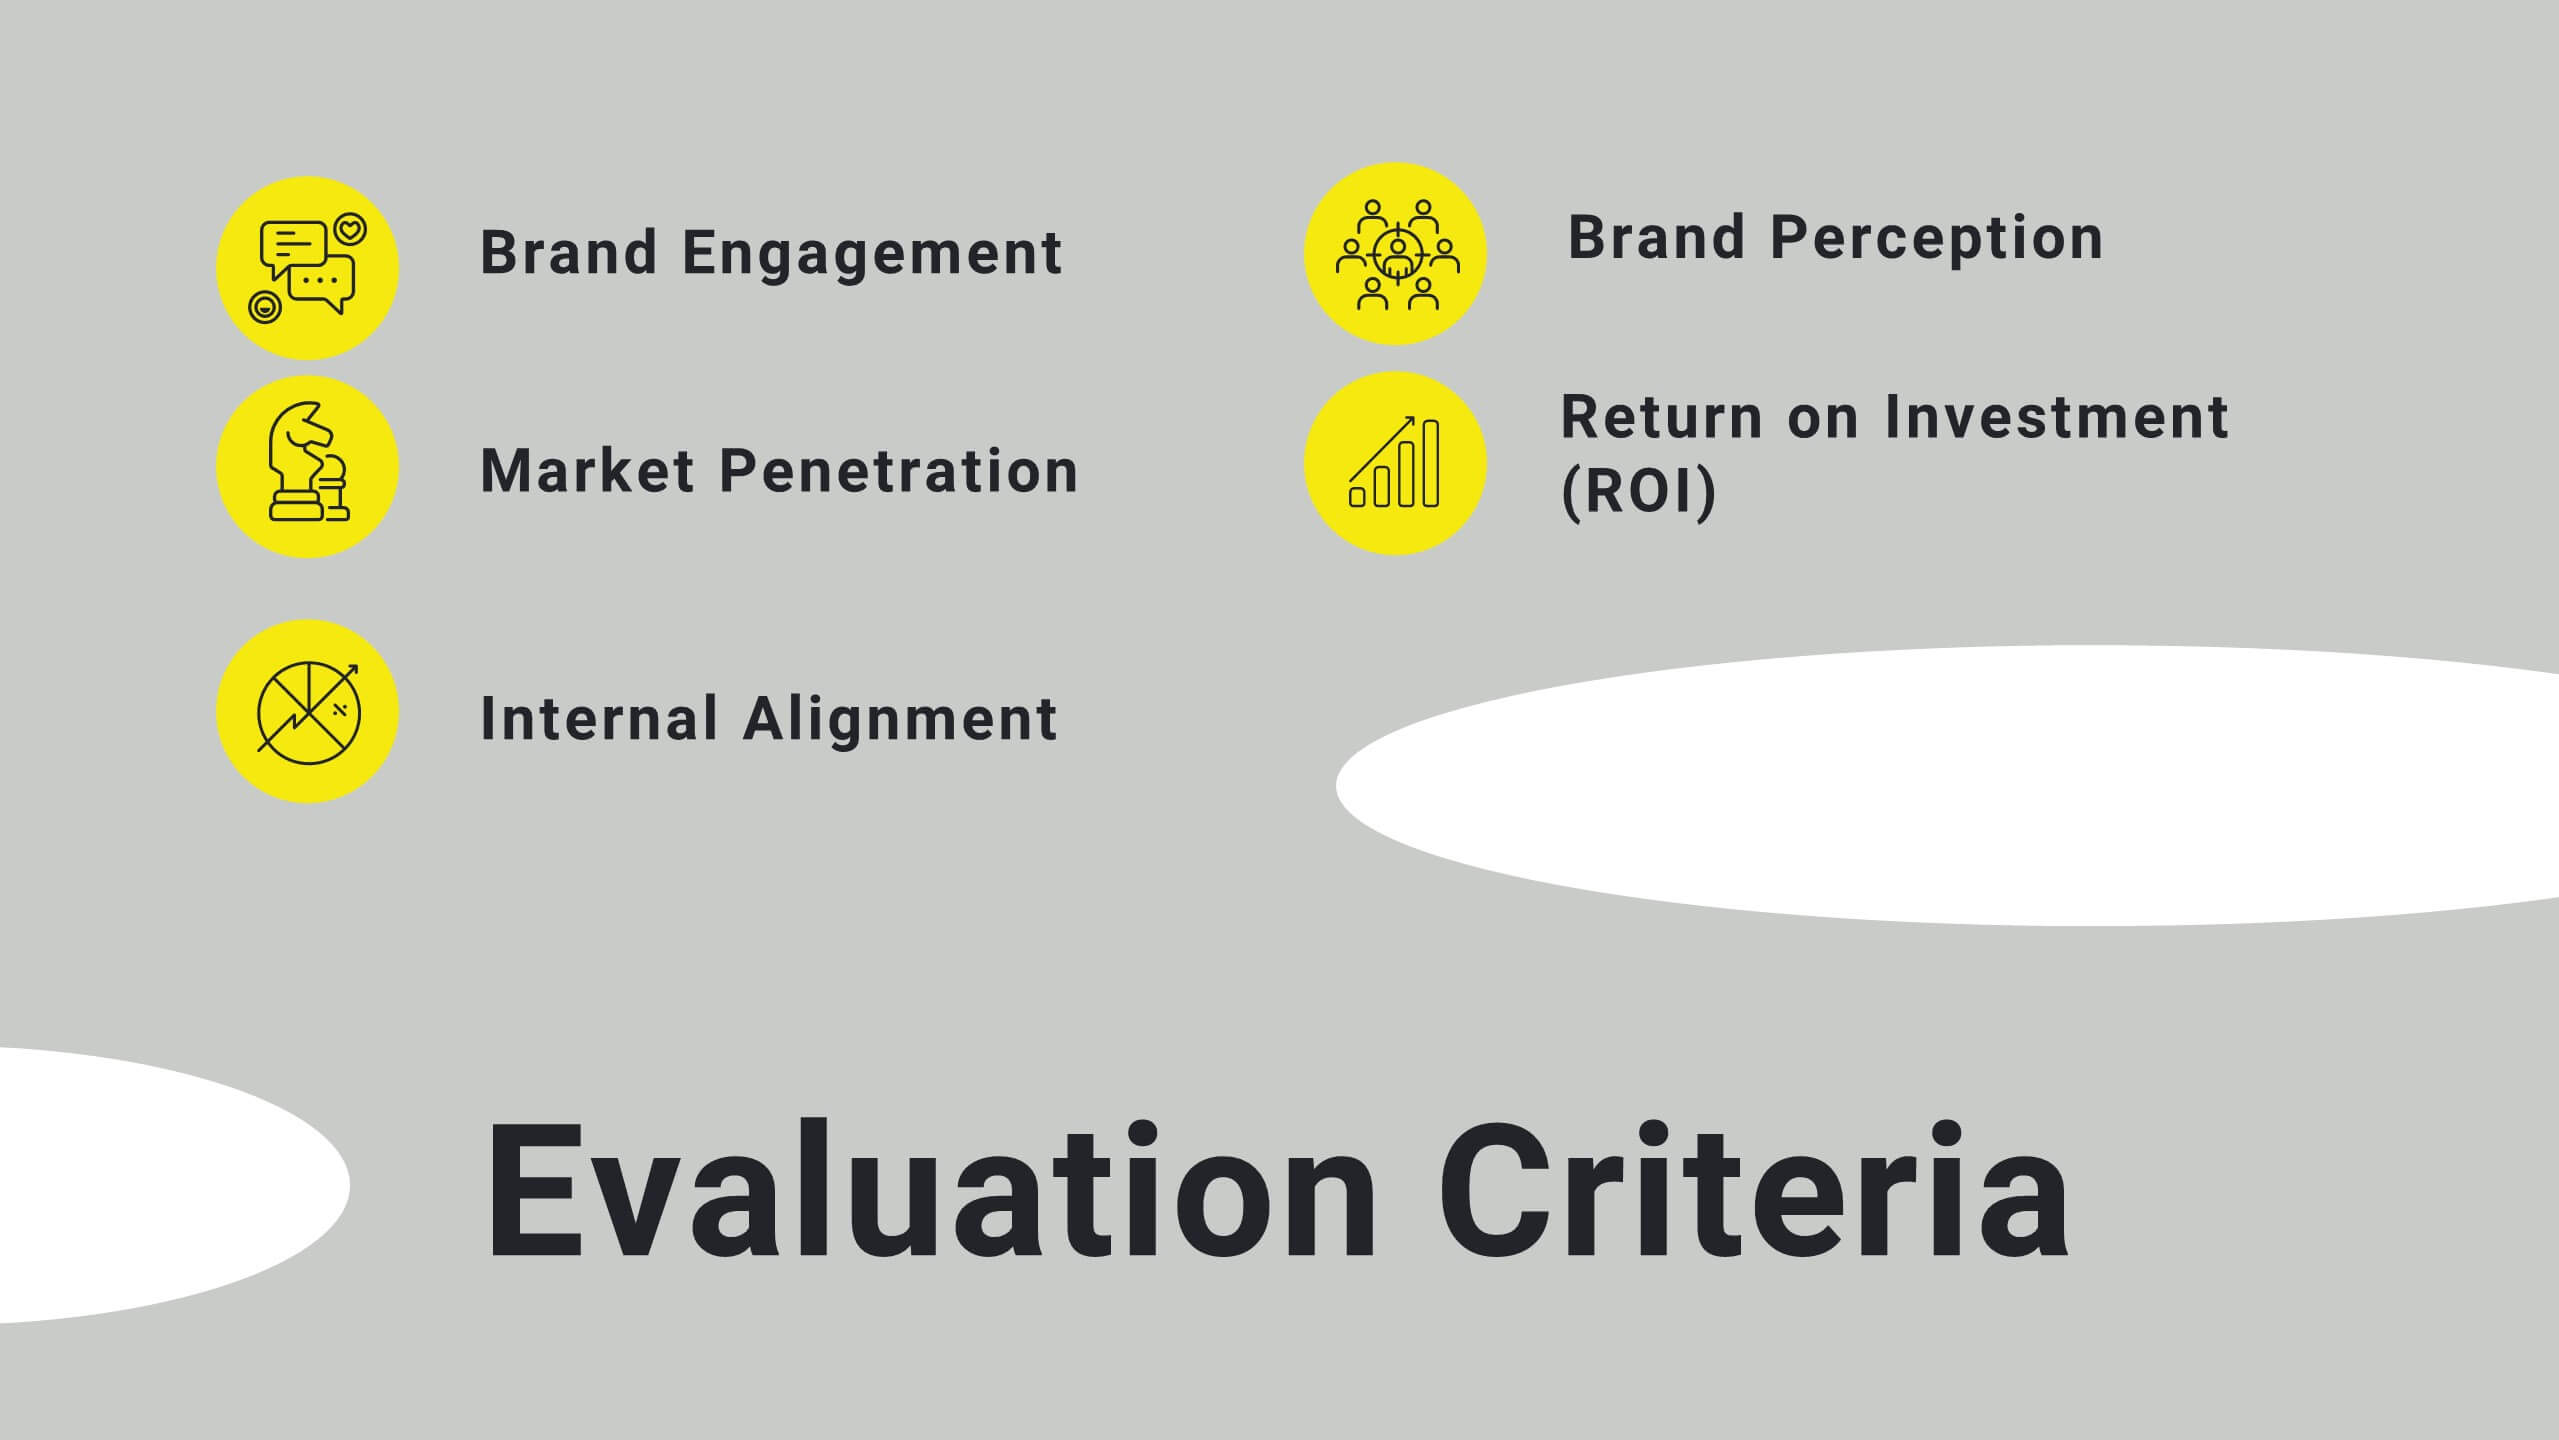
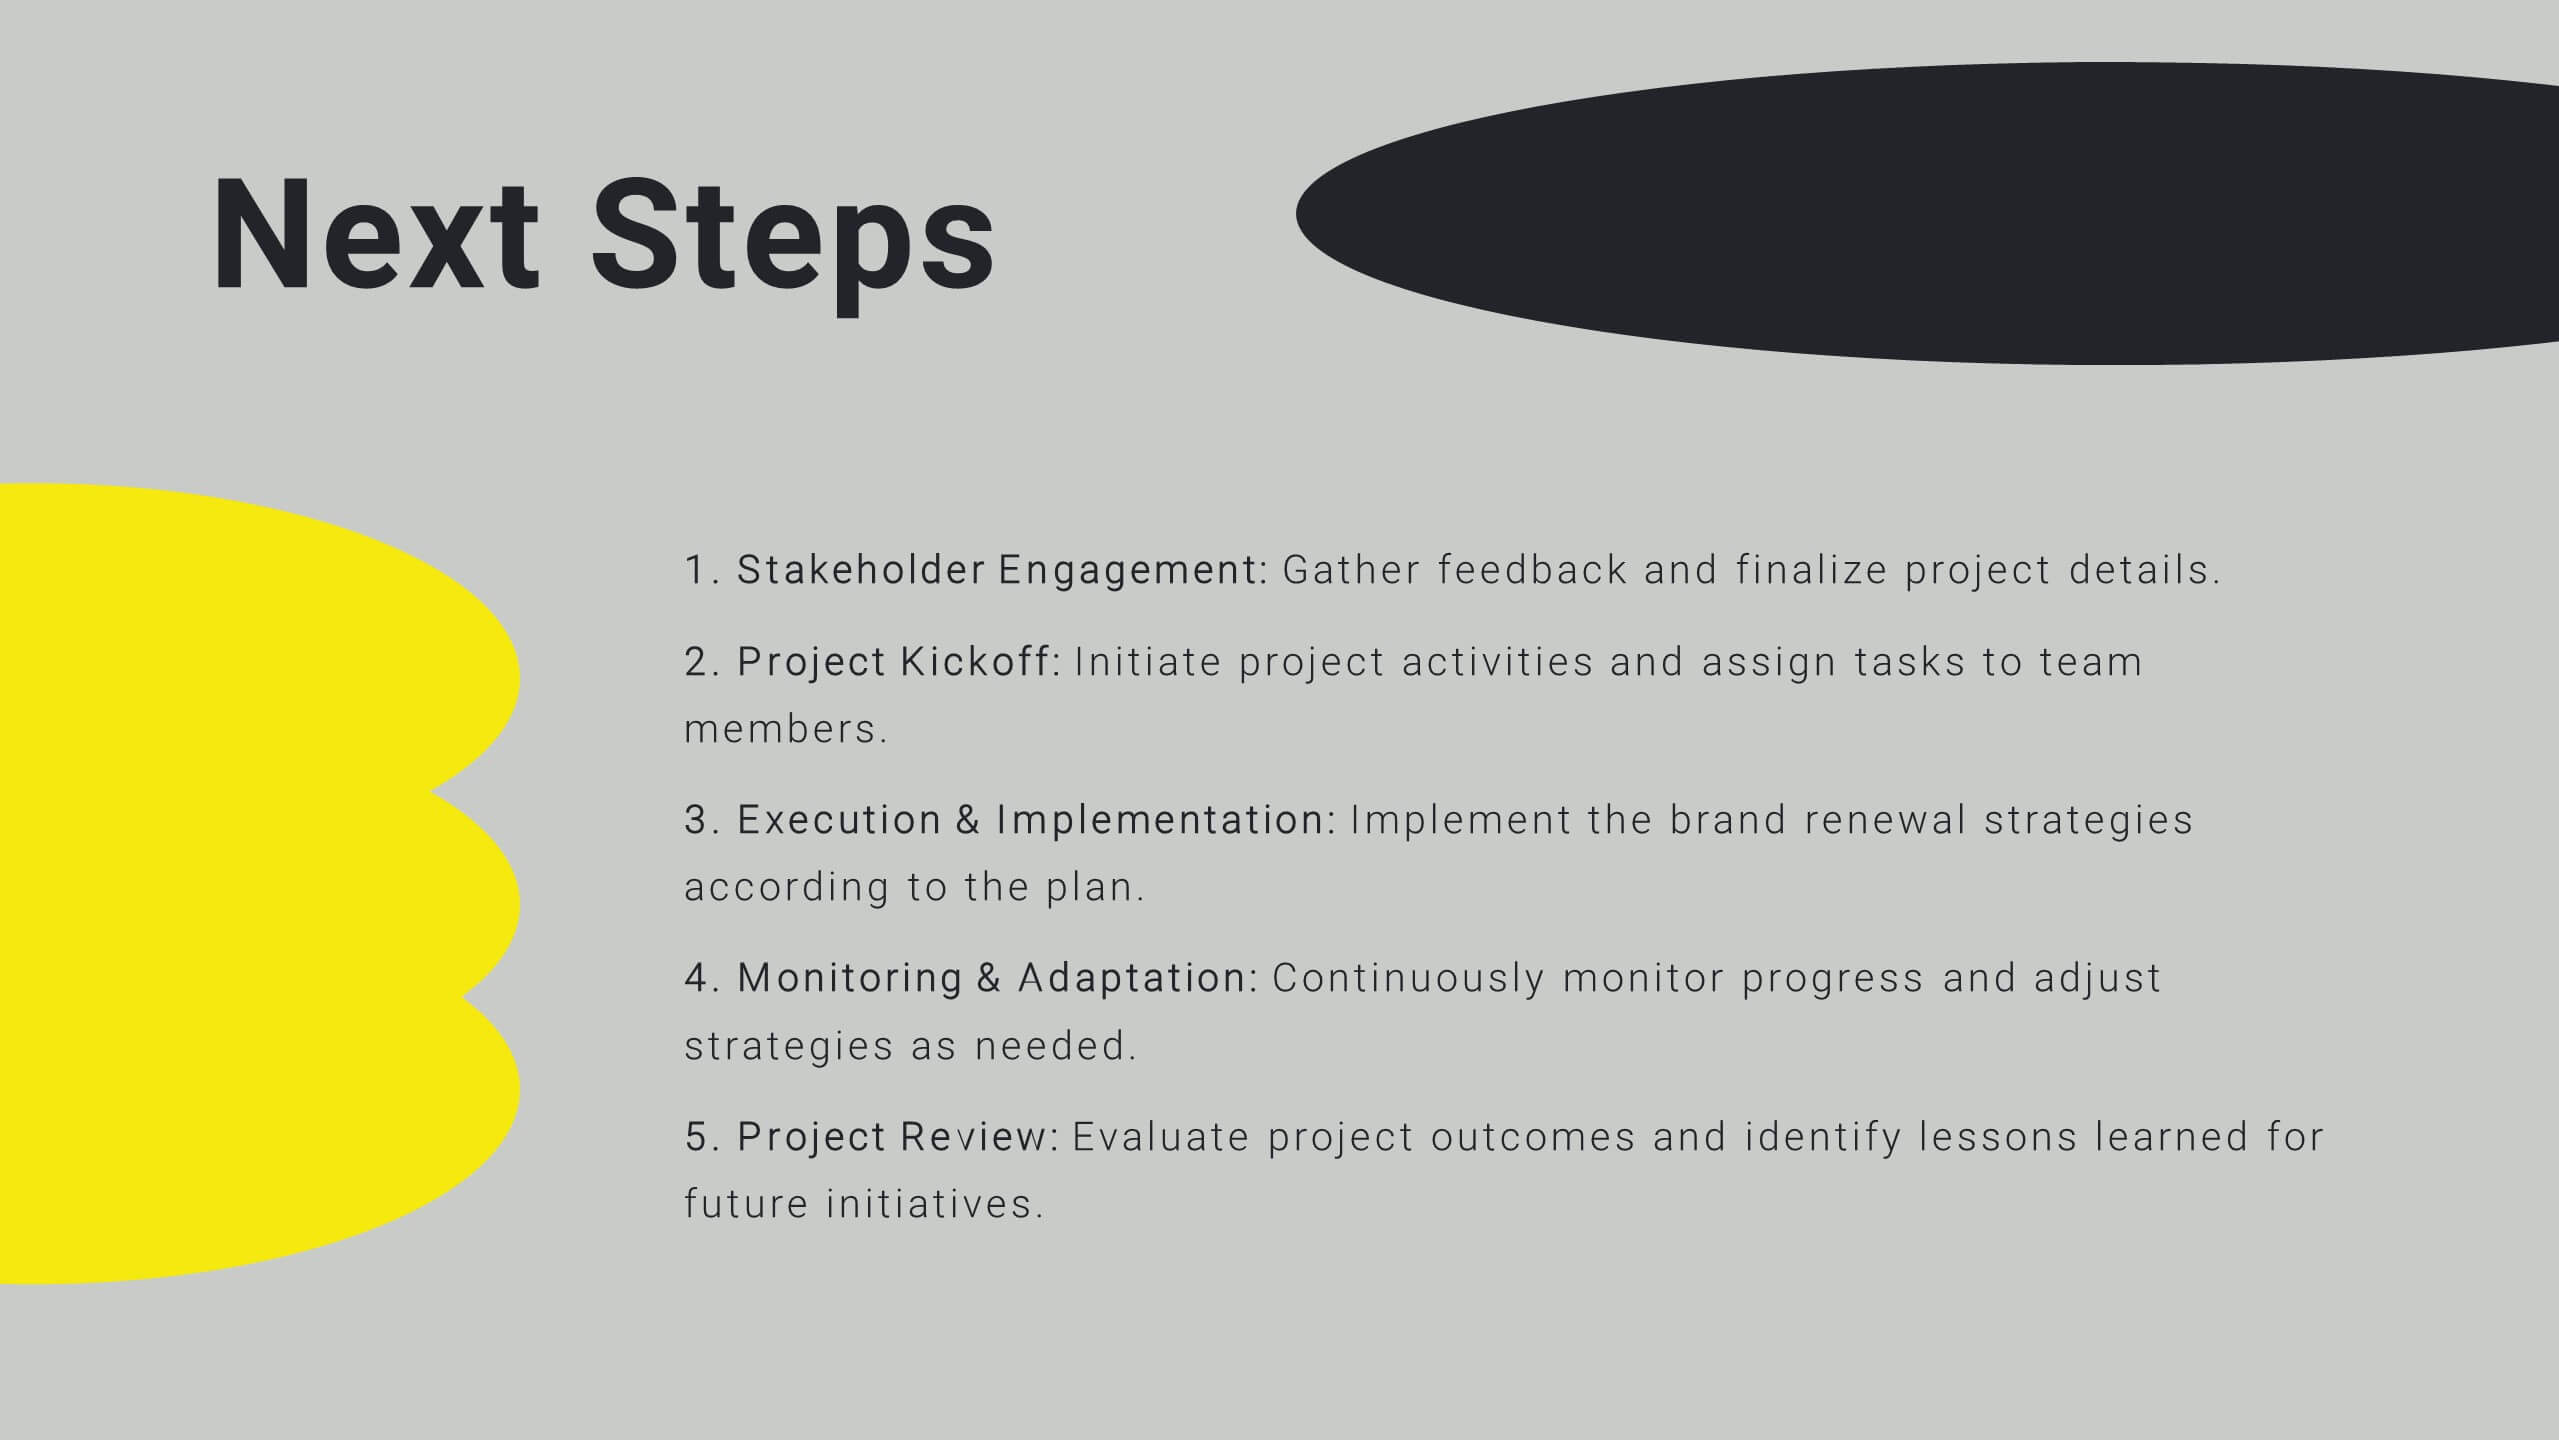
Sable Detailed Project Execution Plan Presentation
Master your project planning with this comprehensive execution plan template! Perfect for detailing project overviews, objectives, and timelines, it includes slides for budget breakdowns, resource allocation, and risk management. Ensure every detail is covered with structured content and clear visuals. Compatible with PowerPoint, Keynote, and Google Slides for seamless presentations on any platform.


5 slides
Problem-Solving and Risk Navigation Presentation
Navigate uncertainty with clarity using the Problem-Solving and Risk Navigation presentation. This slide features a winding, color-coded path that visually represents each step in a complex decision-making process—from initial analysis to final action. Each of the five stages is marked with an arrow and an icon for intuitive storytelling. Ideal for strategy meetings, risk management workshops, or project reviews. Fully editable in PowerPoint, Keynote, and Google Slides.


5 slides
Financial Budget Infographics
Financial goals refer to specific objectives and targets that individuals or businesses set to manage their finances effectively and achieve financial success. These vertical infographics are designed to help individuals and businesses effectively present their financial budgets and plans. Whether you're a financial analyst or a business owner, this template is perfect for conveying complex financial information in a clear and concise manner. These infographics provide an overview of the budget, showcasing key financial goals, total income, and total expenses. This features visuals to help users set and track financial goals.