


Features
- 16 Unique slides
- Fully editable and easy to edit in Microsoft Powerpoint, Keynote and Google Slides
- 16:9 widescreen layout
- Clean and professional designs
- Export to JPG, PDF or send by email


Do you have any questions?
Recommend


5 slides
Investment Strategy and Growth Planning Presentation
Visualize your growth strategy using this clean and modern infographic layout. Each pawn-shaped graphic highlights key steps in your investment plan, ideal for financial planning, business development, or progress tracking. Fully customizable in PowerPoint, Google Slides, and Keynote—perfect for presenting strategic priorities and actionable insights with visual impact.


10 slides
SEO and Social Media Marketing Presentation
Shine a spotlight on your brand’s digital growth with this bold and professional layout designed to showcase analytics, engagement, and SEO strategies. Ideal for marketers, strategists, and agencies, it transforms data into visuals that persuade and inform. Fully compatible with PowerPoint, Keynote, and Google Slides for easy editing.


5 slides
Business Future Vision Strategy Presentation
Visualize the roadmap to your company’s future with this engaging Business Future Vision Strategy slide. The stacked cylinder infographic helps you layer key initiatives, goals, or timelines in a clean and structured format. With five editable tiers and corresponding text areas, this layout is perfect for showcasing development phases, innovation strategies, or long-term planning. Ideal for strategic meetings, business proposals, or future-focused pitches. Compatible with PowerPoint, Keynote, and Google Slides for seamless customization.


5 slides
Four-Step Customer Experience Framework Presentation
Showcase your customer journey with this sleek, step-by-step visual. Featuring a stair-step arrow design, it’s ideal for highlighting stages in user experience, onboarding, or service improvement. Each step is editable, with icons and titles for clarity. Compatible with PowerPoint, Keynote, and Google Slides—perfect for marketers, strategists, and CX professionals.


4 slides
AI Trends and Use Cases Presentation
Step into the future with a clean, modern layout that makes complex technology easy to grasp and exciting to explore. This presentation helps you break down emerging innovations, real-world applications, and industry opportunities using clear visuals and structured sections. Fully customizable and compatible with PowerPoint, Keynote, and Google Slides.


5 slides
Meet the Team Layout Presentation
Meet the team with a layout that feels fresh, upbeat, and effortlessly clear. This presentation helps you introduce key members, highlight roles, and showcase expertise in a clean, engaging format perfect for leadership updates or project kickoffs. Fully editable and compatible with PowerPoint, Keynote, and Google Slides.


4 slides
Business Framework Strategies Presentation
Bring your ideas to life with a smooth, flowing sequence that makes complex strategies feel simple and intuitive. This presentation guides audiences through each stage of your business framework with clear visuals and focused messaging, helping you communicate structure, goals, and direction effortlessly. Fully compatible with PowerPoint, Keynote, and Google Slides.


8 slides
30-60-90 Day Business Plan Presentation
Set clear goals and track progress effortlessly with this 30-60-90 day business plan template! Designed for professionals, managers, and entrepreneurs, this structured layout helps outline priorities, set milestones, and ensure a smooth transition from planning to execution. Fully customizable and compatible with PowerPoint, Keynote, and Google Slides for seamless presentations.


6 slides
Real Estate Housing Solutions Presentation
Present property features and real estate plans with this creative multi-level housing diagram. Designed for agents, developers, or housing consultants, this layout clearly segments space usage or service offerings. Fully customizable in PowerPoint, Keynote, and Google Slides—perfect for showcasing floor plans, room functions, or housing solutions with vibrant clarity.


4 slides
E-Learning Module Structure Presentation
Turn your lesson flow into a visual journey your audience can actually follow. This presentation template maps out the structure of an e-learning module with step-by-step clarity—ideal for course creators, instructional designers, or trainers. Easily customize each stage. Fully editable in PowerPoint, Keynote, and Google Slides for flexible use.
8 slides
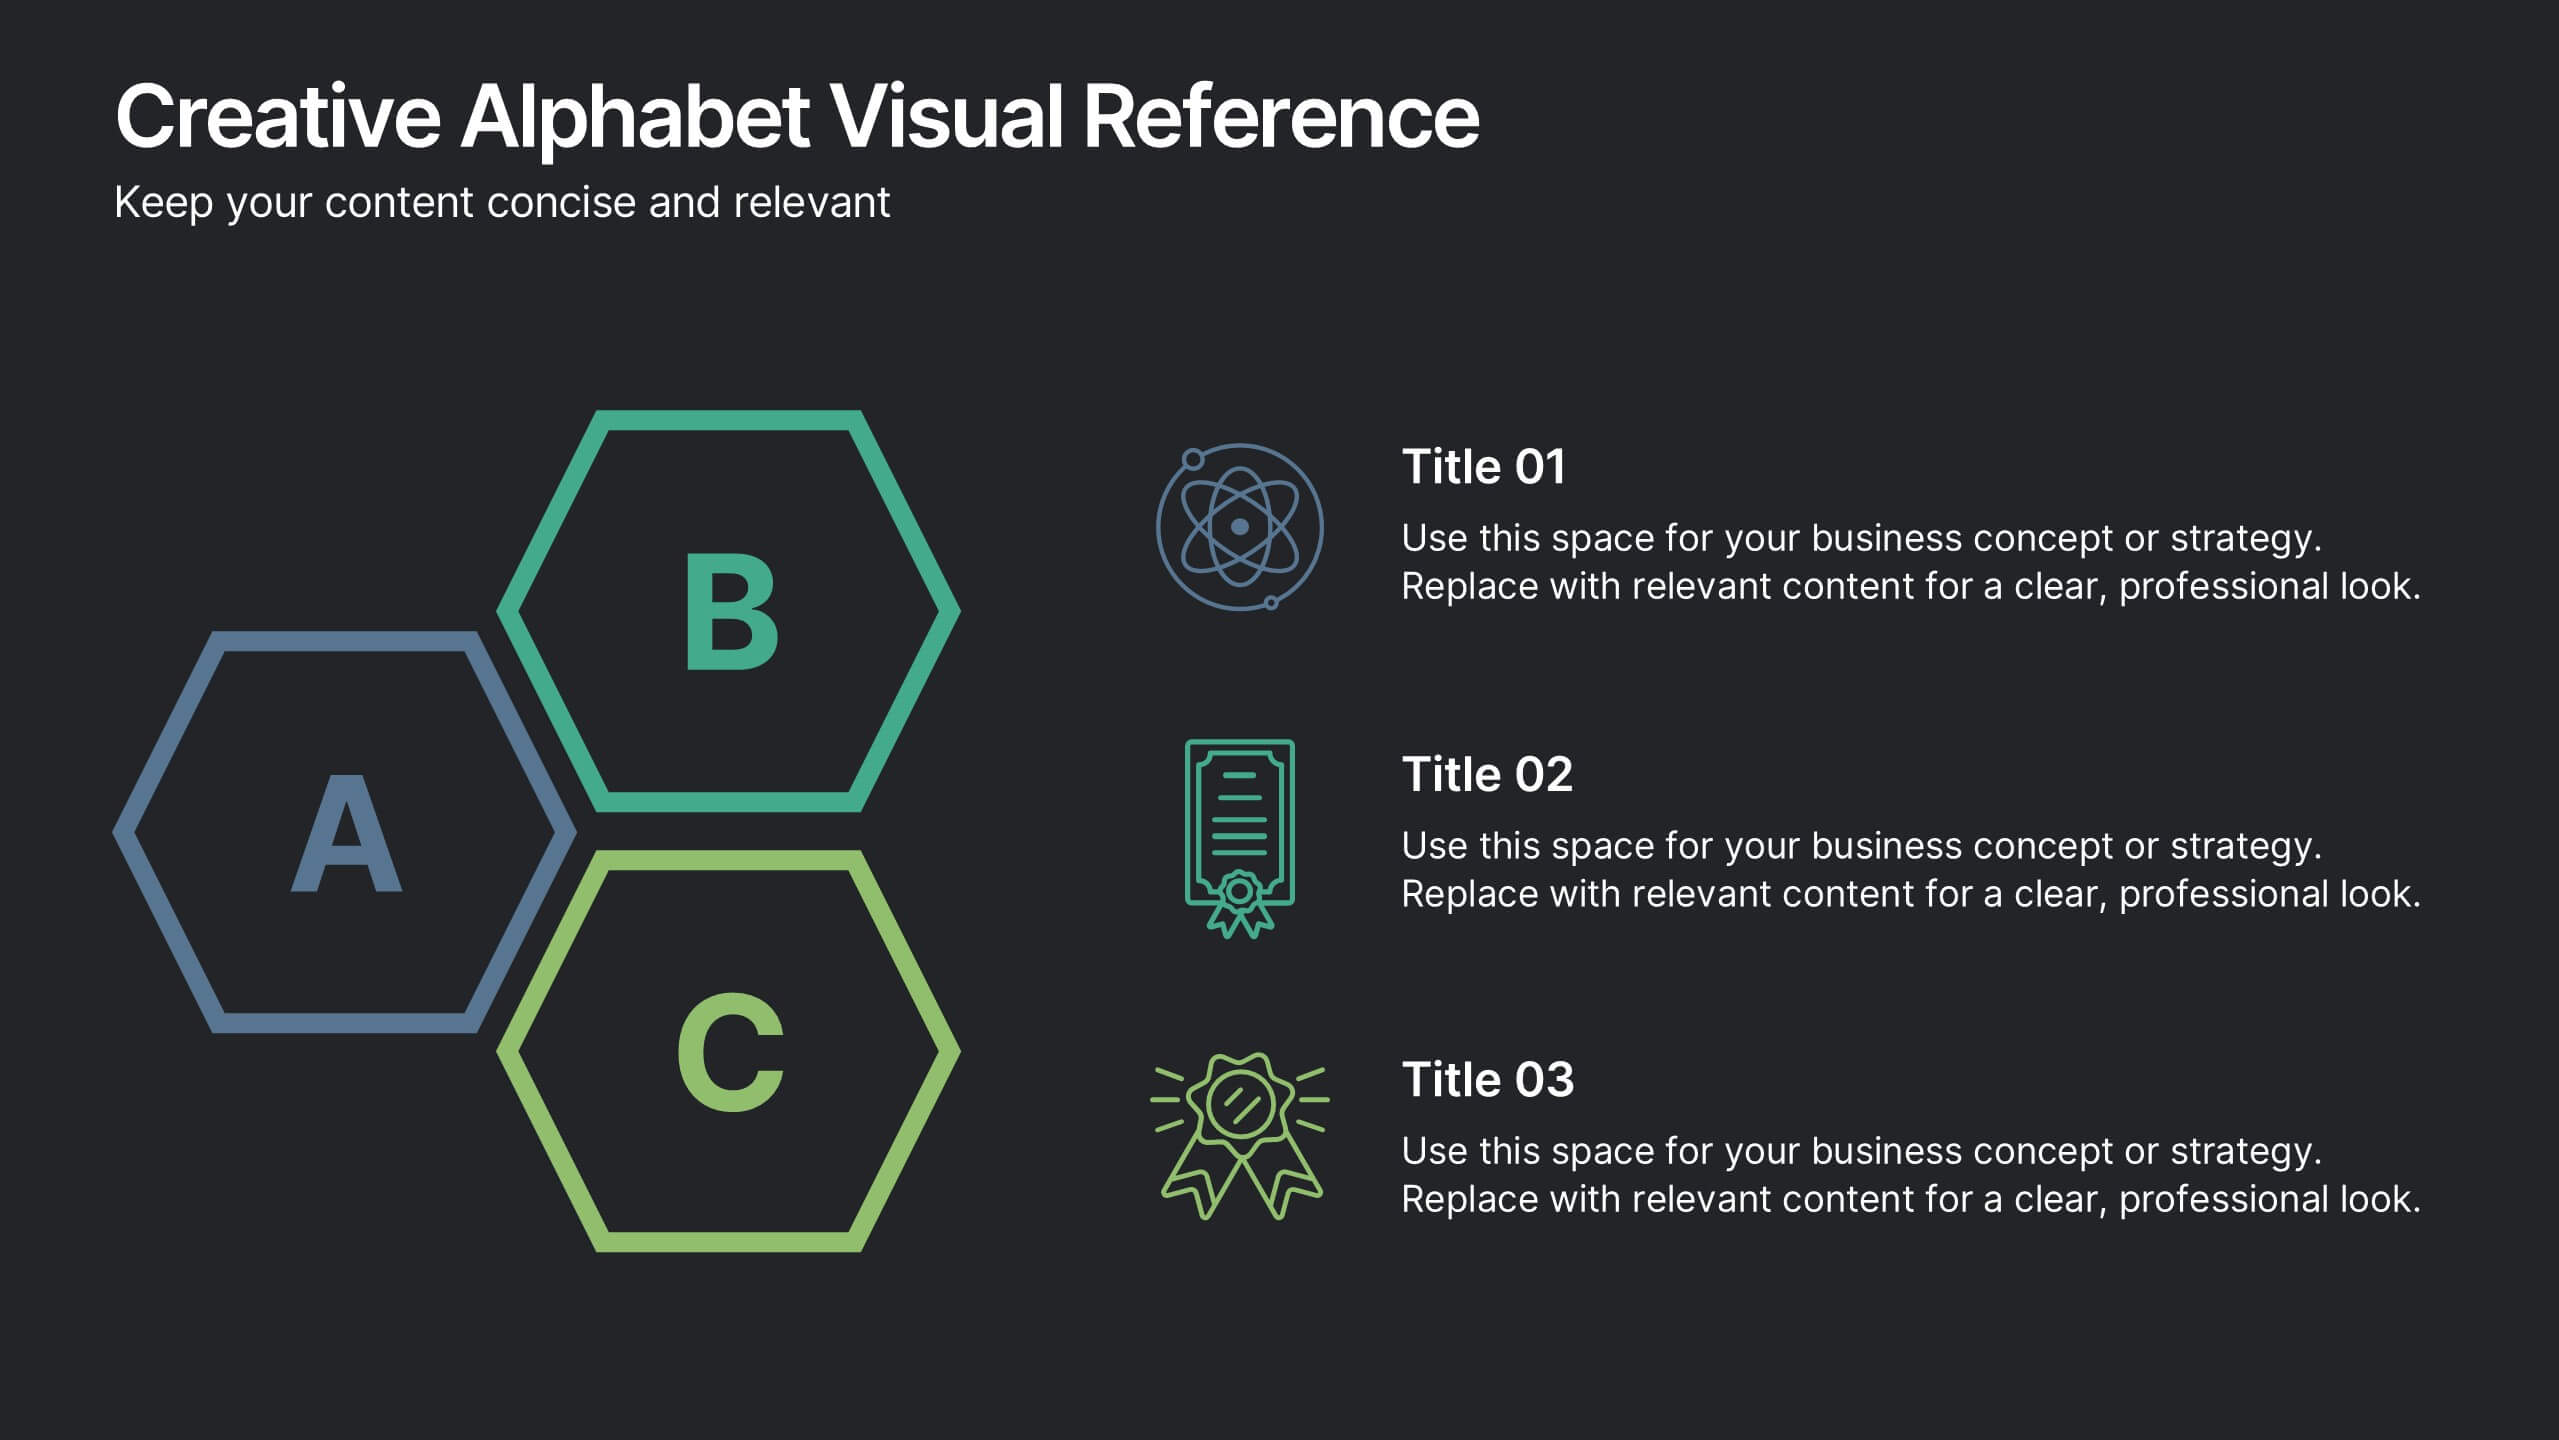
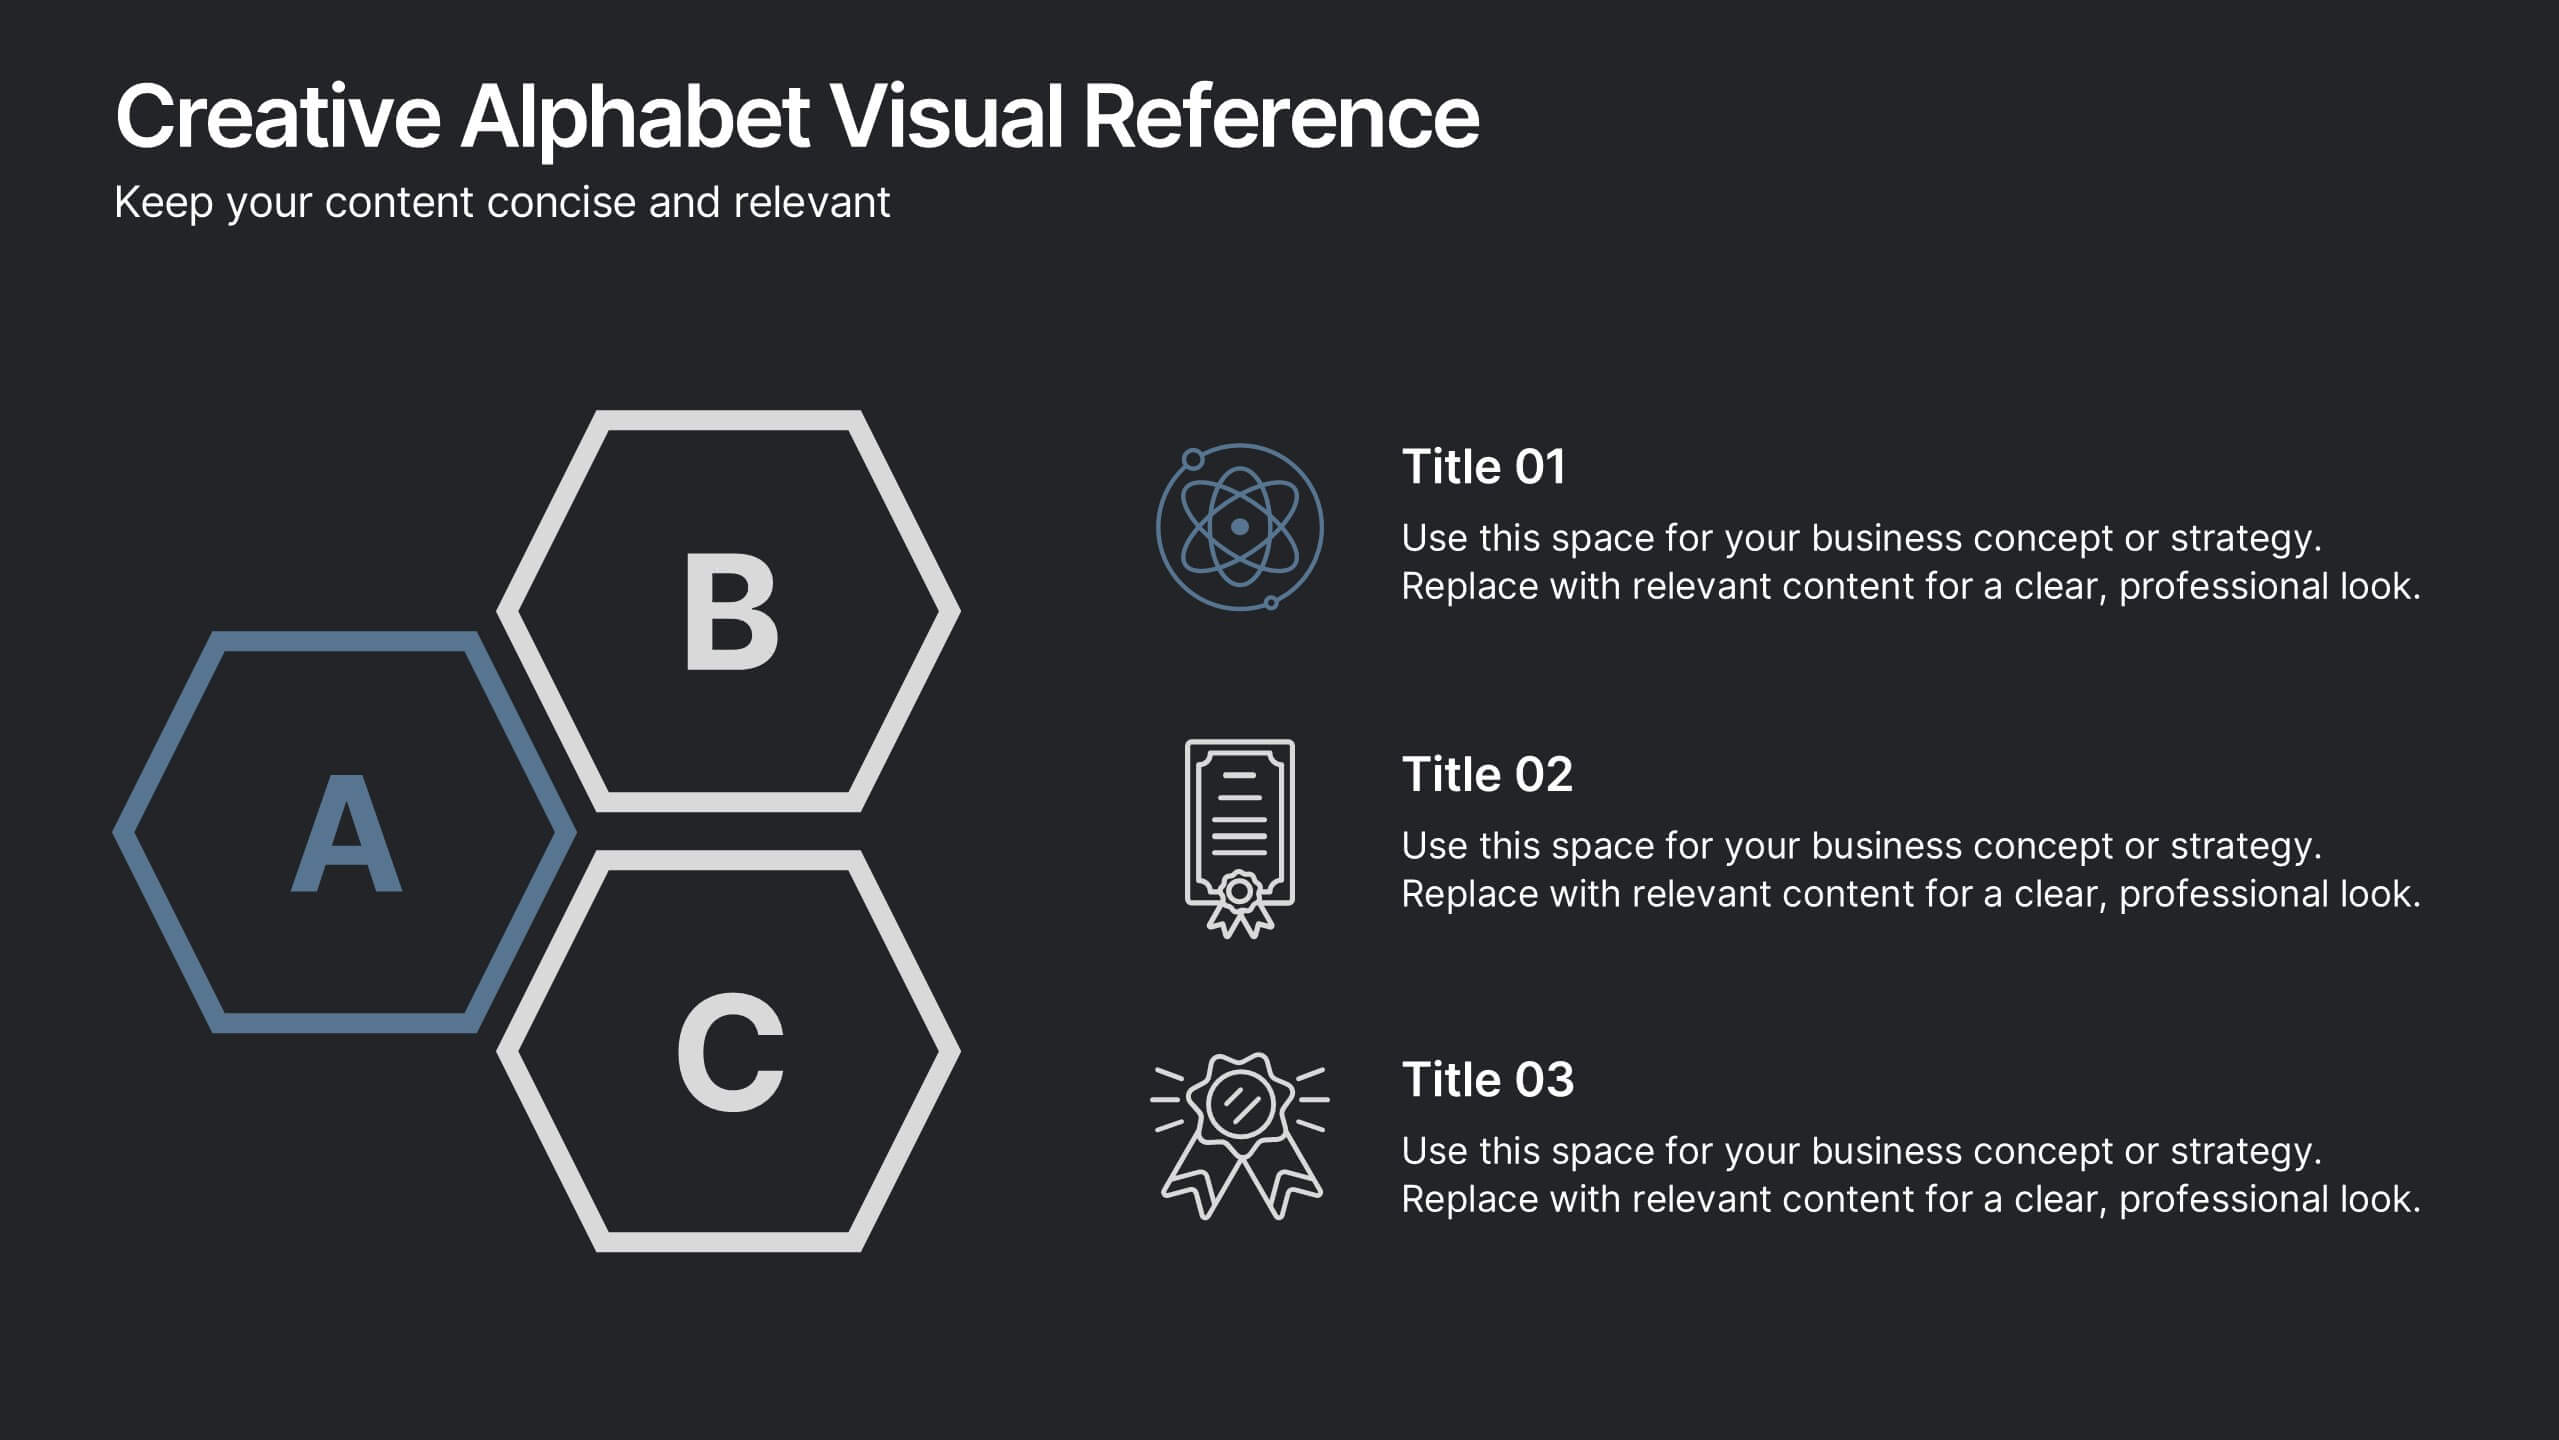
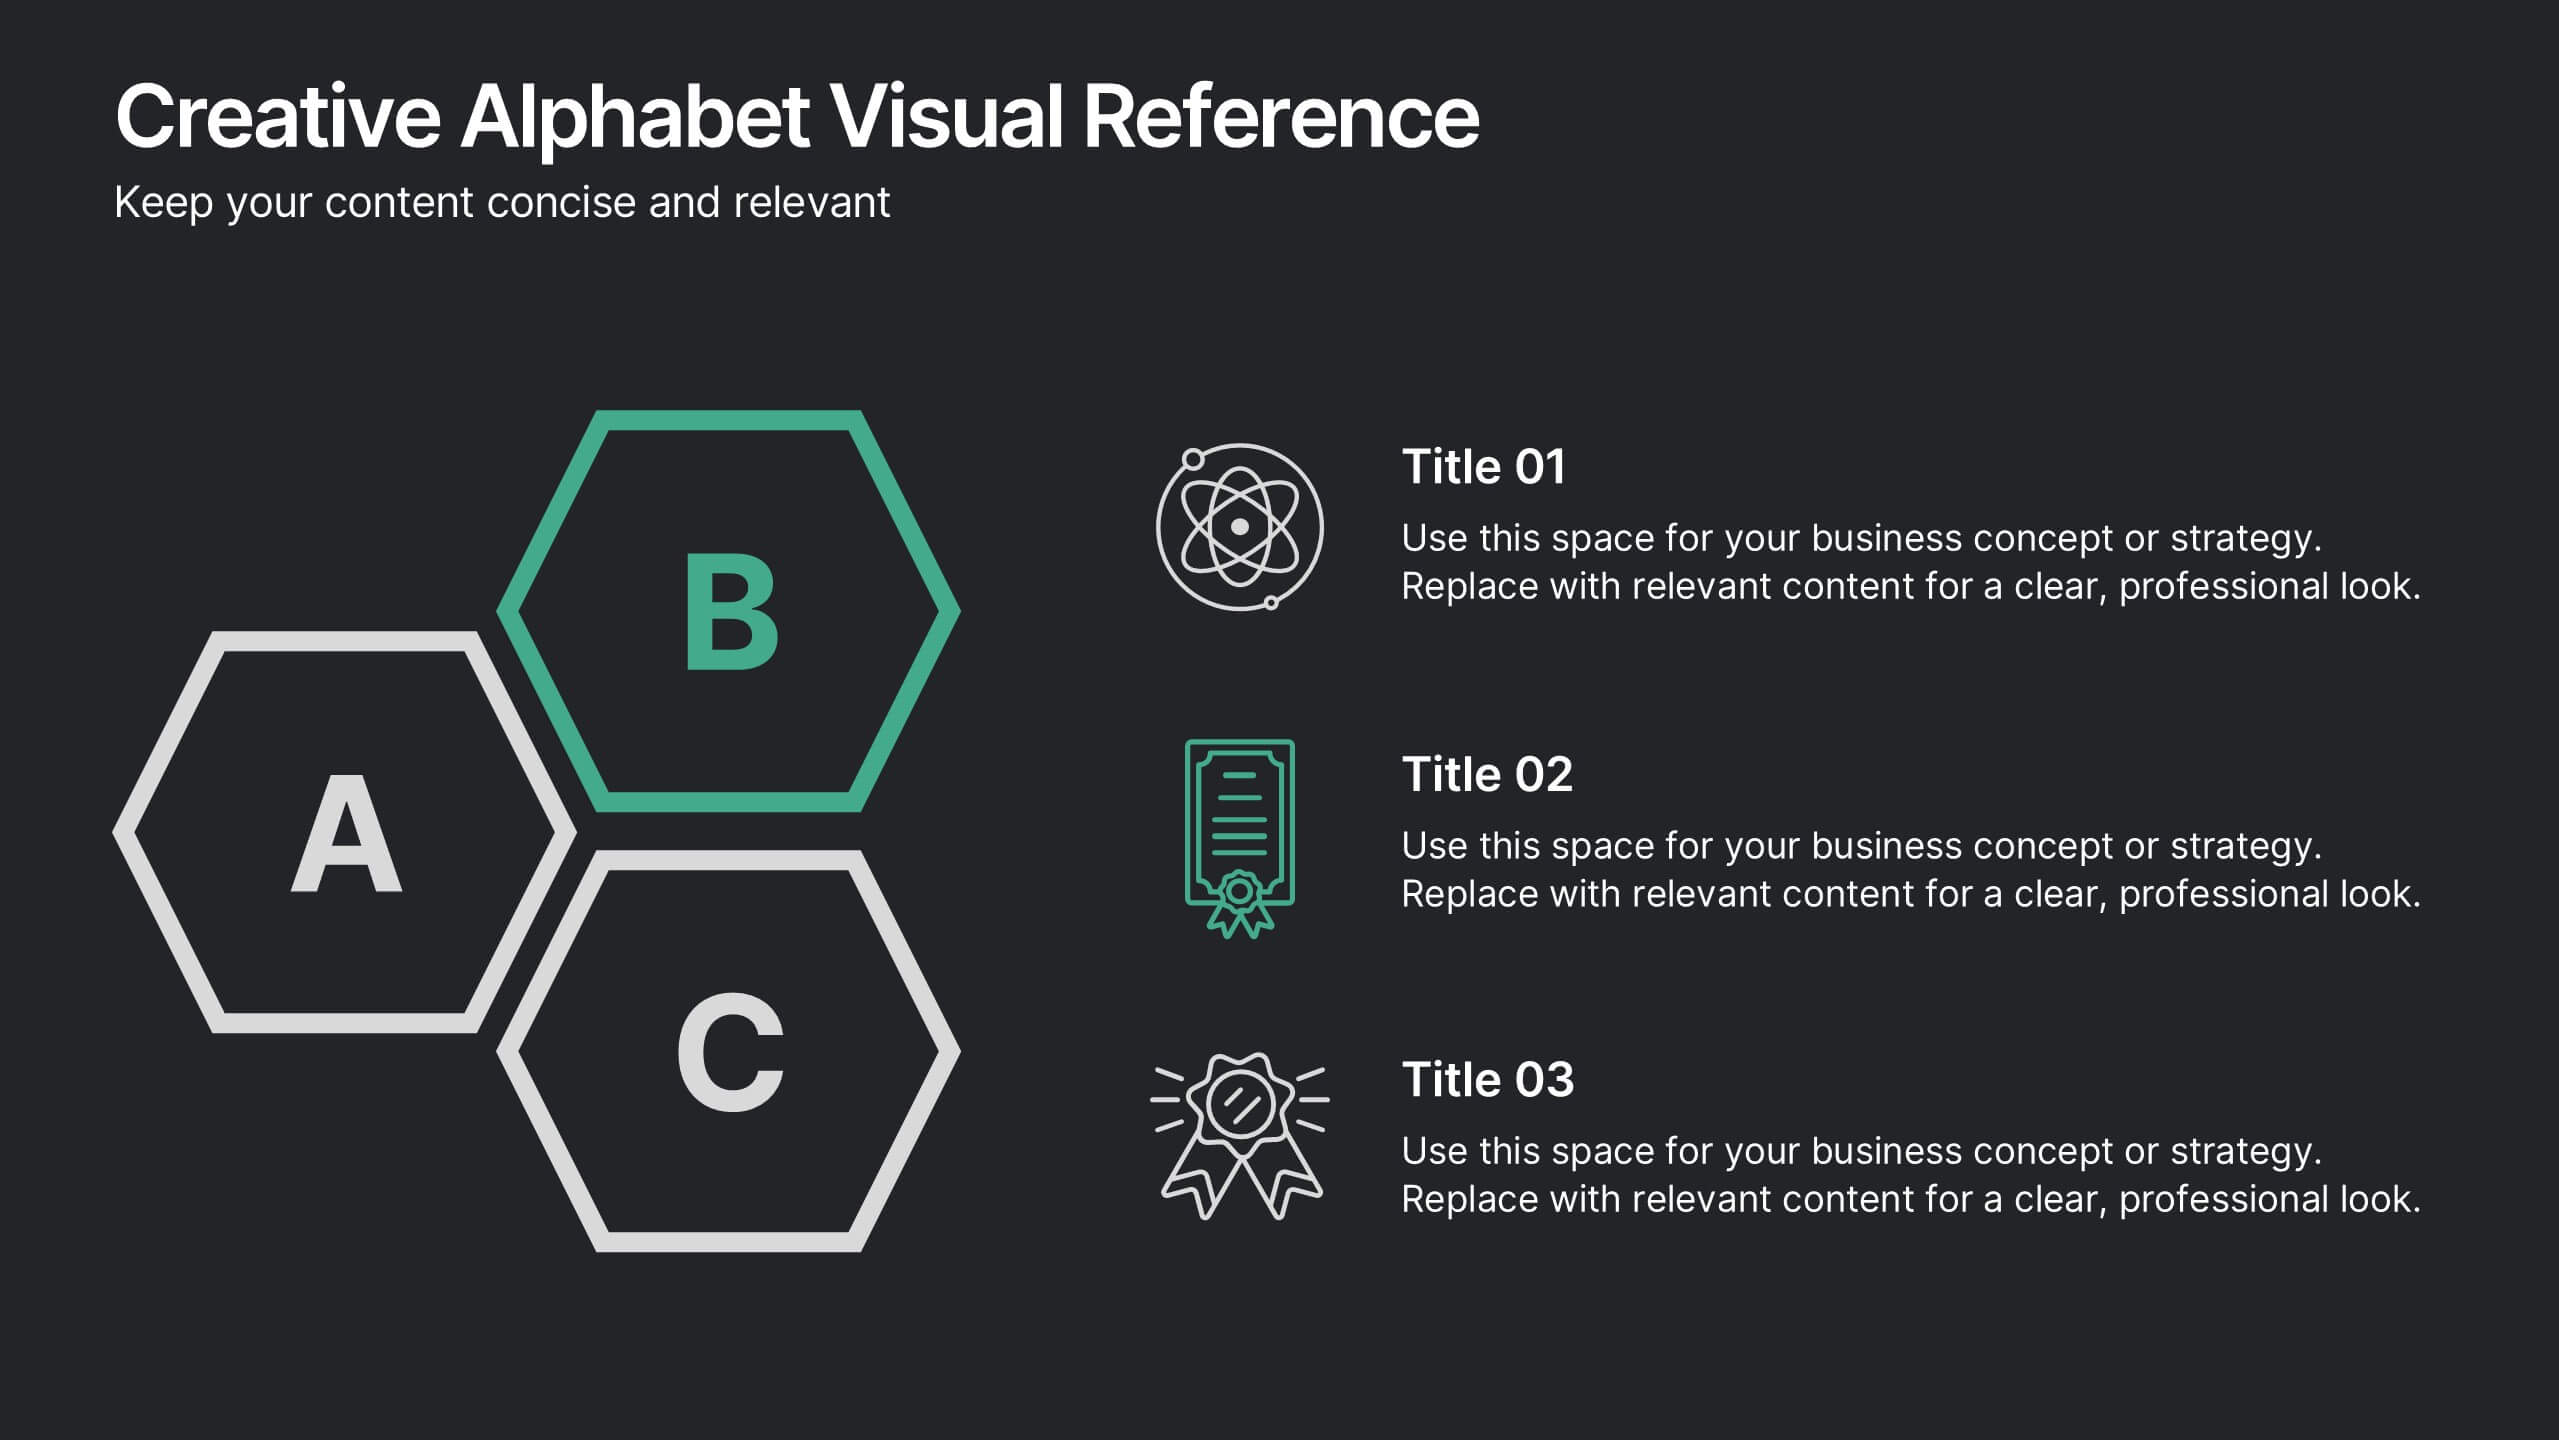
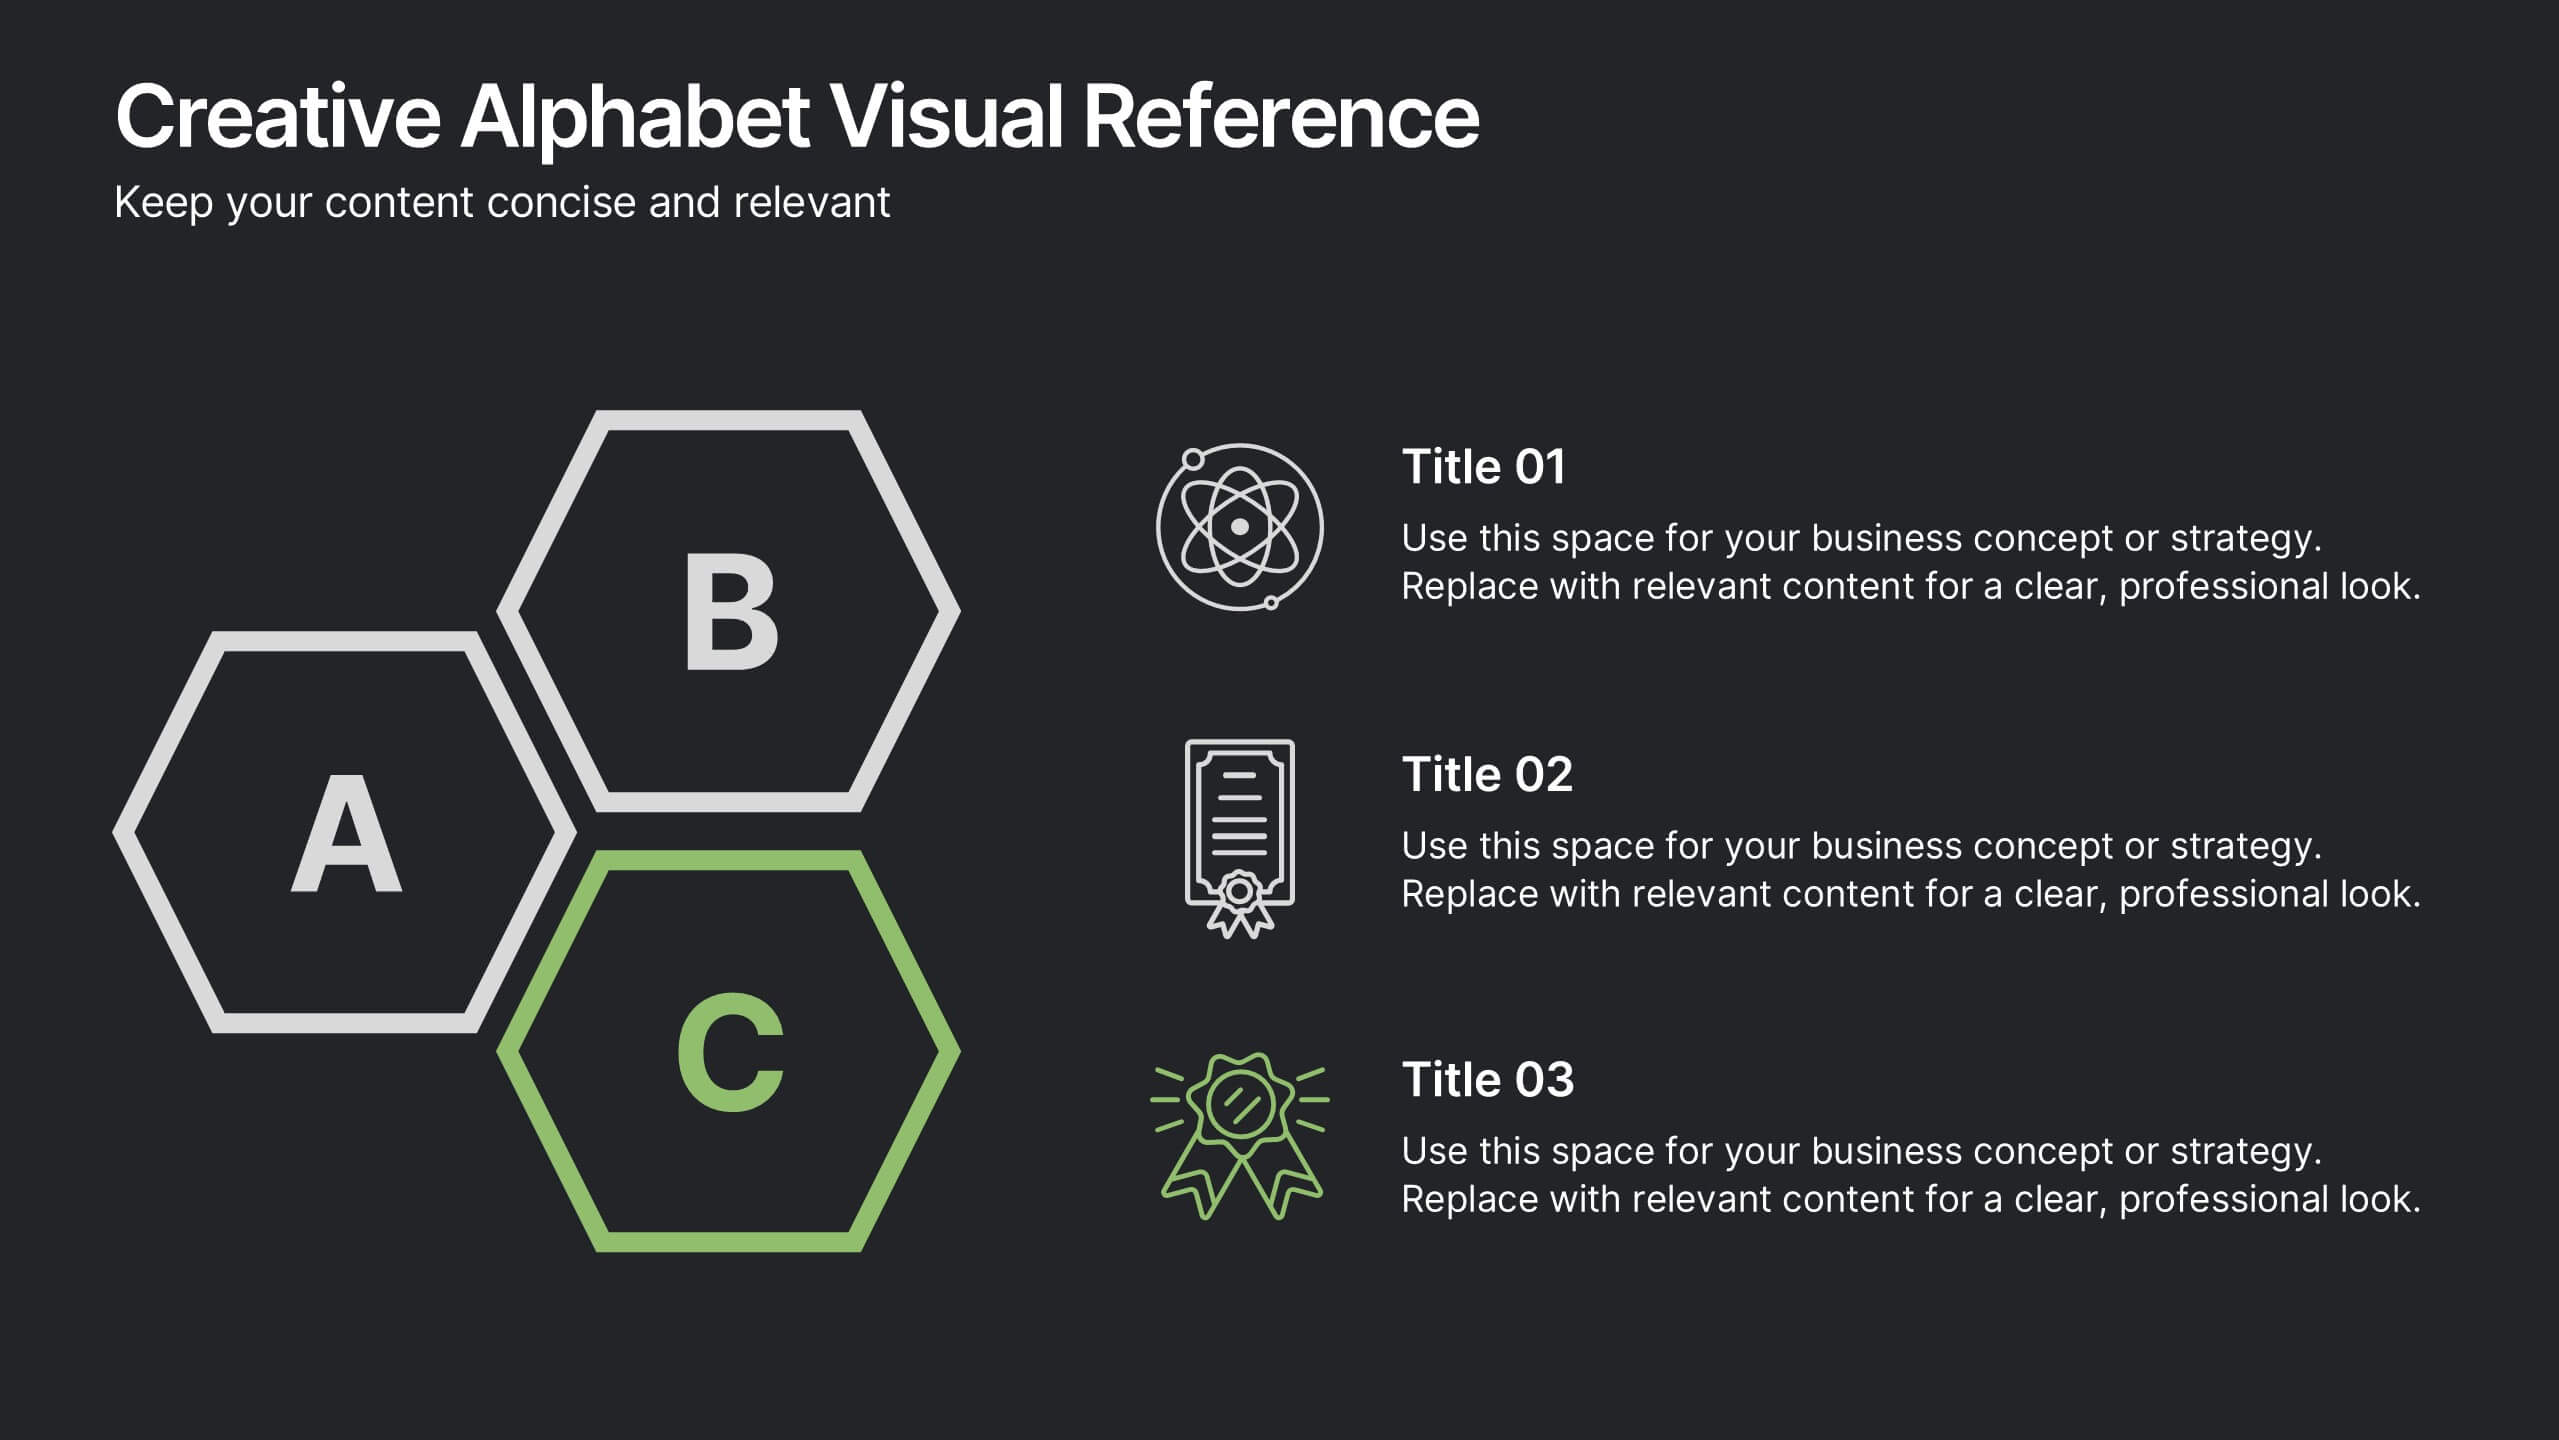
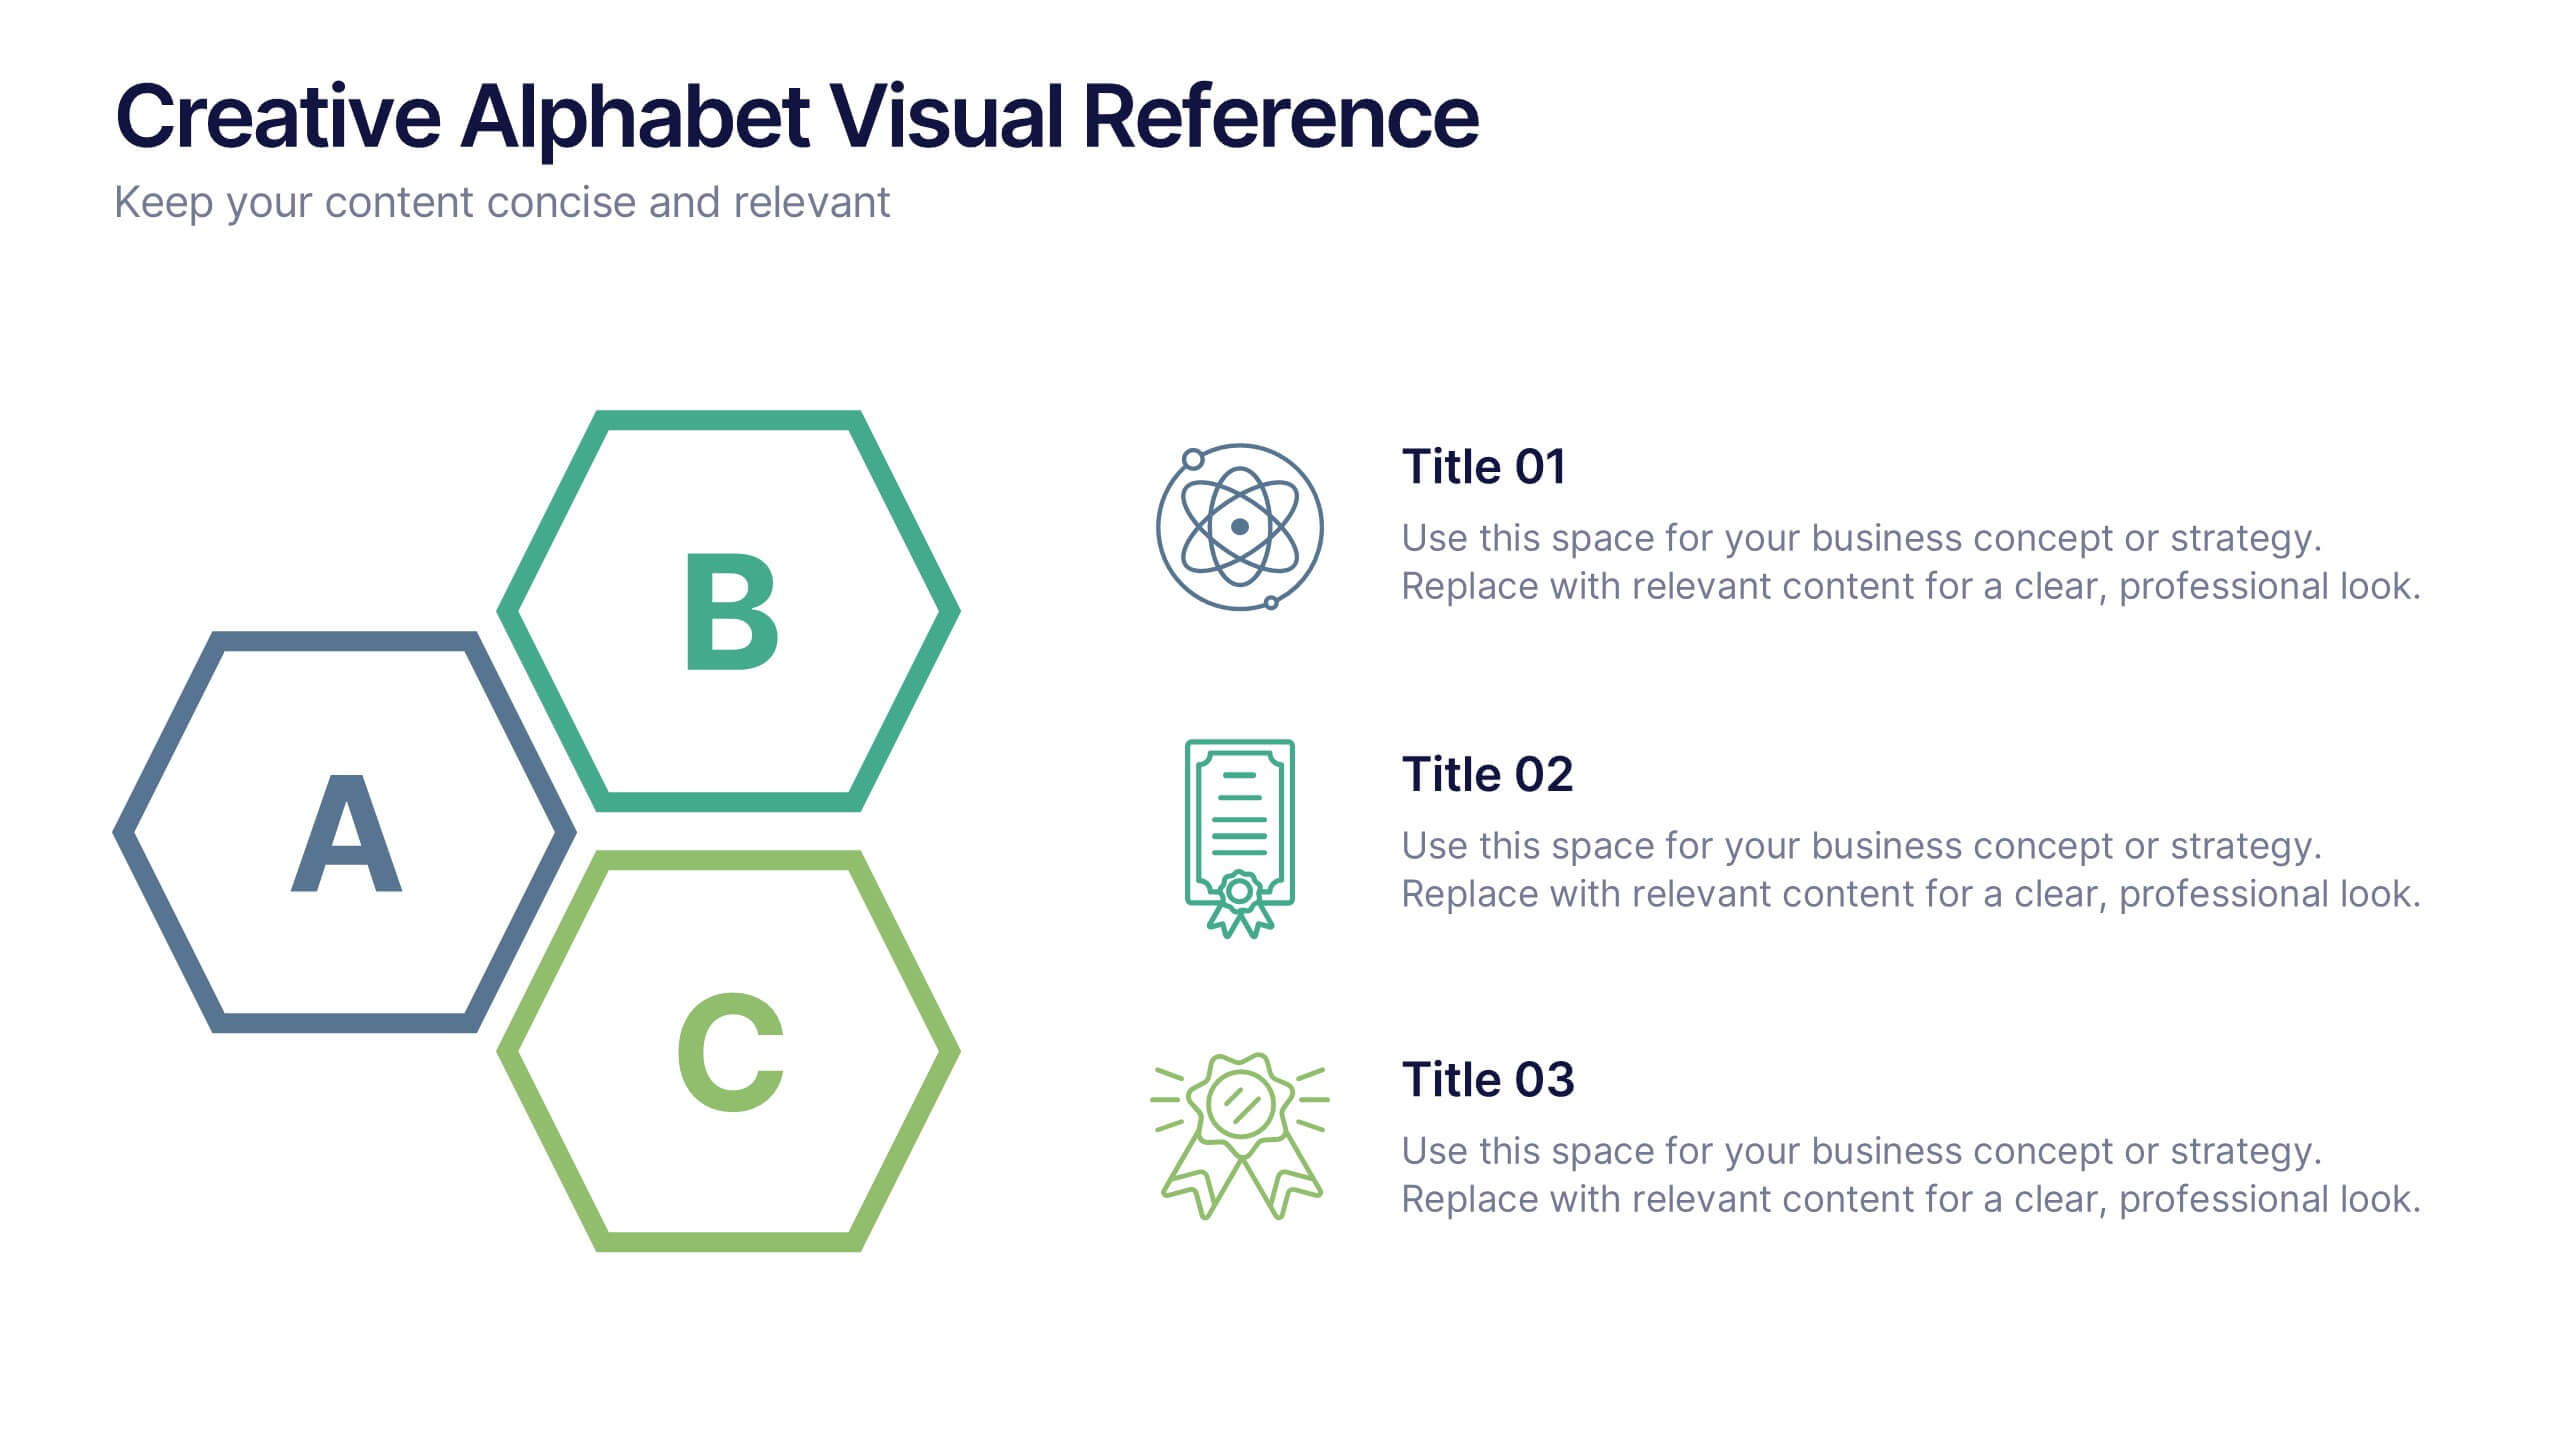
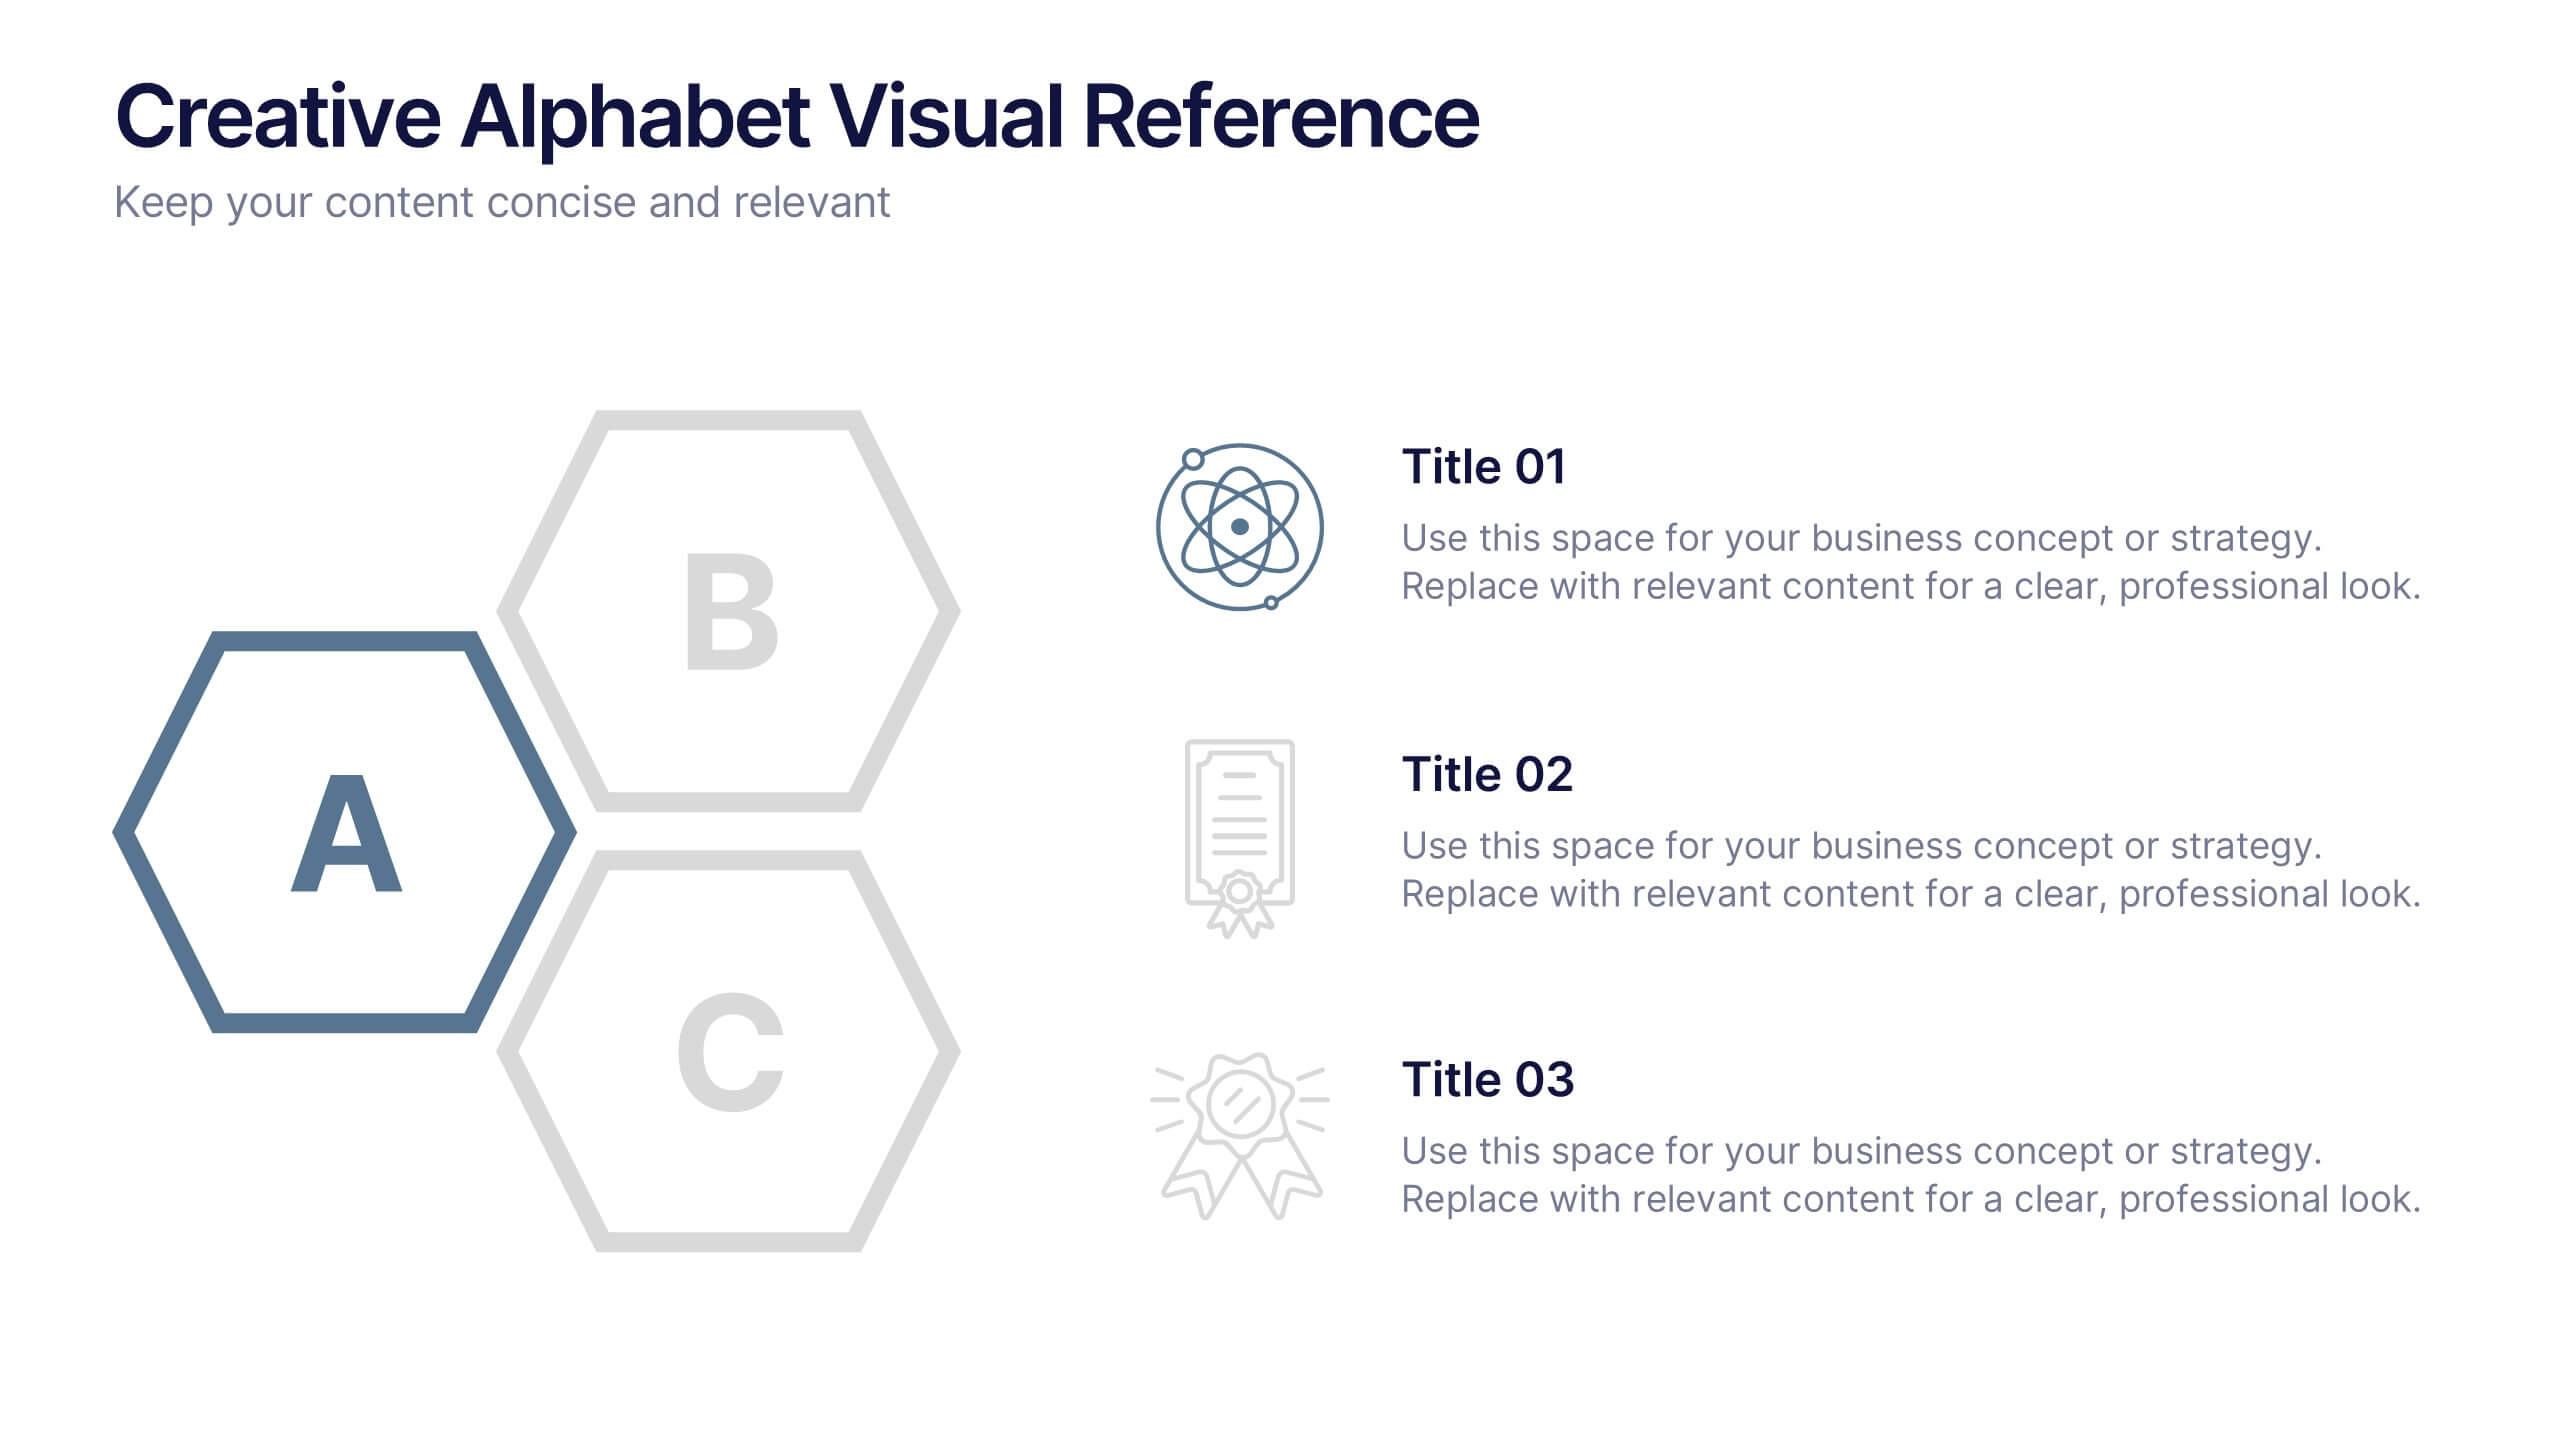
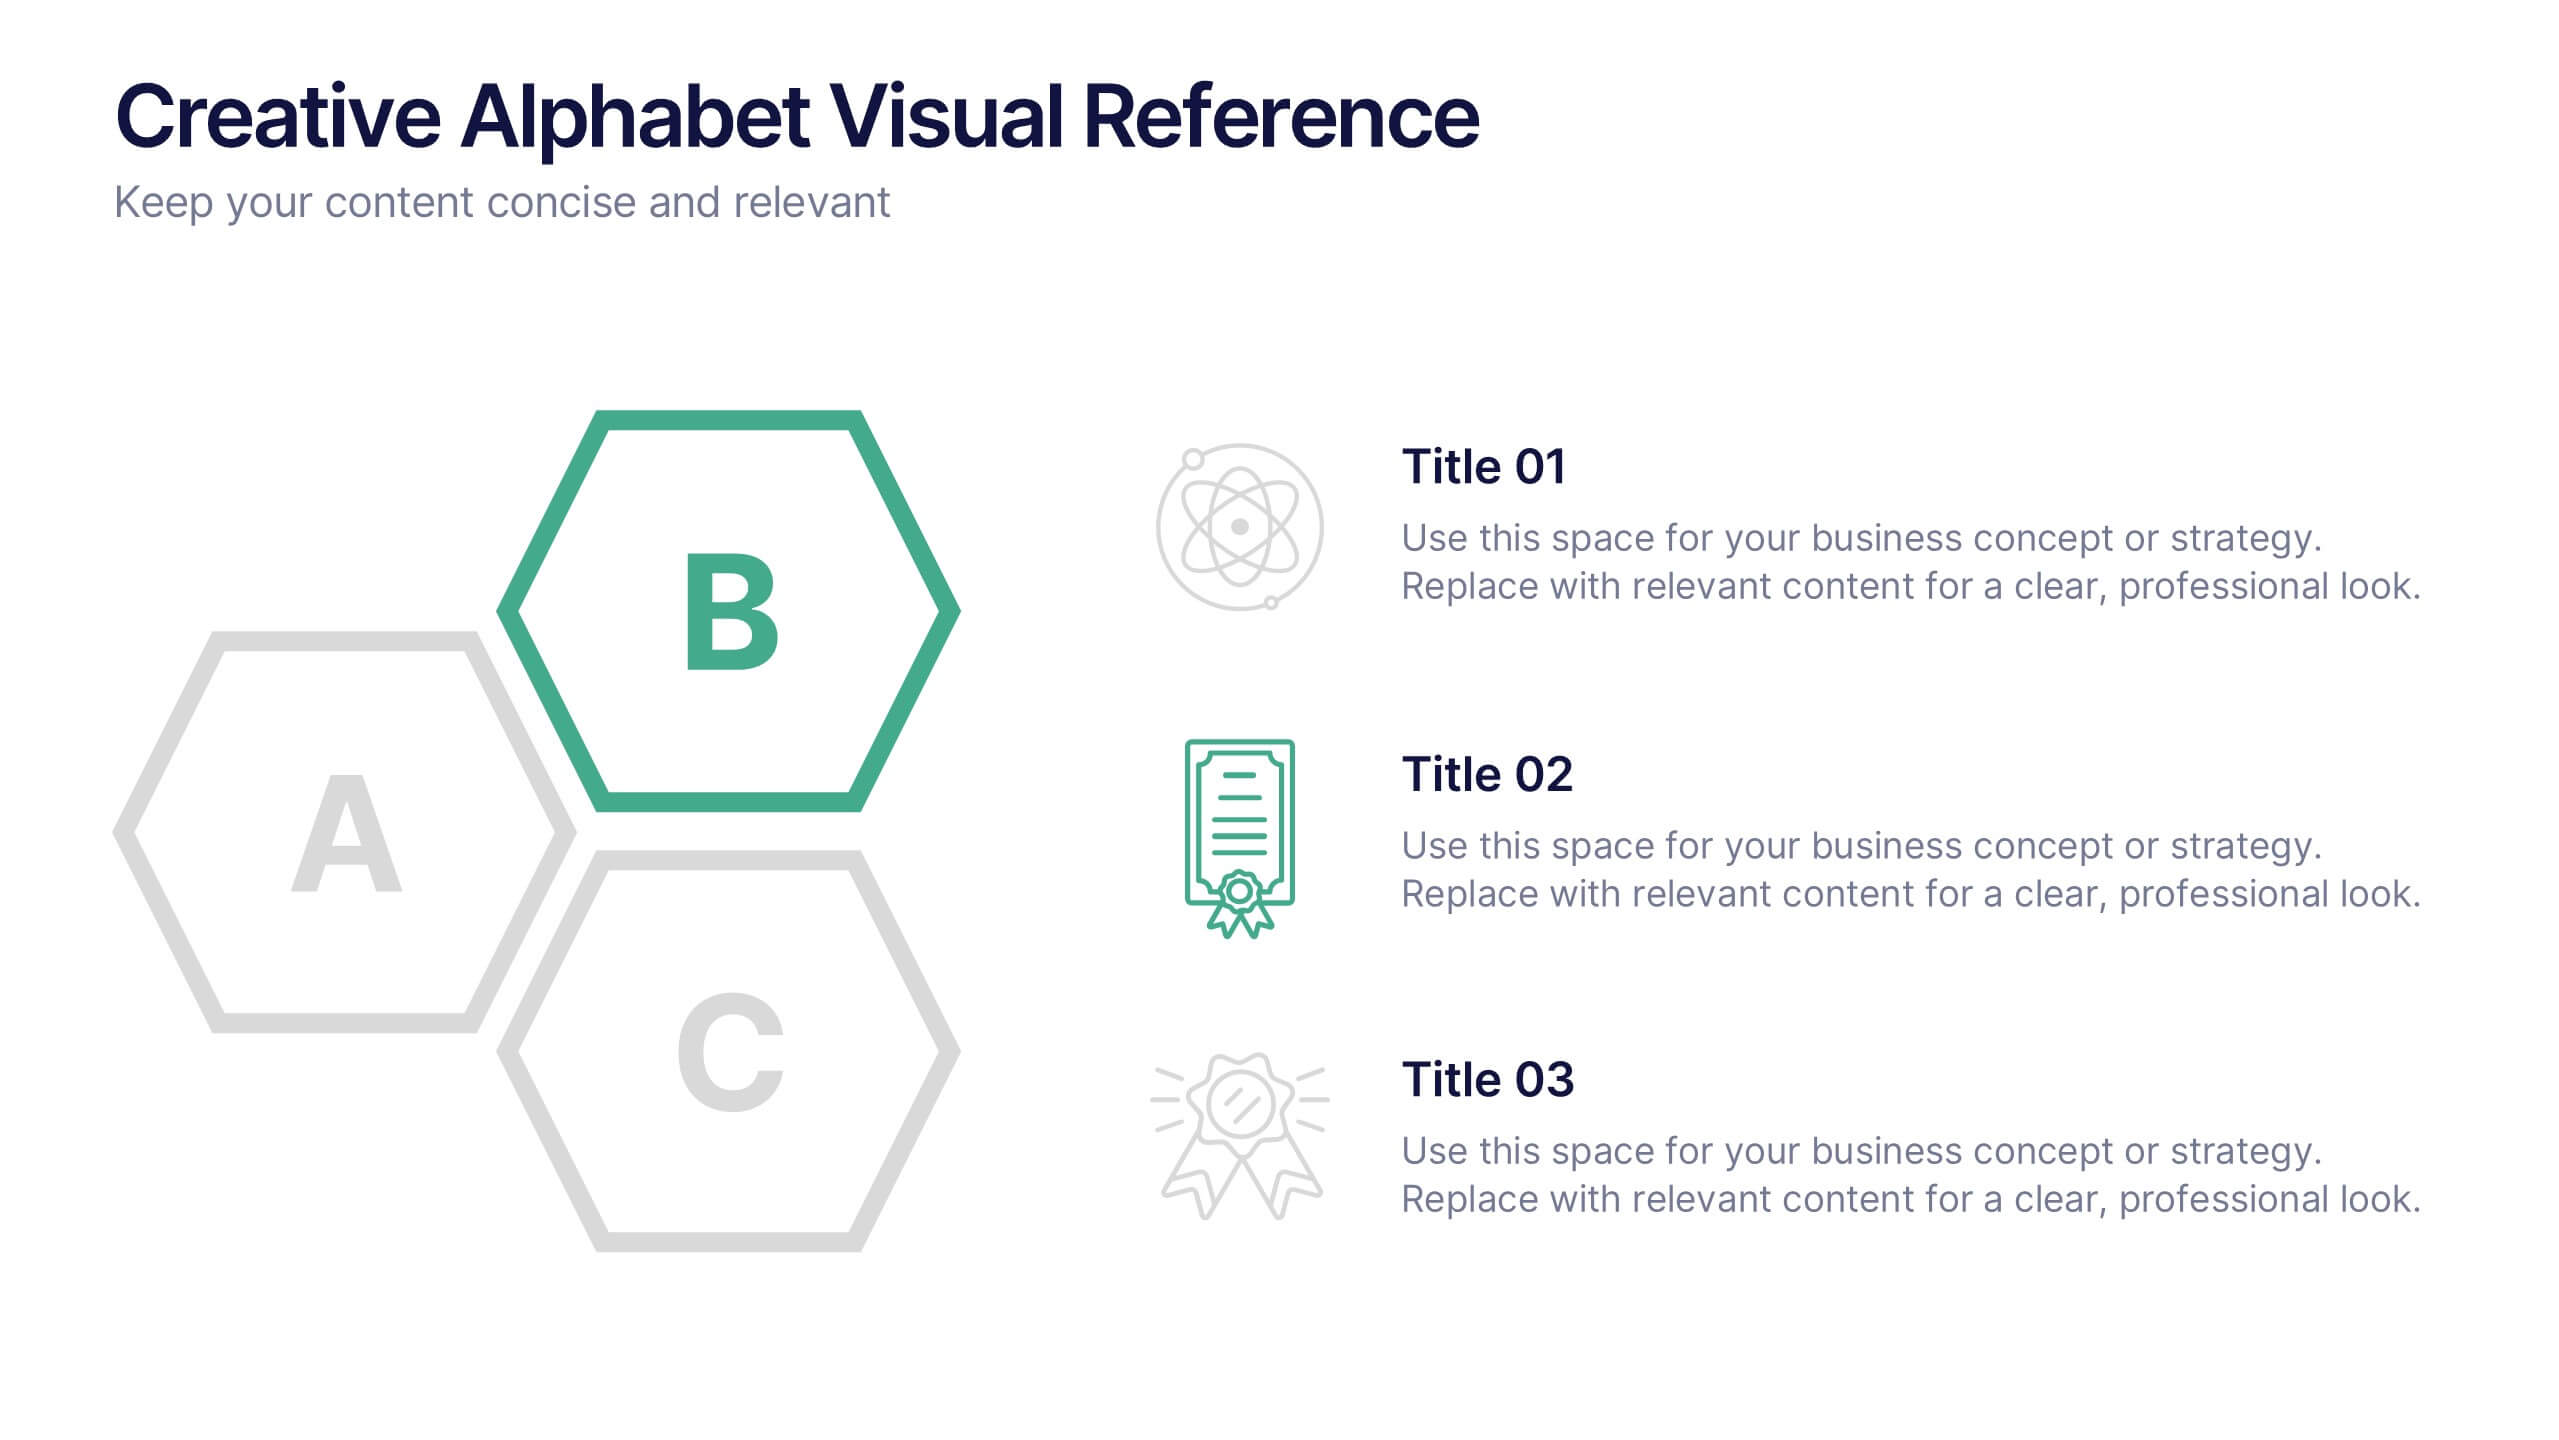
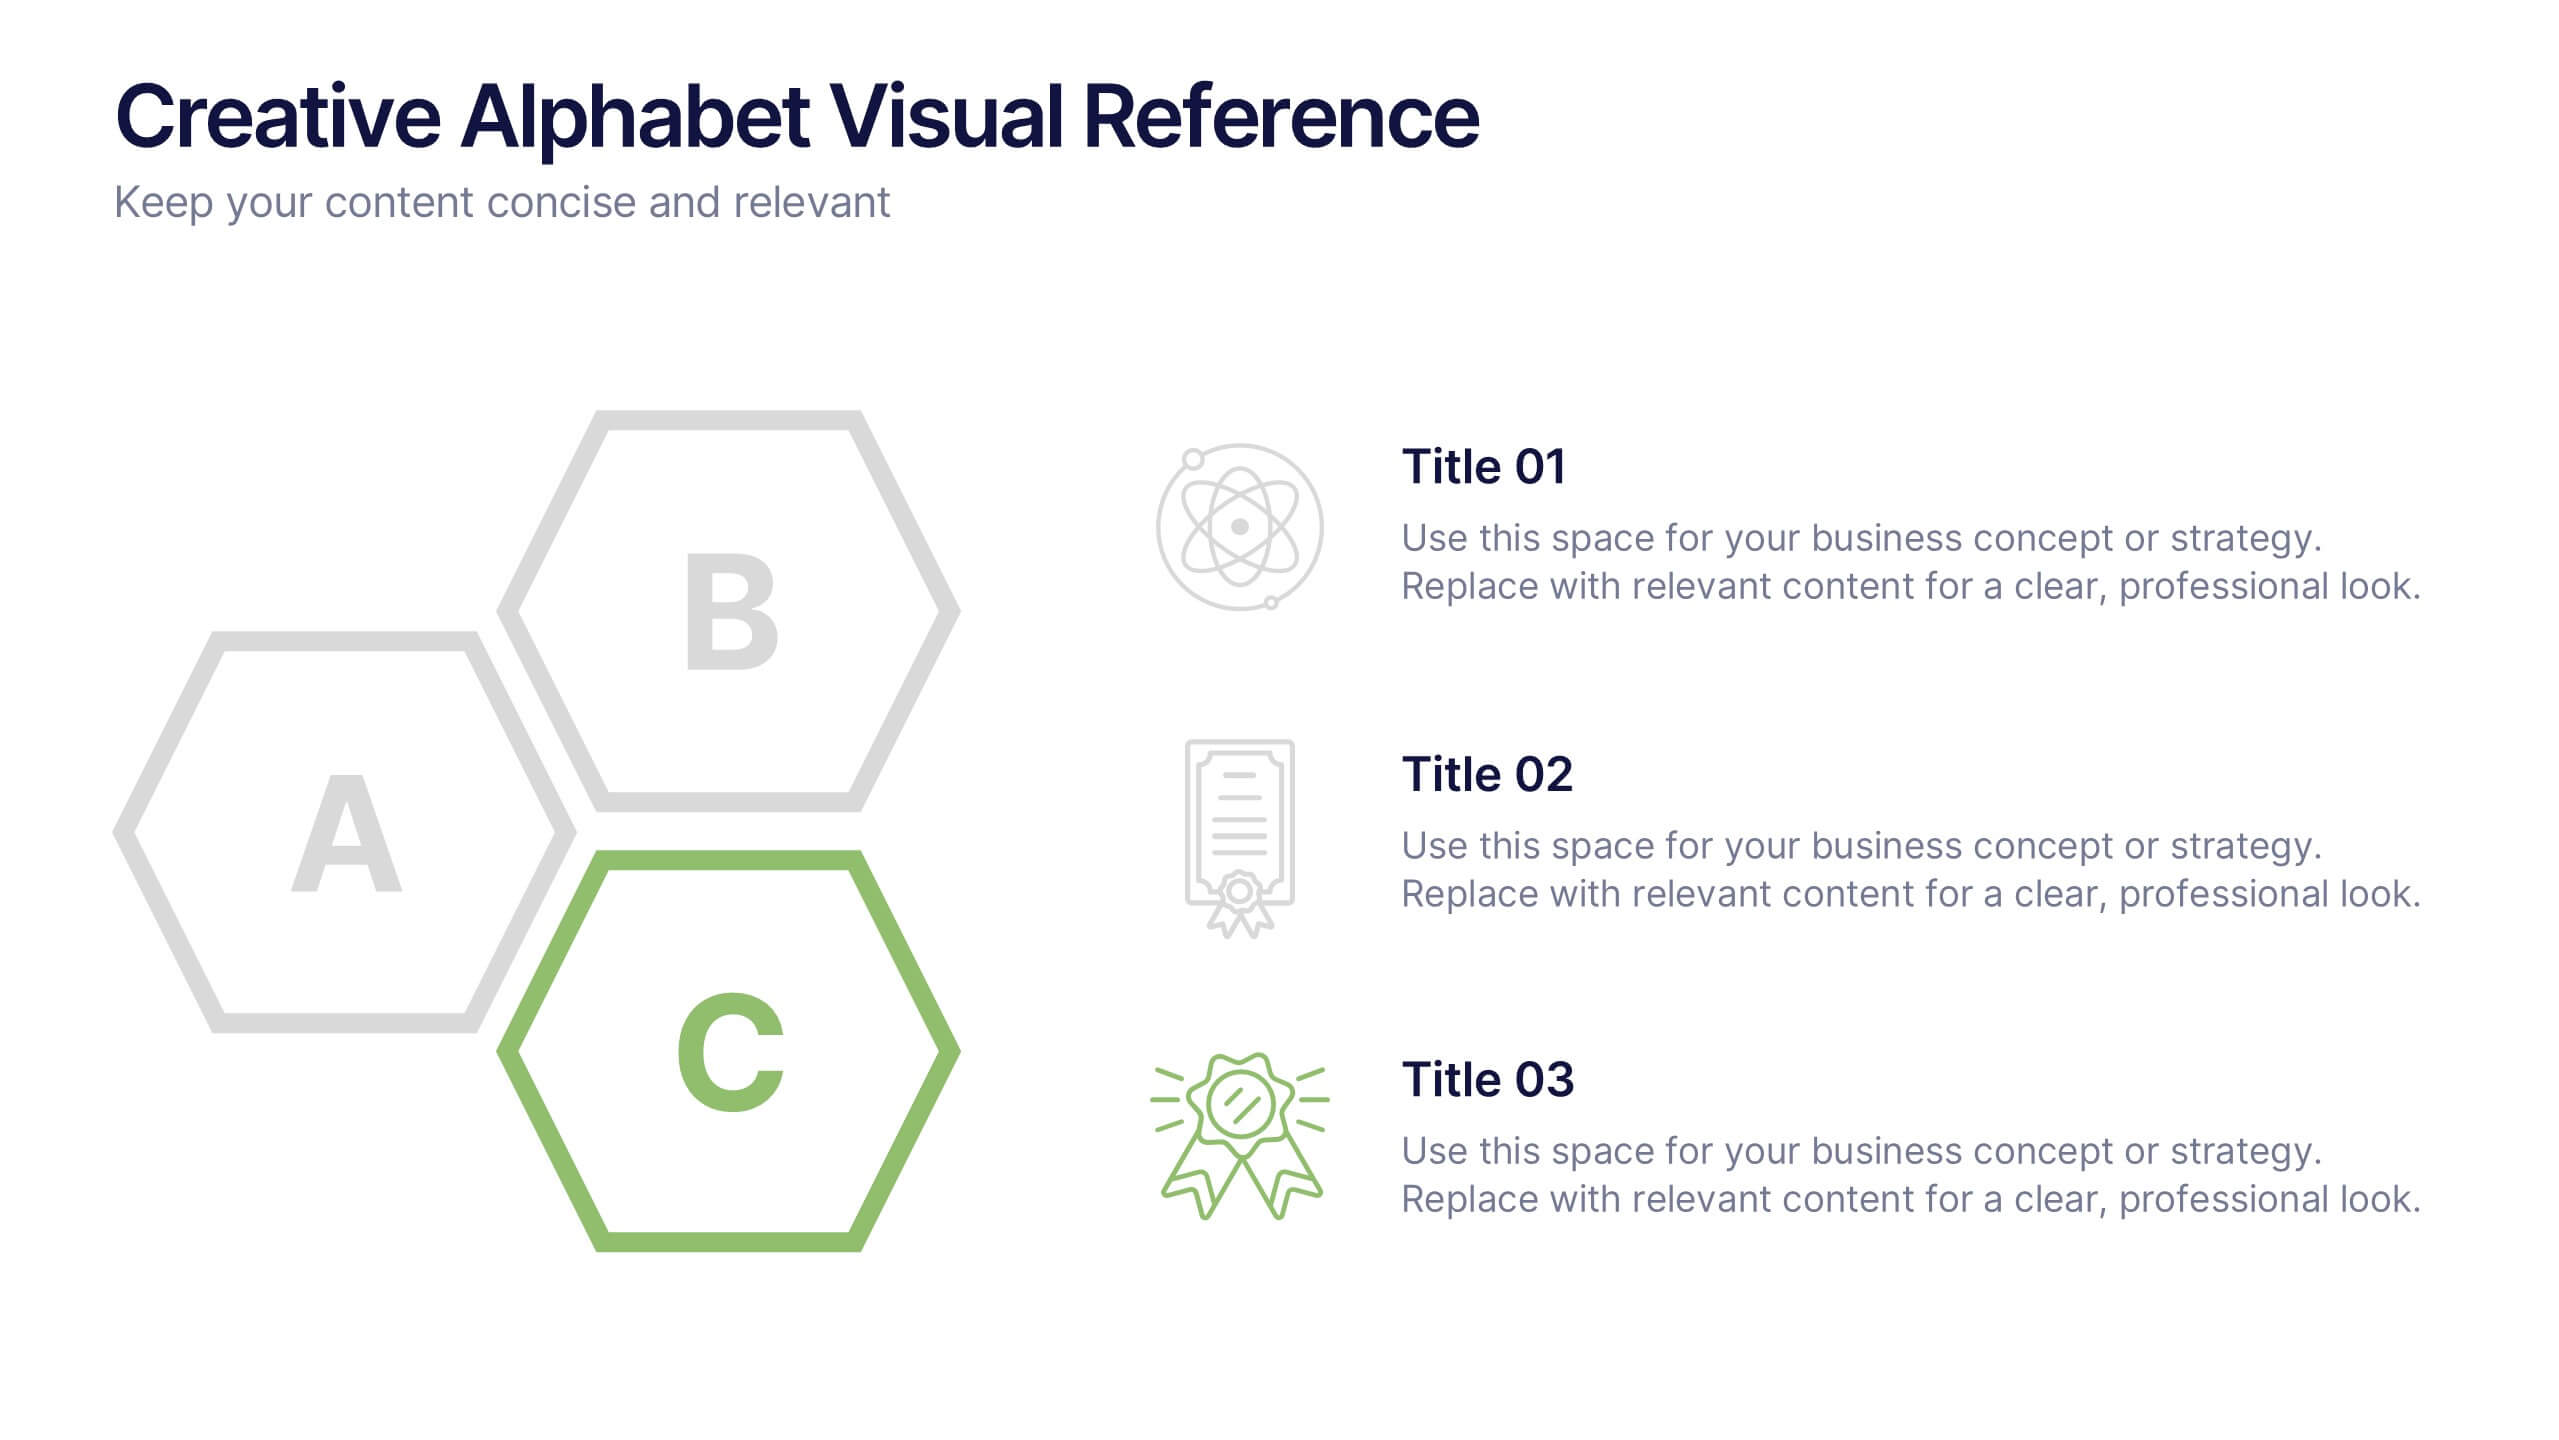
Creative Alphabet Visual Reference Presentation
This creative presentation uses a bold A–B–C visual structure to highlight key points in a clean, modern layout. Ideal for overviews, comparisons, or step-by-step frameworks. Fully customizable in Canva, it balances design and clarity—perfect for business strategies, education, or visual storytelling with strong alphabetical cues and icon integration.


5 slides
Agile and Waterfall PM Models Presentation
Compare two popular project methodologies with ease using the Agile and Waterfall PM Models Presentation. This side-by-side layout highlights key differences in structure, flexibility, and delivery approach—perfect for client briefings, team onboarding, or stakeholder reviews. Fully editable in PowerPoint, Google Slides, Keynote, and Canva for seamless customization.


5 slides
Group Dynamics and Work Roles Presentation
Visualize team roles and responsibilities clearly with the Group Dynamics and Work Roles Presentation. This horizontal timeline layout highlights individual contributions and their position in the workflow, making it ideal for team structure, leadership roles, or project stages. Fully editable in Canva, PowerPoint, or Google Slides for smooth collaboration.


6 slides
Organizational Mind Mapping Slide Presentation
Bright ideas deserve a space to grow, and this presentation turns complex thoughts into a clean, organized visual map. It helps teams outline processes, connect concepts, and structure information with clarity and flow. Perfect for planning or strategy sessions. Fully compatible with PowerPoint, Keynote, and Google Slides.


12 slides
Startup Investor Pitch Deck Presentation
Craft a compelling pitch with this Startup Investor Pitch Deck template. Featuring a structured layout, it helps showcase your startup’s vision, market potential, and financial projections. Designed for clarity and engagement, this template ensures a persuasive investor presentation. Fully compatible with PowerPoint, Keynote, and Google Slides for seamless customization.


4 slides
Types of Insurance Policies Comparison Presentation
Highlight key differences between insurance policies using this shield-themed comparison slide. With space for six categories and clear icon-label pairs, it’s perfect for showcasing coverage types or plan tiers. Fully editable in PowerPoint, Keynote, and Google Slides—ideal for agents, brokers, or internal training on policy features.
5 slides
Business Strategy Arrow Presentation
Enhance your strategic planning with the Business Strategy Arrow Presentation. This visually structured template guides your audience through a step-by-step progression, making it ideal for business roadmaps, strategic plans, and goal-oriented workflows. Easily customize the colors, text, and icons to align with your brand. Fully compatible with PowerPoint, Keynote, and Google Slides for effortless editing and professional presentations.